
Article

Seasonal and Spatial Distribution of Microplastics in the Can Tho River (Mekong Delta, Vietnam): Occurrence and Characteristics

1
College of Environment and Natural Resources, Can Tho University, 3/2 Street, Ninh Kieu Ward, Can Tho 94000, Vietnam
2
Faculty of Fisheries Management and Economics, College of Aquaculture and Fisheries, Can Tho University, 3/2 Street, Ninh Kieu Ward, Can Tho 94000, Vietnam
3
Institute for Global Environmental Strategies, Hayama 240-0115, Japan
*
Author to whom correspondence should be addressed.
Microplastics 2026, 5(3), 136; https://doi.org/10.3390/microplastics5030136
Submission received: 20 May 2026 / Revised: 18 June 2026 / Accepted: 30 June 2026 / Published: 4 July 2026

Abstract

Microplastic pollution in tropical urban rivers has become an increasing environmental concern due to rapid urbanization, inadequate waste management, and hydrological transport processes. This study investigated the occurrence, characteristics, and spatiotemporal distribution of microplastics in the Can Tho River, Vietnam, along an urban–peri-urban–rural gradient during dry and wet seasons. Surface-water samples were collected at 15 sites and analyzed for microplastic abundance, density, shape, color, and size composition using stereomicroscopic identification and statistical analyses. Microplastics were detected at all sampling sites in both seasons, indicating widespread contamination throughout the river system. Although seasonal differences in overall abundance and density were not statistically significant at the basin scale, clear spatial variability was observed, particularly in urban and peri-urban regions. Fibers and fragments were the dominant shapes, while blue, purple, and green particles were the most common color categories. Particles larger than 1000 µm accounted for the largest proportion of detected microplastics, and continuous size-distribution analysis revealed broadly similar overall distributions, although a greater proportion of smaller particles was observed during the dry season. The results suggest that hydrological conditions, urbanization, and land-use characteristics may contribute to the observed spatial and seasonal patterns of microplastic distribution in the Can Tho River. Peri-urban zones exhibited the greatest seasonal variability, highlighting their role as transitional areas that may influence microplastic redistribution in tropical river systems. This study provides baseline information for understanding microplastic pollution in the Mekong Delta and supports future river management strategies.

1. Introduction

Global plastic production has grown rapidly over recent decades, reaching approximately 380 million tonnes in 2015 and exceeding 430 million tonnes in 2024 [1,2]. At the same time, a significant share of plastic waste has accumulated in landfills and the natural environment due to inadequate end-of-life management [1]. Larger plastic debris can fragment into microplastics (typically < 5 mm) through physical, chemical, and biological processes. These particles are persistent and have been widely detected across marine and freshwater environments [3,4,5]. Recent evidence suggests that, in addition to conventional degradation pathways such as photodegradation and mechanical fragmentation, intrinsic material properties may also contribute to the generation of polymer-derived micropollutants. Residual stress-induced phase separation within plastic materials has been shown to release amorphous polymer micropollutants into water, highlighting the complexity of plastic weathering processes and the continuous generation of micro-scale polymer contaminants in aquatic environments [6].
Rivers act as major pathways for the transport of plastic debris, transferring significant quantities of land-based waste into the oceans [7,8]. At the same time, river systems can retain microplastics within freshwater environments, where they are distributed across the water column, sediments, and aquatic organisms [9]. This dual role raises ecological concerns, as microplastics can be ingested by aquatic organisms and facilitate the transfer of hazardous contaminants, including heavy metals and persistent organic pollutants [10,11].
The occurrence and distribution of microplastics in freshwater environments are influenced by a combination of anthropogenic and environmental factors. Urbanization, population density, wastewater effluent, and land-use characteristics have been identified as key factors association with microplastic inputs into river systems [12,13]. In addition, hydrological variability plays a critical role in microplastic transport and fate. During wet periods, increased precipitation and river discharge enhance the mobilization, remobilization, and downstream transport of plastic debris, whereas reduced flow conditions during dry periods promote local retention and accumulation within riverine and estuarine systems [14,15,16]. Despite increasing evidence of the occurrence, transport, and ecological risks of microplastics in aquatic environments, significant challenges remain regarding the standardization of monitoring methodologies and the development of harmonized regulatory frameworks for microplastic pollution management at both national and international levels [17].
Recent studies across Asia have consistently reported the widespread occurrence of microplastics in riverine systems, with fibers and fragments emerging as the predominant morphotypes across diverse freshwater environments [18,19,20]. These morphotypes are typically associated with key anthropogenic sources, including synthetic textile fibers released during laundering, the degradation of packaging materials, and the fragmentation of larger plastic debris in the environment [21,22]. Furthermore, color characteristics are commonly employed as indicators to infer both the potential sources and the extent of weathering and environmental exposure of microplastics in aquatic systems [23].
The Mekong Delta is recognized as a highly vulnerable region, where rapid urbanization, dense population, and rising plastic consumption interact with insufficient waste management infrastructure, exacerbating plastic pollution risks [24]. While microplastics have been reported across diverse aquatic environments in Vietnam, including freshwater and coastal systems [25], research efforts have predominantly focused on marine environments [26]. Moreover, existing studies are largely restricted to specific locations, particularly the northern branches of the Mekong River [27,28]. As a result, there remains a significant lack of comprehensive data on microplastic pollution in inland freshwater river systems, especially across urban–rural gradients.
The Can Tho River, a major tributary of the Mekong River, traverses a gradient of urban, transitional, and rural landscapes and is exposed to diverse anthropogenic pressures, including domestic wastewater discharge, urban runoff, and agricultural activities. Despite its environmental and socio-economic importance, comprehensive assessments of microplastic occurrence, characteristics, and spatiotemporal variability in this river system remain limited.
Therefore, this study aims to (i) quantify the abundance and density of microplastics, (ii) characterize their morphological features (e.g., shape, size, and color), and (iii) assess their spatial (urban–peri-urban–rural gradient) and seasonal (dry and wet seasons) variations. Specifically, the study examines whether microplastic abundance and density differ between seasons and among regions, and whether seasonal changes depend on spatial variation (i.e., interaction between season and region). In addition, it evaluates whether the composition of microplastic shape and color, as well as particle size, varies across seasons and regions. By integrating spatial and temporal analyses within a tropical river system influenced by monsoonal hydrology, this study provides insights into the distribution patterns and potential drivers of microplastic pollution in the Mekong Delta.

2. Materials and Methods

2.1. Study Area

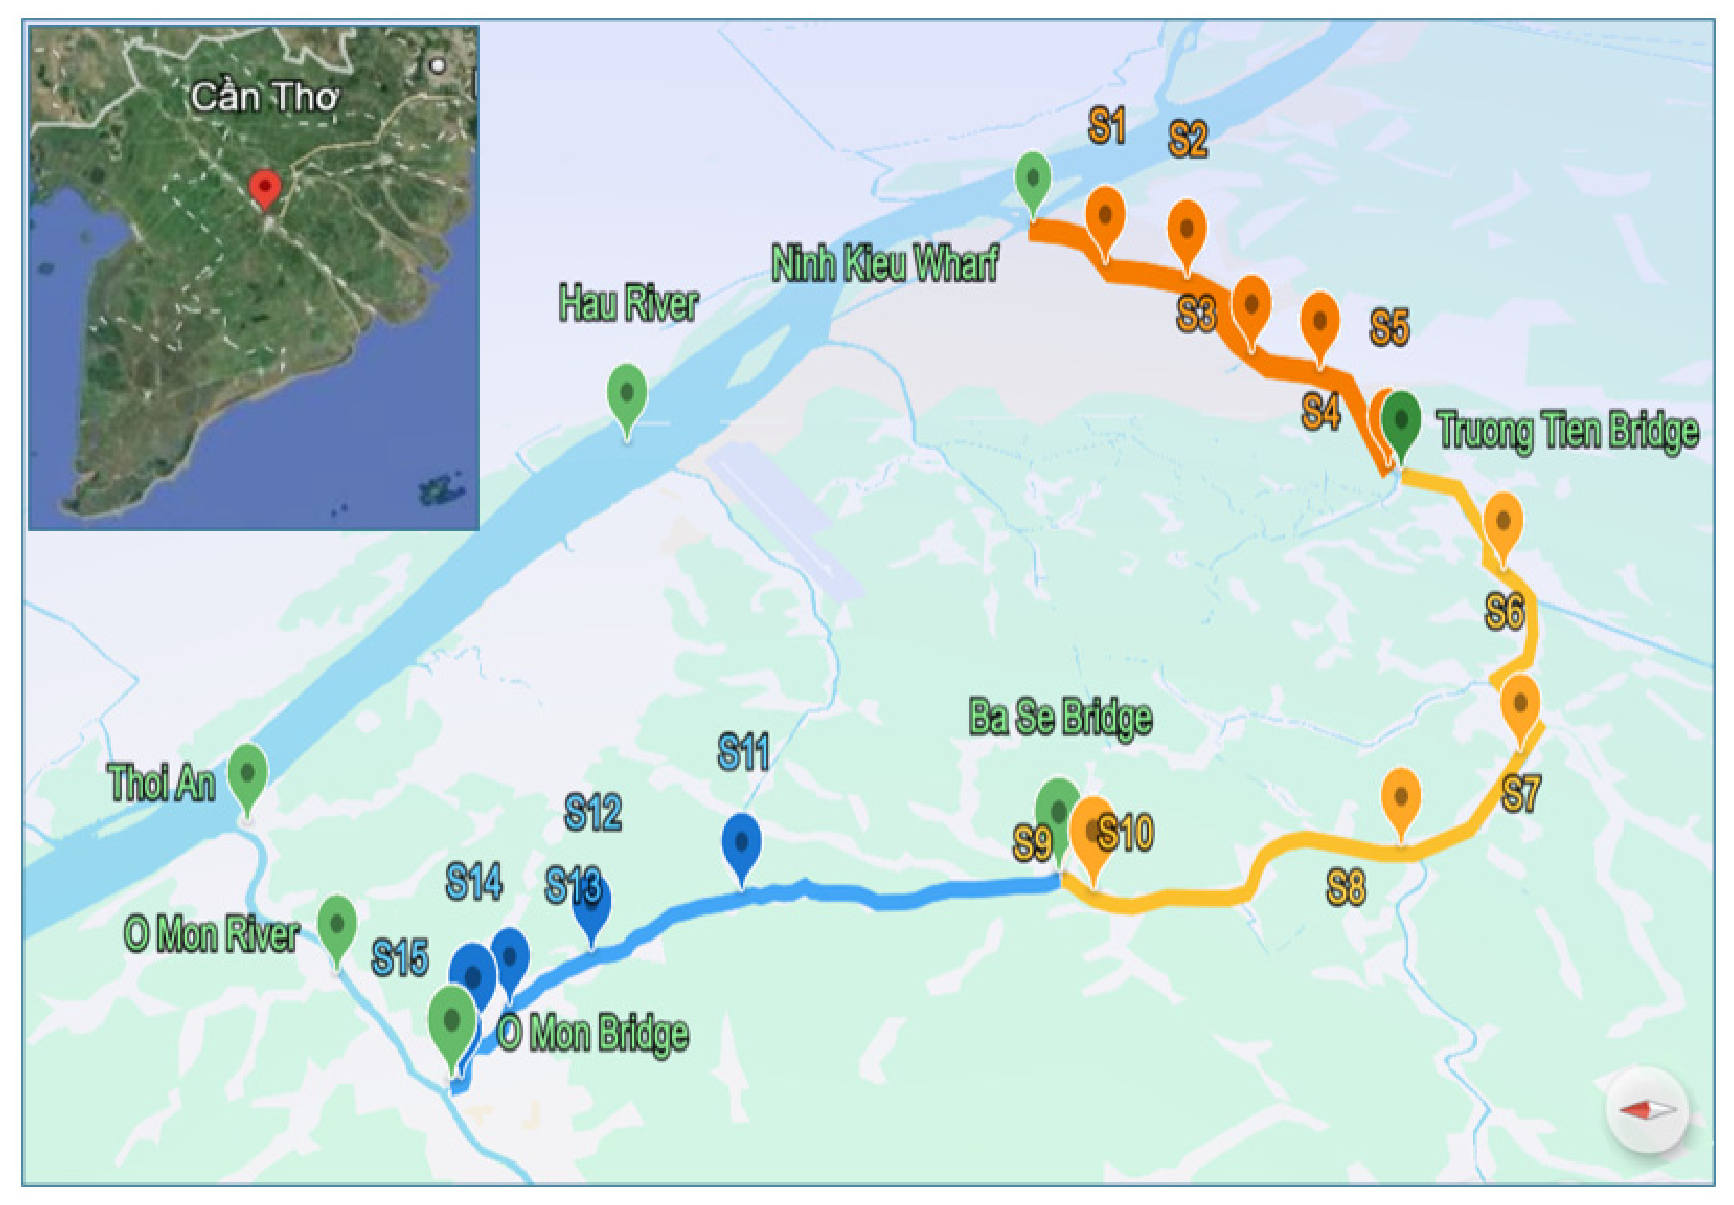
The Can Tho River is a major tributary of the Hau River within the Mekong Delta, flowing through Can Tho City, one of the principal urban centers in the region and an important socio-economic hub. The river traverses a gradient of urban, peri-urban, and rural landscapes, where it is exposed to a range of anthropogenic pressures, including urban expansion, commercial activities, navigation, and agricultural production in surrounding areas, as shown in Figure 1.
These characteristics reflect broader regional patterns observed across the Mekong Delta, where sustained economic growth, population expansion, and rapid urbanization have been well documented and are associated with increasing pressures on natural resources and aquatic environments [29,30]. Similar trends have been linked to intensified human impacts on river systems in Vietnam, particularly through land-based activities and waste inputs [25,27].
Within this regional context, Can Tho City is likely to experience comparable environmental pressures, particularly those associated with increasing plastic waste generation and its transfer into river systems via multiple pathways, including urban runoff, domestic wastewater discharge, and mismanaged solid waste [31]. Consistent with these processes, previous studies in the Mekong Delta have reported the widespread occurrence of microplastics in both surface waters and sediments, highlighting the influence of anthropogenic activities and land-based sources [25,27].
However, existing studies remain spatially constrained and do not adequately capture variability along urban–rural gradients, particularly within inland tributary systems such as the Can Tho River.

2.2. Sampling Process

2.2.1. Hydrometeorological Conditions and Sampling Strategy

Can Tho exhibits a typical tropical monsoonal climate characterized by two distinct seasons: a dry season from December to April and a rainy season from May to November [32]. These seasonal regimes result in pronounced contrasts in precipitation patterns and hydrological conditions, which are key drivers of surface runoff generation and pollutant transport in river systems.
Climatological data indicate that January represents the peak of dry season conditions, with minimal precipitation (~1.5 rainy days and 6.5 mm month−1), whereas June corresponds to the peak of the rainy season, characterized by frequent and intense rainfall (~17.3 rainy days and 166.1 mm month−1) as in Table 1 [33]. These months were therefore selected as representative of hydrometeorological extremes to ensure that sampling captures the strongest seasonal contrasts influencing microplastic mobilization and distribution. Accordingly, field sampling was conducted from 18–20 January 2025 (dry season) and from 28–30 June 2025 (rainy season), with the latter following a prolonged rainfall event (20–26 June 2025) to reflect enhanced runoff conditions.
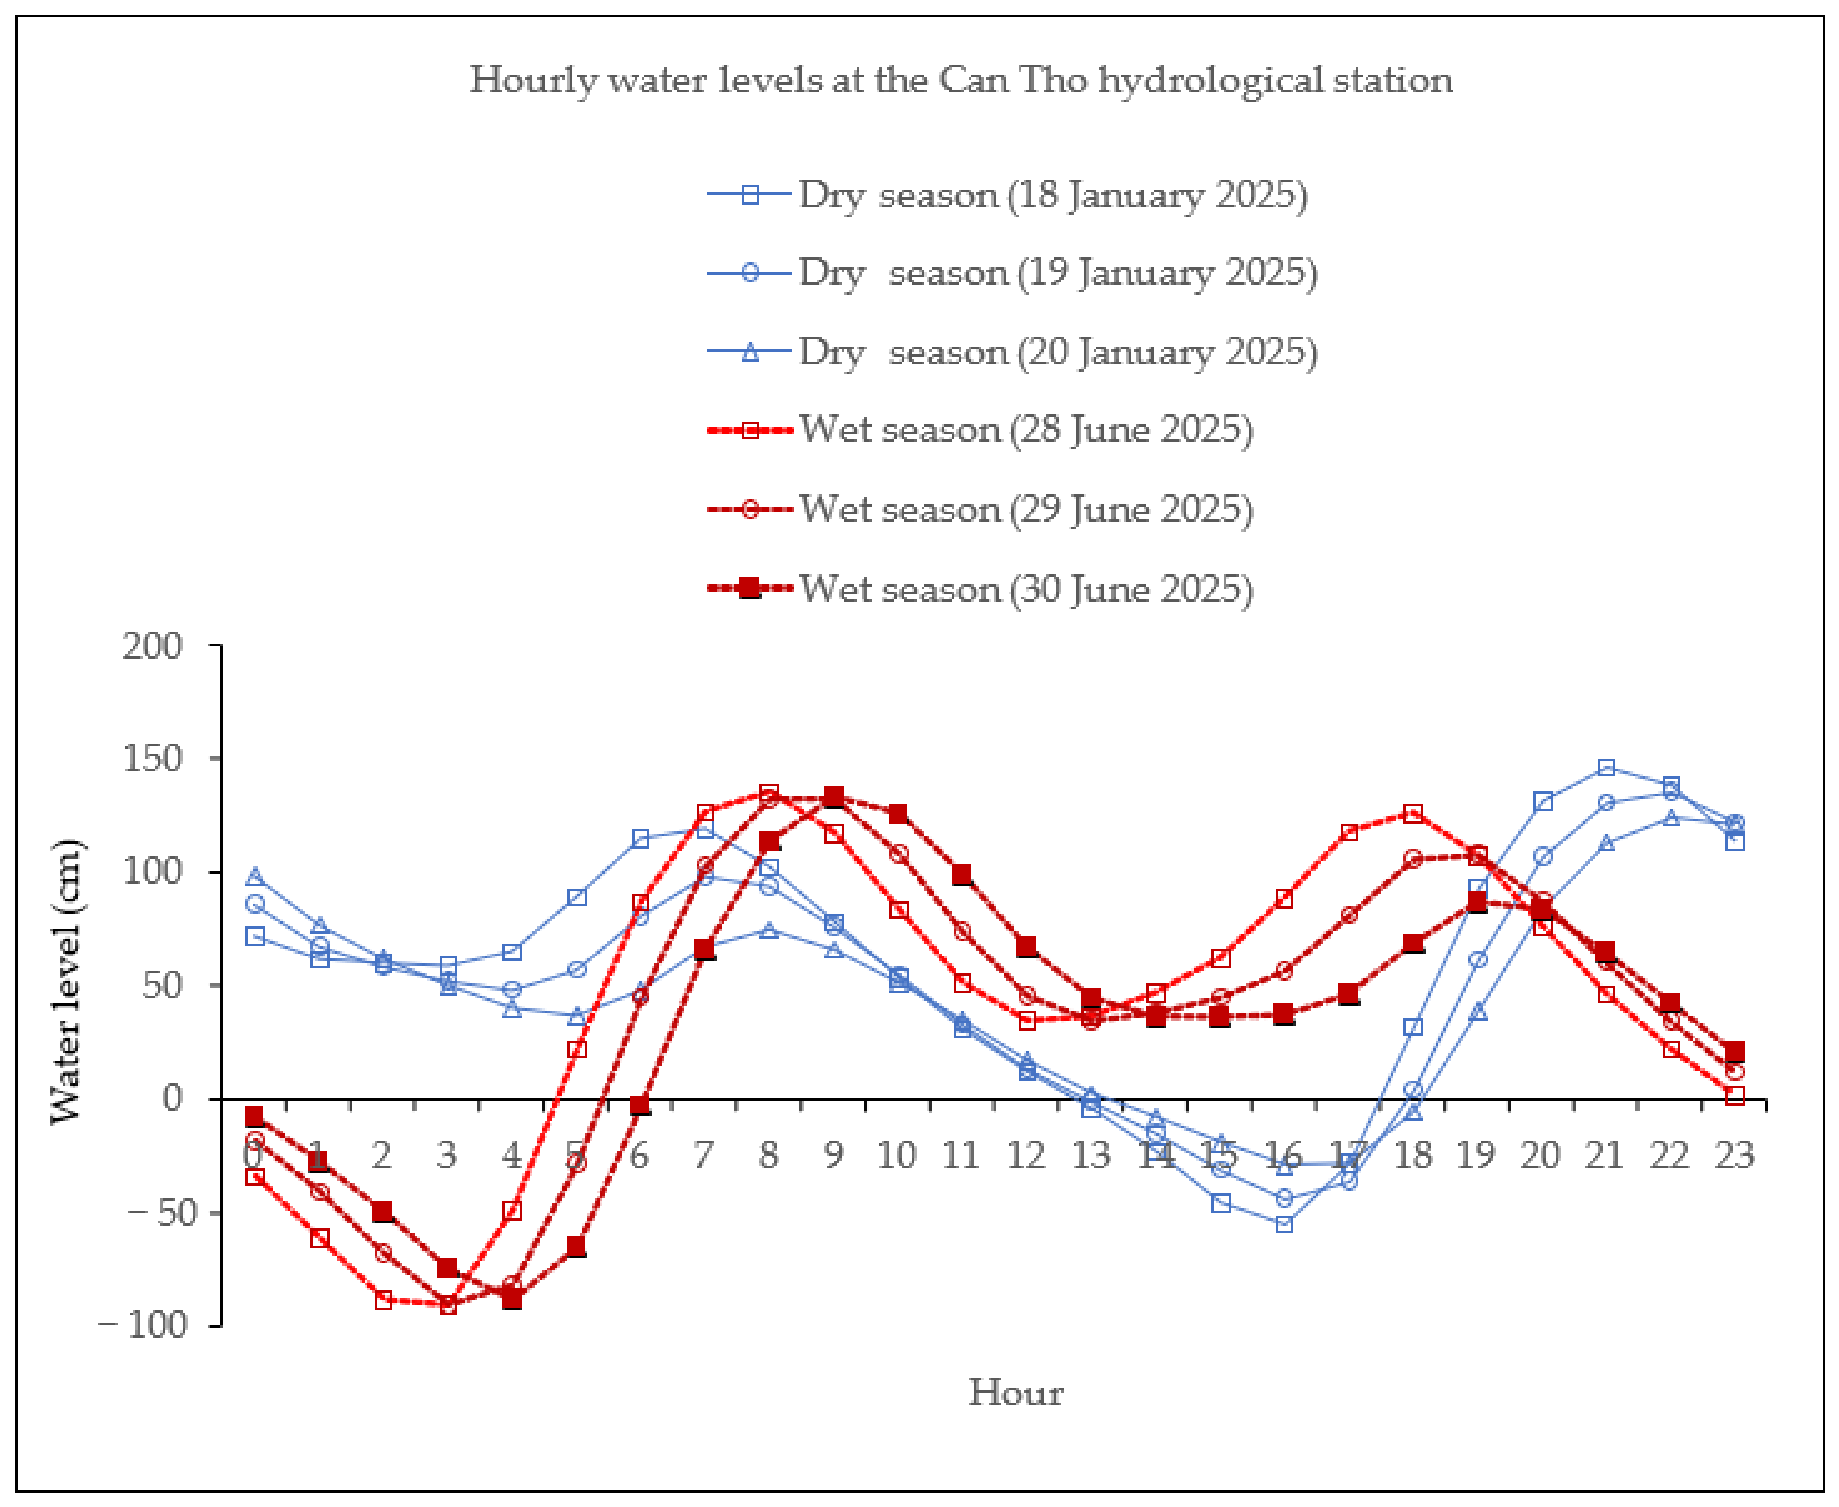
To minimize the influence of tidal exchange with the Hau River and ensure that collected microplastics primarily reflect local inputs within the Can Tho River basin, sampling was conducted during low tide. This approach reduces upstream intrusion and backflow effects, thereby improving the representativeness of samples with respect to in situ anthropogenic sources along the Can Tho River.
Sampling was carried out over three consecutive days in each season to account for short-term temporal variability. During the dry season, samples were collected daily between 09:00 and 15:00, while in the rainy season sampling was conducted between 08:00 and 14:00 (Figure 2), ensuring consistency in sampling conditions while accommodating seasonal differences in weather and hydrodynamics.

2.2.2. Sampling Location

Microplastics in surface water were collected from fifteen sampling sites (S1–S15) distributed along the Can Tho River (Figure 1), representing a gradient of anthropogenic influence from urban to rural environments. A stratified sampling design was adopted, with sites evenly allocated across three river sections (five sites per section): urban, peri-urban (transitional), and rural-dominated zones. This classification was based on land-use characteristics, population density, and dominant human activities, allowing for the assessment of spatial variability in potential microplastic sources and transport processes.
The urban zone (S1–S5), extending from Ninh Kieu Wharf to Truong Tien Bridge (10.84 km), is in the city center and is characterized by high population density, dense residential areas, commercial activities, tourism, and intensive inland navigation. This section is subject to multiple direct anthropogenic inputs, including domestic wastewater, urban runoff, and solid waste leakage, which are recognized as major sources of microplastics in riverine systems [25]. The peri-urban zone (S6–S10), between Truong Tien Bridge and Ba Se Bridge (14.46 km), represents a transitional area with mixed land use, including residential settlements, local markets, and agricultural land. The coexistence of urban discharge and diffuse rural inputs makes this zone particularly relevant for examining microplastic transformation and redistribution along the river continuum. The rural-dominated zone (S11–S15), extending from Ba Se Bridge to O Mon Bridge (8.22 km), is characterized primarily by agricultural activities, aquaculture, and lower population density. Although direct urban inputs are limited, microplastics may still enter through agricultural runoff, irrigation return flows, upstream transport, and localized sources such as O Mon market.
Overall, this sampling framework integrates both spatial (urban–rural gradient) and temporal (seasonal) dimensions, providing a robust basis for evaluating the occurrence, transport, and distribution of microplastics in a tropical river system, where hydrological variability plays a key role in governing environmental dynamics [14,26].

2.2.3. Sampling Devices

At each sampling site, surface water was collected under strict contamination control procedures. All equipment was thoroughly cleaned and rinsed with filtered water prior to use, and sampling was conducted carefully to minimize secondary contamination from surrounding microplastic sources.
Microplastics were collected using an Albatross Mark 6 (AM-6) device (Pirika Inc., Tokyo, Japan). The system was equipped with a submersible waterproof power unit connected to a propeller (RDS200, Yamaha, Japan), which actively pumped surface water into the sampling unit. A plankton net (mouth diameter: 30.5 cm; length: 750 cm; mesh size: ~300 µm) was centrally mounted to filter incoming water and retain particles larger than the mesh size. At the downstream end, a mechanical flowmeter (GO-2030 R6, General Oceanics, Miami, FL, USA), fitted with a low-speed counter-clockwise rotating impeller (16.5 cm diameter), was used to quantify the volume of filtered water. The flowmeter housing was filled with water to ensure accurate recording of impeller rotations. To maintain a closed and controlled system, both the net and flowmeter were enclosed within a transparent cover, ensuring that all passed sequentially through the net and flowmeter.
Sampling was conducted at locations with a minimum water depth of 1 m, with the device positioned just below the water surface. Each sampling event lasted 3 min. After retrieval, the net was carefully removed, placed in a clean bag, and stored in a sealed container for transport to the laboratory.
The sampling net was hung up and rinsed with tap water, while the nozzle was covered with a 300 µm mesh to reduce the introduction of potential plastic particles from the rinsing water. Rinsing was performed systematically: first from the outside (from the mouth to the cod end), followed by the inside of the net in the same top-to-bottom direction, ensuring that retained particles were washed down into the collection funnel. The final concentrate was then transferred from the funnel into pre-cleaned glass bottles, appropriately labeled, and stored for subsequent analysis.
The volume of water is calculated as follows:
Distance   ( in   meters ) =   Difference   in   Counts   ( final initial ) 999999 ( × ) Rotor   Constant  
with the rotor constant of the low-speed rotor (R6) being 57.56 [35]
Speed   ( in   cm / s ) = Distance   in   meters   ( × )   100 Time   in   seconds
Volume   ( cubic   meters ) = Net   mouth   area   ( × )   Distance

2.3. Microplastic Extraction and Identification

2.3.1. Microplastic Extraction

Microplastics were extracted using a five-step procedure adapted from [25] with minor modifications.
Step 1—Size fractionation (1 mm sieving):
The sample obtained from the washing grid was filtered through a 1 mm stainless steel sieve to remove large debris. The aqueous solution after filtration was collected in a glass beaker (1000 mL, Schott Duran, Mainz, Germany) and the sample container was rinsed with distilled water filtered through a GF/A membrane (1.6 µm pore size, Whatman®, Maidstone, UK) and further filtered through a sieve. Any remaining organic debris (e.g., plant matter, wood, shells) on the sieve was carefully removed with distilled water. Particles > 1 mm suspected of being microplastics were retained separately on the GF/A membrane for subsequent microscopic examination. These particles were not discarded and were included in the final dataset when meeting the identification criteria described in Section 2.3.3. The sieve was thoroughly rinsed to obtain a final volume of approximately 350 mL.
Step 2—Organic matter digestion:
A water sample with a particle size of <1 mm (~350 mL) was transferred to a glass flask (500 mL, Schott Duran) and subjected to a two-stage treatment to remove organic matter. First, 1 g of Sodium Dodecyl Sulfate (SDS, Merck®) was added, and the mixture was incubated at 50 °C for 24 h. Then, enzymatic and oxidative treatment was carried out by adding 1 mL of Biozyme SE (protease and amylase, Spinnrad®, Bad Segeberg, Germany), 1 mL of Biozyme F (lipase, Spinnrad®, Bad Segeberg, Germany), and 15 mL of hydrogen peroxide (30% H2O2, Merck®, Darmstadt, Germany), followed by incubation at 40 °C for 48 h.
Step 3—Fine sieving and pre-concentration (250 µm):
After digestion (~5 days total processing time), the sample was sieved through a 250 µm mesh to retain microplastics > 250 µm. The sieve was rinsed with filtered distilled water and retained were transferred into a beaker. A saturated NaCl solution (density: 1.18 ± 0.02 g mL−1) was added to a final volume of 150 mL, and the mixture was covered with aluminum foil and left undisturbed overnight to allow particle separation.
Step 4—Density separation:
Floating particles were recovered by density overflow with NaCl solution (1.18 ± 0.02 g mL−1) using a dropping burette. A sample cup was placed under a 50 mL burette, and NaCl solution was added dropwise to cause overflow. This process was repeated three times, each overflowing 50 mL, to obtain a total volume of approximately 150 mL to maximize the recovery of floating microplastic particles.
Step 5—Filtration and microscopic analysis:
The recovered solution was filtered through GF/A glass fiber membranes (1.6 µm pore size, Whatman®) using a glass filtration unit (Schott Duran). Approximately 30 mL of sample was filtered per membrane to ensure an appropriate microplastic loading density, resulting in a total of five membranes per sample.
The membranes containing retained particles were carefully transferred to sterile Petri dishes, labeled, and air-dried prior to analysis. Microplastics were visually examined under an optical microscope (Nikon Eclipse Ci-L Plus) at 4× magnification. Images were captured using a Digital Sight 10 camera and processed with NIS-Elements BR software (version 5.41, Nikon Corporation, Tokyo, Japan). Particle dimensions were measured using the digital measurement tools available in NIS-Elements BR software, with measurement functions selected according to particle morphology (e.g., straight-line, segmented-line, or area-based measurements).

2.3.2. Analytical Quality Control

To minimize contamination and ensure data reliability during microplastic analysis, strict quality control measures were implemented throughout all stages of sample processing. All glassware was thoroughly rinsed with tap water passed through a filter-equipped faucet to remove potential microplastic contamination, then stored in sealed zip-lock bags. Prior to use, equipment was rinsed again with filtered water. Work surfaces were cleaned with alcohol or filtered water using lint-free materials. Laboratory personnel wore cotton lab coats, nitrile gloves, and face masks to reduce contamination from synthetic fibers. All distilled water used during laboratory sample processing was pre-filtered through GF/A glass-fiber membranes (1.6 µm pore size) prior to use.
Positive Extraction Control (PEC): To assess recovery efficiency, a known number (n = 10) of pre-characterized microplastic particles (with identifiable colors and sizes) were added to selected samples prior to processing. These spiked samples were subjected to the full extraction procedure. At the final observation stage, all recovered particles were counted and measured to evaluate recovery rates in terms of both particle number and size. Recovery efficiency assessed using Positive Extraction Controls ranged from 90% to 100%, indicating minimal particle loss during sample processing and extraction.
Deposition Air Control (DAC): To monitor airborne contamination during sample processing (digestion, sieving, and density separation), a blank GF/A filter was placed in an open Petri dish adjacent to the working area. The filter remained exposed throughout these steps and was then covered and stored. After processing, the DAC filter was examined under the microscope, and any microplastics >250 µm were counted and measured following the same procedure as for environmental samples.
Observation Air Control (OAC): To quantify airborne contamination during microscopic analysis, an additional blank GF/A filter was placed in an open Petri dish beside the stereomicroscope during sample observation. After completion, the filter was covered and analyzed for microplastics >250 µm, using identical counting and measurement procedures.
A total of five particles/fibers were detected in the DAC and OACs; however, all were smaller than 250 µm. Because the operational lower size limit adopted in this study was 250 µm, these particles were excluded from contamination assessment. No particles ≥250 µm were detected in the control filters; therefore, no blank correction was applied to the final microplastic abundance and density calculations.
These quality control measures allowed for the identification and correction of potential contamination sources, thereby improving the accuracy and reproducibility of microplastic quantification.

2.3.3. Classification of Microplastics

Microplastic particles were identified and classified based on their morphological characteristics into five categories: fibers, fragments, films, foams, and small particles (pellets/granules). This classification is widely applied in microplastic studies to infer potential sources and degradation pathways in aquatic environments.
In addition, particles were categorized by color, including transparent, blue, black, red, white, and others, as color can provide supplementary information on material origin and weathering status. Size classification was also performed to assess the distribution of microplastics across different size ranges, which is critical for understanding their transport behavior and environmental fate.
Microplastic identification was conducted following the visual classification approach described by Strady et al. [25] using microscopic observation and digital image analysis. Particles were classified by trained personnel based on established morphological characteristics, including shape, color, and size. Although this approach has been widely applied in baseline monitoring studies of microplastic pollution, polymer composition was not confirmed using spectroscopic techniques such as micro-FTIR or Raman spectroscopy. Therefore, the potential misclassification of visually similar non-plastic particles cannot be completely excluded and should be considered when interpreting the results.

2.4. Calculation of Microplastic Indices

Microplastic density in water samples was expressed as the number of particles per unit volume of water (items/m3) and calculated using the following equation:
D ( items / m 3 ) =   N   N b V
where D is the microplastic density (items/m3) N is the total number of microplastic particles identified in the sample, Nb is the number of particles detected in blank controls when blank correction is required., and V is the volume of filtered water (m3).
The percentage composition of microplastics by shape type across seasons and within each region–season combination was calculated using Equations (5) and (6).
Shape   composition   % = n i V × 100
where ni is number of microplastic particles belonging to shape type i (fiber, fragment, film, pellet, etc.) in each season, and N is total number of microplastic particles recorded in the corresponding season.
Shape   composition   % = n i V × 100
The percentage composition of microplastic size classes by season and by region–season combination was calculated using Equations (7) and (8).
Percentage   of   size   class   ( % ) = n i N × 100
where ni is the number of microplastic particles belonging to size class I, and N is the total number of microplastic particles recorded in the corresponding season.
Percentage   of   size   class   ( % ) = n ij N j × 100
where nij is the number of microplastic particles belonging to size class i in region–season group j , and Nj is the total number of microplastic particles recorded in the corresponding region–season group j .

2.5. Statistical Analysis

All statistical analyses were performed using IBM SPSS Statistics (version 20), and results were visualized using boxplots, interaction plots, stacked bar charts, and empirical cumulative distribution functions (ECDFs).
Data normality was assessed using the Shapiro–Wilk test, while homogeneity of variances was evaluated using Levene’s test. Depending on the distributional characteristics of each dataset, either parametric or non-parametric statistical methods were applied. Statistical significance was evaluated at p < 0.05.
Seasonal differences in microplastic abundance, density, and size between the dry and wet seasons were evaluated using the Wilcoxon signed-rank test because observations were paired by sampling site. Spatial differences among the three river regions (urban, peri-urban, and rural) were assessed using either one-way analysis of variance (ANOVA) or the Kruskal–Wallis test, depending on whether the assumptions of normality and homogeneity of variance were satisfied. When significant differences were detected by ANOVA, Tukey’s honestly significant difference (HSD) test was applied for post hoc pairwise comparisons. Pairwise comparisons between two independent groups were performed using the Mann–Whitney U test, whereas pairwise comparisons following significant Kruskal–Wallis results were conducted using Bonferroni-adjusted comparisons.
To further examine spatial variability in seasonal responses, interseasonal differences (Δ = Wet − Dry) were calculated for each sampling site and compared among regions using the Kruskal–Wallis test.
To evaluate whether seasonal responses differed among regions, two-way analysis of variance (ANOVA) was performed to test the main effects of season and region, as well as their interaction effect (season × region), on microplastic abundance and density. Interaction plots were used to visualize these relationships.
Differences in microplastic shape and color composition were assessed using Pearson’s Chi-square test. Categories with low expected frequencies were combined where necessary to satisfy test assumptions. Continuous particle-size distributions were further examined using boxplots and empirical cumulative distribution functions (ECDFs) to complement the categorical size-class analysis and facilitate comparisons of particle-size distributions between seasons and regions.

3. Results and Discussion

3.1. Spatiotemporal Occurrence of Microplastics

3.1.1. Abundance: Seasonal and Spatial Variation

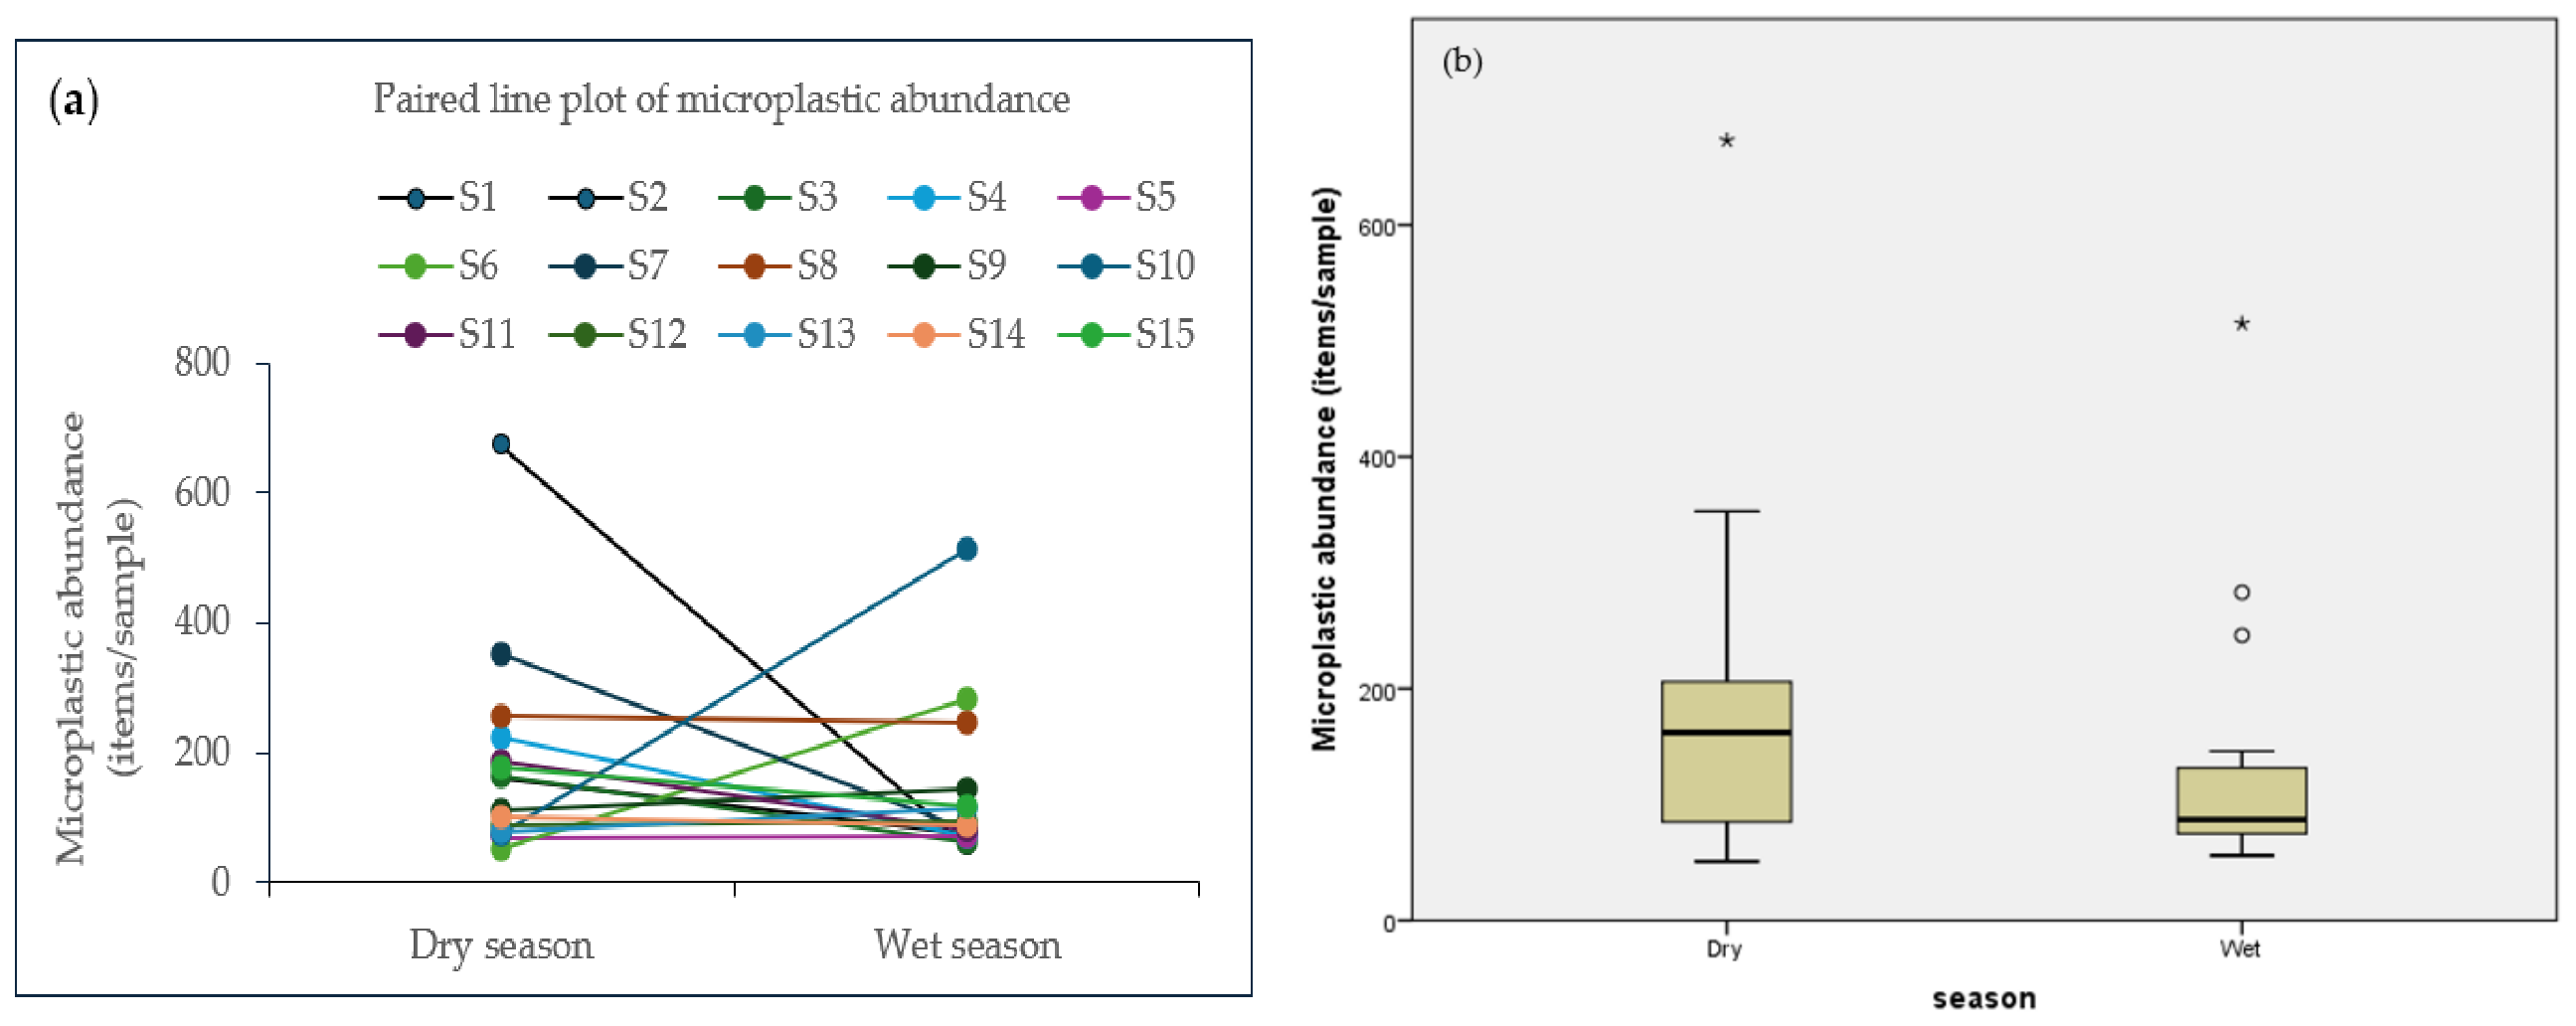
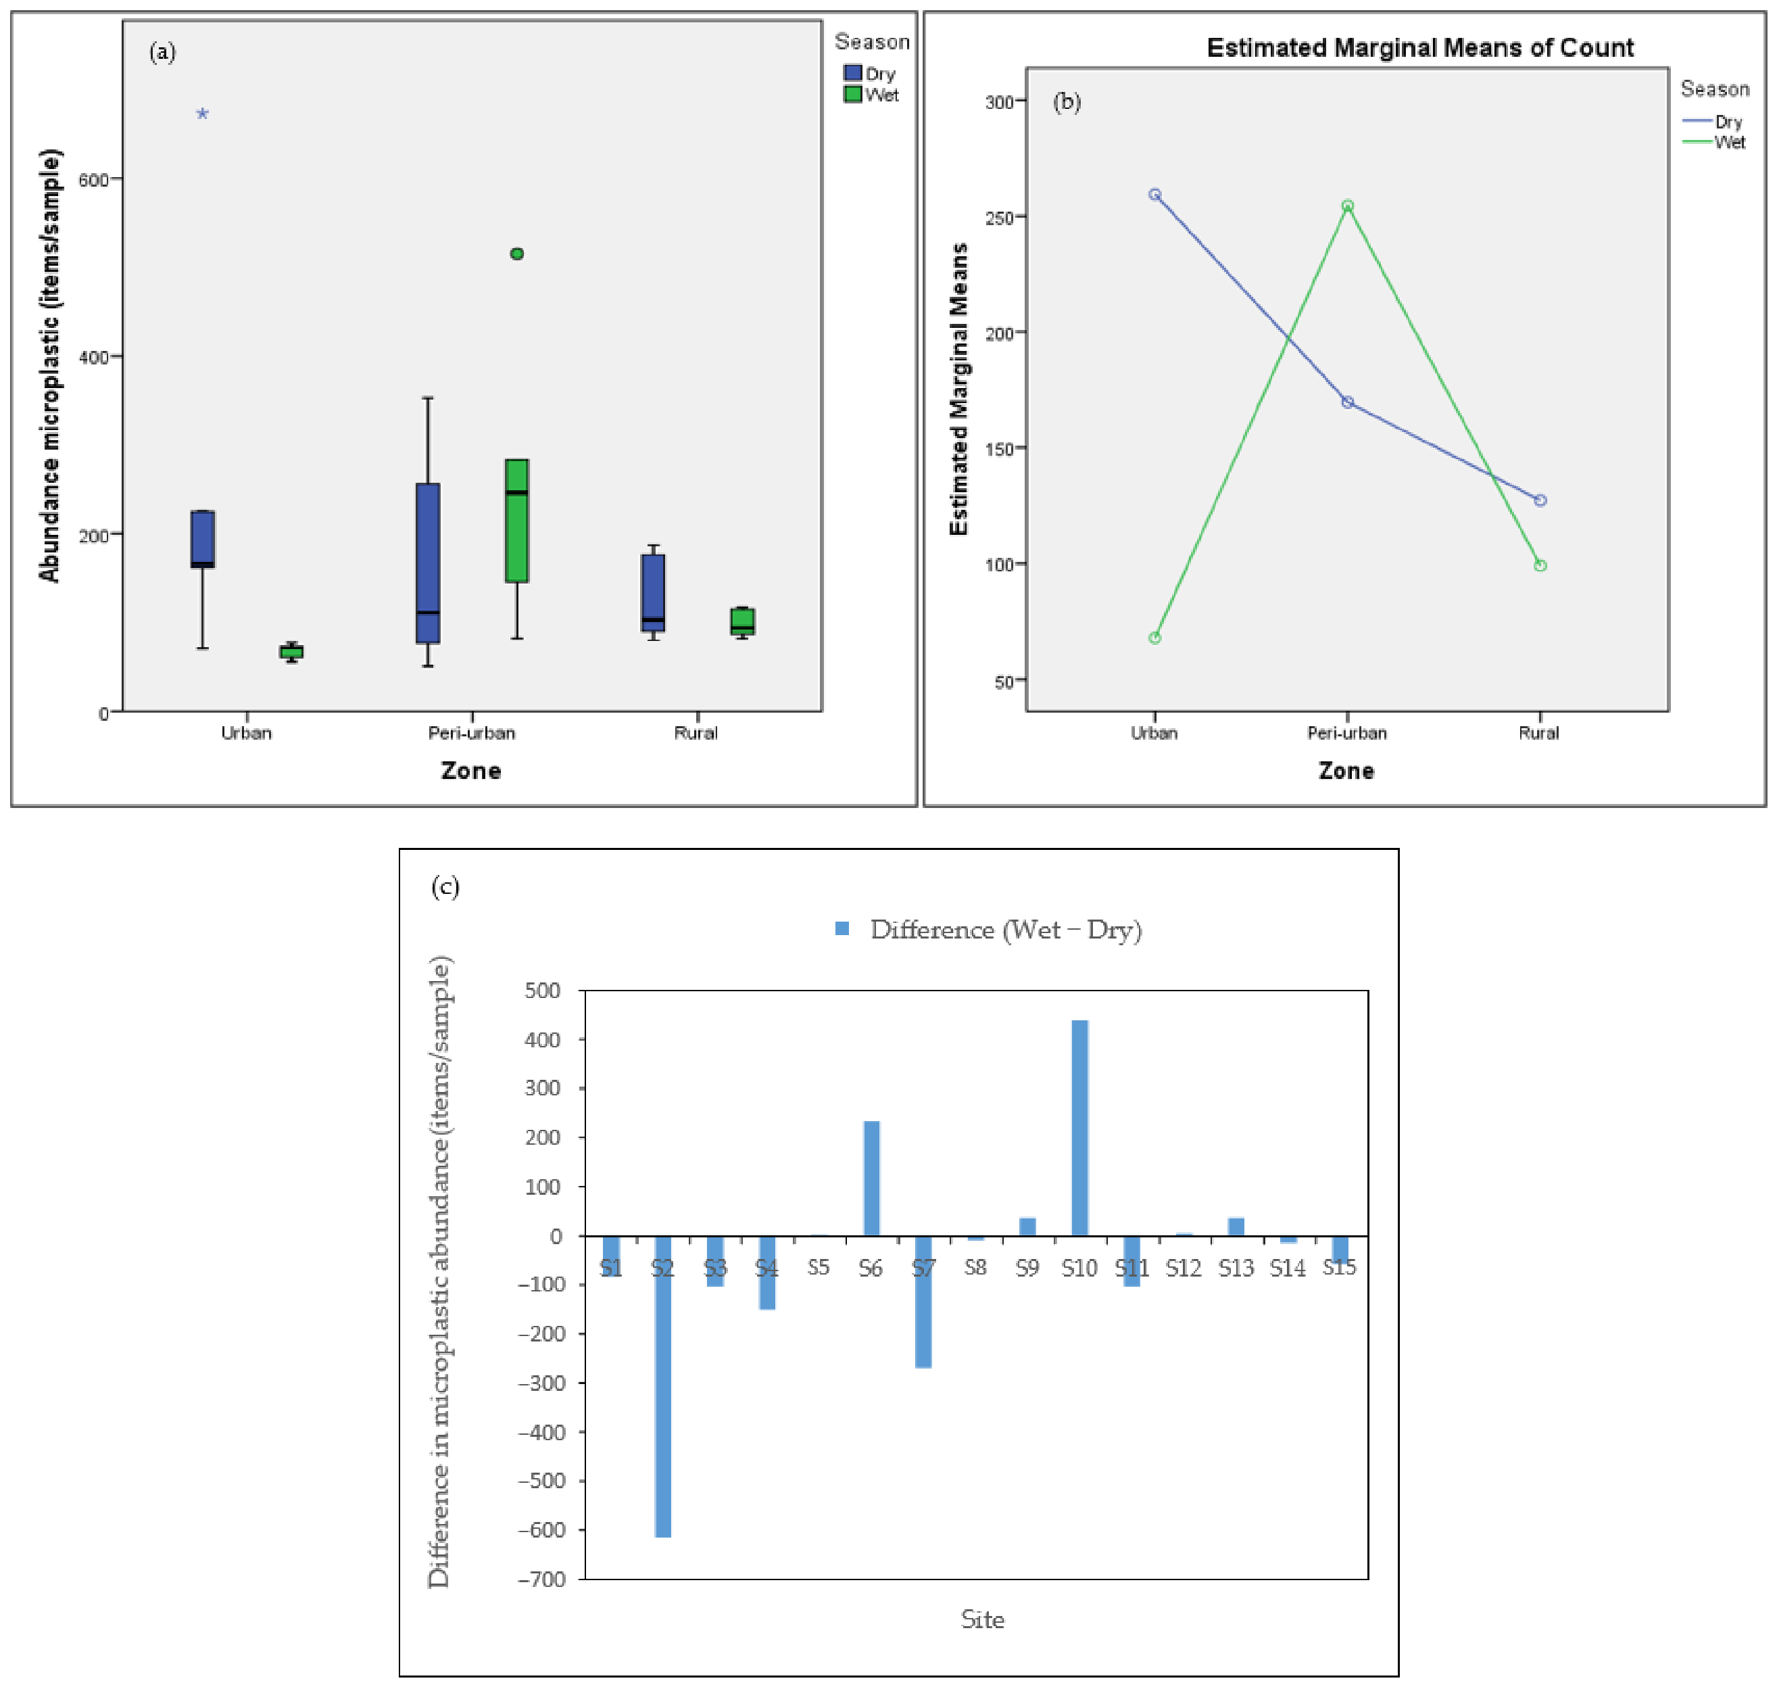
Microplastic abundance in the Can Tho River reflects the combined influence of hydrological conditions and localized source inputs, resulting in spatially heterogeneous patterns and a weak overall seasonal signal. To disentangle these effects, seasonal variation was first examined at the system scale (Figure 3), followed by spatial variability and interaction effects across regions (Figure 4).
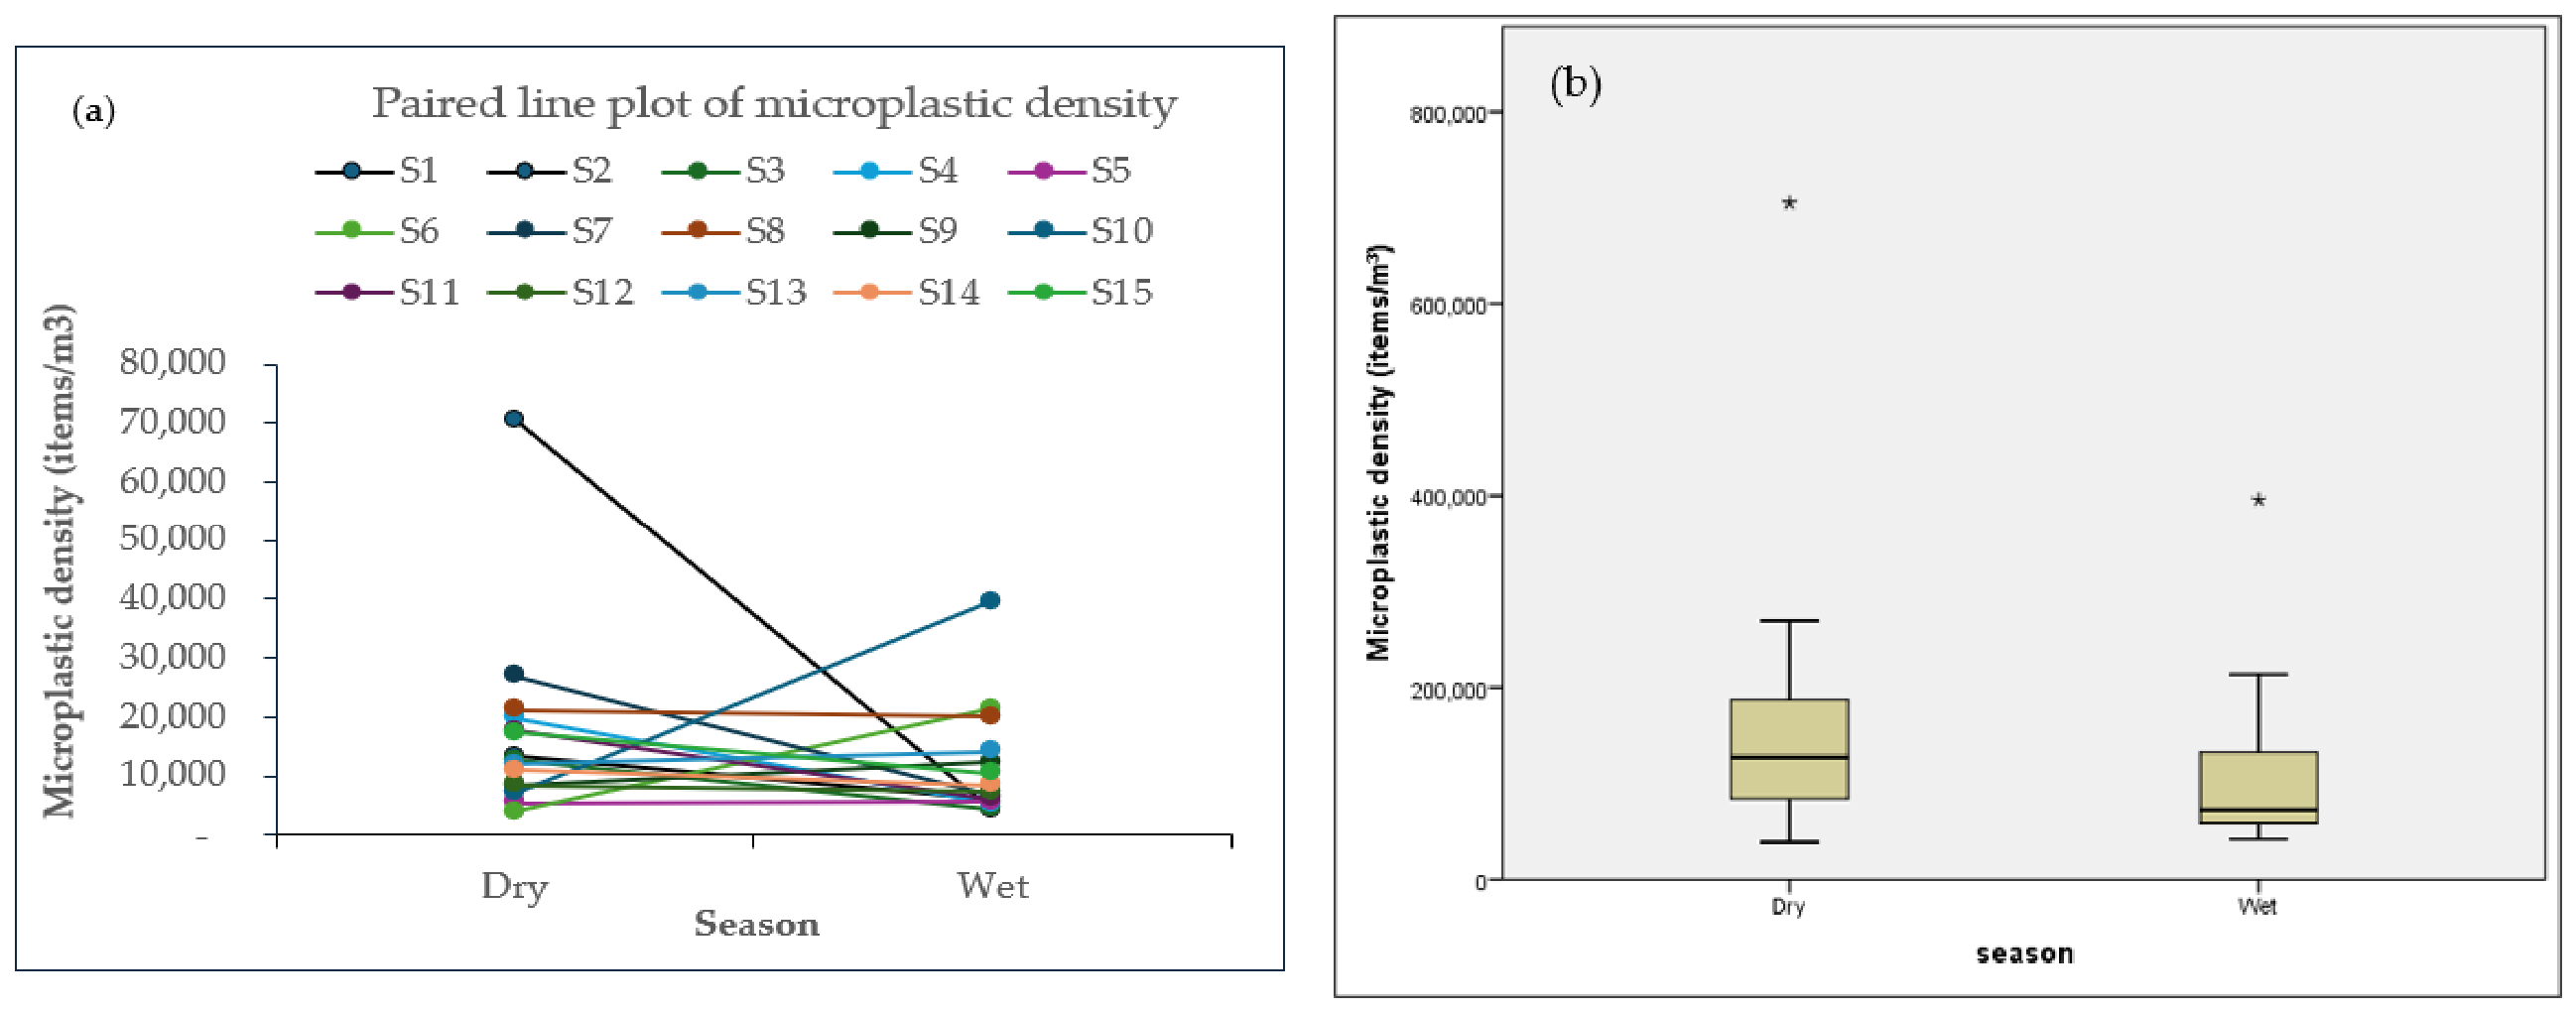
At the seasonal scale, the distribution of microplastic abundance differed visually between the dry and wet seasons, with higher median values and a wider interquartile range observed in the dry season (Figure 3b). This indicates greater spatial variability under low-flow conditions. In contrast, the wet season exhibited a lower median and a narrower distribution, suggesting more constrained conditions. However, the paired site-level analysis (Figure 3a) revealed heterogeneous responses across the 15 sampling sites. Most sites showed decreases during the wet season (Wet < Dry), while a smaller number exhibited marked increases, indicating that seasonal effects are not consistent across locations. These opposing trends resulted in no statistically significant seasonal difference at the system scale (Wilcoxon signed-rank test, Z = −1.136, p = 0.256). Similar patterns have been reported in riverine systems where increased discharge during the wet season simultaneously enhances dilution and downstream transport, while also promoting localized inputs through runoff and resuspension [36,37].
Clearer patterns emerged when spatial variability and season–region interaction patterns were examined (Figure 4). During the dry season, microplastic abundance tended to be higher in urban areas, followed by peri-urban and rural zones, although these differences were not statistically significant (Kruskal–Wallis, p = 0.756). In contrast, during the wet season, spatial differences became significant (p = 0.005), with the peri-urban zone exhibiting the highest median abundance (Figure 4a). The interaction plot (Figure 4b) shows non-parallel trends between seasons across regions, suggesting that seasonal responses may vary according to spatial context. However, the season × region interaction was not statistically significant (F = 2.793, p = 0.081), indicating that these patterns should be interpreted cautiously. This pattern is further supported by the distribution of interseasonal differences (Δ = Wet − Dry), where urban areas generally show negative values (decreases), while peri-urban areas display both strong positive and negative deviations (Figure 4c). These descriptive patterns suggest that seasonal responses may differ among regions and could be influenced by local environmental conditions and source characteristics. Within-zone comparisons further confirm this pattern, as only the urban region showed a significant seasonal decrease (Mann–Whitney, p = 0.047), while peri-urban and rural regions did not.
The observed patterns may be associated with the interplay between hydrodynamic processes and source variability. During the wet season, increased river discharge enhances dilution and downstream transport, leading to reduced abundance at many sites. At the same time, stormwater runoff and sediment resuspension can introduce or remobilize microplastics, resulting in localized increases, particularly in areas with mixed land use such as peri-urban zones. In contrast, the dry season is characterized by reduced flow conditions, which amplify the influence of localized sources, especially in urban environments where wastewater discharge and direct plastic inputs are more concentrated. Similar dynamics have been reported in other river systems, where microplastic abundance is influenced by both hydrological forcing and spatially variable inputs [38,39,40].
Overall, microplastic abundance in the Can Tho River exhibits strong spatial heterogeneity but no significant seasonal difference at the system scale. These findings indicate that seasonal hydrology primarily redistributes microplastics rather than uniformly increasing or decreasing their abundance. The non-parallel seasonal trends observed among regions suggest that seasonal responses may vary according to spatial context, highlighting the importance of jointly considering spatial and temporal variability in riverine microplastic assessments.

3.1.2. Density: Seasonal and Spatial Variation

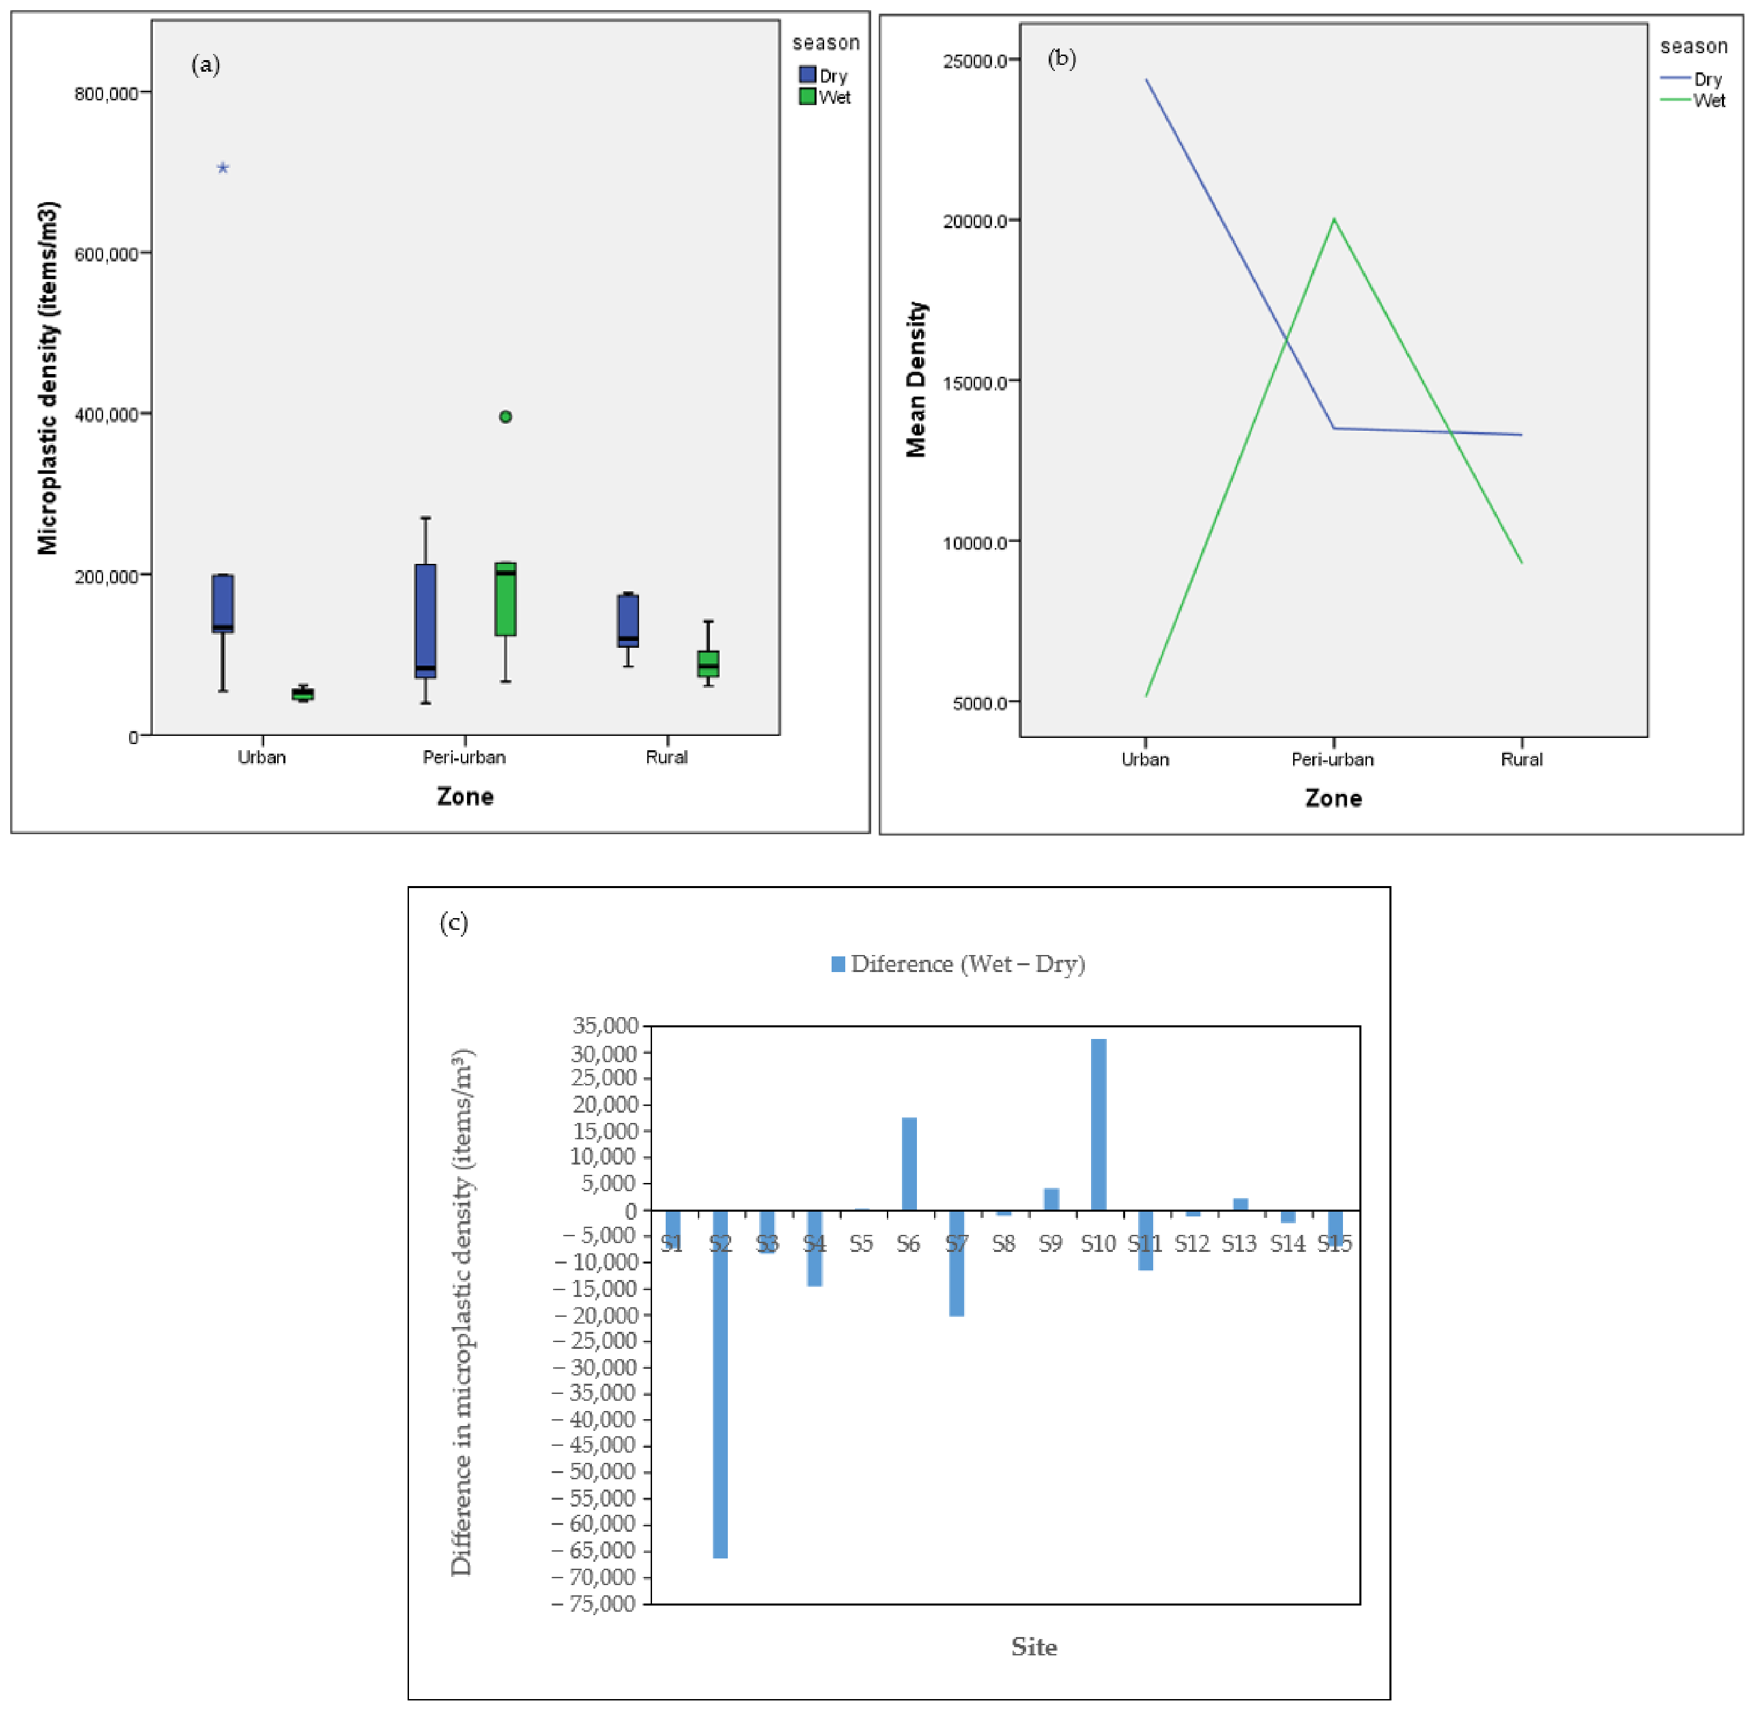
Microplastic density in the Can Tho River exhibits spatial heterogeneity and varying seasonal responses, suggesting that hydrodynamic processes and local emission sources may jointly contribute to its distribution (Figure 5 and Figure 6). Overall, microplastic density provides a concentration-based perspective, reflecting hydrological conditions and dilution processes, offering additional insights into microplastic abundance.
At the seasonal scale, microplastic density showed visible differences between dry and wet seasons, with higher median values and greater variability observed during the dry season (Figure 5b). This pattern indicates that low-flow conditions enhance concentration effects due to limited dilution. In contrast, the wet season displayed lower median density and a more constrained interquartile range, suggesting dilution under increased discharge. However, the paired line plot (Figure 5a) reveals heterogeneous site-level responses, with most sites showing decreases (Wet < Dry) while a few exhibited increases. These opposing trends resulted in no statistically significant seasonal difference (Wilcoxon signed-rank test, Z = −1.306, p = 0.191). In river systems, increased discharge during rainfall events may either enhance or dilute microplastic concentrations depending on local catchment characteristics and plastic input rates. Several studies have reported that stormwater runoff and combined sewer overflows generate episodic increases in microplastic transport, while in low-pollution catchments, elevated flow conditions can reduce concentrations through dilution effects [41,42,43].
More pronounced patterns emerged when spatial variation and season–region interaction patterns were examined (Figure 6). During the dry season, density tended to be higher in urban and peri-urban zones compared to rural areas; however, these differences were not statistically significant (Kruskal–Wallis test, χ2 = 0.620, p = 0.733). In contrast, during the wet season, spatial differences among regions became statistically significant (one-way ANOVA, F = 5.320, p = 0.022), with the peri-urban region exhibiting the highest mean density (Figure 6a). Post hoc Tukey comparisons indicated that microplastic density in the peri-urban region was significantly higher than in the urban region (p = 0.021), whereas differences between peri-urban and rural regions and between urban and rural regions were not statistically significant. These results suggest that hydrological processes during high-flow conditions may amplify spatial heterogeneity in microplastic density.
The boxplots (Figure 6a) show that peri-urban zones exhibited the highest variability, particularly during the wet season, indicating mixed and dynamic sources. The interaction plot (Figure 6b) shows non-parallel trends across regions, suggesting that seasonal responses may vary among spatial zones. Urban sites exhibited a marked decrease in density during the wet season, whereas peri-urban sites showed a substantial increase, while rural sites displayed only moderate seasonal variation. However, the season × region interaction was not statistically significant (F = 2.585, p = 0.096), indicating that these patterns should be interpreted cautiously.
The Δ plot (Figure 6c) further supports these observations, showing that urban zone generally experienced negative Δ values, reflecting lower densities during the wet season, whereas peri-urban zone displayed both pronounced increases and decreases, highlighting spatially heterogeneous responses. Within-region analyses further supported this pattern, as only the urban zone exhibited a significant seasonal difference in microplastic density (Mann–Whitney U test, U = 2.0, p = 0.028), whereas no significant differences were detected in the peri-urban (p = 0.465) or rural zones (p = 0.076). These findings suggest that seasonal hydrological influences are most pronounced in highly urbanized environments.
These patterns may be associated with hydrological controls and source distribution. During the wet season, increased river discharge enhances dilution and downstream transport, reducing microplastic density at many sites. At the same time, stormwater runoff and sediment resuspension can introduce additional microplastics, particularly in peri-urban areas with mixed land use. In contrast, the dry season is characterized by reduced flow and limited dilution, allowing local sources, especially urban wastewater and direct plastic inputs, to exert a stronger influence on microplastic density. Similar dynamics have been observed in other river systems, where microplastic density and distribution are influenced by hydrological flow conditions and catchment characteristics, including flow velocity, watershed morphology, rainfall events, vegetation cover, and hydraulic conditions [38,44,45].
Overall, microplastic density exhibits clear spatial variability but no significant seasonal × region interaction. The observed non-parallel seasonal trends suggest that hydrological responses may differ among regions, although these differences were not statistically significant. These findings indicate that hydrological processes may primarily regulate microplastic density through dilution and redistribution rather than consistent seasonal accumulation, highlighting the importance of jointly considering spatial heterogeneity and flow dynamics when interpreting riverine microplastic patterns.

3.2. Characteristics of Microplastics

3.2.1. Shape: Seasonal and Spatial Variation

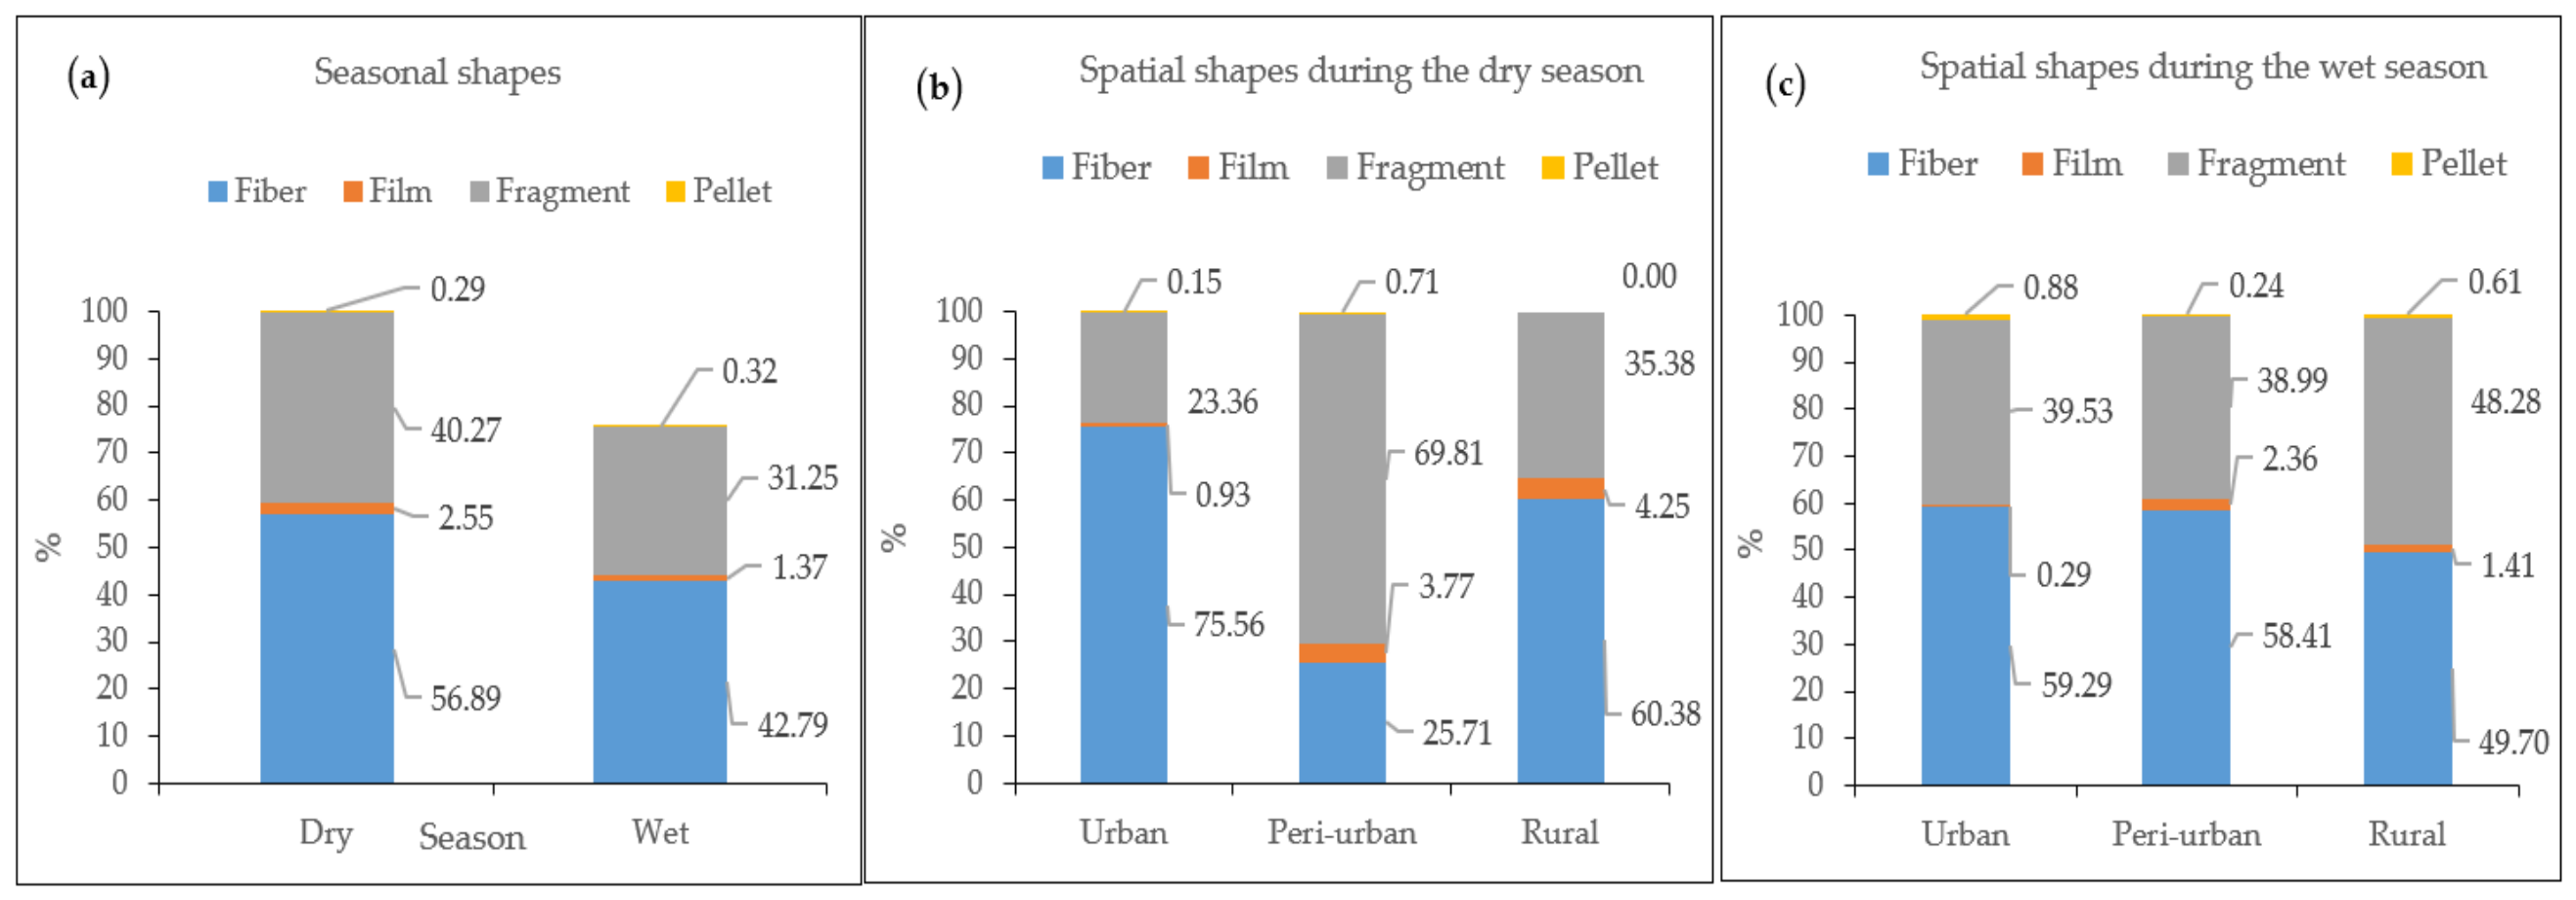
Microplastic shape composition exhibited relatively consistent patterns across both seasons and spatial regions, with fibers and fragments representing the dominant shape categories throughout the study area (Figure 7a–c).
At the seasonal scale (Figure 7a), fibers accounted for the largest proportion in both the dry (56.89%) and wet seasons (42.79%), followed by fragments, which represented 40.27% and 31.25%, respectively. Films and pellets contributed only minor fractions (<3% and <1%, respectively) in both seasons. Although slight variations in the relative proportions of microplastic shape categories were observed between seasons, the Chi-square test indicated no statistically significant seasonal difference in shape composition (Pearson χ2 = 4.003, df = 3, p = 0.261). This result suggests that seasonal hydrological variation did not substantially alter the overall morphological structure of microplastics in the river system. Similar observations have been reported in urban river systems where continuous anthropogenic sources such as wastewater discharge, shipping activities, and surface runoff may maintain relatively stable microplastic shape distributions even under strong seasonal hydrological variations [46,47,48].
Spatially, the dry season displayed notable variation in dominant shapes among regions (Figure 7b). Fibers strongly dominated the urban region (75.56%), potentially reflecting intensive domestic wastewater discharge, laundry effluents, and urban runoff associated with densely populated areas. In contrast, fragments were most abundant in the peri-urban region (69.81%), indicating enhanced secondary degradation of larger plastic debris and the influence of mixed land-use activities. The rural region exhibited a more balanced distribution between fibers (60.38%) and fragments (35.38%), suggesting combined contributions from upstream transport and local diffuse sources. The Chi-square test revealed a highly significant spatial difference in microplastic shape composition during the dry season (Pearson χ2 = 538.753, df = 6, p < 0.001). Inspection of the contingency table indicated that the strongest contribution to the overall Chi-square statistic originated from the dominance of fibers in urban sites and fragments in peri-urban sites. This result indicates that the relative proportions of shape categories varied substantially among regions. The predominance of fibers in urban sites and fragments in peri-urban sites suggests that distinct local sources, waste management practices, and environmental processes influenced microplastic morphology along the urban–peri-urban–rural gradient during the dry season.
A similar pattern was observed during the wet season (Figure 7c), where fibers remained dominant in urban (59.29%), peri-urban (58.41%), and rural regions (49.70%). Fragment proportions increased slightly in the rural region (48.28%) compared with urban and peri-urban areas, potentially reflecting enhanced downstream transport, sediment resuspension, and fragmentation processes during periods of elevated discharge. The Chi-square test revealed a significant spatial difference in microplastic shape composition during the wet season (Pearson χ2 = 23.076, df = 6, p = 0.001). Although the regional differences were less pronounced than those observed during the dry season, the results indicate that spatial heterogeneity in microplastic sources, transport pathways, and fragmentation processes continued to influence shape composition under high-flow conditions.
The persistent dominance of fibers across seasons and regions is consistent with numerous freshwater microplastic studies worldwide. Synthetic fibers are commonly associated with textile materials, textile washing, domestic wastewater discharges, fishing-related activities, and wastewater treatment plant effluents, all of which represent continuous anthropogenic sources of microplastics to freshwater and urban river systems [5,49]. Meanwhile, fragments are generally considered to derive from the breakdown of larger plastic items through physical abrasion, UV-induced photooxidation, and mechanical fragmentation processes contribute to the formation of smaller plastic particles [3]. The consistently low proportion of pellets suggests limited industrial plastic resin inputs within the studied river corridor.
The statistical analysis indicated no significant seasonal difference in microplastic shape composition (p = 0.261), suggesting that the relative proportions of shape categories remained relatively stable between the dry and wet seasons despite seasonal hydrological fluctuations. In contrast, significant spatial differences were detected during both the dry season (p < 0.001) and wet season (p = 0.001), demonstrating that shape composition varied along the urban–peri-urban–rural gradient. The strong dominance of fibers in urban areas and fragments in peri-urban areas during the dry season suggests that local anthropogenic activities, waste management practices, and environmental degradation processes play important roles in shaping microplastic morphology. Although regional differences became less pronounced during the wet season, spatial heterogeneity remained evident, indicating that source-related influences persisted even under higher-flow conditions.
Overall, the results indicate that microplastic shape composition in the Can Tho River is characterized by persistent fiber dominance across both spatial and seasonal gradients. While seasonal variation was limited, significant spatial differences were observed among urban, peri-urban, and rural regions, highlighting the influence of local anthropogenic sources and environmental processes on microplastic morphology within the river system.

3.2.2. Color: Seasonal and Spatial Variation

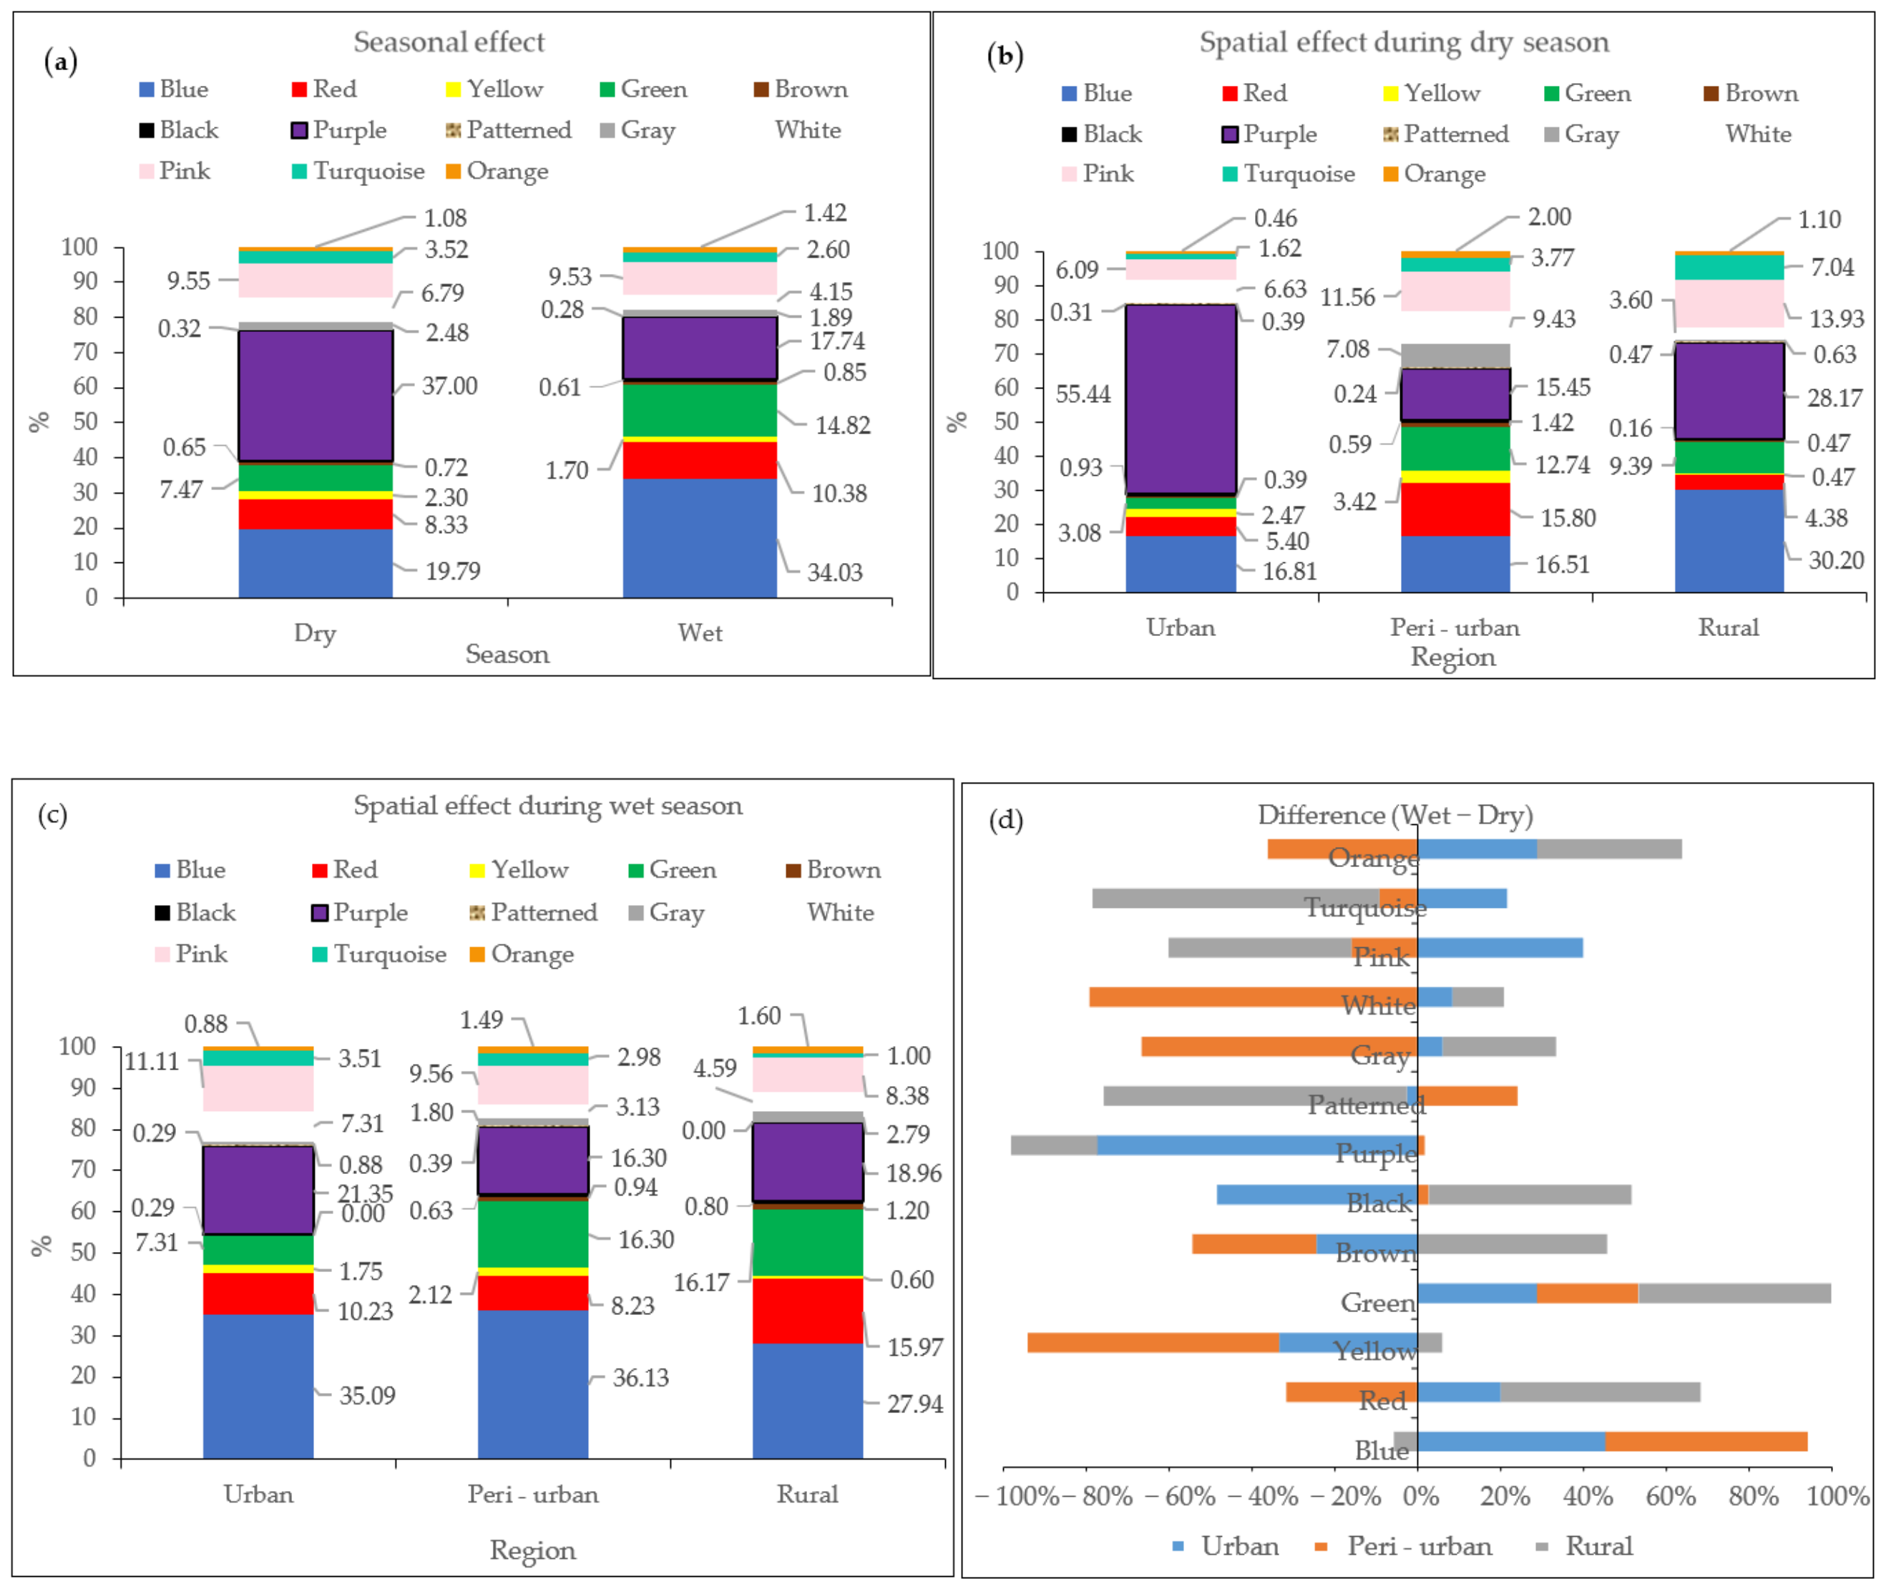
Microplastic color composition in the Can Tho River exhibited clear seasonal and spatial variability, with statistically significant differences observed between seasons and among regions during both hydrological periods (Figure 8a–d). Overall, blue, purple, and green particles were the dominant color categories across all samples, whereas yellow, orange, patterned, and pink particles contributed only minor proportions. The predominance of darker and visually weathered colors suggests prolonged environmental exposure, fragmentation, discoloration, and aging processes occurring during river transport and environmental weathering.
Seasonally, the relative composition of microplastic colors differed significantly between the dry and wet seasons (Pearson χ2 = 339.554, p < 0.001; Figure 8a). Blue particles were dominant in both seasons and increased markedly from 19.79% in the dry season to 34.03% in the wet season. Similarly, green particles increased from 7.47% to 14.82%, while red particles rose moderately from 8.33% to 10.38% during the wet season. In contrast, purple particles showed a substantial decline, decreasing from 37.00% in the dry season to 17.74% in the wet season. White and gray particles contributed moderate proportions in both seasons, whereas yellow, orange, patterned, and pink particles consistently remained below 5%. The higher abundance of blue and green particles during the wet season may reflect enhanced stormwater runoff and sediment resuspension processes that mobilize textile fibers, packaging materials, and household plastic debris from urban surfaces and drainage networks into the river. Conversely, the dominance of purple particles during the dry season may indicate localized accumulation under low-flow conditions with weaker dilution and reduced downstream transport.
Spatial differences in color composition were also evident among urban, peri-urban, and rural regions during both seasons. In the dry season (Pearson χ2 = 664.067, p < 0.001; Figure 8b), purple particles strongly dominated the urban region (55.44%), whereas blue particles accounted for a relatively lower proportion (16.81%). Rural areas displayed a more balanced composition, with blue (30.20%) and purple particles (28.17%) contributing similarly. In contrast, the peri-urban region showed the highest compositional heterogeneity, characterized by elevated proportions of green (12.74%), red (15.80%), and gray particles (15.45%). This pattern suggests mixed microplastic inputs derived from residential discharge, roadside runoff, and transitional land-use activities. During the wet season (Pearson χ2 = 84.255, p < 0.001; Figure 8c), blue particles became dominant across all regions, accounting for 35.09% in urban areas, 36.13% in peri-urban areas, and 27.94% in rural areas. Purple particles remained important but decreased considerably compared with the dry season. Green particles increased notably in peri-urban (16.30%) and rural regions (16.17%), while white particles became more abundant in rural areas (8.38%). These results suggest that wet-season hydrodynamics may enhance redistribution, mixing, and downstream transport of microplastics along the urban–rural gradient.
The observed color patterns also provide insight into potential emission sources and environmental transformation processes. Blue and green particles are commonly associated with synthetic textiles, fishing ropes, household plastics, and packaging materials, whereas transparent and white particles are frequently linked to degraded films and consumer plastic products. Black and gray particles may originate from tire wear, urban road dust, and weathered fragments exposed to sunlight and oxidation. The increase in bright or mixed colors during the wet season suggests enhanced transport of newly introduced debris through stormwater runoff and drainage discharge. Similar observations have been reported in riverine systems worldwide, where microplastic color composition may reflect the combined influence of hydrological transport processes, weathering-induced fragmentation, and local anthropogenic sources. According to Wang et al. [50], microplastic particles in aquatic environments exhibit considerable color variability associated with diverse emission sources, including textile fibers, packaging materials, and fishing-related plastics, while microplastic distribution in riverine systems is strongly influenced by hydrological conditions, seasonal runoff, and local anthropogenic activities. Gutiérrez-Rial et al. [40] demonstrated that rainfall, river flow, and runoff from urban and agricultural areas significantly affected the transport and spatial distribution of microplastics in rivers, particularly during wet periods. The microplastics detected were predominantly fragments, suggesting that secondary microplastics derived from degraded plastic waste were the dominant form in the studied urban rivers. Environmental weathering and long-term persistence were reported to promote fragmentation and increase the adsorption capacity of contaminants onto microplastic particles [51]. Previous studies have shown that prolonged environmental weathering and photooxidative degradation can modify microplastic color characteristics during transport, whereas aging processes may also enhance the adsorption of contaminants onto microplastic surfaces [52].
To further examine the interaction between season and region, interseasonal percentage changes (Δ% = Wet − Dry) in color composition were analyzed across urban, peri-urban, and rural regions (Figure 8d). The Δ% analysis revealed strong regional differences in both the magnitude and direction of seasonal compositional shifts, indicating that the influence of seasonal hydrology on microplastic color composition was spatially heterogeneous rather than uniform along the river continuum.
Among the three regions, the peri-urban area exhibited the strongest seasonal fluctuations, with substantial increases and decreases across multiple color categories. Blue particles showed the largest increase during the wet season, accompanied by notable increases in orange and patterned particles, whereas yellow, white, and gray particles decreased markedly. This pronounced compositional turnover suggests that peri-urban environments are highly sensitive to rainfall-driven runoff and hydrological redistribution processes. The transitional nature of peri-urban land use, which combines residential zones, small-scale industries, transportation corridors, and open drainage systems, may generate highly variable microplastic inputs during storm events.
The rural region also exhibited considerable seasonal variation, particularly through substantial increases in green, red, black, and brown particles during the wet season. In contrast, turquoise, pink, and purple particles declined sharply. The increase in darker and more weathered particle colors during the wet season may reflect enhanced downstream transport and resuspension of aged plastics originating from upstream urbanized areas. These findings suggest that rural regions may behave as temporary depositional zones where hydrodynamic conditions favor the accumulation of transported particles during periods of high discharge.
Compared with peri-urban and rural regions, the urban region showed relatively moderate seasonal shifts overall, although several individual colors displayed distinct trends. Blue, pink, and turquoise particles increased during the wet season, while purple and yellow particles decreased substantially. The comparatively smaller compositional change in urban areas suggests that continuous year-round inputs from wastewater discharge, domestic activities, and urban drainage systems may reduce the relative influence of seasonal hydrological fluctuations.
The strong regional differences in Δ% values indicate that seasonal changes in microplastic color composition are closely linked to land-use characteristics and hydrodynamic connectivity. Regions characterized by mixed land use and complex drainage networks, particularly peri-urban areas, experienced the greatest seasonal redistribution of colored microplastics. Similar findings have been reported in tropical and urban river systems, where rainfall-driven runoff and stormwater discharge can modify the composition and transport pathways of microplastic particles [12,14]. In addition, the increase in microplastic particles during runoff-event conditions is consistent with previous studies showing that hydrologic processes and turbulent river flow can enhance the transport and redistribution of plastics in freshwater systems [13].
Overall, the results demonstrate significant seasonal and spatial variation in microplastic color composition within the Can Tho River, highlighting the combined influence of hydrological conditions and regional land-use characteristics. Peri-urban regions experienced the strongest seasonal compositional shifts, followed by rural areas, whereas urban regions displayed comparatively more stable color distributions. These findings emphasize the important role of transitional land-use zones as dynamic interfaces influencing, transformation, and transport of riverine microplastics.

3.2.3. Size: Seasonal and Spatial Variation

Microplastic particles were classified into five size categories (<250 µm, 250–500 µm, 500–750 µm, 750–1000 µm, and >1000 µm) based on the actual measured particle dimensions obtained from microscopic image analysis. Although a 250 µm sieve was used during sample processing, particles with measured dimensions below 250 µm were occasionally observed because irregular fragments, films, and especially elongated fibers may be retained on the sieve due to their morphology, orientation, or attachment to larger particles or organic residues. The subdivision of intermediate classes was intended to improve the resolution of size-distribution analysis and to facilitate the evaluation of fragmentation patterns, transport behavior, and hydrodynamic sorting processes along the river system. This classification approach was data-driven and adapted to the observed particle-size distribution in the present study to reflect the analytical detection range and ensure a balanced representation among size categories. Similar size-based classification approaches have been widely applied in previous microplastic studies investigating environmental occurrence and particle transport dynamics [22,53,54,55].
Although 250 µm and 1000 µm sieves were used during sample processing, measured particle dimensions outside these nominal sieve thresholds were still observed during microscopic analysis. This discrepancy reflects the fact that sieve retention is controlled not only by particle length but also by morphology, width, flexibility, orientation, and entanglement with other particles or organic matter, particularly for fibers and films. This discrepancy may be related to the heterogeneous morphology of microplastic particles, particularly elongated fibers, films, and irregular fragments, which can influence their retention and recovery during sieving and filtration procedures. In addition, previous studies have noted that mesh size, sample composition, and the presence of organic debris may affect particle separation and abundance estimates during sample processing [23,53].
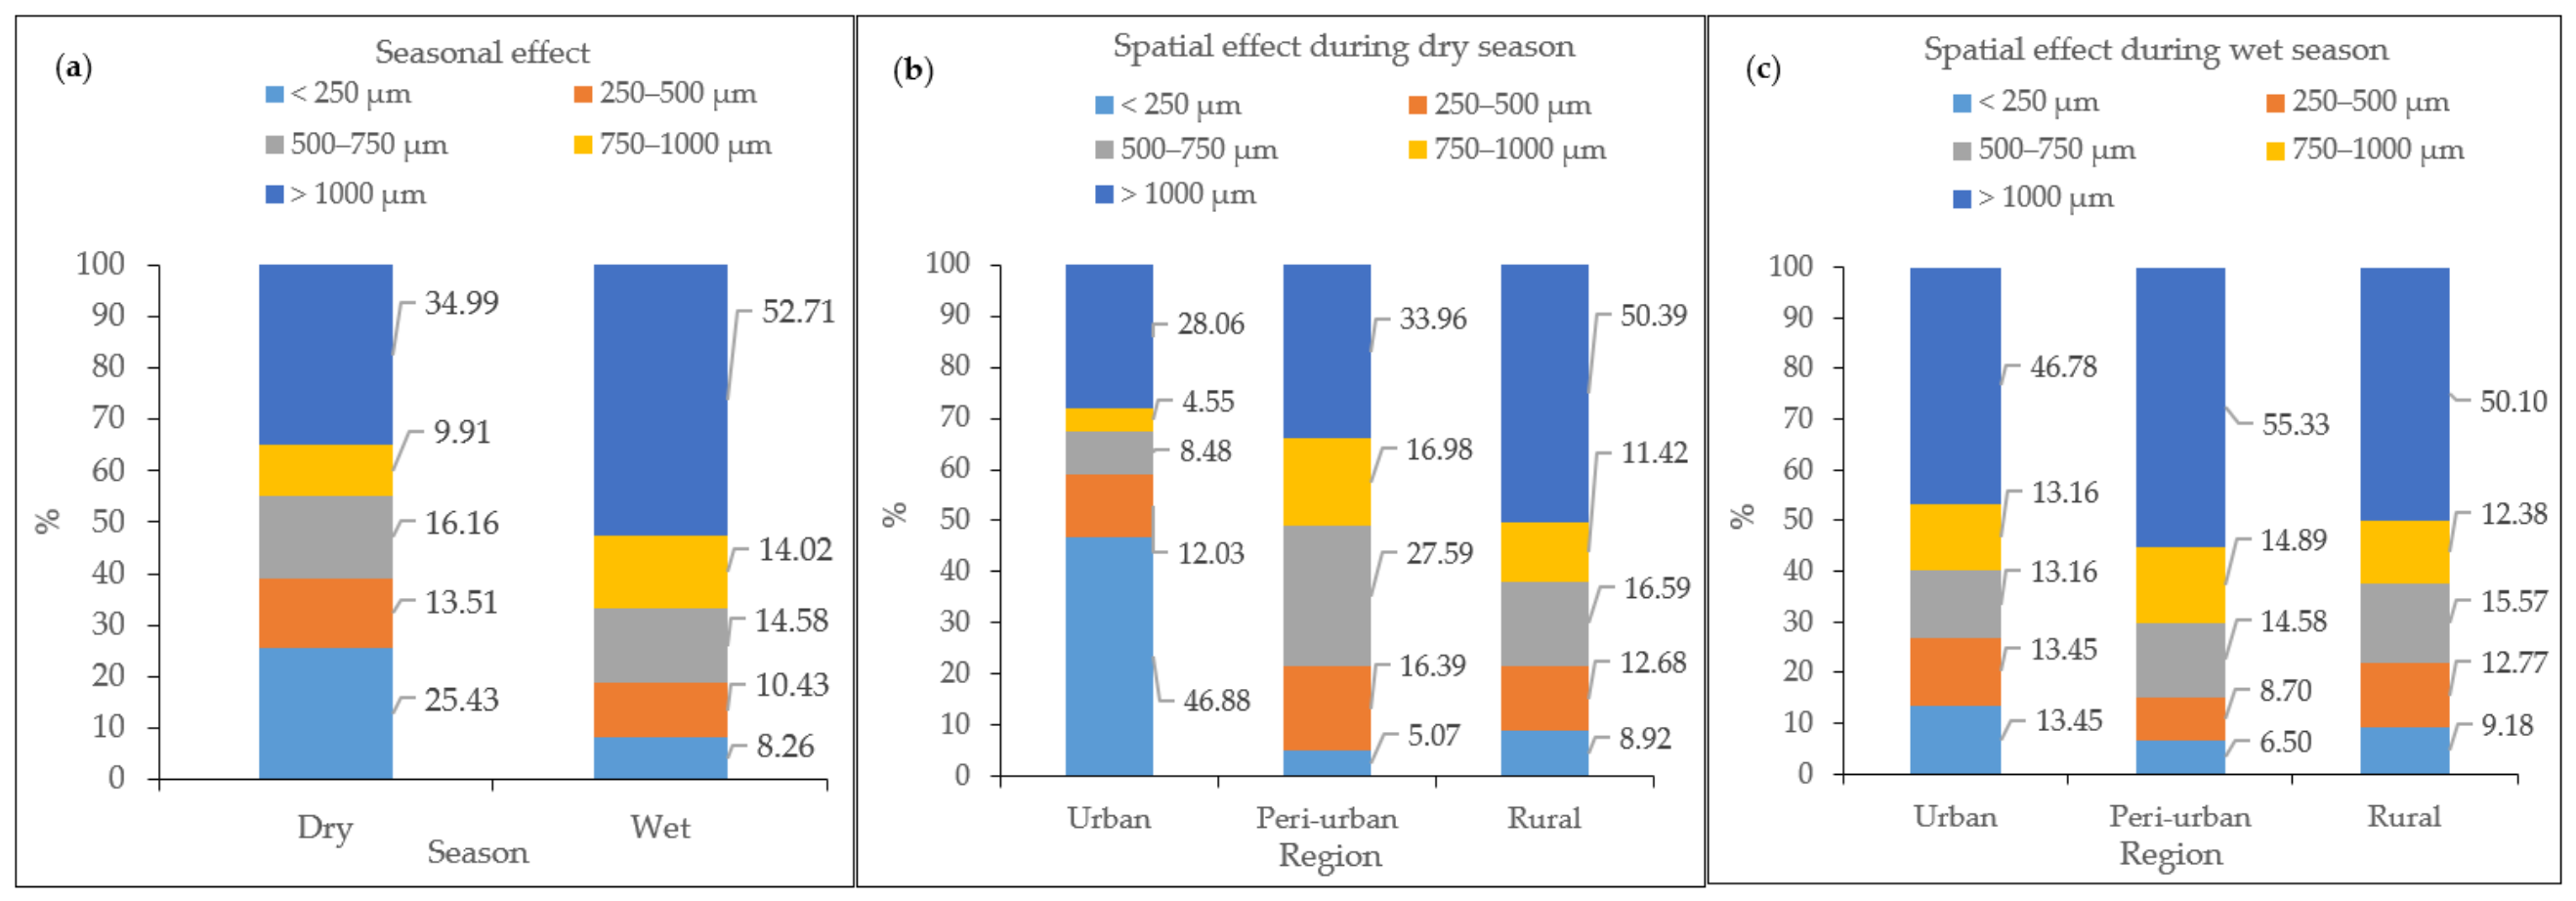
Microplastic size composition in the Can Tho River exhibited clear seasonal and spatial variability, with statistically significant differences observed between seasons and among regions during both hydrological periods (Figure 9a–c). Overall, particles larger than 1000 µm constituted the dominant size class across all samples, followed by intermediate classes ranging from 500–1000 µm, whereas particles smaller than 250 µm generally accounted for the lowest proportions. The predominance of larger particles suggests substantial contributions from elongated fibers and partially degraded plastic debris, while the continued presence of smaller particles reflects ongoing fragmentation and weathering processes within the river system. Microplastic size distribution is an important descriptor because particle size may influence environmental behavior, fragmentation patterns, and environmental fate [23,56].
Seasonally, microplastic size composition differed significantly between the dry and wet seasons (Pearson χ2 = 314.304, p < 0.001; Figure 9a). During the dry season, particles >1000 µm dominated the assemblage (34.99%), followed by <250 µm particles (25.43%), while intermediate fractions of 250–500 µm, 500–750 µm, and 750–1000 µm contributed 13.51%, 16.16%, and 9.91%, respectively. In contrast, the wet season exhibited a marked increase in the proportion of particles >1000 µm (52.71%), whereas particles <250 µm declined substantially to 8.26%. Intermediate size classes remained relatively stable, accounting for approximately 10–15% of total particles. These findings suggest that hydrological conditions may influence particle-size composition. The increased dominance of larger particles during the wet season may reflect enhanced mobilization and downstream transport of elongated fibers and buoyant debris introduced by stormwater runoff and riverbank inputs. Conversely, the higher proportion of smaller particles during the dry season suggests greater local accumulation and prolonged fragmentation under low-flow conditions. Similar seasonal shifts in microplastic size composition have been reported in tropical and urban rivers, where rainfall-driven hydrodynamics alter transport efficiency, resuspension, and deposition processes [57,58].
The observed size ranges further support these interpretations. In the dry season, particle lengths ranged from 13.5 µm to 8401.1 µm, whereas in the wet season the range narrowed slightly from 25.8 µm to 6447 µm. The occurrence of particles substantially larger than the nominal 1000 µm sieve size reflects the influence of particle morphology, particularly elongated fibers whose retention depends primarily on particle width rather than total length. Similarly, the presence of particles smaller than 250 µm likely resulted from irregular orientation, entanglement with larger particles or organic matter, and retention during filtration procedures. The observed occurrence of fibres and fragments across different size ranges may reflect the influence of particle morphology and the methodological limitations associated with filtration and separation procedures. Previous studies have noted that the recovery and quantification of microplastics can be affected by sediment characteristics, filtration efficiency, and the lack of standardized analytical methods [53,59].
Spatially, microplastic size composition also differed significantly among urban, peri-urban, and rural regions during both seasons. During the dry season (Pearson χ2 = 708.141, p < 0.001; Figure 9b), the urban region was characterized by a high proportion of particles <250 µm (46.88%), indicating substantial fragmentation and weathering under relatively stagnant hydrological conditions. In contrast, peri-urban and rural regions were dominated by particles >1000 µm, accounting for 33.96% and 50.39%, respectively. The peri-urban region also exhibited elevated proportions of 750–1000 µm particles (16.98%), suggesting mixed inputs from residential activities, roadside runoff, and transitional land-use areas. During the wet season (Pearson χ2 = 32.964, p < 0.001; Figure 9c), particles >1000 µm remained dominant across all regions, contributing 46.78% in urban areas, 55.33% in peri-urban areas, and 50.10% in rural areas. Smaller particles (<250 µm) decreased markedly in all regions, particularly in peri-urban areas (6.50%). These results suggest that wet-season hydrodynamics may preferentially transport and redistribute larger buoyant particles along the river continuum, while smaller particles may remain suspended, disperse downstream, or undergo dilution.
Regional differences in particle-size ranges also revealed distinct transport and accumulation characteristics. In urban areas, particle sizes ranged from 13.5–6392.12 µm during the dry season and 32.19–6237.45 µm during the wet season, reflecting continuous inputs from domestic wastewater, urban drainage, and fragmented consumer plastics. Peri-urban regions exhibited ranges of 20.82–5046.6 µm (dry season) and 25.80–6049.49 µm (wet season), suggesting highly dynamic transport conditions influenced by mixed land use and stormwater connectivity. Rural areas showed the broadest size range, particularly during the dry season (45.76–8401.1 µm), indicating downstream accumulation of large, elongated particles transported from upstream urbanized zones. The persistence of large particles in rural regions may also reflect lower turbulence and greater depositional stability under reduced anthropogenic disturbance. Similar spatial trends have been observed in other riverine systems, where downstream urban and suburban river reaches may act as accumulation zones for microplastic fragments transported from densely populated areas. Previous studies have shown that weathered and fragmented microplastics are commonly associated with sediment deposition and spatial variability along river systems [60,61].
From an ecological perspective, the dominance of larger particles (>1000 µm) suggests that many microplastics in the Can Tho River may still represent relatively early or intermediate stages of fragmentation. However, the substantial occurrence of particles < 250 µm, particularly in urban areas during the dry season, is environmentally important because smaller microplastic particles are more readily ingested by aquatic organisms because their size resembles natural food items, while their large surface area and hydrophobicity enhance their capacity to accumulate hazardous chemicals [55,56]. Seasonal hydrology therefore may influence not only the abundance of microplastics but also their ecological behavior and transport pathways within the river system.
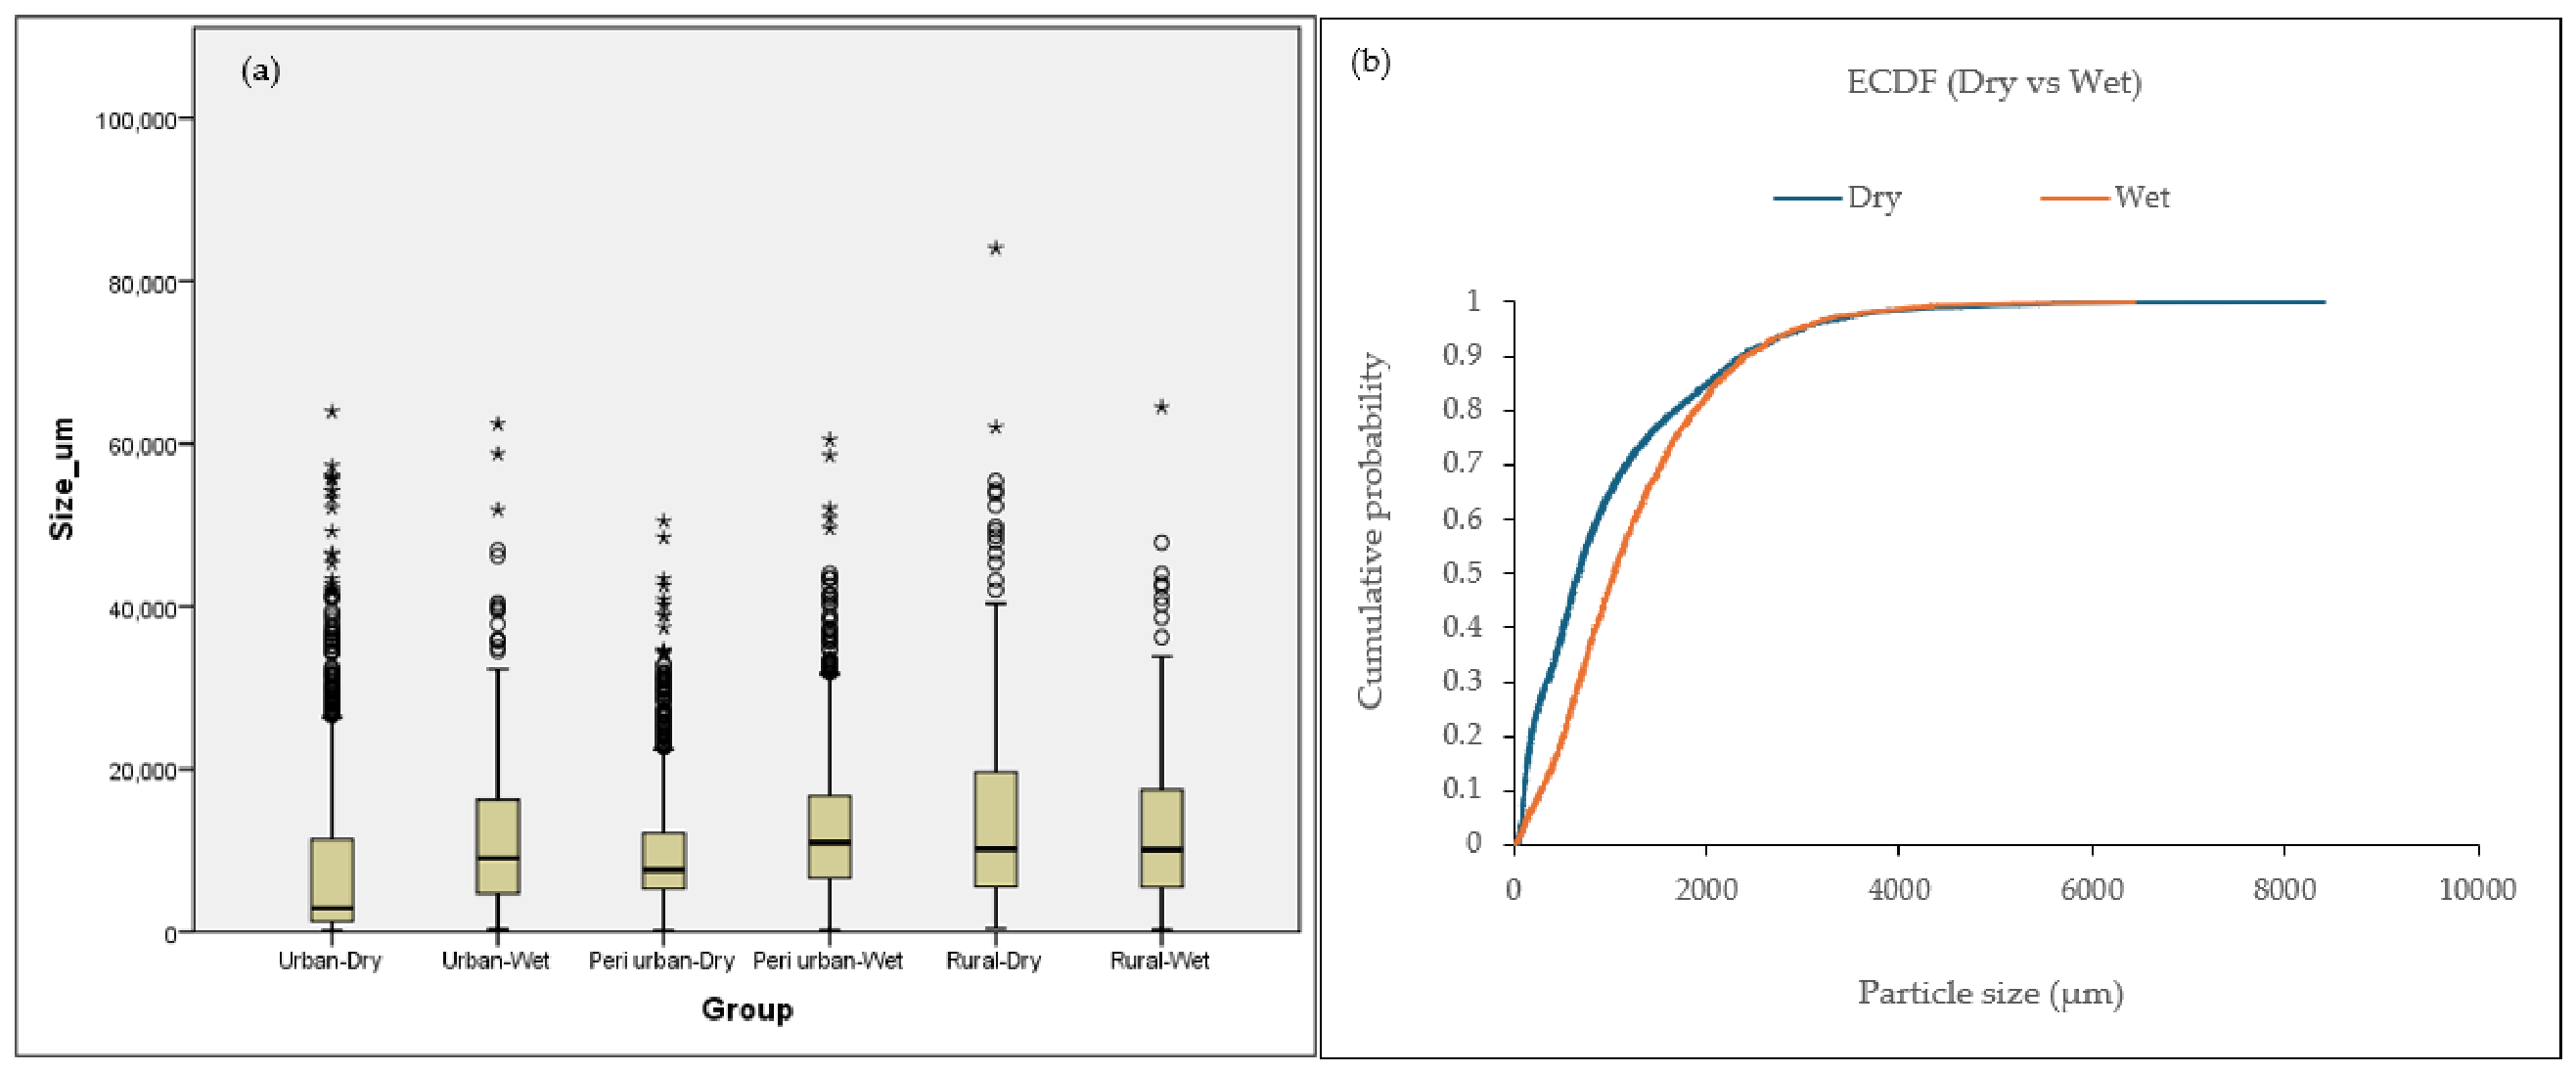
To further explore particle-size variability beyond categorical size classes, continuous particle-size distributions were analyzed using boxplots and empirical cumulative distribution functions (ECDFs) (Figure 10). The boxplots (Figure 10a) revealed strongly right-skewed distributions across all region–season combinations, indicating that small particles dominated the microplastic assemblages, whereas larger particles occurred less frequently but contributed to extended upper tails. Median particle sizes were generally higher during the wet season than during the dry season within the urban and peri-urban regions, suggesting seasonal shifts in particle-size structure. In contrast, rural sites exhibited relatively similar median sizes between seasons, although greater variability was observed during the dry season. The presence of numerous outliers in all groups further indicates a broad size spectrum and highlights the heterogeneous nature of microplastic inputs and fragmentation processes in the river system.
The ECDF analysis (Figure 10b) provided additional evidence of seasonal differences in particle-size distributions. The dry-season curve was shifted to the left relative to the wet-season curve, indicating a higher proportion of smaller particles during low-flow conditions. Conversely, the rightward displacement of the wet-season curve suggests that larger particles were relatively more common during the wet season. This pattern is consistent with the influence of hydrological processes, whereby increased discharge and runoff during the wet season may mobilize and transport larger plastic debris and partially fragmented materials from surrounding catchments into the river. In contrast, reduced flow conditions during the dry season may favor the accumulation and persistence of smaller particles derived from ongoing fragmentation and local urban sources.
These continuous-size analyses complement the categorical size-class results presented in Figure 9 and suggest that seasonal hydrological conditions may influence not only microplastic abundance and density but also particle-size structure. Together, the results suggest that microplastic transport and retention in the Can Tho River may be size-dependent processes influenced by the combined effects of source inputs, fragmentation, dilution, resuspension, and hydrodynamic sorting.
Overall, both categorical and continuous analyses revealed distinct spatial and seasonal patterns in microplastic size distributions. Although smaller particles dominated in all regions and seasons, continuous-size analyses indicated a tendency toward larger particle sizes during the wet season. These findings suggest that hydrological processes regulate not only the abundance and density of microplastics but also their size structure, emphasizing the importance of integrating both categorical and continuous approaches when assessing microplastic dynamics in riverine environments.

4. Conclusions

Microplastics were detected at all sampling sites along the Can Tho River during both dry and wet seasons, indicating widespread and continuous plastic contamination throughout the river system. Although seasonal differences in overall abundance and density were not consistently significant at the basin scale, clear spatial heterogeneity was observed, with urban and peri-urban regions showing greater variability and stronger hydrological influence than rural areas. These patterns suggest that seasonal hydrological processes and local anthropogenic activities may contribute to the redistribution and accumulation of microplastics within the river system.
Fibers and fragments were the dominant microplastic shapes, while blue, purple, and green particles were the most common color categories, suggesting possible contributions from domestic wastewater, textile-related sources, and degraded plastic debris. Particles >1000 µm dominated the overall size composition, whereas smaller particles remained widely distributed throughout the river system, suggesting ongoing fragmentation and weathering of plastic debris. Continuous particle-size analyses using boxplots and empirical cumulative distribution functions (ECDFs) further indicated broadly similar size distributions between seasons, supporting the patterns observed in the categorical size-class analysis.
Overall, the study suggests that urbanization, land-use characteristics, and seasonal hydrodynamics may contribute to the observed spatial and temporal patterns of microplastic pollution in the Can Tho River. Peri-urban zones were identified as dynamic transitional areas with the strongest seasonal fluctuations, while rural regions showed patterns consistent with downstream accumulation zones. These findings provide important baseline information for understanding microplastic transport and supporting future management strategies in tropical urban rivers. Although the present study provides important baseline information on the occurrence and distribution of microplastics in the Can Tho River, polymer composition was not verified using spectroscopic techniques. Future studies should therefore incorporate micro-FTIR or Raman spectroscopy to confirm polymer identity, reduce classification uncertainty, and improve the robustness of microplastic assessments, while also investigating sediment–water interactions and ecological risks in tropical urban river systems.

Author Contributions

Conceptualization: N.T.T., P.V.T., K.L. and P.K.; Methodology: N.T.T., P.V.T., K.L. and N.V.C.N.; Formal Analysis: N.T.T., K.L., V.T.T., N.V.T. and L.T.K.N.; Sample collection and analysis: N.T.T., P.V.T., V.T.T., L.T.K.N., N.V.T. and H.V.T.M.; Resources: N.T.T., K.L., N.V.C.N., L.T.K.N. and V.T.T.; Writing—original draft preparation: N.T.T., P.V.T., H.V.T.M., K.L. and P.K.; Writing—review and editing: N.V.C.N., P.V.T., V.T.T., L.T.K.N., N.V.T. and P.K. All authors have read and agreed to the published version of the manuscript.

Funding

This research was funded by Can Tho University under the research program CTCS2024-06, through sub-project CTCS2024-06-03.

Institutional Review Board Statement

Not applicable.

Data Availability Statement

The data presented in this study are available from the corresponding author upon reasonable request.

Conflicts of Interest

The authors declare no conflicts of interest.

References

  1. Geyer, R.; Jambeck, J.R.; Law, K.L. Production, use, and fate of all plastics ever made. Sci. Adv. 2017, 3, e1700782. [Google Scholar] [CrossRef] [PubMed]
  2. PlasticsEurope. Plastics the Fast Facts 2025. Available online: https://plasticseurope.org/wp-content/uploads/2025/09/PE_TheFacts_25_digital-1pager-scrollable.pdf (accessed on 15 March 2026).
  3. Andrady, A.L. Microplastics in the marine environment. Mar. Pollut. Bull. 2011, 62, 1596–1605. [Google Scholar] [CrossRef] [PubMed]
  4. Wagner, M.; Scherer, C.; Alvarez-Muñoz, D.; Brennholt, N.; Bourrain, X.; Buchinger, S.; Fries, E.; Grosbois, C.; Klasmeier, J.; Marti, T.; et al. Microplastics in freshwater ecosystems: What we know and what we need to know. Environ. Sci. Eur. 2014, 26, 12. [Google Scholar] [CrossRef] [PubMed]
  5. Li, J.; Liu, H.; Chen, J.P. Microplastics in freshwater systems: A review on occurrence, environmental effects, and methods for microplastics detection. Water Res. 2018, 137, 362–374. [Google Scholar] [CrossRef] [PubMed]
  6. Li, D.; Li, P.; Shi, Y.; Sheerin, E.D.; Zhang, Z.; Yang, L.; Xiao, L.; Hill, C.; Gordon, C.; Ruether, M.; et al. Stress-Induced Phase Separation in Plastics Drives the Release of Amorphous Polymer Micropollutants into Water. Nat. Commun. 2025, 16, 3814. [Google Scholar] [CrossRef] [PubMed]
  7. Lebreton, L.C.M.; van der Zwet, J.; Damsteeg, J.-W.; Slat, B.; Andrady, A.; Reisser, J. River plastic emissions to the world’s oceans. Nat. Commun. 2017, 8, 15611. [Google Scholar] [CrossRef] [PubMed]
  8. Schmidt, C.; Krauth, T.; Wagner, S. Export of plastic debris by rivers. Environ. Sci. Technol. 2017, 51, 12246–12253. [Google Scholar] [CrossRef] [PubMed]
  9. Eerkes-Medrano, D.; Thompson, R.C.; Aldridge, D.C. Microplastics in freshwater systems: A review of the emerging threats, identification of knowledge gaps and prioritisation of research needs. Water Res. 2015, 75, 63–82. [Google Scholar] [CrossRef] [PubMed]
  10. Rochman, C.M.; Hoh, E.; Kurobe, T.; Teh, S.J. Ingested plastic transfers hazardous chemicals to fish and induces hepatic stress. Sci. Rep. 2013, 3, 3263. [Google Scholar] [CrossRef] [PubMed]
  11. Wright, S.L.; Thompson, R.C.; Galloway, T.S. The physical impacts of microplastics. Environ. Pollut. 2013, 178, 483–492. [Google Scholar] [CrossRef] [PubMed]
  12. Dris, R.; Gasperi, J.; Rocher, V.; Saad, M.; Renault, N.; Tassin, B. Microplastic contamination in an urban area: A case study in Greater Paris. Environ. Chem. 2015, 12, 592–599. [Google Scholar] [CrossRef]
  13. Baldwin, A.K.; Corsi, S.R.; Mason, S.A. Plastic debris in 29 Great Lakes tributaries. Environ. Sci. Technol. 2016, 50, 10377–10385. [Google Scholar] [CrossRef] [PubMed]
  14. Hurley, R.R.; Woodward, J.C.; Rothwell, J.J. Microplastic contamination of riverbeds significantly reduced by catchment-wide flooding. Nat. Geosci. 2018, 11, 251–257. [Google Scholar] [CrossRef]
  15. van Emmerik, T.; de Lange, S.; Frings, R.; Schreyers, L.; Aalderink, H.; Leusink, J.; Begemann, F.; Hamers, E.; Hauk, R.; Janssens, N.; et al. Hydrology as a driver of floating river plastic transport. Earths Future 2022, 10, e2022EF002811. [Google Scholar] [CrossRef]
  16. Casella, C.; Vadivel, D.; Dondi, D. The Current Situation of the Legislative Gap on Microplastics (MPs) as New Pollutants for the Environment. Water Air Soil Pollut. 2024, 235, 778. [Google Scholar] [CrossRef]
  17. van Emmerik, T.; Frings, R.; Schreyers, L.; Hauk, R.; de Lange, S.; Mellink, Y. River plastic during floods: Increased mobilization, limited river-scale dispersion. Res. Sq. 2022. [Google Scholar] [CrossRef] [PubMed]
  18. Wang, W.; Ndungu, A.W.; Li, Z.; Wang, J. Microplastics pollution in inland freshwaters of China: A case study in urban surface waters of Wuhan, China. Sci. Total Environ. 2017, 575, 1369–1374. [Google Scholar] [CrossRef] [PubMed]
  19. Scopetani, C.; Martellini, T.; Campos, D. Editorial for the Special Issue “Micro-plastics in Aquatic Environments: Occurrence, Distribution and Effects”. Toxics 2022, 10, 407. [Google Scholar] [CrossRef] [PubMed]
  20. Lin, H.-T.; Schneider, F.; Aziz, M.A.; Wong, K.Y.; Arunachalam, K.D.; Praveena, S.M.; Sethupathi, S.; Chong, W.C.; Nafisyah, A.L.; Parthasarathy, P.; et al. Microplastics in Asian rivers: Geographical distribution, most detected types, and inconsistency in methodologies. Environ. Pollut. 2024, 349, 123985. [Google Scholar] [CrossRef] [PubMed]
  21. Browne, M.A.; Crump, P.; Niven, S.J.; Teuten, E.; Tonkin, A.; Galloway, T.; Thompson, R. Accumulation of microplastic on shorelines worldwide: Sources and sinks. Environ. Sci. Technol. 2011, 45, 9175–9179. [Google Scholar] [CrossRef] [PubMed]
  22. Acharya, S.; Rumi, S.S.; Hu, Y.; Abidi, N. Microfibers from synthetic textiles as a major source of microplastics in the environment: A review. Text. Res. J. 2021, 91, 2136–2156. [Google Scholar] [CrossRef]
  23. Hidalgo-Ruz, V.; Gutow, L.; Thompson, R.C.; Thiel, M. Microplastics in the marine environment: A review of the methods used for identification and quantification. Environ. Sci. Technol. 2012, 46, 3060–3075. [Google Scholar] [CrossRef] [PubMed]
  24. Lebreton, L.; Andrady, A. Future scenarios of global plastic waste generation. Palgrave Commun. 2019, 5, 6. [Google Scholar] [CrossRef]
  25. Strady, E.; Dang, T.H.; Dao, T.D.; Dinh, H.N.; Do, T.T.D.; Duong, T.N.; Duong, T.T.; Hoang, D.A.; Kieu-Le, T.C.; Le, T.P.Q.; et al. Baseline assessment of microplastic concentrations in marine and freshwater environments of a developing Southeast Asian country, Viet Nam. Mar. Pollut. Bull. 2021, 162, 111870. [Google Scholar] [CrossRef] [PubMed]
  26. Mendrik, F.; Hackney, C.R.; Cumming, V.M.; Waller, C.; Hak, D.; Dorrell, R.; Hung, N.N.; Parsons, D.R. The transport and vertical distribution of microplastics in the Mekong River, SE Asia. J. Hazard. Mater. 2025, 484, 136762. [Google Scholar] [CrossRef] [PubMed]
  27. Kieu-Le, T.-C.; Thuong, Q.-T.; Truong, T.-N.-S.; Le, T.-M.-T.; Tran, Q.-V.; Strady, E. Baseline concentration of microplastics in surface water and sediment of the northern branches of the Mekong River Delta, Vietnam. Mar. Pollut. Bull. 2023, 187, 114605. [Google Scholar] [CrossRef] [PubMed]
  28. Thinh, N.D.; Thu, T.T.L.; Tuyen, M.Q.; Manh, L.D.; Hiep, N.T. Study on the microplastic pollution in surface water and sediments in the Tien River basin, Mekong Delta, Vietnam. J. Trop. Sci. Technol. 2024, 35, 71–81. (In Vietnamese) [Google Scholar]
  29. General Statistics Office. Statistical Yearbook of Vietnam 2020; Statistical Publishing House: Hanoi, Vietnam, 2021; ISBN 978-604-75-1873-9. Available online: https://www.nso.gov.vn/wp-content/uploads/2021/07/Sach-NGTK-2020Ban-quyen.pdf (accessed on 15 March 2026). (In Vietnamese)
  30. World Bank. Resilient Shores: Vietnam’s Coastal Development Between Opportunity and Disaster Risk; World Bank: Washington, DC, USA, 2021; Available online: https://openknowledge.worldbank.org/server/api/core/bitstreams/804794da-73c5-5ce0-9f02-e2ea550327f9/content (accessed on 15 March 2026).
  31. Jambeck, J.R.; Geyer, R.; Wilcox, C.; Siegler, T.R.; Perryman, M.; Andrady, A.; Narayan, R.; Law, K.L. Plastic waste inputs from land into the ocean. Science 2015, 347, 768–771. [Google Scholar] [CrossRef] [PubMed]
  32. Department of Grassroots Information and External Information, Ministry of Culture, Sports and Tourism. Can Tho Weather Forecast: Detailed Variations in Temperature, Rainfall, and Humidity. 2025. Available online: https://www.vietnam.vn/du-bao-thoi-tiet-can-tho-bien-dong-nhiet-do-luong-mua-va-do-am-chi-tiet (accessed on 15 March 2026). (In Vietnamese)
  33. WeatherSpark. Average Weather in Can Tho, Vietnam, Year Round. Available online: https://vi.weatherspark.com/y/115861/Th%E1%BB%9Di-Ti%E1%BA%BFt-Trung-B%C3%ACnh-%E1%BB%9F-C%E1%BA%A7n-Th%C6%A1-Vi%E1%BB%87t-Nam-Quanh-N%C4%83m (accessed on 15 March 2026). (In Vietnamese)
  34. Institute of Coastal and Offshore Engineering. Tide Table Forecast for 2025; Institute of Coastal and Offshore Engineering: Ho Chi Minh City, Vietnam, 2025. (In Vietnamese) [Google Scholar]
  35. General Oceanics, Inc. 2030 and 2031 Series Mechanical and Electronic Digital Flowmeter Operators Manual. 2018. Available online: https://www.generaloceanics.com/media/hexaattachment/products/attachments/2030_MANUAL.pdf (accessed on 15 March 2026).
  36. Lin, L.; Wang, J.; Yuan, Z.; Li, H.; Zhao, M.; Li, H.; Gao, N.; Xu, X. Hydrodynamic controls on microplastic transport in the Pearl River Estuary: Insights from seasonal field observations and modeling. Emerg. Contam. 2026, 12, 100638. [Google Scholar] [CrossRef]
  37. Hu, T.-Y.; Kuan, W.-H. Seasonal rainfall and land-use impacts on microplastic characteristics in an endangered salmon stream. Sci. Rep. 2026, 16, 3590. [Google Scholar] [CrossRef] [PubMed]
  38. Klein, S.; Worch, E.; Knepper, T.P. Occurrence and spatial distribution of microplastics in river shore sediments of the Rhine-Main area in Germany. Environ. Sci. Technol. 2015, 49, 6070–6076. [Google Scholar] [CrossRef] [PubMed]
  39. Nguyen, T.T.; Bui, V.H.; Lebarillier, S.; Vu, T.K.; Wong-Wah-Chung, P.; Fauvelle, V.; Malleret, L. Spatial and seasonal abundance and characteristics of microplastics along the Red River to the Gulf of Tonkin, Vietnam. Sci. Total Environ. 2024, 957, 177778. [Google Scholar] [CrossRef] [PubMed]
  40. Gutiérrez-Rial, D.; Villar, I.; Lagoa, A.; Feijoo, P.; Soto, B.; Garrido, J.; Mato, S. Dynamics of microplastics in urban rivers under varying hydrological regimes. J. Hazard. Mater. 2025, 498, 139843. [Google Scholar] [CrossRef] [PubMed]
  41. Tanaka, M.; Nihei, Y. How flooding rivers deliver plastic to the ocean: A case study of microplastic and mesoplastic load–discharge relationships. Water Res. 2026, 291, 125175. [Google Scholar] [CrossRef] [PubMed]
  42. Treilles, R.; Gasperi, J.; Tramoy, R.; Dris, R.; Gallard, A.; Partibane, C.; Tassin, B. Microplastic and microfiber fluxes in the Seine River: Flood events versus dry periods. Sci. Total Environ. 2021, 805, 150123. [Google Scholar] [CrossRef] [PubMed]
  43. Bai, M.; Lin, Y.; Hurley, R.R.; Zhu, L.; Li, D. Controlling factors of microplastic riverine flux and implications for reliable monitoring strategy. Environ. Sci. Technol. 2022, 56, 48–61. [Google Scholar] [CrossRef] [PubMed]
  44. Kumar, R.; Sharma, P.; Verma, A.; Jha, P.K.; Singh, P.; Gupta, P.K.; Chandra, R.; Prasad, P.V.V. Effect of physical characteristics and hydrodynamic conditions on transport and deposition of microplastics in riverine ecosystem. Water 2021, 13, 2710. [Google Scholar] [CrossRef]
  45. Stride, B.; Abolfathi, S.; Bending, G.D.; Pearson, J. Quantifying microplastic dispersion due to density effects. J. Hazard. Mater. 2024, 466, 133440. [Google Scholar] [CrossRef] [PubMed]
  46. Xia, F.; Yao, Q.; Zhang, J.; Wang, D. Effects of seasonal variation and resuspension on microplastics in river sediments. Environ. Pollut. 2021, 286, 117403. [Google Scholar] [CrossRef] [PubMed]
  47. Felton, A.; Farner, S.; Day, L.; Gibbs-Huerta, S.E.; Zamarripa, B.; Hutchinson, J. Spatial–temporal characterization of microplastics in the surface water of an urban ephemeral river. Microplastics 2025, 4, 9. [Google Scholar] [CrossRef]
  48. Faruk, M.O.; Chowdhury, K.M.A.; Albin, E.H.C.; Capuano, T.A.; Shreya, S.S.; Lubna, L.S.; Rahman, S.; Tasnim, J. Anthropogenic influences on seasonal microplastic dispersion in the Pasur River of Bangladesh based on field observations and numerical simulation. Discov. Environ. 2026, 4, 111. [Google Scholar] [CrossRef]
  49. Dris, R.; Gasperi, J.; Saad, M.; Mirande, C.; Tassin, B. Synthetic fibers in atmospheric fallout: A source of microplastics in the environment? Mar. Pollut. Bull. 2016, 104, 290–293. [Google Scholar] [CrossRef] [PubMed]
  50. Wang, W.; Ge, J.; Yu, X. Bioavailability and toxicity of microplastics to fish species: A review. Ecotoxicol. Environ. Saf. 2019, 189, 109913. [Google Scholar] [CrossRef] [PubMed]
  51. Samandra, S.; Singh, J.; Plaisted, K.; Mescall, O.J.; Symons, B.; Xie, S.; Ellis, A.V.; Clarke, B.O. Quantifying environmental emissions of microplastics from urban rivers in Melbourne, Australia. Mar. Pollut. Bull. 2023, 189, 114709. [Google Scholar] [CrossRef] [PubMed]
  52. Li, C.; Jiang, B.; Guo, J.; Sun, C.; Shi, C.; Huang, S.; Liu, W.; Wu, C.; Zhang, Y. Aging process of microplastics in the aquatic environments: Aging pathway, characteristic change, compound effect, and environmentally persistent free radicals formation. Water 2022, 14, 3515. [Google Scholar] [CrossRef]
  53. Masura, J.; Baker, J.; Foster, G.; Arthur, C. Laboratory Methods for the Analysis of Microplastics in the Marine Environment: Recommendations for Quantifying Synthetic Particles in Waters and Sediments; NOAA Technical Memorandum NOS-OR&R-48; National Oceanic and Atmospheric Administration (NOAA): Silver Spring, MD, USA, 2015. Available online: https://repository.library.noaa.gov/view/noaa/10296 (accessed on 15 March 2026).
  54. Frias, J.P.G.L.; Nash, R. Microplastics: Finding a consensus on the definition. Mar. Pollut. Bull. 2019, 138, 145–147. [Google Scholar] [CrossRef] [PubMed]
  55. Wang, J.; Liu, X.; Li, Y.; Powell, T.; Wang, X.; Wang, G.; Zhang, P. Microplastics as contaminants in the soil environment: A mini review. Sci. Total Environ. 2020, 691, 848–857. [Google Scholar] [CrossRef] [PubMed]
  56. Hartmann, N.B.; Hüffer, T.; Thompson, R.C.; Hassellöv, M.; Verschoor, A.; Daugaard, A.E.; Wagner, M. Are we speaking the same language? Recommendations for a definition and categorization framework for plastic debris. Environ. Sci. Technol. 2019, 53, 1039–1047. [Google Scholar] [CrossRef] [PubMed]
  57. An, X.; Wang, Y.; Adnan, M.; Li, W.; Zhang, Y. Natural factors of microplastics distribution and migration in water: A review. Water 2024, 16, 1595. [Google Scholar] [CrossRef]
  58. Huang, C.-W.; Li, Y.-L.; Lin, C.; Bui, X.-T.; Vo, T.-D.-H.; Ngo, H.H. Seasonal influence on pollution index and risk of multiple compositions of microplastics in an urban river. Sci. Total Environ. 2023, 859, 160021. [Google Scholar] [CrossRef]
  59. Frias, J.P.G.L.; Gago, J.; Otero, V.; Sobral, P. Microplastics in coastal sediments from southern Portuguese shelf waters. Mar. Environ. Res. 2016, 114, 24–30. [Google Scholar] [CrossRef] [PubMed]
  60. Jolaosho, T.L.; Rasaq, M.F.; Omotoye, E.V.; Araomo, O.V.; Adekoya, O.S.; Abolaji, O.Y.; Hungbo, J.J. Microplastics in freshwater and marine ecosystems: Occurrence, characterization, sources, distribution dynamics, fate, transport processes, potential mitigation strategies, and policy interventions. Ecotoxicol. Environ. Saf. 2025, 294, 118036. [Google Scholar] [CrossRef] [PubMed]
  61. Li, G.; Chen, Z.; Bowen, M.; Coco, G. Transport and retention of sinking microplastics in a well-mixed estuary. Mar. Pollut. Bull. 2024, 203, 116417. [Google Scholar] [CrossRef] [PubMed]
Figure 1. Study area: The orange, yellow, and blue routes represent the urban, peri-urban, and rural study areas, respectively. Sampling sites (S1–S15) are shown using the corresponding colors for each study area.
Microplastics 05 00136 g001
Figure 2. Hourly water levels at the Can Tho hydrological station [34].
Microplastics 05 00136 g002
Figure 3. Seasonal variation in microplastic abundance across sampling sites, including (a) site-level paired changes and (b) distribution comparison. Statistical comparison between dry and wet seasons was performed using the Wilcoxon signed-rank test (n = 15 paired observations, Z = −1.136, p = 0.256). Circles indicate outliers, and asterisks (*) indicate extreme outliers.
Microplastics 05 00136 g003
Figure 4. Spatial variation and seasonal response patterns of microplastic abundance across regions and seasons: (a) distribution by region and season, (b) interaction plot, and (c) interseasonal differences (Δ = Wet − Dry). Spatial differences were evaluated using the Kruskal–Wallis test (dry season: p = 0.756; wet season: p = 0.005). Seasonal comparisons within regions were assessed using the Mann–Whitney U test, with a significant difference detected only in the urban region (p = 0.047). The season × region interaction was not statistically significant (F = 2.793, p = 0.081). Circles indicate outliers, and asterisks (*) indicate extreme outliers.
Microplastics 05 00136 g004
Figure 5. Seasonal variation in microplastic density across sampling sites: (a) paired site-level changes and (b) distribution comparison between dry and wet seasons. Statistical comparison between seasons was performed using the Wilcoxon signed-rank test (n = 15 paired observations, Z = −1.306, p = 0.191). Asterisks (*) indicate extreme outliers.
Microplastics 05 00136 g005
Figure 6. Spatial variation and seasonal response patterns of microplastic density across regions and seasons: (a) distribution by region and season, (b) interaction plot based on mean density values, and (c) inter-seasonal differences (Δ = Wet − Dry) at individual sampling sites. Spatial differences among regions were evaluated using the Kruskal–Wallis test during the dry season (χ2 = 0.620, p = 0.733) and one-way ANOVA during the wet season (F = 5.320, p = 0.022). Seasonal comparisons within regions were assessed using the Mann–Whitney U test, with a significant difference detected only in the urban region (U = 2.0, p = 0.028). The season × region interaction was not statistically significant (F = 2.585, p = 0.096). Circles indicate outliers, and asterisks (*) indicate extreme outliers.
Microplastics 05 00136 g006
Figure 7. Seasonal and spatial distribution of microplastic shape composition in the Can Tho River: (a) seasonal composition during dry and wet seasons, (b) regional composition during the dry season, and (c) regional composition during the wet season. Pearson’s Chi-square test indicated no significant seasonal difference (χ2 = 4.003, df = 3, p = 0.261) but significant spatial differences during both the dry season (χ2 = 538.753, df = 6, p < 0.001) and wet season (χ2 = 23.076, df = 6, p = 0.001).
Microplastics 05 00136 g007
Figure 8. Seasonal and spatial variation in microplastic color composition in the Can Tho River: (a) seasonal composition during the dry and wet seasons, (b) regional composition during the dry season, (c) regional composition during the wet season, and (d) interseasonal percentage changes (Δ% = Wet − Dry). Differences in color composition were evaluated using Pearson’s Chi-square test. Significant seasonal differences were observed between the dry and wet seasons (χ2 = 339.554, p < 0.001), while significant spatial differences were detected among regions during both the dry season (χ2 = 664.067, p < 0.001) and wet season (χ2 = 84.255, p < 0.001).
Microplastics 05 00136 g008
Figure 9. Microplastic size composition in the Can Tho River: (a) seasonal variation between dry and wet seasons, (b) spatial variation among regions during the dry season, and (c) spatial variation among regions during the wet season. Differences in size composition were significant between seasons (Pearson χ2 = 314.304, p < 0.001) and among regions during both the dry season (Pearson χ2 = 708.141, p < 0.001) and the wet season (Pearson χ2 = 32.964, p < 0.001).
Microplastics 05 00136 g009
Figure 10. Continuous particle-size characteristics of microplastics in the Can Tho River: (a) boxplots showing measured particle-size distributions across regions and seasons and (b) empirical cumulative distribution functions (ECDFs) comparing particle-size distributions between the dry and wet seasons. Circles indicate outliers, and asterisks (*) indicate extreme outliers.
Microplastics 05 00136 g010
Table 1. Weather characteristics of Can Tho.
Month123456789101112
Chance of cloudy/rainy conditions (%)595560778391909290847566
Chance of sunny conditions (%)4145402311910810162534
Rainy days/month1.5125.313.217.3181817.918.210.64.3
Rainfall (mm)6.55.710.733.1104.6166.1174.2173180.8172.684.822.6
Disclaimer/Publisher’s Note: The statements, opinions and data contained in all publications are solely those of the individual author(s) and contributor(s) and not of MDPI and/or the editor(s). MDPI and/or the editor(s) disclaim responsibility for any injury to people or property resulting from any ideas, methods, instructions or products referred to in the content.