Article

Application of Remote Sensing for the Detection and Monitoring of Microplastics in the Coastal Zone of the Colombian Caribbean

by
Ana Carolina Torregroza-Espinosa
1,*,
Iván Portnoy
2,
Rodney Correa-Solano
1,
David Alejandro Blanco-Álvarez
3,
Ana María Echeverría-González
4 and
Luis Carlos González-Márquez
5
1
Department of Natural and Exact Sciences, Universidad de la Costa, Barranquilla 080002, Colombia
2
Department of Innovation and Productivity, Universidad de la Costa, Barranquilla 080002, Colombia
3
Department of Civil and Environmental Engineering, Universidad de la Costa, Barranquilla 080002, Colombia
4
Department of Business Sciences, Universidad de la Costa, Barranquilla 080002, Colombia
5
Engineering and Technology Department, Universidad Autónoma de Occidente, Unidad Regional Guasave, Guasave 81048, Mexico
*
Author to whom correspondence should be addressed.
Microplastics 2025, 4(4), 77; https://doi.org/10.3390/microplastics4040077
Submission received: 14 June 2025 / Revised: 10 August 2025 / Accepted: 17 October 2025 / Published: 21 October 2025

Abstract

Microplastic pollution in marine environments represents a significant ecological threat due to its persistence and harmful effects on biodiversity and human health. In Colombia, coastal ecosystems (particularly in La Guajira) have exhibited increasing microplastic concentrations, but systematic monitoring remains limited. This study explored the application of remote sensing, including multispectral satellite imagery (Sentinel-2) and machine learning algorithms, to detect and monitor microplastics in the coastal zone of Riohacha, La Guajira. To inform the model selection and ensure methodological relevance, a focused systematic literature review was conducted, serving as a foundational step in identifying effective remote sensing strategies and machine learning algorithms previously applied to microplastic detection in aquatic environments. Moreover, microplastic samples were collected from four coastal sites on Riohacha’s coast and analyzed via Fourier transform infrared spectroscopy (FTIR), while environmental parameters were recorded in situ. The remote sensing data were processed and integrated with field observations to train linear regression, random forest, and artificial neural network (ANN) models. The ANN model achieved the highest accuracy (MAE = 0.040; RMSE = 0.071), outperforming the other models in estimating the microplastic concentrations. Based on these results, environmental risk maps were generated, identifying critical zones of pollution. The findings support the integration of remote sensing tools and field data for scalable, cost-efficient microplastic monitoring, offering a methodological framework for marine pollution assessment in Colombia and other developing coastal regions.

1. Introduction

Microplastic pollution in marine ecosystems has become one of the main environmental threats in the 21st century due to its persistence in aquatic environments and its impacts on biodiversity and human health [1,2]. These contaminants, defined as plastic fragments smaller than 5 mm, can be of primary or secondary origin and have been detected in various aquatic environments, from surface waters to marine sediments and living organisms [3]. In Colombia, the presence of microplastics has been identified in multiple coastal ecosystems, with a higher concentration on the Caribbean coast, particularly in Cartagena and Santa Marta, where between 249 and 1387 particles/m2 have been recorded in sediments [4]. Likewise, in the Ciénaga Grande de Santa Marta swamp, the presence of microplastics has been detected in 7% of the fish species analyzed, confirming their entry into the marine food chain [4].
Traditional microplastic detection and quantification methods rely on in situ sampling and further laboratory analysis. Although these methods are accurate, they are space- and time-limited, expensive, and time- and resource-demanding [5]. The use of remote sensing and remote sensing technology (particularly satellite imagery) has emerged as an innovative alternative to monitor large-scale microplastic pollution in bodies of water, tackling the challenges posed by traditional methods [6]. Recent studies have shown that satellite imagery and machine learning models allow for the identification of microplastic concentration patterns in bodies of water with great accuracy [5]. Despite the growing number of studies on microplastic pollution in Colombia, there is no standardized methodology for detecting it, leading to significant differences in the approaches employed by different researchers [4]. Such a lack of methodological standardization hinders the comparison of results and the deployment of effective mitigation measures. Moreover, research works have shown that the most abundant microplastics in Colombian coastal ecosystems are mainly of the secondary type, predominantly polypropylene and polyethylene, due to their widespread use in industrial materials and consumer-oriented products [4]. Recent mechanistic studies indicate that mechanical and environmental stress can induce phase separation in plastics, accelerating fragmentation and the release of amorphous polymer micropollutants into aquatic environments, thereby contributing to the generation of secondary microfibers [7].
Integrating remote sensing with field data have become a key strategy to improve the characterization of microplastics in the ocean [8]. In this context, multispectral remote sensing and specific spectral indices have enabled advances in identifying floating plastic debris [6]. In the case of La Guajira, Colombia, the application of these technologies is particularly relevant due to the lack of systematic studies on the presence and distribution of microplastics and their impact on marine and coastal ecosystems. Hence, this study aimed to: review advances in microplastic detection using remote sensing and spectral analysis algorithms; evaluate the relationship between field data and remote sensing measurements, establishing their accuracy and applicability; and generate environmental risk maps to identify priority areas for mitigation and conservation.
La Guajira Department, located in the northernmost part of Colombia and South America, stands out as a strategic coastal region for studying marine microplastic pollution due to its geographical location and the Caribbean Sea’s oceanic dynamics (Figure 1). This region has a coastline accounting for roughly 18.5% of Colombia’s whole coastline, with a significant extension of marine and coastal ecosystems that include mangroves, coral reefs, and sandy beaches [9].
The municipality of Riohacha, the capital city of La Guajira, is located at the mouth of the Ranchería River and is a key point for evaluating microplastics due to the combination of river discharges, tourism, and industrial activities. In this area, various sources of plastic pollution have been identified including improperly managed urban waste, industrial discharges, and the accumulation of debris carried by marine currents [10].
La Guajira’s economy strongly relies on the artisanal fishing, mining, and tourism sectors, which have impacted the marine ecosystems due to waste mismanagement. Previous studies have shown that the lack of environmental management and monitoring strategies has led to an increasing accumulation of microplastics in areas of high fishing and tourism activity along the coast [11]. Additionally, La Guajira faces socioenvironmental challenges related to freshwater scarcity and climatic vulnerability, intensifying the plastic pollution issue in coastal ecosystems. The department has a significant Wayúu indigenous population, whose dependence on marine resources for their livelihoods makes it crucial to implement solutions to mitigate microplastic pollution and preserve the quality of marine-coastal ecosystems [12,13].

2. Materials and Methods

2.1. Literature Review

We conducted a systematic literature review on detecting microplastics via remote sensing and spectral analysis algorithms. For this systematic review, we followed the directions outlined by the Preferred Reporting Items for Systematic Reviews and Meta-Analyses (PRISMA) methodology, allowing for the rigorous search, selection, and analysis of scholarly papers and reproducibility [14]. Given their relevance and reach, the literature search was conducted using the Scopus and Web of Science databases. The search equation used was “microplastic” OR “plastic pollution” AND “coastal zone” OR “shoreline” OR “beach” AND “remote sensing” AND “machine learning” OR “satellite imagery” AND “marine pollution”.
Specific inclusion and exclusion criteria were applied to ensure the selected studies’ relevance and quality. Articles had to be published between 2015 and 2024, written in English, peer-reviewed, and directly address detecting, quantifying, or monitoring microplastics in coastal or marine environments. Only studies that employed remote sensing techniques, spectral analysis, or machine learning algorithms, and that provided validation through experimental data, ground-truth comparisons, or predictive modeling were considered. Excluded were articles not written in English, non-peer-reviewed literature (e.g., editorials, theses, conference abstracts), studies focused on terrestrial microplastic pollution (such as in soils or freshwater systems), and works that lacked methodological rigor or did not include any form of data validation [5]. To analyze the selected studies, we retrieved and organized data (in a matrix) regarding the authors, year of publication, type of remote sensor used, methodologies applied, accuracy reported, and limitations identified. This information further informs the conclusions obtained through bibliometric analysis.

2.2. Microplastic Field Data Collection, Quantification, and Characterization

The microplastic sample collection was conducted monthly at four strategic sites in the coastal zone of Riohacha, La Guajira, from December 2024 to April 2025. These locations were selected based on their proximity to potential sources of contamination such as the mouths of bodies of water and areas of high fishing and tourist activity. The location of the sampling points was determined using geographic coordinates obtained with a precision GPS (Datum System: Magna Sirgas), guaranteeing the spatial traceability of the data. The coordinates of these sampling sites are provided in the Results Section (Section 4 and Section 4.2). Microplastics were collected using surface trawls of different mesh sizes (45 µm, 300 µm, and 500 µm) following standardized protocols for the retrieval and concentration estimation of floating plastic particles [15]. The selected mesh sizes (45 µm, 300 µm, and 500 µm) reflect a compromise between capturing a wide range of microplastic sizes and ensuring operational feasibility in the field, particularly under coastal conditions where clogging risks and sampling logistics are critical. The 45 µm mesh served as our smallest sieve, enabling the detection of fine microplastic fractions while minimizing filtration failure. However, particles smaller than 45 µm (including nanoplastics) may not be fully represented in our samples. This limitation may lead to an underestimation of the total microplastic abundance and should be addressed in future work through supplementary filtration techniques and laboratory-scale particle sizing methods. A representative volume of water was collected at each site, and the captured material was subsequently filtered for laboratory analysis. Environmental parameters (temperature and salinity), measured with a CastAway-CTD, were recorded during sampling to contextualize the results and evaluate their possible influence on the distribution of microplastics.
The collected samples were filtered, dried, and analyzed through Fourier transform infrared spectroscopy (FTIR) to determine the polymeric composition of the microplastics. Additionally, they were classified according to their size, shape, and color using an optical microscope for quantification [16]. To control for potential airborne and handling contamination, procedural blank samples were prepared and analyzed alongside environmental samples. For each batch of sample processing, a glass beaker containing 200 mL of Milli-Q water (pre-filtered through a 0.45 µm pore-size membrane) was left uncovered in the working area during all preparation and analytical procedures. All laboratory work was conducted under a laminar flow cabinet to minimize airborne particle deposition, using only pre-cleaned glassware and stainless-steel instruments. All liquids used during sample treatment were filtered through 0.45 µm membranes prior to use. Fibers and particles detected in the blanks were identified under the same microscopic criteria applied to the environmental samples, and their counts were subtracted from the corresponding sample results to obtain contamination-corrected values [15].

2.3. Sentinel-2 Satellite Image Processing

The remote sensing analysis was based on satellite images from the Sentinel-2 mission, downloaded (with a resolution of 10 m) and preprocessed through the Google Earth Engine platform and the Copernicus Open Access Hub API. These images were selected by filtering by cloud cover below 50%, ensuring a better quality for detecting microplastics in the study area. The 50% cloud cover threshold was chosen to balance image availability and quality, guaranteeing sufficient spatial and temporal coverage. Stricter thresholds (e.g., <20%) significantly reduce usable scenes in coastal regions with frequent cloudiness. This threshold represents a compromise that maintains analytical consistency while minimizing atmospheric interference in spectral detection. The Sentinel-2 image collection was particularly suitable due to its multi-band spectral resolution and its ability to differentiate materials in the aquatic environment, allowing for the identification of plastic polymers through their reflective properties in the visible and near-infrared spectrum [17].
Sentinel-2 data come (by default) with atmospheric correction and optical noise reduction to eliminate distortions caused by light absorption and scattering in the atmosphere. Moreover, they have undergone radiometric corrections to improve the spectral quality of the images and ensure that the spectral signatures of the materials present in the water are comparable with the reference values obtained in previous studies. In addition, cloud-contaminated pixels and cast shadows were removed using spectral filters and masks based on Sentinel-2 cloud indices [17]. For the spectral analysis, specific bands of the visible (B2, B3, B4) and near-infrared (B8, B11, B12) spectra were selected to highlight differences in the reflectance of floating materials in water. Plastic debris exhibits distinctive spectral properties, especially in the near-infrared (NIR), which facilitates its identification from other marine objects such as organic matter or suspended sediments [18]. To improve the capacity to discriminate floating plastics, specialized spectral indices were calculated: the floating debris index (FDI) and the normalized difference plastic index (NDPI), which have been used in previous studies for the detection of plastic debris in open water bodies [6]. The FDI was computed as in Equation (1), while the NDPI was computed as in Equation (2). In Equations (1) and (2), ρ represents the reflectance, and λ is the central wavelength of each band
F D I = ρ B 8 ρ B 4 + ρ B 11 ρ B 4 × λ B 8 λ B 4 λ B 11 λ B 4
N D P I = ρ B 11 ρ B 4 ρ B 11 + ρ B 4
When the spectral indices were obtained, these data were augmented by incorporating the corresponding microplastic concentration values for each site and date, which were gathered as outlined in Section 3.2. Afterward, we randomly split the dataset into a training subset and a testing subset, so that they contained 70 and 30% of the observations, respectively. Subsequently, supervised machine learning techniques were trained with the samples in the training subset, aiming to predict the microplastic concentration based on the spectral indices. Linear regression, random forest [19,20,21], and artificial neural network (ANN) models [22,23] were used, which have proven effective in classifying floating materials in marine environments. We repeatedly increased the number of trees for the random forest model until the fitting error settled (i.e., it would not decrease further). This algorithm (random forest) eliminates the need for pruning by utilizing bootstrap aggregation and randomly selecting features at each split. As a result, the ensemble of trees produces outputs with reduced variance and bias. For the ANN model, we tried different configurations (i.e., the number of layers and neurons per layer) until the fitting error was minimized.
Once the models were trained, each one was used to cast predictions of the microplastic concentrations for the observations in the testing subset. The models’ performance was assessed using their prediction accuracy, quantified by the mean absolute error (MAE) and the root mean square error (RMSE). Additionally, these metrics (MAE and RMSE) are also reported for the training data fitting. Finally, spatial distribution maps of microplastics were generated, which allowed for the visualization of the estimated concentration of plastic waste on the coast of Riohacha, La Guajira.
It is worth noting that the proposed approach does not aim to detect microplastic particles directly via satellite imagery, as their small size makes it prohibitive. Instead, the methodology relies on identifying spectral signatures or index values (e.g., band-wise signals, FDI, and NDPI) that exhibit correlations with in situ microplastic concentrations, particularly in areas where environmental and anthropogenic processes lead to plastic aggregation. This indirect estimation strategy, while constrained by spatial resolution, is supported by supervised machine learning algorithms that are trained on site-specific pairs of spectral data and ground-truth microplastic concentration measurements. The resulting predictions must be understood as probabilistic estimates derived from learned statistical relationships, in contrast with direct visual detections.

2.4. Environmental Impact Assessment of Microplastic Pollution

Environmental risk maps were generated, identifying the areas most affected by microplastics on the coast of Riohacha, La Guajira. These maps were integrated into a geographic information system (GIS), which facilitated the identification of priority areas for implementing mitigation and conservation strategies. The methodology used to elaborate these maps included the use of machine learning algorithms (particularly the ANN, which achieved the best performance) to correlate the density of microplastics detected in the field and the spectral values obtained from Sentinel-2 images, following previous approaches in the modeling of environmental risk from plastic debris in marine ecosystems [24].

3. Results

3.1. Literature Review

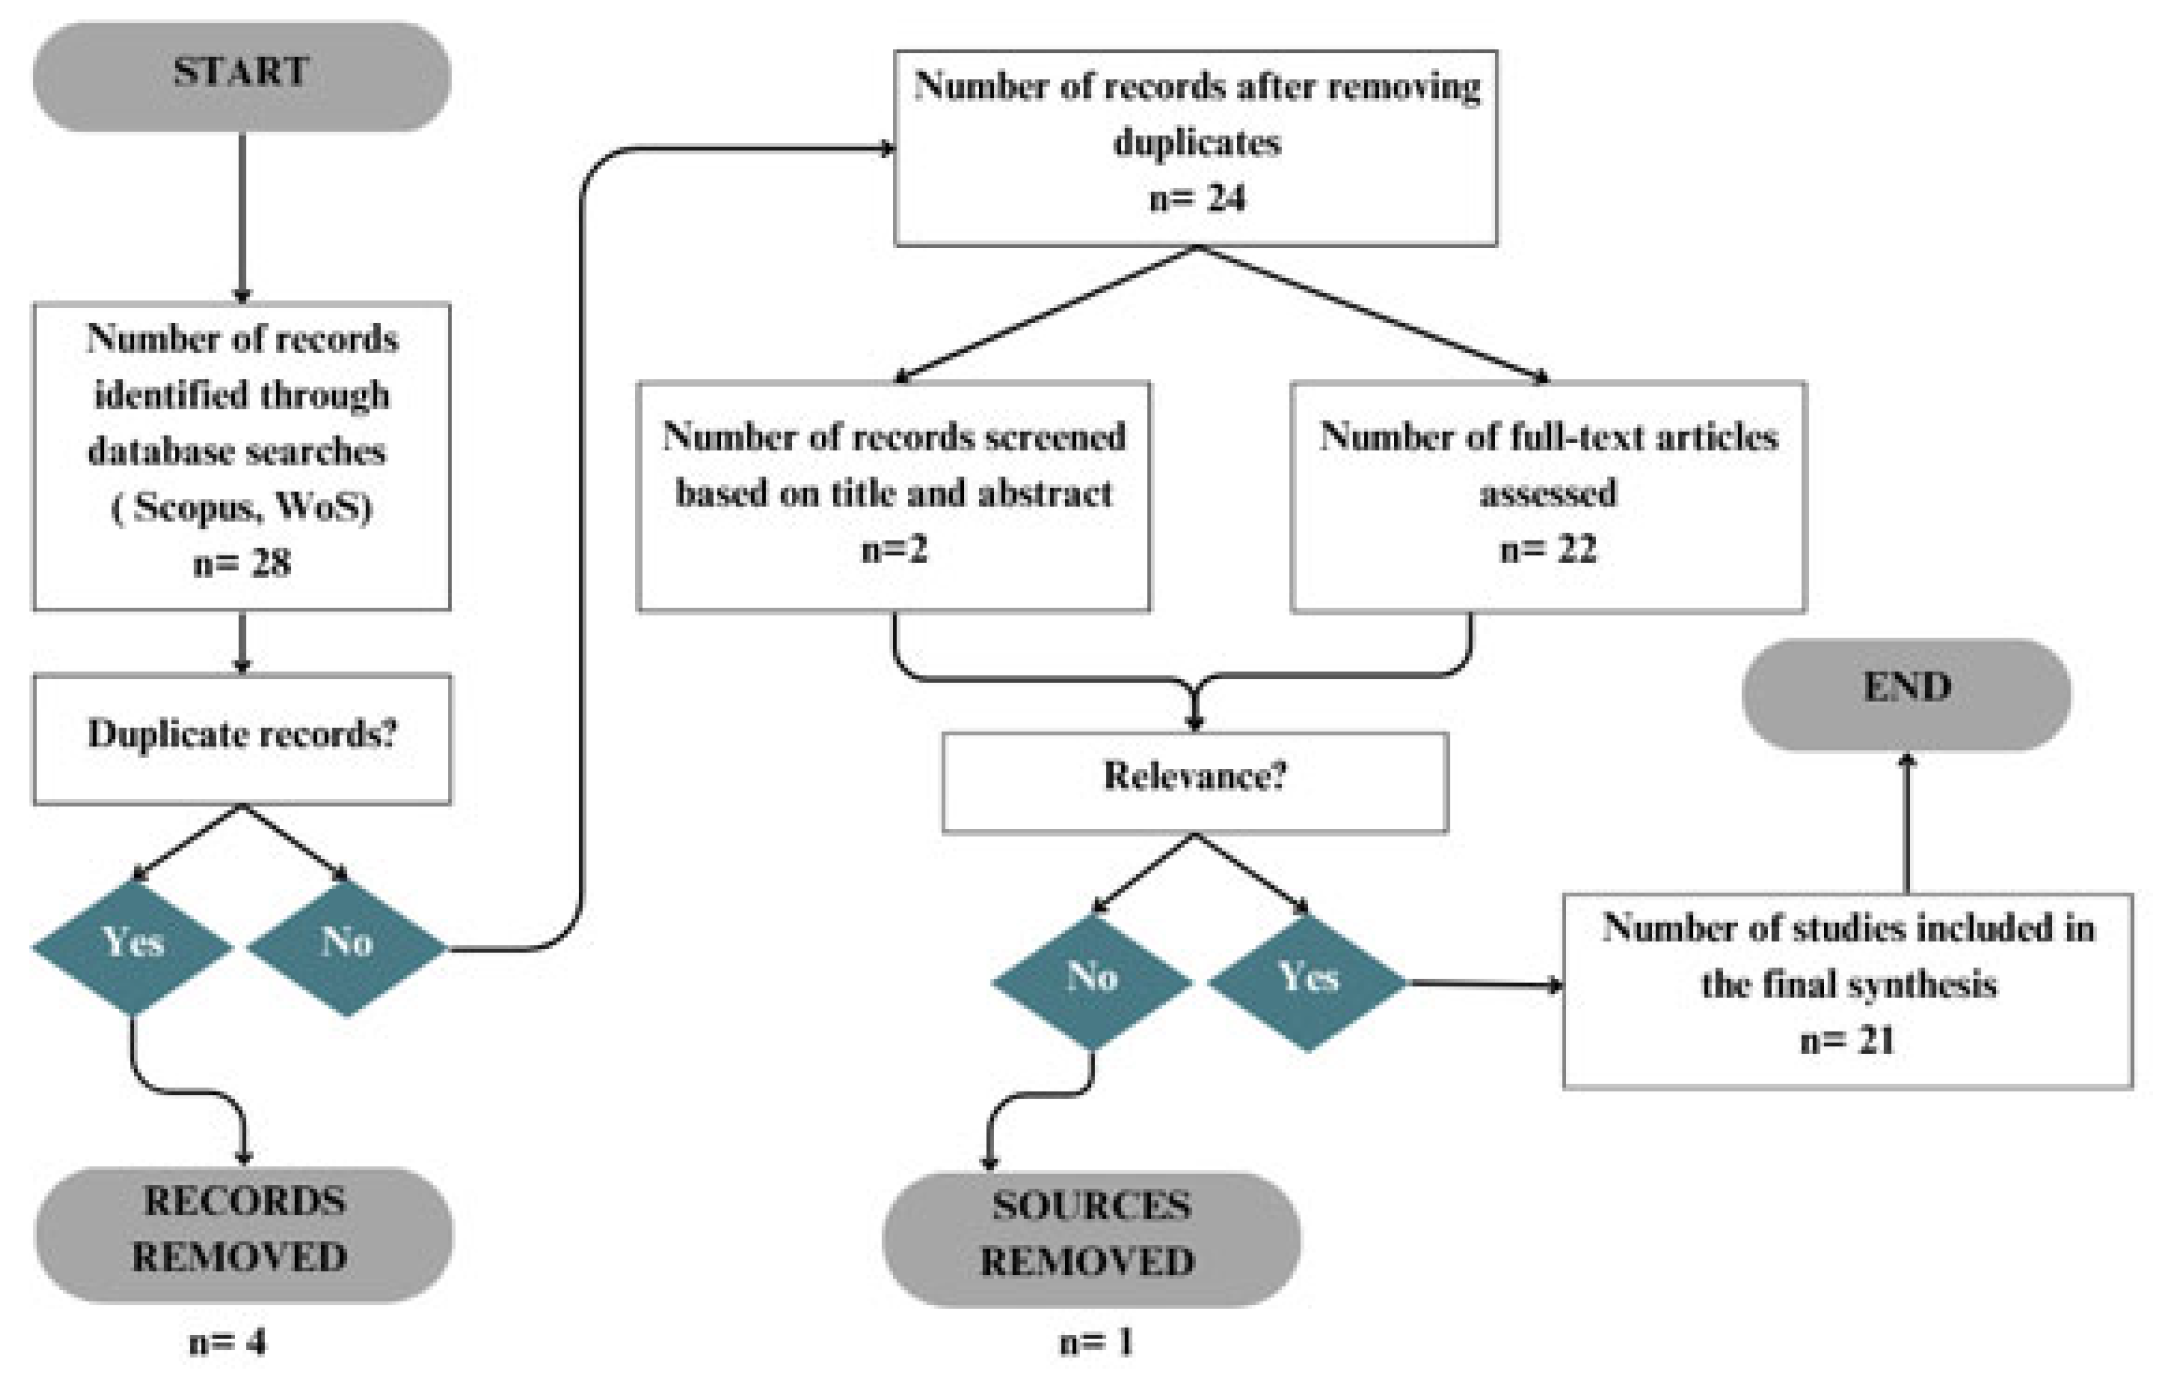
Figure 2 presents a flowchart illustrating the article selection process in the systematic review. Twenty-eight records were identified in Scopus and Web of Science. Four of them were eliminated for duplication, leaving 24.
Finally, 22 full-text articles were evaluated. Twenty-one of them were included in the final synthesis. This screening process ensured that only relevant and non-redundant studies were considered in the literature review. The literature review covers various applications of artificial intelligence (AI) and environmental monitoring technologies in different contexts. For instance, Hu et al. [25] explored the use of AI and machine learning for rapidly identifying contaminants, highlighting the efficiency of these tools in hazardous waste management. Similarly, Su et al. [26] analyzed the potential of machine learning in the detection of microorganisms, making the case for its impact in biotechnology. This research highlights the growing relevance of advanced computational methods in environmental analysis and ecological risk mitigation.
Another line of research within the review focused on using advanced sensors and environmental monitoring methodologies. Cacace et al. [27] outlined an approach based on compact holographic images for the detection of airborne particles, which could revolutionize environmental monitoring systems. Molnár et al. [28] compared different methodologies for assessing plastic pollution in rivers using high-resolution satellite images. These research works underline the relevance of remote sensing and optical methods in monitoring aquatic and atmospheric ecosystems. On the other hand, this literature review highlights the importance of modeling and systematic data analysis to further the understanding of environmental phenomena. Su et al. [29] introduced a new, lens-free microscopy method for the analysis of microscopic particles, which sets out novel paths in the observation of biological samples. As for the trend analysis, several systematic reviews, such as that of Su et al. [26], demonstrated the convergence between AI, environmental monitoring, and process optimization in multiple scientific domains.

Microplastic Detection Techniques

The reviewed research studies employed a combination of remote sensing techniques and AI algorithms for the identification of microplastics in aquatic environments. These techniques can be classified into four broad categories: detection based on satellite imagery; hyperspectral and multispectral spectroscopy; use of aerial sensors using drones; and application of AI algorithms for data analysis.
Satellite imagery: Satellites have been widely used for monitoring microplastics in large-scale water bodies. Remote sensing with these systems is based on the spectral reflectance of plastic materials, differentiating them from other water components. Recent studies have used remote data from satellites such as Sentinel-2 and MODIS, along with machine learning models, to identify patterns of microplastic accumulation in coastal areas [6,17]. For example, Biermann et al. [6] used optical imaging to detect concentrations of floating plastics in coastal waters, validating the results with field data. Likewise, Sannigrahi et al. [17] implemented a model based on Sentinel-2 imagery and machine learning algorithms, achieving an accuracy of over 85% in the detection of floating plastic debris.
Hyperspectral and multispectral spectroscopy: Hyperspectral sensors have enabled a more accurate characterization of microplastics in water bodies by analyzing the interaction of light with different materials in multiple spectral bands, enhancing the differentiation between plastic particles and organic or mineral debris. Research such as that by Ferreira et al. [8] has shown that detailed spectral analysis of satellite imagery and airborne hyperspectral sensors significantly improves the identification of microplastics. In addition, recent studies have indicated that combinations of multispectral spectroscopy with predictive models can increase the accuracy of microplastic identification in water bodies [5]. However, their large-scale implementation remains limited due to high data acquisition costs and the lack of availability of hyperspectral sensors on open-access satellite platforms.
Unmanned aerial vehicle (UAV) sensors: The use of drones equipped with multispectral cameras and spectrometers has proven to be an efficient alternative for the identification of microplastics in small bodies of water. Drones allow for more detailed studies in specific areas, such as lakes and river mouths, where satellite detection has limitations due to spatial resolution. Research has shown that the combination of drones with machine learning algorithms has improved the accuracy of the detection and classification of microplastics in urban and coastal water bodies [30].
AI in microplastic detection: Advances in machine learning have fostered the development of computational methods for the automatic detection of microplastics. Models based on convolutional neural networks (CNNs) have been used to analyze satellite images and spectroscopic data, improving the classification of plastic particles in different aquatic environments [26]. A recent study Hu et al. [25] used AI algorithms for automatically identifying microplastics in Sentinel-2 satellite images, achieving a significant correlation between the detected microplastic density and anthropogenic activity in the analyzed area. Likewise, other studies have shown that combining machine learning models with remote sensing data can increase the accuracy in segmenting plastic debris in open water bodies [24,31]. Table 1 presents a comparison of the main techniques used to detect microplastics in aquatic environments. It includes their features, advantages, disadvantages, and reference studies implementing each approach. Overall, the combination of satellite imagery with AI algorithms has proven to be the most effective strategy for large-scale microplastic detection, achieving above 90% accuracy in some studies [32], while UAV sensors and hyperspectral spectroscopy are more suitable for detailed studies in specific areas.
The effectiveness of each technique varies depending on the type of sensor and algorithm used (Table 2). On the other hand, hyperspectral spectroscopy has been effective in distinguishing microplastics from other debris, although its implementation at large scales remains a technical challenge [25].

3.2. Field Data

The results from microplastic monitoring in the coastal zone of Riohacha, La Guajira, showed the presence of this type of contaminant at all sampling sites (Table 3). As there were four sample sites and five sampling dates, twenty samples were analyzed, in which variable concentrations of microplastics were recorded, with an average value of 0.82 particles/m3 and a 0.32–1.95 particles/m3 range. The prevalence of particles in the 50–200 µm range is consistent with the smallest mesh size used (45 µm), which effectively captures microplastics down to approximately this lower limit. However, particles smaller than 45 µm were likely excluded, and their contribution to the total abundance may be underestimated. As for the composition and characteristics of microplastics, it was found that 97% of the identified particles corresponded to fibers, with a predominance of blue (55%) and transparent (45%) colors. Regarding particle size, they were mainly distributed in the 101–200 µm (40%) and 50–100 µm (35%) ranges, indicating a prevalence of secondary fragments from the degradation of larger plastics.
The environmental conditions during the field sampling showed stable water temperature (with an average of 28.4 °C and a range of 27.9–28.8 °C) and salinity values (with an average of 36.3 ppt), without significant variation among the sampling points. Moreover, we registered filtered water volumes between 115 and 142 m3, with a total of 2065 identified particles considering all samples.

3.3. Satellite Image Processing

The retrieved band-wise signals and FDI and NDPI values for the sampling sites are shown in Table 4. As mentioned in Section 3.3, the selected machine learning algorithms (linear regression, random forest, and ANN) were trained with the Sentinel-2 data along with the microplastic concentration field data contained in the training subset (with 70% of the samples). As for the linear regression model, Table 5 summarizes the main statistics. As observed in Table 5, the regression model exhibited a good fit (adjusted R2 of 0.986) and overall significance (p-value of 0.0004931). However, the hypothesis tests for each regression coefficient failed to show significance (with 95% confidence). Thus, this is not the best model to be implemented.
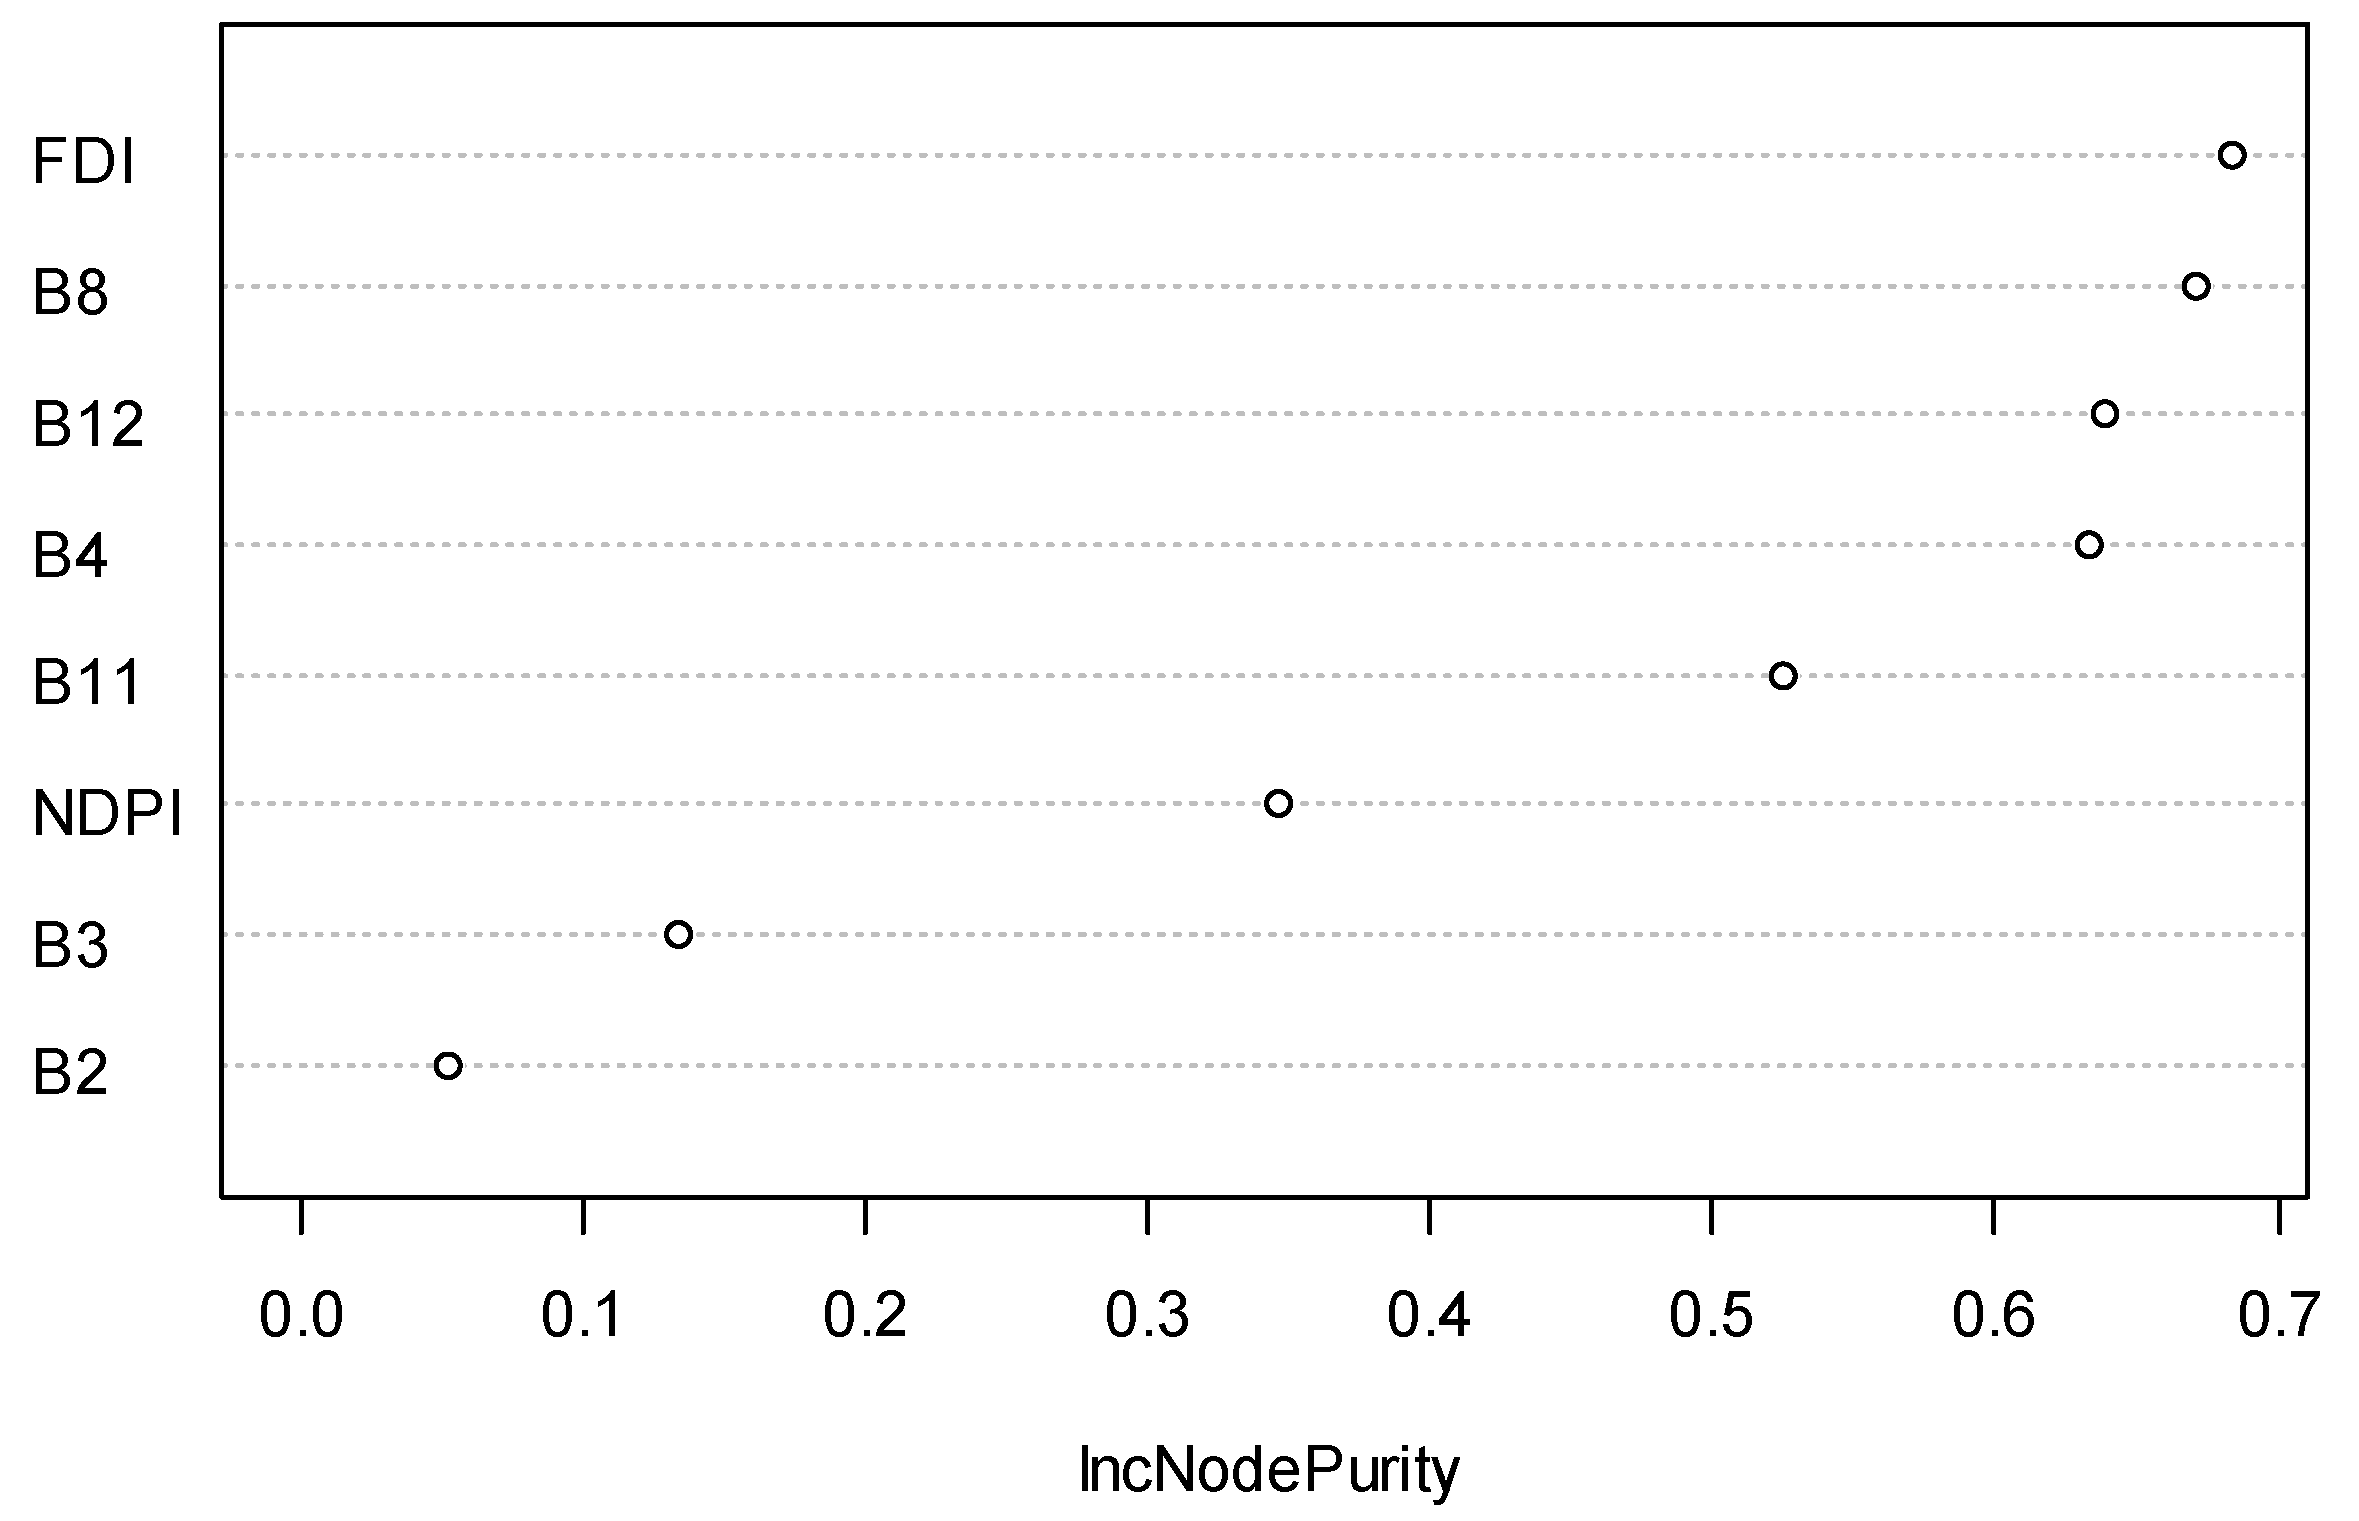
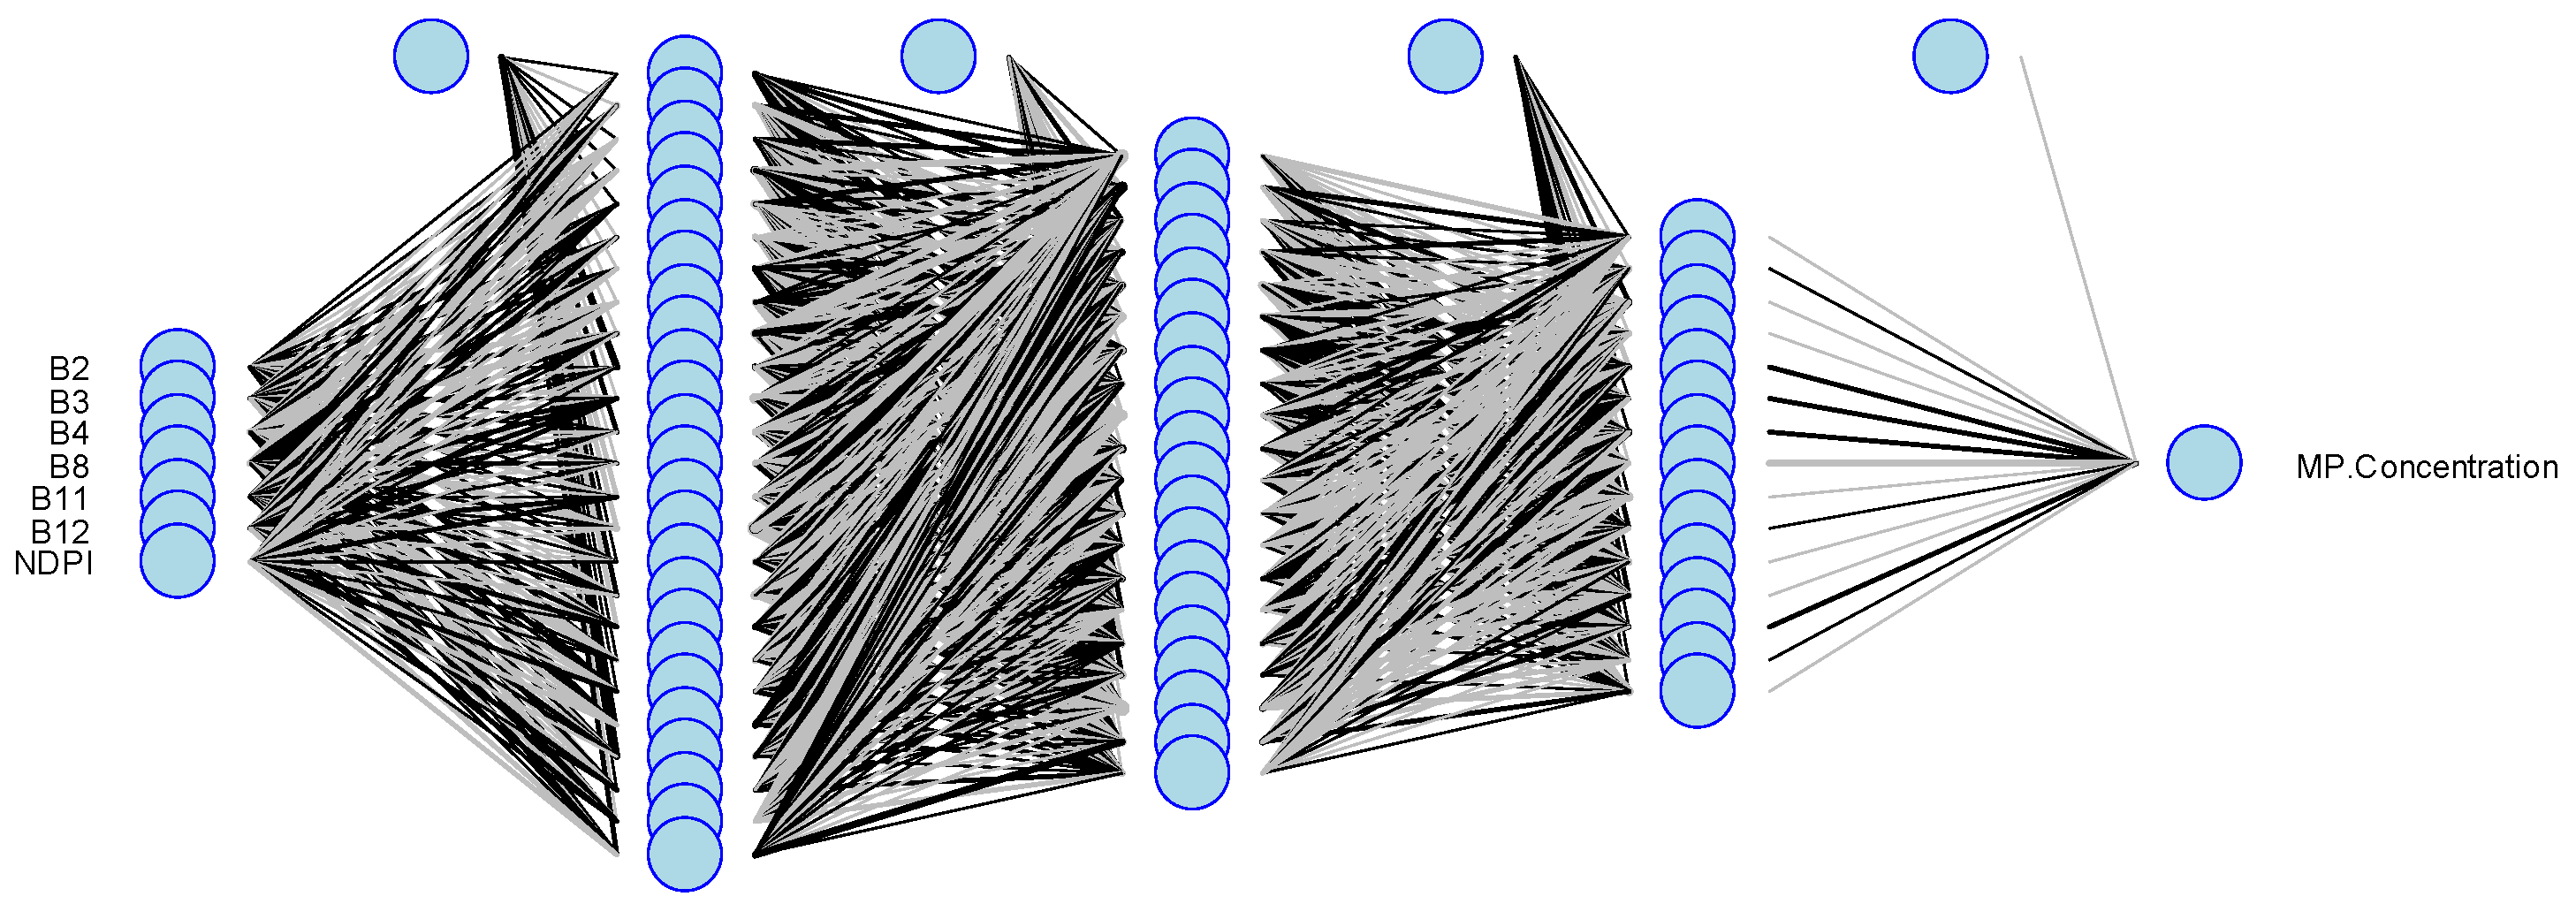
As for the random forest model, it achieved its best prediction performance with 300 trees. Figure 3 shows each variable’s importance (i.e., spectral signal or index) regarding their contributions to the prediction power. Figure 3 shows that for the random forest model, the FDI index and spectral bands B8 and B12 were the input variables with the most predictive power in this model. Regarding the ANN model, Figure 4 illustrates its network structure, which comprises three hidden layers with 25, 20, and 15 neurons, respectively. We used a logistic activation function, a convergence threshold of 0.01, and a maximum number of iterations of 1 × 10⁵. Regularization techniques were not applied, as preliminary testing showed low generalization errors between the training and testing subsets, suggesting minimal overfitting risk under the current conditions.
The models’ fitting (with the training data) and prediction (with the testing data) performance were assessed by the MAE and RMSE metrics. Table 6 summarizes these metrics and some of their features.
As observed in Table 6, the ANN model outperformed the other two, attaining prediction MAE and RMSE values of 0.040 and 0.071 particles/m3, respectively. Also, Figure 5 shows the actual vs. predicted microplastic concentration values (with the testing data) for the machine learning models, helping to highlight the performance-wise dominance of the ANN model.

3.4. Environmental Risk Maps

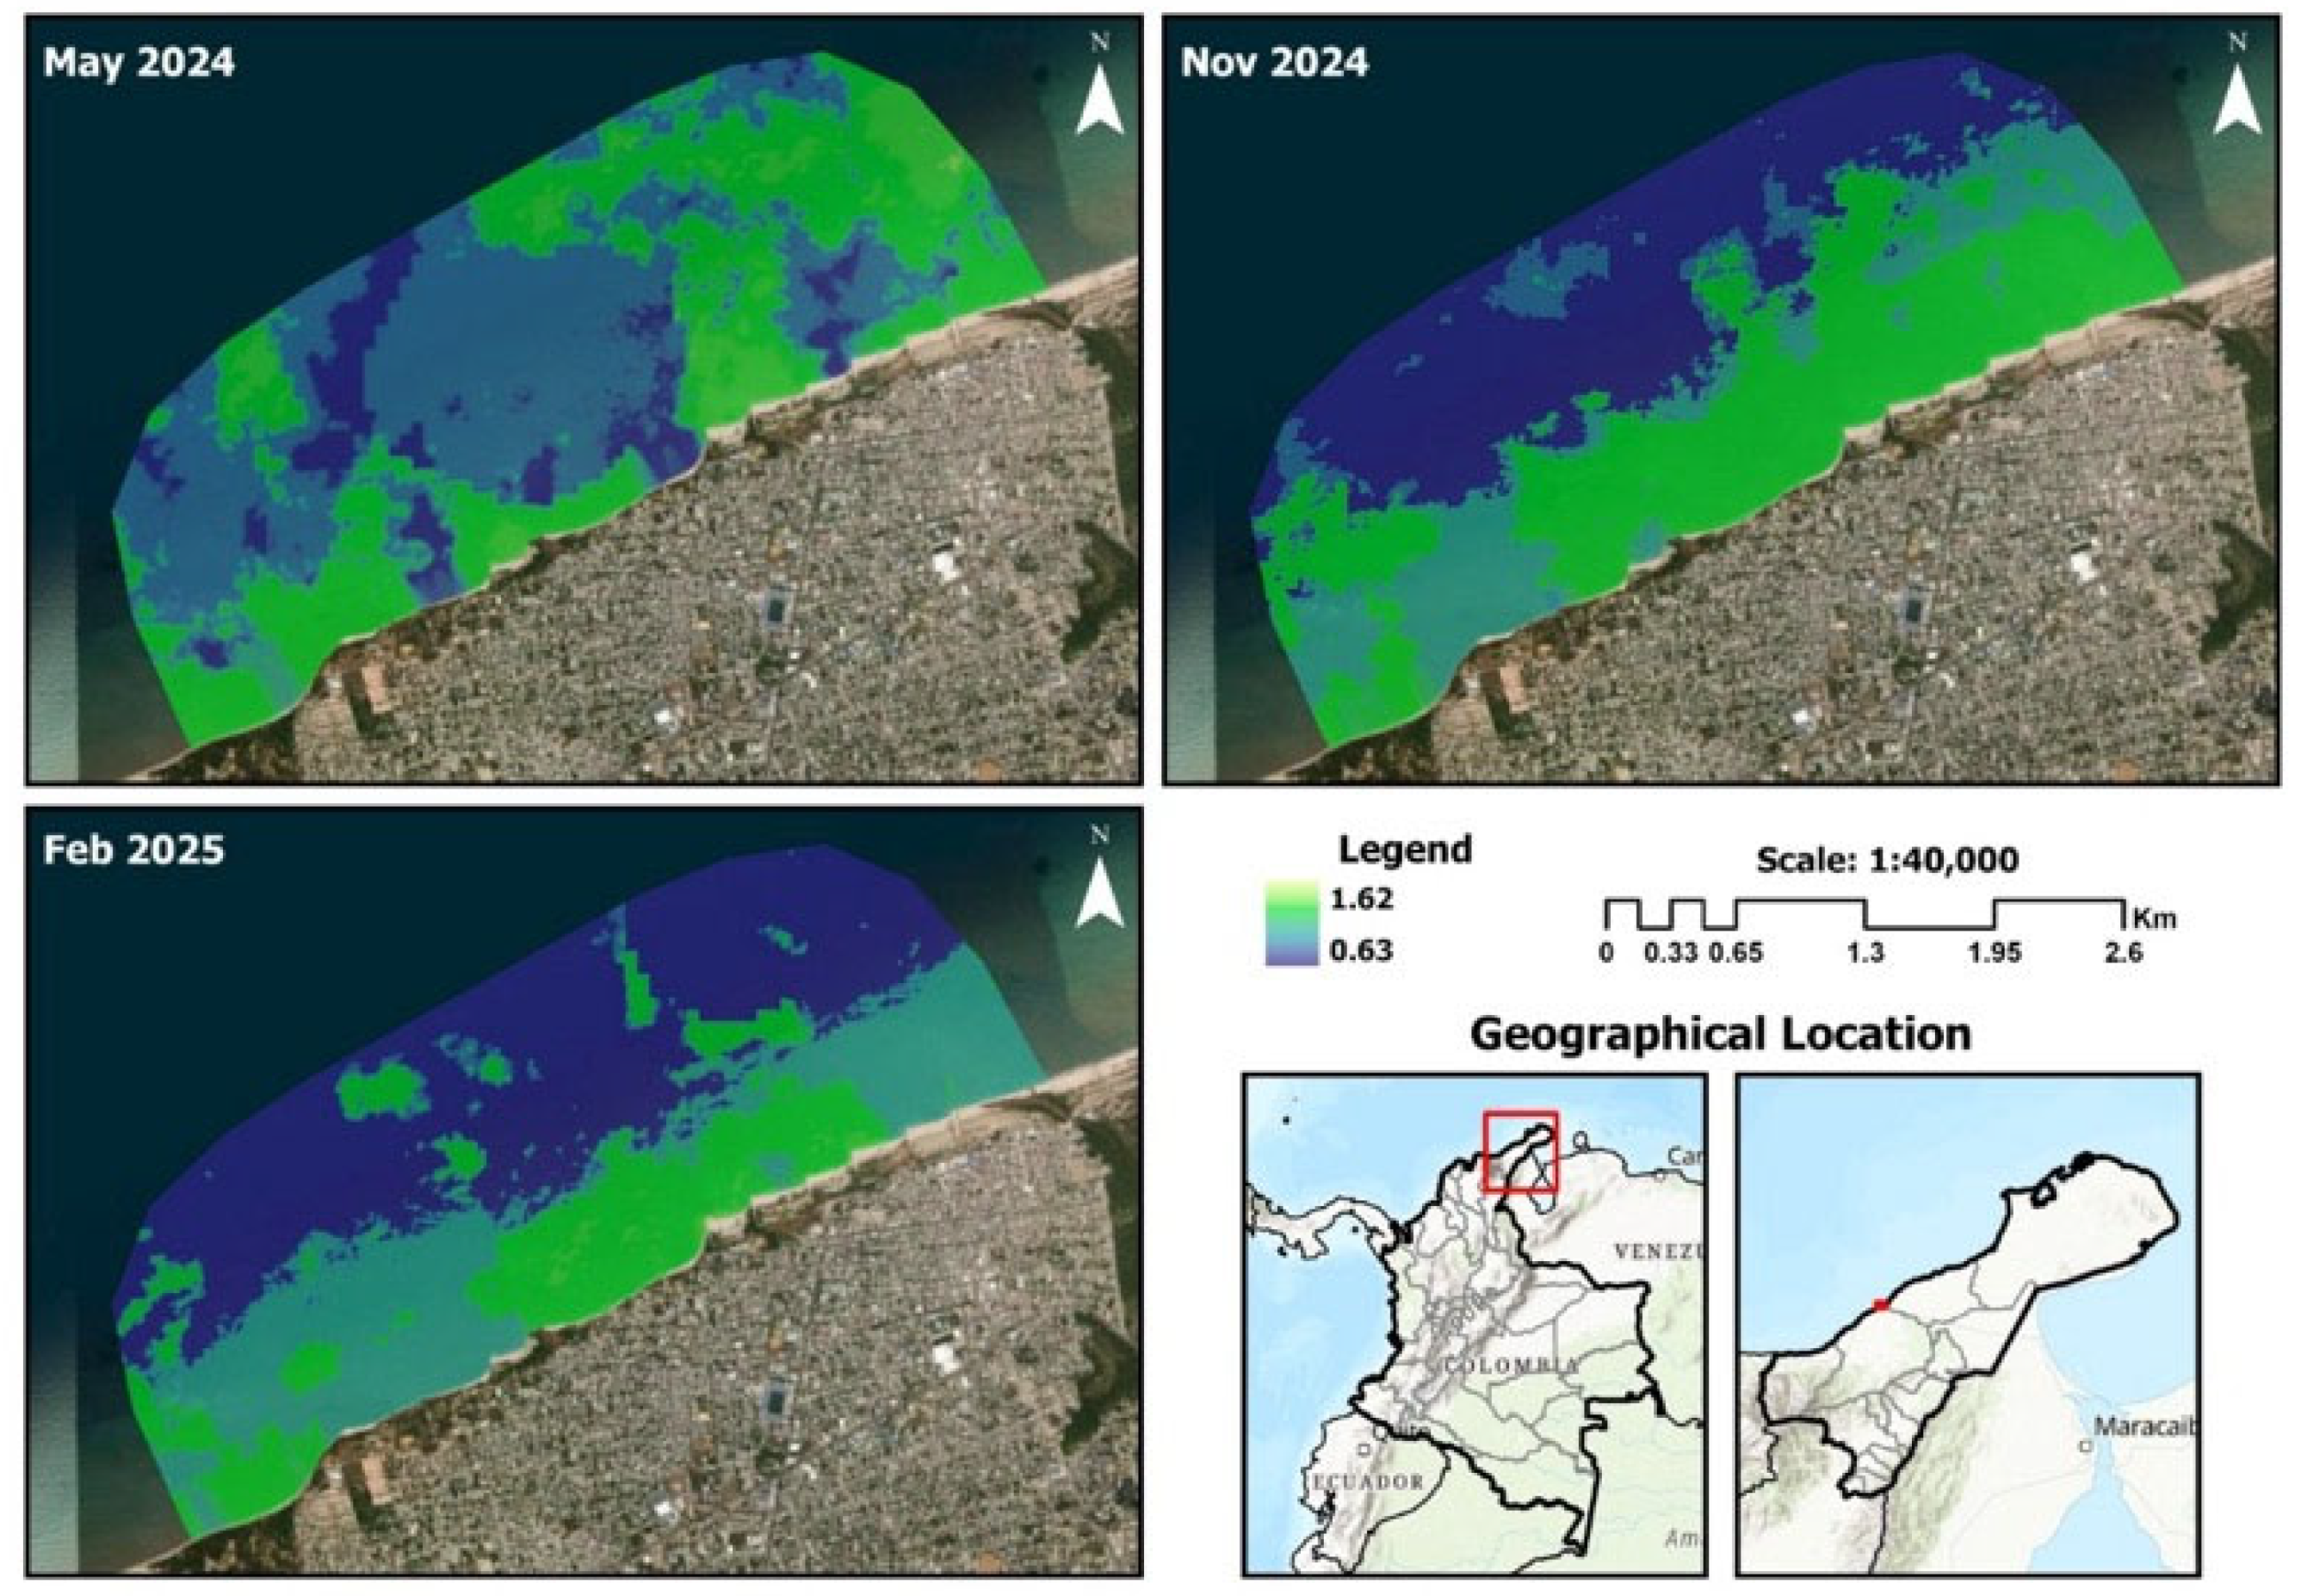
Given that the ANN model outperformed the linear regression and random forest models, it was chosen to produce estimations of the microplastic concentration and create risk (heat) maps. To generate the risk maps, we applied the trained ANN model across a gridded raster covering the selected coastal polygon. For each 10 m resolution pixel in this area, we extracted the Sentinel-2 spectral bands and computed the FDI and NDPI values. These spectral inputs were then processed by the ANN to estimate the corresponding microplastic concentration per pixel. The resulting predictions were visualized as continuous heatmaps, effectively translating the model output into spatial risk representations. To illustrate these risk maps, we considered a polygon in Riohacha’s coast, which was enclosed by the locations with the following coordinates: [−72.945, 11.537], [−72.905, 11.558], [−72.912, 11.571], [−72.950, 11.550]. We retrieved satellite images for the selected site in May 2024, November 2024, and February 2025. These months align with key seasonal phases in the region. May falls within the first rainy season, November corresponds to the transition into the dry season, and February overlaps with the peak of coastal upwelling. This selection demonstrates the model’s responsiveness to hydroclimatic variation and supports its relevance for time-aware environmental monitoring. We gathered the Sentinel-2 band-wise signals using a 10 m resolution, drawing images for each period. Then, we aggregated the data for each period by applying a pixel-wise average. Finally, we let the ANN model yield its estimations on microplastic concentration (in particles/m3), obtaining the risk maps shown in Figure 6.
As observed in Figure 6, these risk maps helped to pinpoint sites where there were microplastic concentration peaks. Also, these maps allow for monitoring the time-drift of the microplastic concentrations in the monitored area. This is a valuable tool to help local inhabitants make informed decisions on which sites to conduct their economic and recreational activities (e.g., fishing, tourism, aquatic sports) and raise awareness of the ecological risks, informing the mitigation strategies to ameliorate them.

4. Discussion

The results obtained from this study offer valuable insights into the integration of remote sensing technologies, machine learning algorithms, and field-based observations for the detection and monitoring of microplastic pollution in coastal environments. Combining literature-based evidence with empirical data from Riohacha’s coastal zone demonstrates the applicability and effectiveness of remote sensing tools in addressing one of the most pressing marine environmental issues.

4.1. Literature Review

The systematic review confirmed that artificial intelligence (AI) and remote sensing have become critical tools in advancing microplastic detection. Multiple studies have demonstrated that satellite-based observation combined with machine learning models significantly improves the detection accuracy and scalability [25,26]. Notably, neural networks and classification algorithms have shown robust performance in differentiating plastic materials from other floating substances in aquatic environments [33]. These practical and cost-efficient approaches make them viable for large-scale environmental monitoring in developing countries. The reviewed literature highlights a growing trend toward integrating remote sensing and AI for pollution detection in marine and freshwater ecosystems.
Furthermore, research using hyperspectral sensors and uncrewed aerial vehicles (UAVs) revealed additional detection capabilities in specific, localized environments. Although limited by high cost and availability, hyperspectral imaging allows for acceptable spectral discrimination, improving the classification of plastic debris [8]. UAV-based studies, such as those by Alboody et al. [30], have demonstrated high-resolution monitoring in inaccessible coastal zones. Together, these studies reinforce the importance of integrating satellite, airborne, and in situ technologies. This technological convergence supports a holistic approach for plastic pollution surveillance, contributing to methodological standardization and improved cross-study comparability.

4.2. Field Data

Field sampling along the Riohacha coast confirmed the widespread presence of microplastics, particularly microfibers of secondary origin. With an average concentration of 0.83 particles/m3 and dominant particle sizes ranging from 50 to 200 µm, the findings point toward the significant degradation of consumer plastics and synthetic textiles. These observations are aligned with national assessments showing similar contamination patterns in Colombian coastal systems, where polyethylene and polypropylene dominate due to their widespread use and low density [4]. The color distribution, primarily blue and transparent fibers, also reflects familiar sources such as fishing gear and domestic waste, reaffirming the anthropogenic origin of the detected pollution [35,36].
Environmental conditions during sampling, namely stable temperature and salinity, provided a consistent context for interpreting the results [37]. These parameters helped validate the spectral signatures later used in satellite analysis. The total number of particles identified (2065 across 20 samples) underscores the severity of microplastic pollution in the region. Similar methodologies, integrating environmental parameters, have been used in studies like Li et al. [7], strengthening the relevance of this dataset. The granularity and traceability of the field data support its integration into predictive modeling and provide a crucial baseline for ongoing and future monitoring campaigns.

4.3. Satellite Image Processing

The processing of Sentinel-2 imagery, enhanced through spectral indices such as the floating debris index (FDI) and the normalized difference plastic index (NDPI), demonstrated high potential for detecting floating plastic debris in coastal waters. The results are consistent with prior studies that successfully applied these indices to differentiate plastic reflectance patterns from other marine substances [6,17]. The atmospheric and radiometric corrections applied ensured spectral integrity, improving detection sensitivity. This workflow highlights the importance of preprocessing when using satellite imagery for environmental monitoring tasks, particularly in regions with frequent cloud covers like La Guajira.
Among the machine learning models implemented, the artificial neural network (ANN) model outperformed linear regression and random forest regarding predictive accuracy. The ANN achieved the highest performance with a mean absolute error (MAE) of 0.040 and root mean square error (RMSE) of 0.071 particles/m3. These metrics align with the findings in the literature, where neural networks often yield better generalization and adaptability to complex environmental datasets [5,32]. The model’s ability to integrate multiple spectral bands and indices reinforces its suitability for monitoring diffuse, small-scale contaminants like microplastics. This performance underscores the value of incorporating AI into operational satellite-based environmental monitoring systems.
A potential limitation of this approach is the spectral confusion between floating plastics and non-plastic debris such as organic matter or wood. To reduce this risk, we used spectral indices (FDI and NDPI) designed to enhance plastic-specific reflectance patterns. Additionally, the machine learning models were trained on field-validated microplastic concentrations, allowing them to learn distinguishing patterns beyond raw spectral values. Nevertheless, some misclassification may persist, and future studies should consider incorporating higher-resolution or hyperspectral data to improve material discrimination.
Also, no explicit sunglint or turbidity correction was applied beyond atmospheric and cloud masking. Future work should explore advanced water masking or glint correction methods to further improve the index reliability, especially in highly reflective or optically complex waters.

4.4. Environmental Risk Maps

The environmental risk maps generated using the ANN model provided actionable insights into the spatial distribution of microplastic pollution in Riohacha’s coastal zone. By identifying critical hotspots and tracking temporal variations across multiple months, the maps serve as a decision-support tool for stakeholders engaged in coastal management. This approach follows recommendations from Tekman et al. [24] and Jambeck et al. [31], who emphasized the need for geospatial visualization to translate complex environmental data into accessible information for decision-makers and local communities. Integrating GIS analysis with predictive modeling represents the best practice in modern ecological risk assessment.
The spatiotemporal interpretation of microplastic risk maps must account for the seasonal hydroclimatic dynamics that govern the Colombian Caribbean, particularly along the Guajira Peninsula. In May, corresponding to the region’s first rainy season, increased precipitation enhances terrestrial runoff into coastal waters, contributing to the dilution of surface microplastic concentrations, although it may also introduce substantial plastic loads from land-based sources [38,39]. By November, the progressive strengthening of the northeasterly trade winds marks the onset of the dry season and initiates the development of the coastal upwelling system in La Guajira [40]. This process intensifies through February, when the upwelling reaches its peak intensity. The associated offshore Ekman transport induces the ascent of cold, nutrient-rich subsurface waters to the euphotic zone, restructuring the vertical profile of the water column and facilitating both the vertical and horizontal redistribution of microplastics [40,41]. These seasonal oceanographic fluctuations directly influence the concentration patterns detected by remote sensing. They must be critically considered in the interpretation of risk maps for the design of effective monitoring and mitigation strategies.
Considering the spatial patterns identified through the risk maps and the known anthropogenic drivers of pollution in the region, this study proposes three context-specific strategies to mitigate microplastic impacts along the coastal zone of La Guajira. First, the implementation of solid waste management programs in coastal communities is crucial, especially in areas where accumulation hotspots are adjacent to human settlements and river mouths. Second, targeted environmental education initiatives should be developed for local stakeholders (including artisanal fishermen, tourism operators, and residents) to raise awareness of plastic pollution and promote behavior change. Third, ecological restoration actions are recommended in heavily affected ecosystems, particularly mangroves and beaches, which serve as natural buffers and critical habitats but are currently degraded by plastic debris [42]. These strategies align with the ecological risk profiles identified in this study and reflect international recommendations for integrated marine pollution management [31]. Their future validation and adaptation should be pursued in collaboration with local communities to ensure sustainability and cultural relevance.
Moreover, these maps have practical applications for local populations, particularly the Wayúu communities, who rely on marine resources for their livelihoods. By highlighting areas with higher ecological risk, the maps can guide environmental education campaigns, waste management initiatives, and habitat restoration projects [12,13]. As satellite monitoring becomes more accessible and systematic, such tools will enable the continuous tracking of pollution trends and inform timely policy interventions. Ultimately, these risk maps bridge the gap between scientific research and environmental governance, promoting sustainable practices and resilience in vulnerable coastal regions.

5. Conclusions

This study highlights the potential of integrating remote sensing technologies with machine learning algorithms and field-based observations to detect and monitor microplastic pollution in coastal environments. Focusing on the coastal zone of Riohacha, La Guajira (Colombia), a region characterized by high vulnerability to plastic contamination, the research underscores the urgency of implementing robust, data-driven environmental monitoring frameworks.
The findings demonstrate that Sentinel-2 multispectral imagery, particularly with spectral indices such as the FDI and the NDPI, effectively estimates the concentration of floating plastic debris in aquatic systems. When calibrated with in situ measurements, these satellite-derived signals can be used to provide timely and spatially comprehensive insights into microplastic-pollution dynamics. Furthermore, integrating satellite information with geospatial analysis tools fosters the generation of environmental risk maps, pinpointing areas of high ecological risk, which can inform targeted mitigation strategies. While three machine learning models were trained using linear regression, random forest, and ANN, respectively, the latter achieved the highest predictive performance, showcasing its fitness for estimating the microplastic concentrations from remote sensing data. The proposed approach is scalable and cost-effective, making it particularly valuable for supporting evidence-based decision-making in coastal management, especially in regions constrained by limited environmental monitoring infrastructure.
Despite the promising results obtained, we acknowledge the limitations posed by the relatively small training dataset, which was derived from five months of field sampling at four coastal sites. To enhance the robustness and generalizability of the predictive models, future work should incorporate denser spatiotemporal sampling campaigns across diverse hydroclimatic conditions. Expanding the number of field measurements will enable the more accurate calibration of satellite-derived spectral features with in situ microplastic concentrations, helping to refine machine learning model performance and reduce potential overfitting. Continuous field validation will be essential to consolidate the reliability of remote sensing as a scalable tool for microplastic monitoring.
Overall, this research offers a replicable methodology to bridge technological innovation with environmental stewardship, contributing to the conservation of marine ecosystems and promoting the well-being of coastal communities. To ensure long-term impact and sustainability, future efforts should foster the widespread use of satellite-based environmental surveillance, regular field validation campaigns, and inclusive community engagement efforts.

Author Contributions

Methodology, A.C.T.-E., I.P. and R.C.-S.; Software, A.C.T.-E. and I.P.; Formal analysis, A.C.T.-E. and I.P.; Investigation, A.C.T.-E. and I.P.; Writing—original draft, A.C.T.-E., I.P., R.C.-S., D.A.B.-Á. and A.M.E.-G.; Writing—review and editing, A.C.T.-E., I.P. and L.C.G.-M. All authors have read and agreed to the published version of the manuscript.

Funding

This research was funded by MinCiencias (Ministerio de Ciencia, Tecnología e Innovación de Colombia) under the Convocatoria 950—“ColombIA Inteligente: Desarrollo e implementación de soluciones mediante inteligencia artificial y ciencias del espacio para los territorios”, contract No. 125-2024. The APC was funded by Universidad de la Costa (CUC).

Data Availability Statement

The original contributions presented in this study are included in the article. Further inquiries can be directed to the corresponding author.

Acknowledgments

The authors gratefully acknowledge the financial support provided by the Colombian Ministry of Science, Technology and Innovation (MINCIENCIAS) through the call “Convocatoria ColombIA Inteligente: Desarrollo e implementación de soluciones mediante inteligencia artificial y ciencias del espacio para los territorios”—No. 950. We also extend our sincere thanks to Universidad de la Costa for its institutional support during the execution of the project.

Conflicts of Interest

The authors declare no conflicts of interest. The funders had no role in the design of the study; in the collection, analyses, or interpretation of data; in the writing of the manuscript; or in the decision to publish the results.

References

  1. Xiao, S.; Cui, Y.; Brahney, J.; Mahowald, N.M.; Li, Q. Long distance atmospheric transport of microplastic fibres influenced by their shapes. Nat. Geosci. 2023, 16, 863–870. [Google Scholar] [CrossRef]
  2. Yarahmadi, A.; Heidari, S.; Sepahvand, P.; Afkhami, H.; Kheradjoo, H. Microplastics and environmental effects: Investigating the effects of microplastics on aquatic habitats and their impact on human health. Front. Public Health 2024, 12, 1411389. [Google Scholar] [CrossRef]
  3. Alfaro-Núñez, A.; Astorga, D.; Cáceres-Farías, L.; Bastidas, L.; Soto Villegas, C.; Macay, K.; Christensen, J.H. Microplastic pollution in seawater and marine organisms across the Tropical Eastern Pacific and Galápagos. Sci. Rep. 2021, 11, 6424. [Google Scholar] [CrossRef]
  4. Galindo Montero, A.A.; Costa-Redondo, L.C.; Vasco-Echeverri, O.; Arana, V.A. Microplastic pollution in coastal areas of Colombia: Review. Mar. Environ. Res. 2023, 190, 106027. [Google Scholar] [CrossRef]
  5. Hong, P.; Xiao, J.; Liu, H.; Niu, Z.; Ma, Y.; Wang, Q.; Zhang, D.; Ma, Y. An inversion model of microplastics abundance based on satellite remote sensing: A case study in the Bohai Sea. Sci. Total Environ. 2024, 909, 168537. [Google Scholar] [CrossRef]
  6. Biermann, L.; Clewley, D.; Martinez-Vicente, V.; Topouzelis, K. Finding plastic patches in coastal waters using optical satellite data. Sci. Rep. 2020, 10, 5364. [Google Scholar] [CrossRef]
  7. Li, D.; Li, P.; Shi, Y.; Sheerin, E.; Zhang, Z.; Yang, L.; Xiao, L.; Hill, C.; Gordon, C.; Ruether, M.; et al. Stress-induced phase separation in plastics drives the release of amorphous polymer micropollutants into water. Nat. Commun. 2025, 16, 3814. [Google Scholar] [CrossRef]
  8. Ferreira, A.T.d.S.; Oliveira, R.C.d.; Siegle, E.; Ribeiro, M.C.H.; Esteves, L.S.; Kuznetsova, M.; Dipold, J.; Freitas, A.Z.d.; Wetter, N.U. Microplastic Deposits Prediction on Urban Sandy Beaches: Integrating Remote Sensing, GNSS Positioning, µ-Raman Spectroscopy, and Machine Learning Models. Microplastics 2025, 4, 12. [Google Scholar] [CrossRef]
  9. González-Curbelo, M.Á.; Cruz-Pérez, A.; Gutiérrez-Bouzán, C.; López-Mesas, M. Assessing microplastic pollution along the Caribbean coast of La Guajira, Colombia. Mar. Pollut. Bull. 2025, 212, 117511. [Google Scholar] [CrossRef]
  10. Garcés-Ordóñez, O.; Espinosa, L.F.; Costa Muniz, M.; Salles Pereira, L.B.; Meigikos Dos Anjos, R. Abundance, distribution, and characteristics of microplastics in coastal surface waters of the Colombian Caribbean and Pacific. Environ. Sci. Pollut. Res. 2021, 28, 43431–43442. [Google Scholar] [CrossRef]
  11. INVEMAR. Informe del Estado de los Ambientes y Recursos Marinos y Costeros en Colombia, 2023; Serie Public. Periód. No. 3; INVEMAR: Santa Marta, Colombia; 242p.
  12. Gutiérrez Álvarez, N.; Arroyo De La Ossa, M.; Carrasco Aquino, R.J. Effects of climate change: An analysis in the Wayúu territory north of La Guajira, Colombia. Rev. Mex. Cienc. Agríc. 2022, 13, 893–904. [Google Scholar]
  13. Ulloa, A. The rights of the Wayúu people and water in the context of mining in La Guajira, Colombia: Demands of relational water justice. Hum. Geogr. 2020, 13, 6–15. [Google Scholar] [CrossRef]
  14. Page, M.J.; McKenzie, J.E.; Bossuyt, P.M.; Boutron, I.; Hoffmann, T.C.; Mulrow, C.D.; Shamseer, L.; Tetzlaff, J.M.; Akl, E.A.; Brennan, S.E. The PRISMA 2020 statement: An updated guideline for reporting systematic reviews. BMJ 2021, 372, n71. [Google Scholar] [CrossRef] [PubMed]
  15. Pabortsava, K.; Lampitt, R.S. High concentrations of plastic hidden beneath the surface of the Atlantic Ocean. Nat. Commun. 2020, 11, 4073. [Google Scholar] [CrossRef] [PubMed]
  16. Brandt, J.; Bittrich, L.; Fischer, F.; Kanaki, E.; Tagg, A.; Lenz, R.; Labrenz, M.; Brandes, E.; Fischer, D.; Eichhorn, K.J. High-throughput analyses of microplastic samples using Fourier transform infrared and Raman spectrometry. Appl. Spectrosc. 2020, 74, 1185–1197. [Google Scholar] [CrossRef]
  17. Sannigrahi, S.; Basu, B.; Basu, A.S.; Pilla, F. Detection of marine floating plastic using Sentinel-2 imagery and machine learning models. arXiv 2021, arXiv:2106.03694. [Google Scholar] [CrossRef]
  18. Waqas, M.; Wong, M.S.; Stocchino, A.; Abbas, S.; Hafeez, S.; Zhu, R. Marine plastic pollution detection and identification by using remote sensing-meta analysis. Mar. Pollut. Bull. 2023, 197, 115746. [Google Scholar] [CrossRef]
  19. Cutler, A.; Cutler, D.R.; Stevens, J.R. Random forests. In Ensemble Machine Learning: Methods and Applications; Springer: Cham, Switzerland, 2012; pp. 157–175. [Google Scholar]
  20. Palczewska, A.; Palczewski, J.; Marchese Robinson, R.; Neagu, D. Interpreting random forest classification models using a feature contribution method. In Integration of Reusable Systems; Springer: Cham, Switzerland, 2014; pp. 193–218. [Google Scholar]
  21. Speiser, J.L.; Miller, M.E.; Tooze, J.; Ip, E. A comparison of random forest variable selection methods for classification prediction modeling. Expert Syst. Appl. 2019, 134, 93–101. [Google Scholar] [CrossRef]
  22. Fritsch, S.; Guenther, F.; Guenther, M.F. Package ‘neuralnet.’ Training of Neural Networks. R Package 2019, 2, 30. [Google Scholar]
  23. Krogh, A. What are artificial neural networks? Nat. Biotechnol. 2008, 26, 195–197. [Google Scholar] [CrossRef]
  24. Jambeck, J.R.; Geyer, R.; Wilcox, C.; Siegler, T.R.; Perryman, M.; Andrady, A.; Narayan, R.; Law, K.L. Plastic waste inputs from land into the ocean. Science 2015, 347, 768–771. [Google Scholar] [CrossRef]
  25. Hu, B.; Dai, Y.; Zhou, H.; Sun, Y.; Yu, H.; Dai, Y.; Wang, M.; Ergu, D.; Zhou, P. Using artificial intelligence to rapidly identify microplastics pollution and predict microplastics environmental behaviors. J. Hazard. Mater. 2024, 474, 134865. [Google Scholar] [CrossRef]
  26. Su, J.; Zhang, F.; Yu, C.; Zhang, Y.; Wang, J.; Wang, C.; Wang, H.; Jiang, H. Machine learning: Next promising trend for microplastics study. J. Environ. Manag. 2023, 344, 118756. [Google Scholar] [CrossRef] [PubMed]
  27. Cacace, T.; del Coco, M.; Cocca, M.; da Silva Junior, A.G.; Gonçalves, L.M.G.; Carcagnì, P.; Paturzo, M.; Distante, C. Compact holographic imaging and machine learning for microfiber quantification in laundry wastewater. In Proceedings of the International Conference on Microplastic Pollution in the Mediterranean Sea, Naples, Italy, 25–28 September 2022; pp. 157–163. [Google Scholar]
  28. Molnár, A.D.; Málnás, K.; Bőhm, S.; Gyalai-Korpos, M.; Cserép, M.; Kiss, T. Comparative Analysis of Riverine Plastic Pollution Combining Citizen Science, Remote Sensing and Water Quality Monitoring Techniques. Sustainability 2024, 16, 5040. [Google Scholar] [CrossRef]
  29. Su, Y.; Yang, C.; Peng, Y.; Yang, C.; Wang, Y.; Wang, Y.; Yan, F.; Xing, B.; Ji, R. Lensless shadow microscopy-based shortcut analysis strategy for fast quantification of microplastic fibers released to water. Water Res. 2024, 258, 121758. [Google Scholar] [CrossRef] [PubMed]
  30. Alboody, A.; Vandenbroucke, N.; Porebski, A.; Sawan, R.; Viudes, F.; Doyen, P.; Amara, R. A new remote hyperspectral imaging system is embedded on an unmanned aquatic drone to detect and identify floating plastic litter using machine learning. Remote Sens. 2023, 15, 3455. [Google Scholar] [CrossRef]
  31. Tekman, M.B.; Walther, B.; Peter, C.; Gutow, L.; Bergmann, M. Impacts of plastic pollution in the oceans on marine species, biodiversity and ecosystems. Mar. Pollut. Bull. 2022, 197, 115746. [Google Scholar]
  32. Godasiaei, S.H. Predictive modeling of microplastic adsorption in aquatic environments using advanced machine learning models. Sci. Total Environ. 2025, 958, 178015. [Google Scholar] [CrossRef]
  33. Latwal, M.; Arora, S.; Murthy, K.S.R. Data driven AI (artificial intelligence) detection furnish economic pathways for microplastics. J. Contam. Hydrol. 2024, 264, 104365. [Google Scholar] [CrossRef]
  34. Munagala, N.S.; Kumar, V.; Srividhya, S.; Usha, G.; Jeyalakshmi, R. Micro-Objects Classification for Microplastic Pollution Detection using Holographic Images. In Proceedings of the 2024 International Conference on Advances in Computing, Communication and Applied Informatics (ACCAI), Chennai, India, 9–10 May 2024; pp. 1–7. [Google Scholar]
  35. Tirkey, A.; Upadhyay, L.S.B. Discrete sensors to detect microplastics in environment. Int. J. Environ. Sci. Technol. 2024, 21, 2357–2366. [Google Scholar] [CrossRef]
  36. Browne, M.; Crump, P.; Niven, S.; Teuten, E.; Tonkin, A.; Galloway, T.; Thompson, R. Accumulation of Microplastic on Shorelines Worldwide: Sources and Sinks. Environ. Sci. Technol. 2011, 45, 9175–9179. [Google Scholar] [CrossRef]
  37. Min, B.K.; Jeong, H.H.; Ju, M.J.; Ko, U.; Dae, K.H.; Kim, H.J.; Cho, C.R.; Soh, H.Y.; Ishibashi, Y.; Cho, H.S. Baseline study on microplastic distribution in the open surface waters of the Korean Southwest Sea. Water 2023, 15, 2393. [Google Scholar] [CrossRef]
  38. Bernal, G.; Poveda, G.; Roldán, P.; Andrade, C. Patrones de variabilidad de las temperaturas superficiales del mar en la costa Caribe colombiana. Rev. Acad. Colomb. Cienc. Exact. Fís. Nat. 2006, 30, 206–220. [Google Scholar] [CrossRef]
  39. Rueda-Roa, D.; Muller-Karger, F.E. The southern Caribbean upwelling system: Sea surface temperature, wind forcing and chlorophyll concentration patterns. Deep-Sea Res. Part I 2013, 78, 102–114. [Google Scholar] [CrossRef]
  40. Gutiérrez Leones, G.A.; Correa Ramírez, M.A.; Hormazabal Fritz, S.E. Análisis de la variabilidad espacio-temporal del sistema de surgencia de La Guajira en el dominio espacio-frecuencia, empleando el MTM-SVD. Bol. Cient. CIOH 2015, 33, 87–106. [Google Scholar] [CrossRef]
  41. Correa, M.; Hormazabal, S. MultiTaper Method–Singular Value Decomposition (MTM-SVD): Variabilidad espacio-frecuencia de las fluctuaciones del nivel del mar en el Pacífico suroriental. Lat. Am. J. Aquat. Res. 2012, 40, 1–16. [Google Scholar]
  42. Lavers, J.L.; Bond, A.L. Exceptional and rapid accumulation of anthropogenic debris on one of the world’s most remote and pristine islands. Proc. Natl. Acad. Sci. USA 2017, 114, 6052–6055. [Google Scholar] [CrossRef] [PubMed]
Figure 1. Area of study. The red line represents the coastal outline of the La Guajira Department.
Microplastics 04 00077 g001
Figure 2. The PRISMA screening flowchart.
Microplastics 04 00077 g002
Figure 3. Random forest model’s variable importance plot.
Microplastics 04 00077 g003
Figure 4. ANN model structure.
Microplastics 04 00077 g004
Figure 5. Actual vs. predicted values for the machine learning algorithms. Microplastic concentration in particles/m3.
Microplastics 04 00077 g005
Figure 6. Risk maps for the selected site. Microplastic concentration in particles/m3. The red box corresponds to the department of La Guajira.
Microplastics 04 00077 g006
Table 1. Comparison of microplastic detection techniques in the reviewed studies.
TechniqueDescriptionAdvantagesDisadvantagesReferences
Satellite imagery (Sentinel-2, MODIS)Use of multispectral imaging to identify areas of microplastic accumulationWide coverage, free data accessLow spatial resolution[25,33]
Hyperspectral spectroscopyDifferentiation of microplastics by detailed spectral analysisHigh identification accuracyHigh cost, limited access[32]
UAV sensors (drones)Capture of high-resolution aerial images to analyze the presence of microplastics in surface watersHigh image resolution, flexibility in hard-to-reach areasLower spatial coverage[34]
AI (neural networks, machine learning)Automated classification of microplastic particles from satellite or spectroscopic imageryAdaptability to different data sources, improvements in accuracyReliance on large volumes of training data[25]
Table 2. Accuracy of microplastic detection methods.
MethodAverage AccuracyAdvantagesDisadvantages
Satellite imagery + IA92%Wide coverage, automated processingLimited spatial resolution
Hyperspectral spectroscopy88%High identification accuracyHigh costs, limited access
UAV sensors85%High-resolution imagesLow spatial coverage
Machine learning algorithms90%Adaptability to different data sourcesHigh-volume data requirements
Table 3. Microplastic concentrations at the monitoring sites.
Sampling PointAverage (particles/m3)Max (particles/m3)Min (particles/m3)Average Total ParticlesMax Total ParticlesMin Total Particles
P1 (11.55, −72.91)1.741.951.53224.80252198
P2 (11.56, −72.93)0.670.700.6076.608169
P3 (11.57, −72.95)0.420.510.3259.207245
P4 (11.58, −72.97)0.440.480.4252.405749
Table 4. Signal and index values retrieved.
SampleB2B3B4B8B11B12FDINDPI
P1, Dec 202418081782.52184224129252289162.0150.132
P1, Jan 20251760.51725.51986224927702194252.4460.105
P1, Feb 20251847.51773.52137.52235.529172405165.2550.133
P1, Mar 20252027.752017.524182534.753285.52729188.1970.129
P1, Ap 20251774.515101345.514921478987−9.696−0.004
P2, Dec 20241640.51355867.5860515349.5−277.015−0.251
P2, Jan 202516841546861391.5249183−817.921−0.222
P2, Feb 202516761525814390.5294.5241.5−815.178−0.14
P2, Mar 20251928.8331772.8331186.5793.667690.667535−698.338−0.069
P2, Ap 20251730.51452.5943.5705.5618457−530.442−0.066
P3, Dec 202412831059584344729861−629.3630.359
P3, Jan 202517081448664329220164−800.327−0.199
P3, Feb 202516991447738415338279−744.208−0.102
P3, Mar 20251877.51619.51013.5742.5624.5478−618.792−0.086
P3, Ap 202516861400851656582440−531.724−0.06
P4, Dec 20241245916.5399.524112485−469.842−0.32
P4, Jan 202517241480.5668.5298.5211161.5−852.558−0.17
P4, Feb 202515191171621404.5272.5185−533.334−0.195
P4, Mar 20251785.751468.25915.75678.5580.5443.25−559.374−0.078
P4, Ap 20251735.51426897721.5629468−497.674−0.068
Table 5. Statistics of the linear regression model.
Regression Coefficients
ParameterEstimateStd. Errort-Valuep-Value
B2−0.00153540.0018339−0.8370.4301
B30.00375550.00321711.1670.2813
B4−0.00413280.0029710−1.3910.2068
B80.00053450.00141140.3790.7162
B110.00472450.00226872.0830.0758
B12−0.00355530.0016744−2.1230.0714
NDPI0.20027340.85662490.2340.8218
ANOVA and Adjusted R2
F StatisticDegrees of Freedomp-valueAdjusted R2
18.74770.00049310.8987
Table 6. Machine learning model’s prediction metrics and other attributes.
ModelMAE (particles/m3)RMSE (particles/m3)Number of TreesNumber of Neurons per (Hidden) Layer
Linear regressionFitting0.2170.320NANA
Prediction0.1890.235
Random forestFitting0.1220.166300NA
Prediction0.1060.123
ANNFitting0.0410.068NA(25, 20, 25)
Prediction0.0400.071
Disclaimer/Publisher’s Note: The statements, opinions and data contained in all publications are solely those of the individual author(s) and contributor(s) and not of MDPI and/or the editor(s). MDPI and/or the editor(s) disclaim responsibility for any injury to people or property resulting from any ideas, methods, instructions or products referred to in the content.