Abstract
Microplastics have emerged as a global environmental concern due to their widespread presence and potential effects on ecosystems. Wastewater treatment plants (WWTPs) play a critical role in mitigating the release of microplastics into the environment. This study aimed to evaluate the abundance and distribution of microplastics in three municipal WWTPs exhibiting different sludge and water treatment technologies. Samples were collected at various stages of the treatment process, including influent, primary and biological sludge, treated water, thickened sludge and dehydrated sludge. Quantification analyses were performed and then coupled with operational data to assess pollution flow rates and the microplastic balance. An important removal rate (>97%) of microplastics along the water line was observed in all three WWTPs. The lower performance of 0.75 mm screening was observed regarding microplastic capture compared to conventional primary settling on the water line. No significant differences in the pollution flow rates between primary and biological sludge were detected. Whatever the thickening and dehydration technologies that were tested, the specific quantities of microplastics along the sludge treatment lines were steady, implying the comparable behaviour of microparticular pollution to total suspended solids. These results underscored the important role of the different concentration stages of sludge treatment lines in sequestrating microplastics within the sludge fraction.
1. Introduction
Plastics became essential in daily life due to their low weight, durability, mechanical resistance and cost-effective production. The production of plastic is constantly increasing, reaching a global production of 390 million tons in 2021 [1] with an estimation of 33 billion tons in 2050 [2]. A recent report from OECD (The Organization for Economic Cooperation and Development) showed that only 9% of all plastic waste is recycled, while 19% is incinerated, 50% is sent to landfills and 22% is disposed in uncontrolled dumpsites, burned in open pits or leaked into the environment, which represents a major environmental issue [3]. Considering the low degradability of such waste, its accumulation in the environment causes important damage to flora and fauna, which has become one of the biggest challenges of the decade [4,5]. Notwithstanding its negative impact, the full consequences of plastic pollution are not totally clear and many facets of the problem still need to be investigated. [6]. From recent research, it appears that studies have essentially focused on plastic fragments called “microplastics”, defined by having a size below 5 mm [7]. Microplastics have been measured largely in the environment, especially in seas, rivers and even in ice seas (e.g., Baltic Sea), showing the alarming level of microplastic pollution and dissemination [8,9,10,11].
As outlined by Boucher et al. (2017), the main sources of microplastics are synthetic textiles (35%), tyres (28%), city dust (24%), road markings (7%), marine coating materials (3.7%) and personal care products (2%) [12]. These microplastics are primarily composed of widely used plastic polymers such as polyethylene (PE), polypropylene (PP), polystyrene (PS), polyethylene terephthalate (PET) and polyvinyl chloride (PVC). The high consumption of these polymers, coupled with their low recycling rates and high resistance to degradation, significantly contributes to their persistence as environmental pollutants [13]. Many of these microplastics are carried by waters from household drains or rainwater and end up at municipal wastewater treatment plants (WWTPs), which is the last barrier before their release in the environment [14]. It has already been observed that WWTPs drastically reduce the microplastic concentration in the treated water, with a removal rate up to 97% [15]. Indubitably, the high removal rates measured on the water lines are theoretically correlated with the accumulation of microplastics in the sludge fraction [16,17]. The presence of microplastics in sewage sludge has been measured at levels ranging from 1000 MP/kgDM to 495,000 MP/kgDM [18,19]. Most studies report microplastic concentrations at the final stage of the process; however, few provide data on the accumulation of microplastics throughout the wastewater treatment plant. This information is crucial for understanding the preferential pathways of microplastic particle transport [20].
In addition, due to the complexity of the sludge matrix and the heterogeneity of the methodologies employed for the measurement of microplastics, a high variability in the results is observed in the literature. As an example, a large panel of pretreatments of sludge samples has been used by different authors (filtration using different filter sizes, density separation, oxidation, elutriation and alkaline treatment), which can cause a non-negligible impact on the conclusions that can be drafted from their results [21,22,23]. The standardization of the analytical methodology becomes of vital importance for the understanding of the phenomena at hand.
The objective of our study was to investigate the accumulation of microplastics in three wastewater treatment plants and compare the results obtained using the same methodology. The novelty of the work lies in both the holistic and process-oriented approach of the plants. Many samples from both water and sludge treatment lines were collected from WWTPs that exhibited different treatment technologies. To estimate the pollution of microplastics in the daily flow rate, the quantitative results obtained in the measured concentrations of microplastics were crossed with the operational data of the plants. This common indicator for all streams allowed for comparative evaluations and contributions of each step of the wastewater treatment process. Hence, a global screening of the microplastic pollution in the water and the sludge streams has been made to assess the impact of each process on microplastic accumulation and to better understand the preferential path out of the plant, depending on the technology deployed.
2. Materials and Methods
2.1. Description of WWTPs
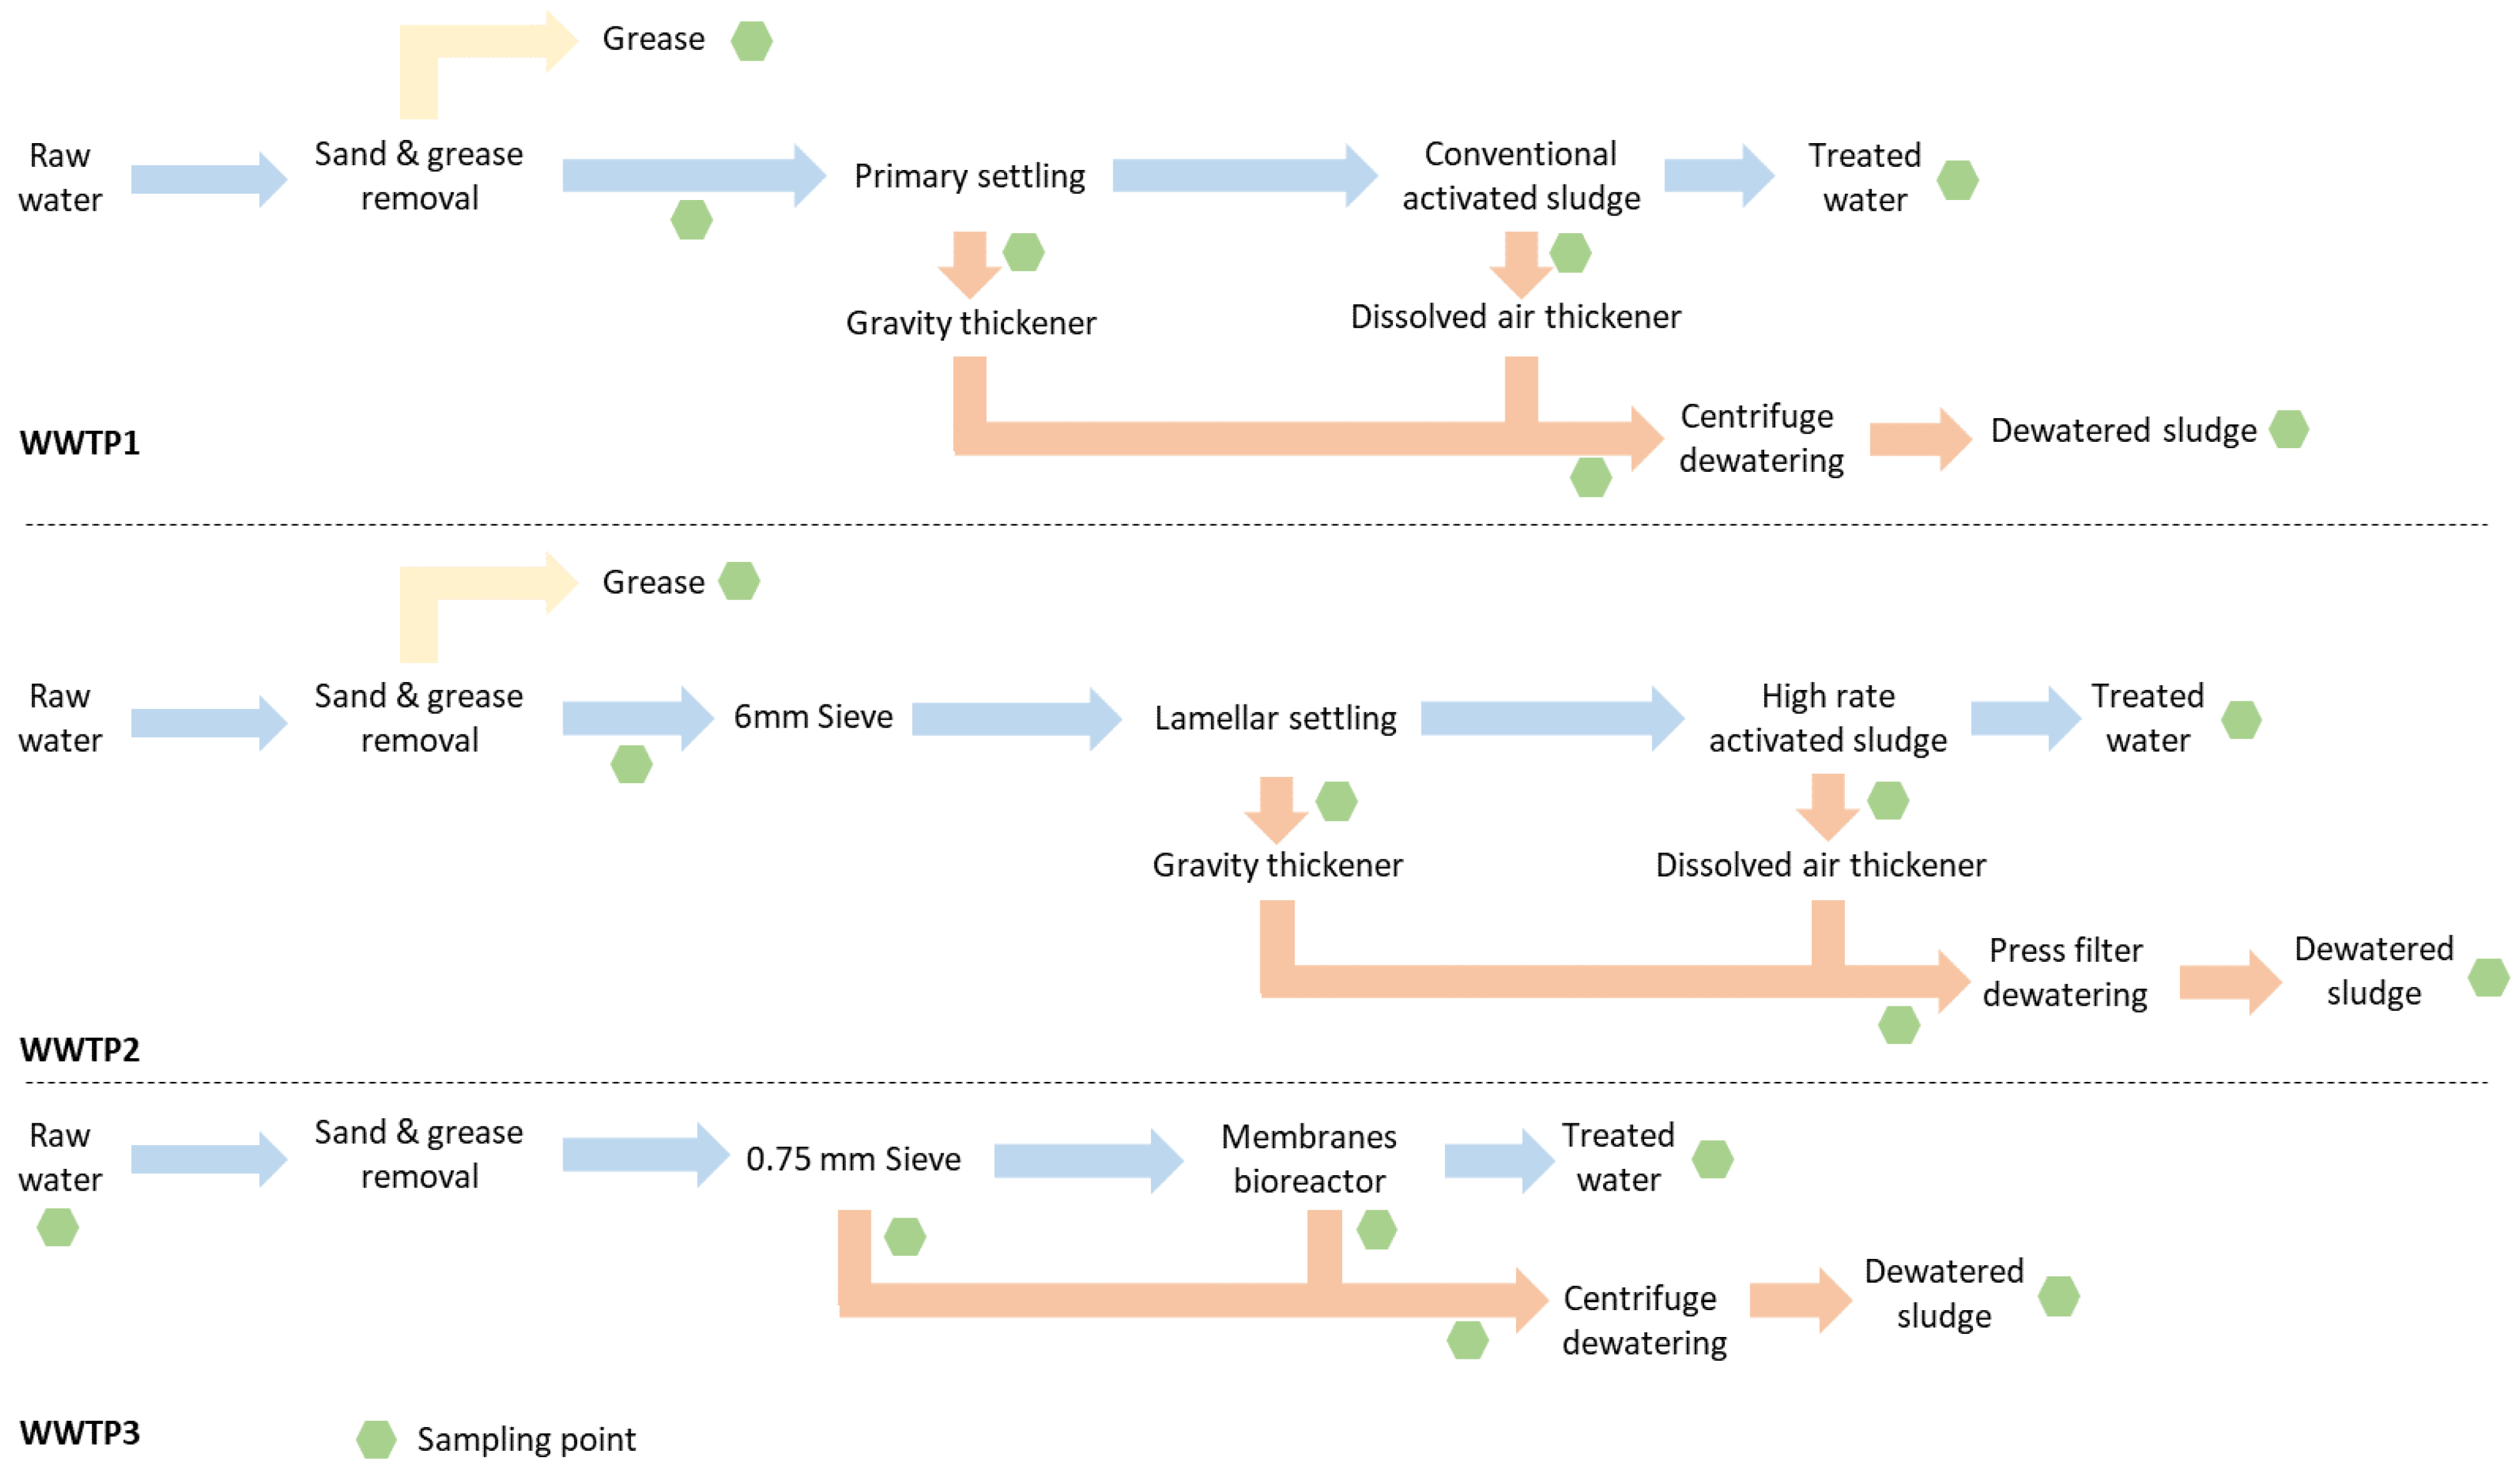
In this study, wastewater and sludge samples are collected from three different municipal WWTPs located in France. The WWTP capacity is approximately 128,000, 623,000 and 67,000 population equivalents for WWTP1, 2 and 3, respectively (Figure 1). The three selected WWTPs are chosen due to their distinct features, enabling the comparative analysis of diverse technologies for water treatment.
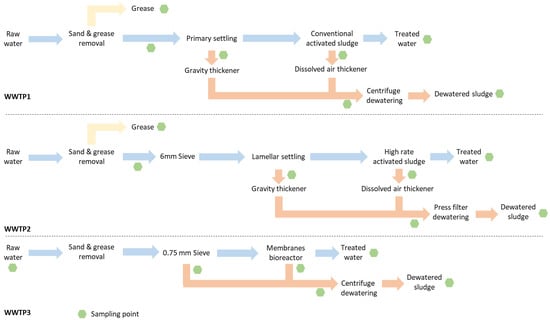
Figure 1.
Synoptic scheme of the three plants showing the different treatment steps and the sampling locations.
WWTP1 operates a low-rate Conventional Activated Sludge (CAS) system that treats both carbon and nitrogen. The water line is equipped with a 6 mm grid for screening, followed by sand and grease removal, a circular primary settler without the use of chemicals and biological tanks with clarifiers. The primary sludge undergoes gravity thickening, while the biological sludge is concentrated using a Dissolved Air Flotation (DAF) process. Both sludge types are then dewatered by centrifugation before being evacuated from the plant.
The waterline of WWTP2 is equipped with a sand and grease removal and a 6 mm grid prior to the primary treatment. The latter consists of a lamellar settler without chemical addition. The subsequent biological treatment utilizes a High Loading Rate Activated Sludge (HRAS) process, which is an intensive method focused on carbon removal. The primary sludge is thickened by gravity, while the biological sludge undergoes a DAF process. Both are then conditioned with iron salts and lime before being dewatered using a press-filter.
Finally, WWTP3 is a Membrane Bioreactor (MBR) plant that includes a 6 mm grid, followed by sand and grease removal and a 0.75 mm sieve upstream of the biological tanks. The biological treatment consists of two biological tanks and four MBRs (34 nm pore size). The sieve residues and the MBR sludge are mixed and subsequently dewatered by centrifugation. Unlike WWTP1 and 2, the inlet water in WWTP3 is collected upstream of the pretreatment process. In all the WWTPs studied, the water separated during the dewatering process is recirculated and reinjected into the treatment process before the screening step.
2.2. Sampling and Analytical Procedure
For all sampling programmes, the raw wastewater sampling (non-sludge sample) consisted of a 24 h composite sample. These samples were harvested thanks to calibrated automatic portable samplers (Hach & Isco, Ames, IA, USA) installed in the plants. The samplers were filled with twelve glass beakers of 200 mL each to retrieve the wastewater at intervals of two-hours. The samples from each beaker were then mixed pro rata according to the flow rate reconstitution (except for WWTP1 samples, where a 24 h average sample was collected). For treated water, grab sampling was performed using a sampling stick with a 1-litre glass beaker at its tip. The same grab sampling method was used for the sludge. Solid sludge samples were collected using the quartering sampling standard method to ensure homogeneity [24]. Precautions were taken during all sample collections to avoid external contaminations, including covering the operator’s hair with a hygiene cap and using plastic-free materials, including clothing and protective equipment, whenever possible. After collection, all samples were stored in a cold and dark room in aluminum-sealed glass bottles to prevent contamination.
The microplastic quantification was based on visual counting after the dilution of the sample, digestion and filtration. The procedure required an adequate concentration of sample in order to avoid the clogging of the filter during filtration, and to limit, to a maximum of 50, the number of particles in the filter. Reliable visual counting under the microscope was not considered to be possible beyond this limit. Thus, approximately 0.5 to 2 g of sludge or grease was used for each quantification. The samples were diluted with 4 L of ultrapure water and gently mixed for 24 h on an orbital shaker. The solutions were then treated with NaOH (0.2 M) at 60 °C for 24 h to dissolve the organic matter. This digestion treatment was selected to ensure the removal of organic matter without affecting the microplastics’ characteristics. Between 20 and 100 mL of the sample was then filtered on a 2 µm glass fibre filter. Seven replicates were made for each sample to obtain a reliable mean following the sample size estimation method at a 95% confidence interval. Visual inspection and counting of the microplastic particles were then performed using a binocular magnifier (×45, VisiScope®SZT360-6, VWR International, Radnor, PA, USA). A comparative study on the analytical methods for microplastic analysis has been performed by [25] and confirmed that the applied microscopy protocol is a reliable method for the quantification of total particle numbers. Figure 2 shows a selection of microplastic particles recovered from a sludge sample.
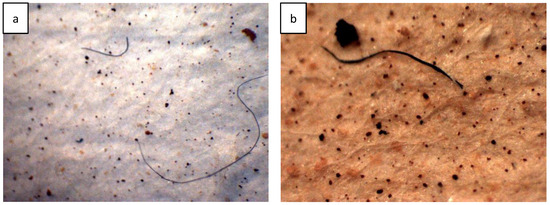
Figure 2.
Binocular magnifier observations of microplastic particles from visual sorting: (a) sample from dehydrated sludge (×20), (b) sample from sludge line (×41).
The quantification of microplastic particles was not limited to microfibers. All types of microplastic particles (pellet, fibre, bead, fragment) were considered with this method. The minimum size of quantification was 10 µm, which was lower than the usual limit of quantification observed in the literature for microplastic particles’ measurements [16,26]. The analytical protocol did not provide sufficient capability to definitively ascertain the nature of the particles being quantified. Despite the trained eyes of the operator, non-plastic particles might have been counted but it was assumed that they represented a small fraction of the microplastic particles that were counted. In addition, the total suspended solids (TSS) concentration of all samples was determined following the standard methods [27,28].
2.3. Data Analysis
After MP quantification, the results were expressed either as a concentration (MP/L) for liquid samples or as a specific quantity (MP/kg of dry matter) for sludge samples. The MP quantification data were then combined with the detailed operational data of the plant, such as the wastewater flow rate or the dry matter (DM) flow rate (depending on the case). Since both types of operational flow rates were known at the different plant locations, it was possible to express the results as the MP flow rates (MP/d). For inlet and treated water samples, Equation (1) was used, while Equation (2) was applied for sludge samples:
With FRvolume being the volumetric flow rate of water at the sample location (m3.d−1), FRmass being the dry matter mass flow rate of sludge at the sample location (kgDM.d−1), FRMP being the MP flow rate (MP.d−1), CMP being the concentration of MP (MP.m−3) and SQMP being the specific quantity of MP (MP.kgDM−1). To track the MP balance along the plant, the daily MP flow rates in the sludge line were also expressed as the percentage of the WWTP inlet. The MP flow rate of treated water was always included. The equation applied was as follows:
In the case of the sample labelled as raw sludge, which was the sum of the primary and biological sludges, both sludge MP flow rates were considered in the numerator.
3. Results and Discussion
3.1. MP Contamination in WWTPs
The results of the MP quantification were given for all three WWTPs in Table 1. The concentrations of MP observed in WWTP1 decreased from 1000 ± 50 to 15 ± 2 MP/L in the raw water and treated water, respectively, corresponding to a 98.5% removal rate on the waterline. This is consistent with previous results operated on the same plant three years earlier and with results published in the literature [29]. Overall, specific quantities of MP in sludge fractions ranged from 4.0 × 10⁶ to 5.9 × 10⁶ MP/kgDM. The highest contamination of MP was observed in primary sludge (5.9 ± 0.9 × 10⁶ MP/kgDM) while the lowest specific quantity was observed in biological sludge (4.0 ± 0.7 × 10⁶ MP/kgDM). Also, the two final fractions along the sludge line, i.e., after thickening and after the centrifugation steps, presented very similar specific quantities (5.5 ± 0.9 and 5.6 ± 1.4 × 10⁶ MP/kgDM, respectively). To express the MP contamination as a percentage of the DM exiting the plant, a hypothesis of 1 µg per MP was taken, in line with previous observations [30]. This resulted in an MP content in the dry matter of 0.56% w/w.

Table 1.
Characteristics of each collected sample. Concentrations are in MP/L; specific quantities are in ×106 MP/kgDM; sludge TSS contents are in g/L; sludge dryness, removal rates and MP content in the dry matter are expressed in percentages.
An MP removal rate of 98.2% was obtained along the waterline of WWTP2, from 808 MP/L in the inlet water to 15 in the treated water. The specific quantities retrieved in the sludge matrices ranged from 3.2 × 10⁶ to 6.3 × 10⁶ MP/kgDM (±0.6 × 10⁶), being very similar to WWTP1. However, in this case, the biological sludge demonstrated the highest specific quantity in comparison to primary sludge (6.3 ± 0.6 compared to 3.9 ± 1.1 × 10⁶ MP/kgDM, respectively). Furthermore, the specific quantities before and after the dewatering step were stable, as previously observed (3.2 ± 0.5 and 3.3 ± 0.5 × 10⁶ MP/kgDM, respectively). In terms of content, the MP represented 0.33% w/w of the dry matter exiting the plant and 0.12% of the wet weight of the dehydrated sludge.
In the third WWTP, the inlet water showed a concentration of 567 MP/L. After pretreatment, which consisted of a 6 mm grit removal followed by sand and grease removal and a 0.75 mm sieving, the observed concentration reached 458 MP/L, highlighting a moderate removal rate at this point. After the membrane bioreactor, the treated water exhibited a concentration of 14 MP/L, corresponding to an overall removal rate of 97.5%. In the sludge and sieve residues, values ranged between 0.9 × 10⁶ and 3.8 × 10⁶ MP/kgDM. Eventually, the dewatered sample showed a specific quantity of 1.6 × 10⁶ MP/kgDM, similar to biological sludge. This represented 0.16% w/w of the dry matter exiting the plant and 0.04% of the wet weight of the dehydrated sludge.
For WWTPs 1 and 2, grease samples were also analyzed. In accordance with the hydrophobic nature of most plastic polymers, the concentrations retrieved in the grease fraction were 11 and 45 times higher than in the respective inlets of WWTPs 1 and 2. This is consistent with the literature, which also mentions significant specific quantities of MP in the grease skimmed during the pretreatment [31].
Altogether, the data reveal that the inlet concentrations of MP are significantly higher than those previously reported in the literature, while being coherent with our previous studies. According to the study conducted by Liu et al. (2021), the concentrations of MP in municipal WWTPs ranged from 0.28 to 610 MP/L in influent water, with a median value of 31.1 MP/L [32]. The high concentrations observed in this study may be attributed to the analytical method used. As previously discussed by Koutnik et al. (2021), the methods employed can greatly affect the measured concentrations of MP [33]. The methods used in this study involved a lower pore size filtration (2 µm) and a lower minimal size of quantification (10 µm) than typically reported [10–300 µm] [15]. Consequently, the counting here was likely to be more exhaustive. This is also true for the type of fragments numbered. Unlike many other studies that focus solely on fibres, this work included fragments of various shapes, like, for example, beads and pellets. In addition, the quantification protocol used in this study did not include a qualitative check with FTIR or RAMAN methods [33]. Indeed, a time-effective quantification method has been favoured to be easily repeated on a wide range of samples and wastewater treatment plants in this study and in future work. Furthermore, a significant number of publications do not provide an accurate indication of the specific sampling location for the influent. The term “influent” can refer to both raw water and pretreated water, often after the grit, sand and grease removal. This lack of clarity regarding the sampling location can introduce a bias in comparative studies.
The same observations and explanations can be drawn for the sludge contamination. The literature exhibits an important variability in the reported quantities of microplastic particles, ranging from 1000 microplastic particles per kilogram of dry matter (MP/kgDM) up to 495,000 MP/kgDM [18,19]. This variation can be attributed to the diversity of the sludge types studied, ranging from those with low total suspended solid (TSS) concentrations like activated sludge, to those with high TSS concentrations such as dewatered or dried sludge. Additionally, the methods employed to quantify microplastic particles in sludge samples can significantly differ and have a substantial impact [21]. Finally, the protocols used for quantifying microplastic particles also encompass various steps or combinations of steps, including oxidative or alkaline treatment, density separation, elutriation and filtration [15], which can introduce additional variability in the measured microplastics. For that reason, the comparison of the contamination levels from one study to another should be very cautiously carried out.
For the three WWTPs, and despite the different wastewater technologies used in each of them, high removal rates were observed (>97%). First of all, the performances measured here were consistent with previous studies carried out on a wide range of plants [34,35,36]. However, we could have expected more differences in the removal rates depending on the technology used. The membrane bioreactor, an intensive filtering solution, demonstrated its strong efficiency on MP removal. Krishnan et al. (2023) highlighted its superiority in MP retention when compared to other treatment methods [35]. Also, an HRAS system produces more exopolymeric substances (EPS) and is more efficient at removing particular pollution than CAS [37]. Nevertheless, our results did not show significant differences between those three biological treatments. For future work, we suggest repeating this study to capture a wider range of MP pollution loads and operational conditions, which would help to be more conclusive on the impact of the secondary treatment on the removal rates.
3.2. MP Flow Rate and Pollution Balance of the Sludge Line Processes
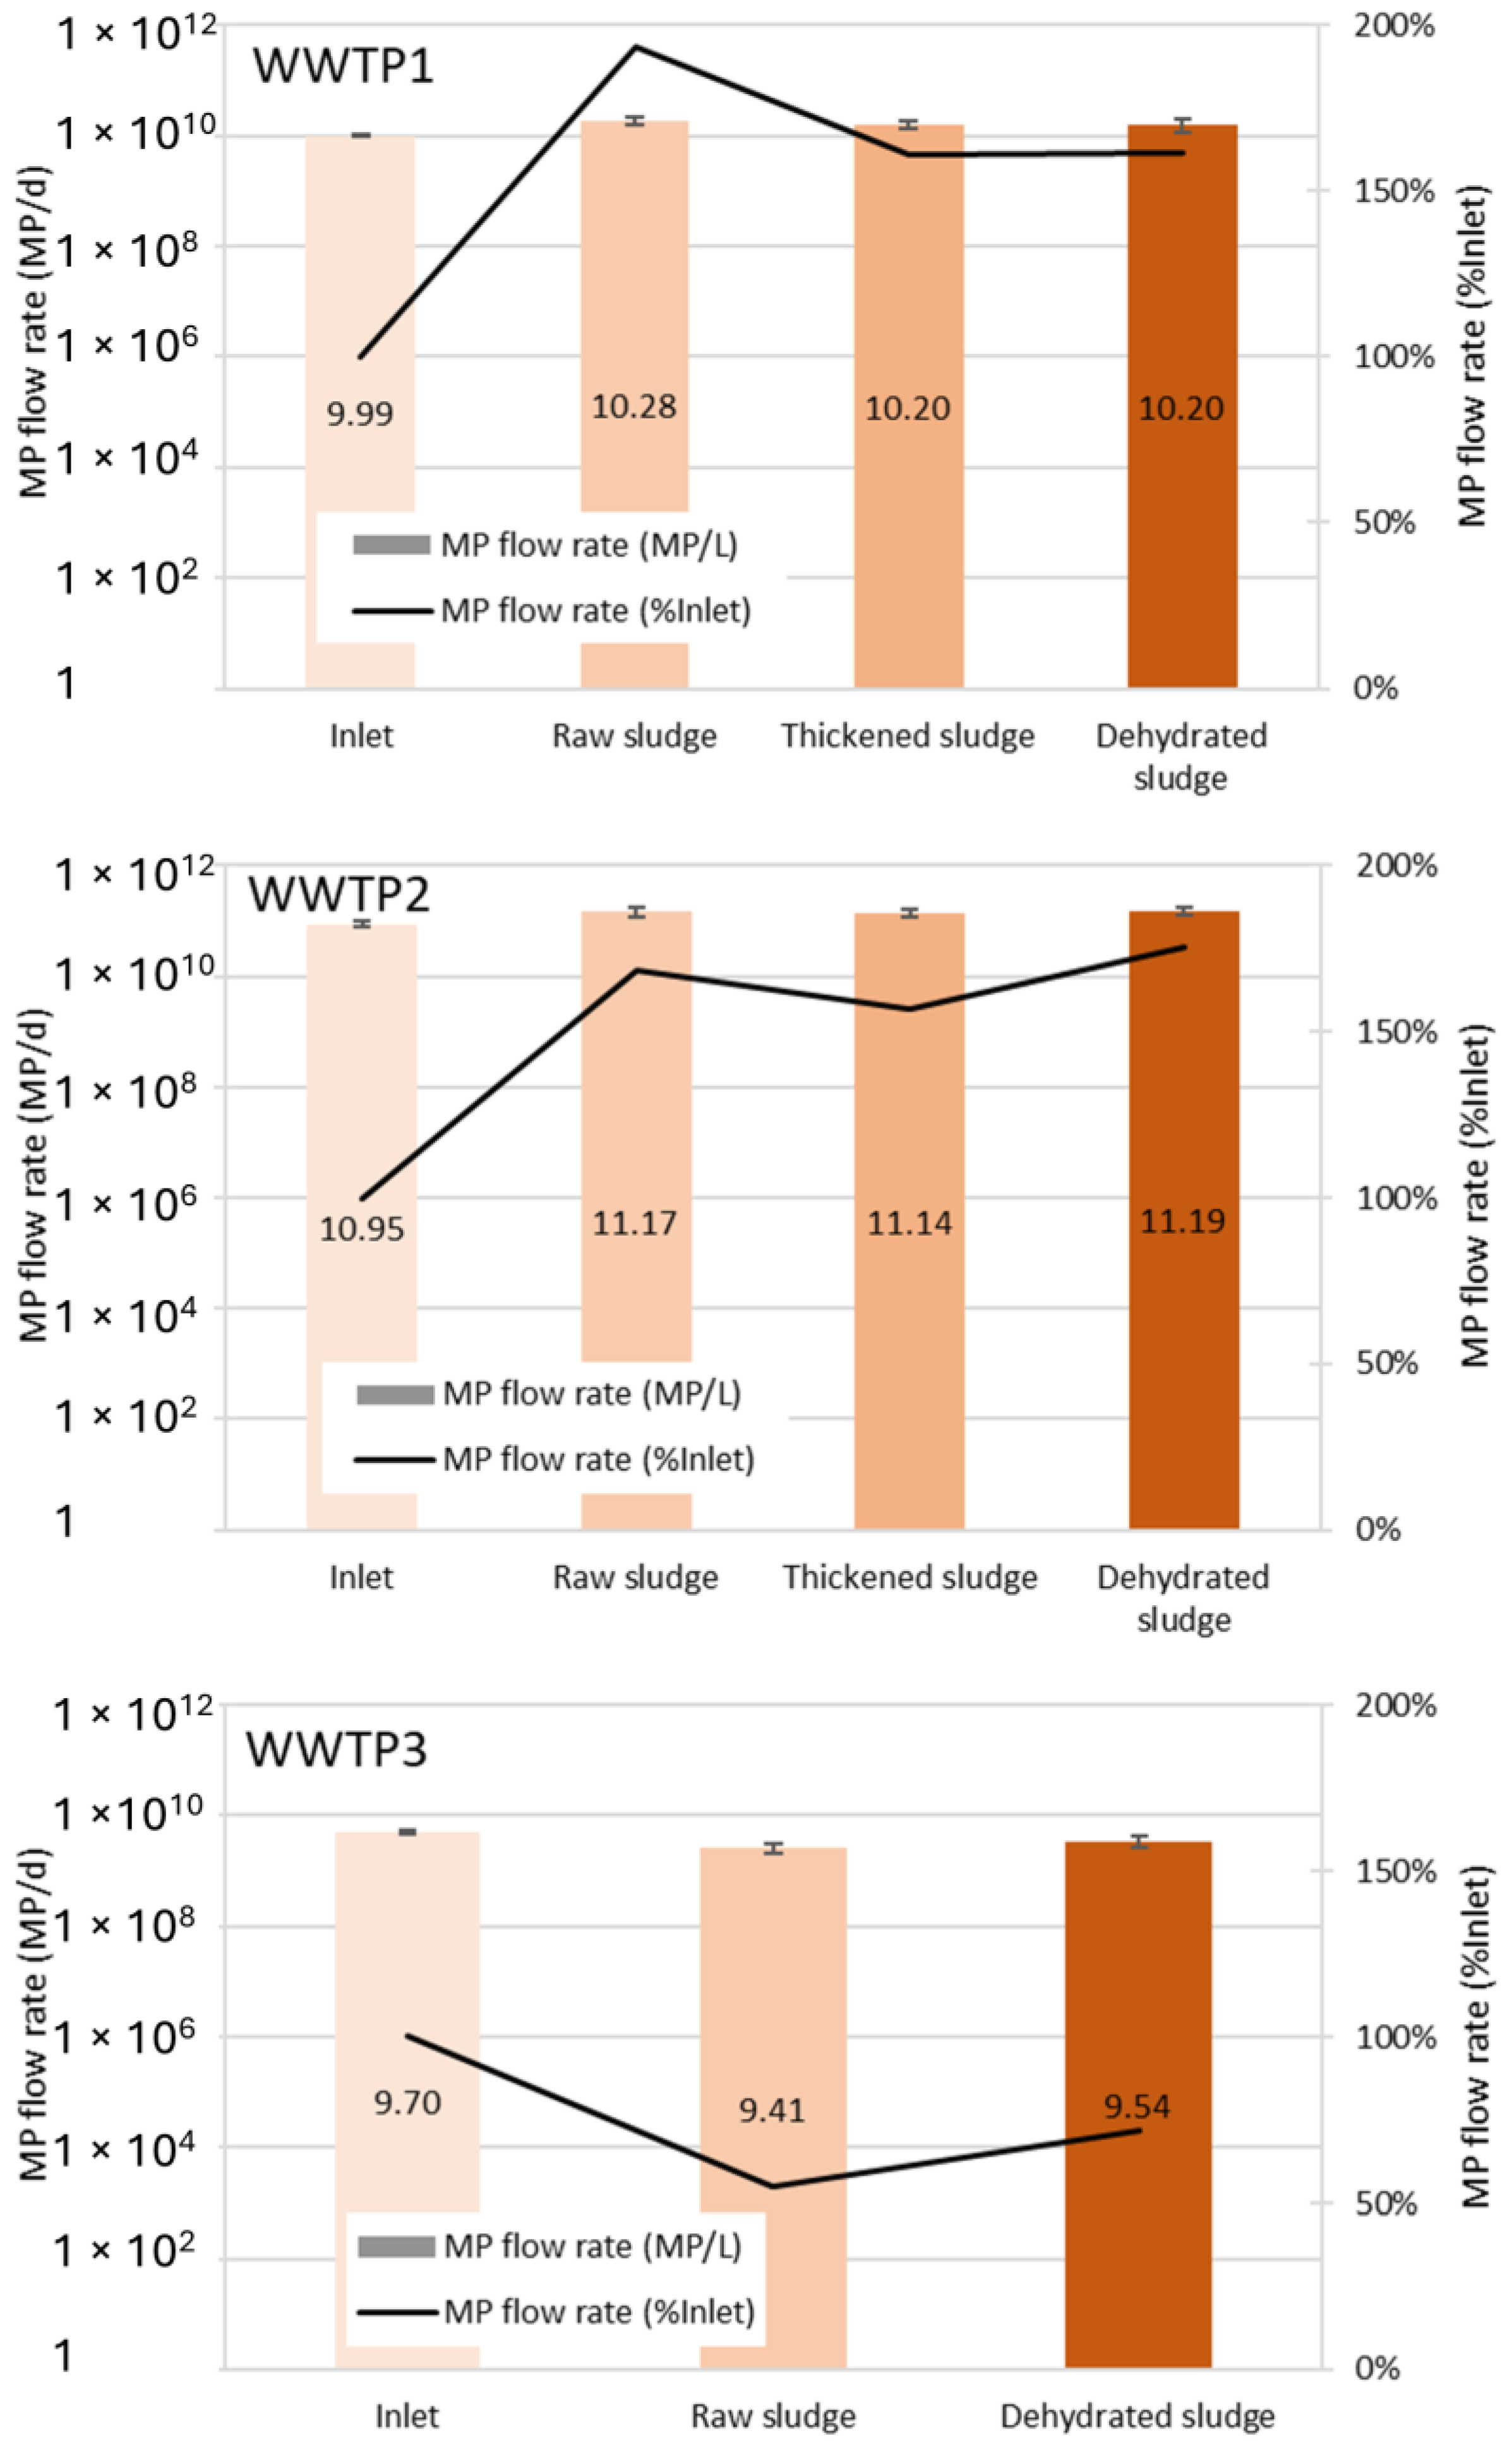
The concentrations and specific quantities of MP in the samples were compared with operational data of the plants, such as the wastewater flow rate and DM flow rate. Thus, MP flow rates were calculated and the MP balance was assessed. Figure 3 illustrates, for each plant, the MP flow rate at the different sampling points. The percentage of the MP flow rate compared to the inlet is also given according to Equation (3). The inlet MP flow rates were 9.9 × 10⁹, 8.8 × 10¹⁰ and 5.0 × 10⁹ MP/day for WWTP1, 2 and 3, respectively. Regarding the treated water, values of 1.4 × 10⁹, 1.7 × 10⁹ and 1.4 × 10⁸ MP/day were measured, respectively. This confirmed the high removal rates mentioned in the previous section, with MP flow rate reductions ranging from 1.5 to 2 log.

Figure 3.
Evolution of the daily MP flow rate (in % of the inlet and MP/d) of the three WWTPs. “Raw sludge” is the addition of MP flow rates measured in the primary sludge—or sieve residues for plant 3—and the biological sludge.
For WWTPs 1 and 2, similar trends were observed, with an increase in the MP flow rate at the raw sludge point, followed by stable values along the sludge line. In the first plant, an increase of 0.28 log was calculated in the flow, accounting for both primary and biological sludge. The values then demonstrated a fairly steady trend, with an MP flow rate ranging between 10.20 and 10.28 log (1.89 and 1.58 × 10¹⁰ MP/d), despite the different sludge treatments applied. Similar behavior was observed in WWTP2, with a 0.22 log increase in the MP flow rate in the raw sludge, followed by a steady state at around 11.15 log (2.3 × 10¹⁰ MP/d). For both WWTPs, the outlet MP flow rates corresponded to 1.61 and 1.76 times the inlet flow rates, respectively.
For WWTP3, on the other hand, a downward trend was observed. Starting at 9.70 log at the entrance of the plant, the MP flow rate slightly decreased (0.29 log) in the raw sludge, which included both sieve residues and biological sludge. Finally, the outlet MP flow rate exhibited a value of 9.54 log (3.5 × 10⁹ MP/d), corresponding to 0.72 times the inlet flow rate.
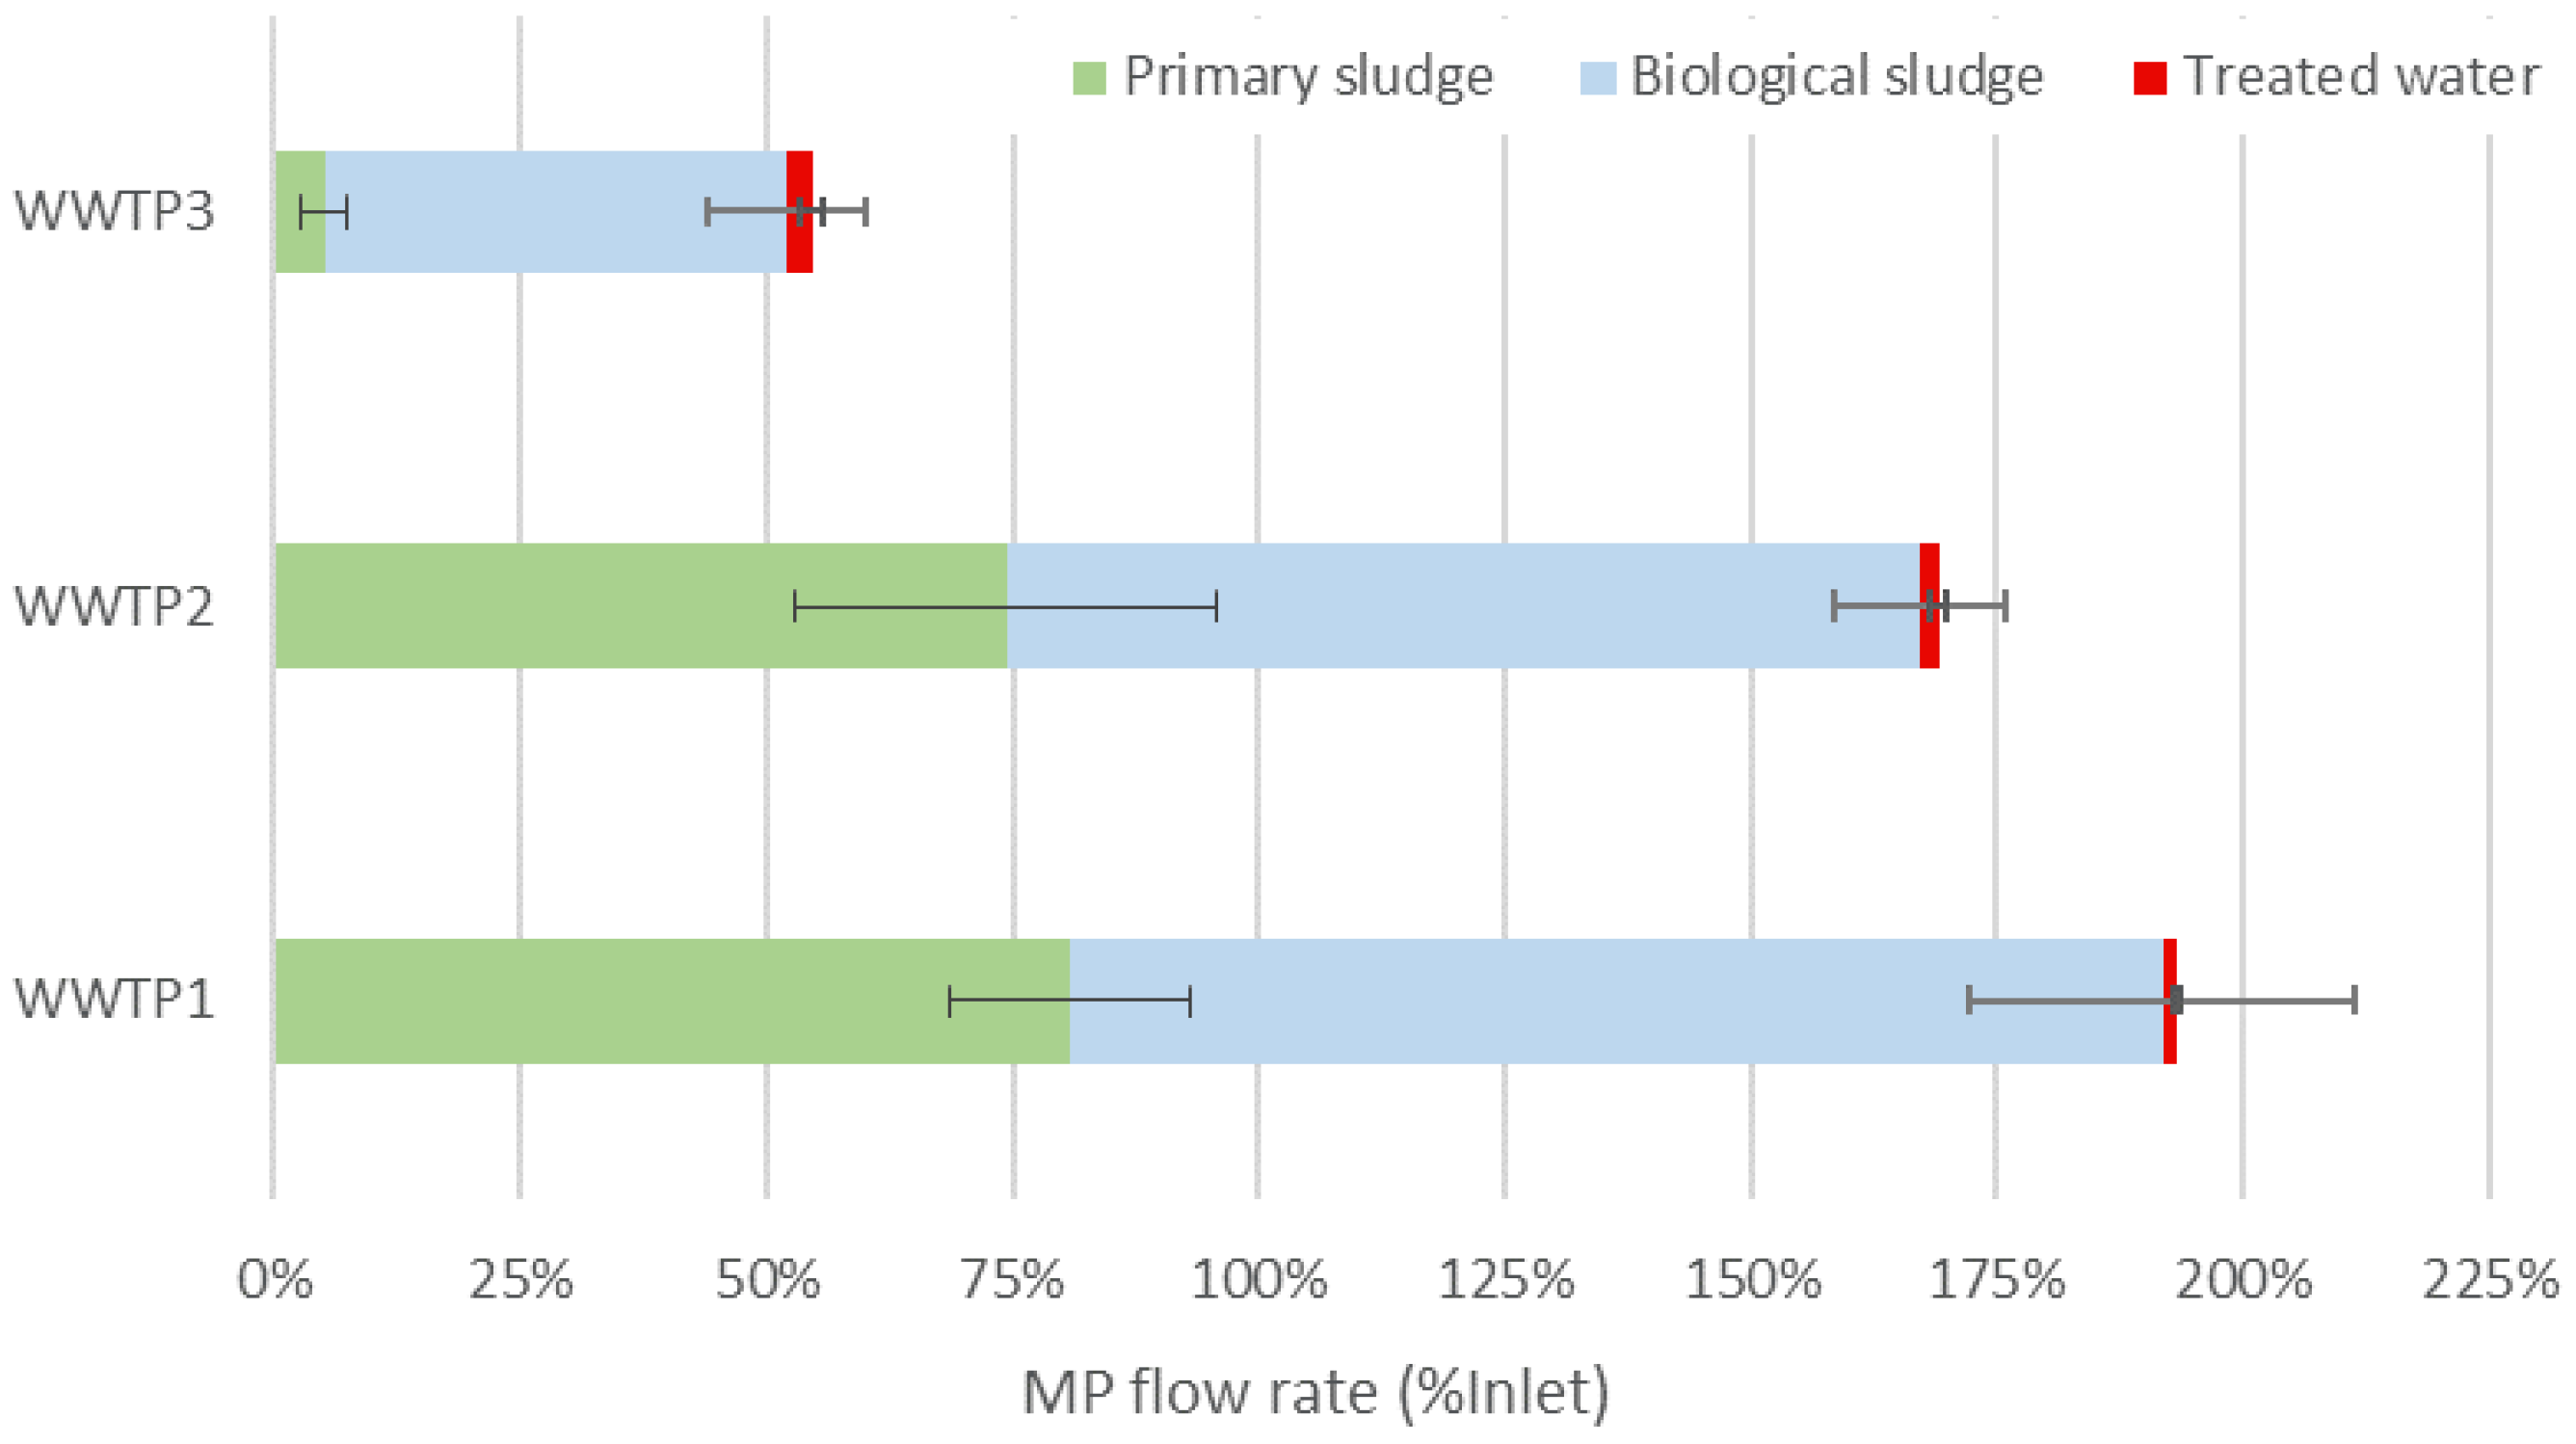
Figure 4 presents the contribution of the primary sludge—or sieve residues for WWTP3—the biological sludge and the treated water to the MP flow rates. Values are expressed as the percentage of the inlet. For WWTPs 1 and 2, the primary settlers retrieved 81 and 74%, respectively, of the inlet MP. This was consistent with previous measurements that demonstrated the important MP removal rate of primary settling. However, somewhat unexpectedly, the biological sludge samples still exhibited high percentages of MP inlet flow rate (111 and 93%, respectively). This resulted in a higher MP flow rate assessed in the raw sludge than at the inlet of the plant. In contrast, at WWTP3, the sieve residues only accounted for 5% of the inlet, while the MBR biological sludge collected 47% of the inlet MP flow rate. Ultimately, the total accounted for 72% of the MP inlet flow rate.
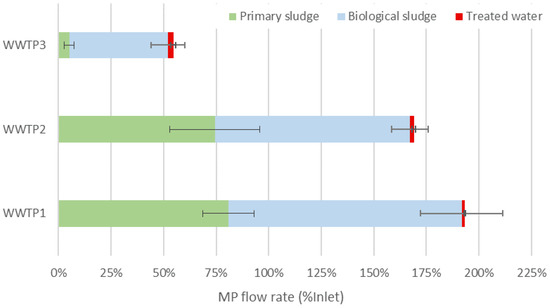
Figure 4.
Distribution in percentages of MP inlet flow rate between treated water, biological sludge and primary sludge—or sieve residues for plant 3.
Several reasons can explain this outcome. Firstly, and as mentioned above, the enumeration method used in this work did not include a qualitative check of the materials. It 3ws hence likely that sludge samples, which gathered TSS and precipitates, were even more prone to overestimation than water samples. Secondly, the MP flow rates assessed in this study were generated by crossing analytical results from 24 h composite samples and/or grab samples with data retrieved from the WWTP operators, which were at best monthly averaged or yearly averaged. It was evident that this fact introduced approximations in the MP balance, as some data were instantaneous while other added the effects of variability due to the weather or the season.
Finally, the data also questioned the possibility of a fragmentation of the MP in the primary settlers and/or in the biological tanks. The increase in inlet percentages for WWTPs 1 and 2 at the gathering of both primary and biological sludge could be explained by a multiplication effect of MPs due to fragmentation. This fragmentation could either trigger an overestimation (one microplastic was fragmented into several pieces, at least two being bigger than 10 µm), or an underestimation (one microplastic was fragmented into pieces smaller than 10 µm which would not be detected in the MP quantification). The mechanisms involved in the fragmentation of microplastics in wastewater treatment plants are not yet elucidated and there is still a need for comprehensive investigations. However, it is widely assumed that the weathering process begins with the emergence of surface defects, leading to the formation of cracks. Mechanical stresses such as pumping, water screening and bubbling can contribute to the cracking and splitting of microplastics particles. These cracks are then further intensified by shear forces arising from wear, collisions and/or water turbulences [38]. Additionally, in the biological treatment, fragmentation could occur due to biological stress. The literature remains unclear on the matter of the biodegradation and biofragmentation of microplastics in WWTPs [39,40,41]. Biofragmentation in the biological treatment could contribute to explaining the differences in MP flow rate in the raw sludge samples compared to the inlet. This effect of fragmentation and biofragmentation is an important factor to consider when analyzing the fate of microplastics in the sludge. It has already been suggested that microplastics, when subjected to prolonged exposure to biological processes, undergo further fragmentation into smaller pieces, increasing the complexity of their monitoring and enhancing their potential environmental impacts [34].
3.3. Impact of the Sludge Line Processes
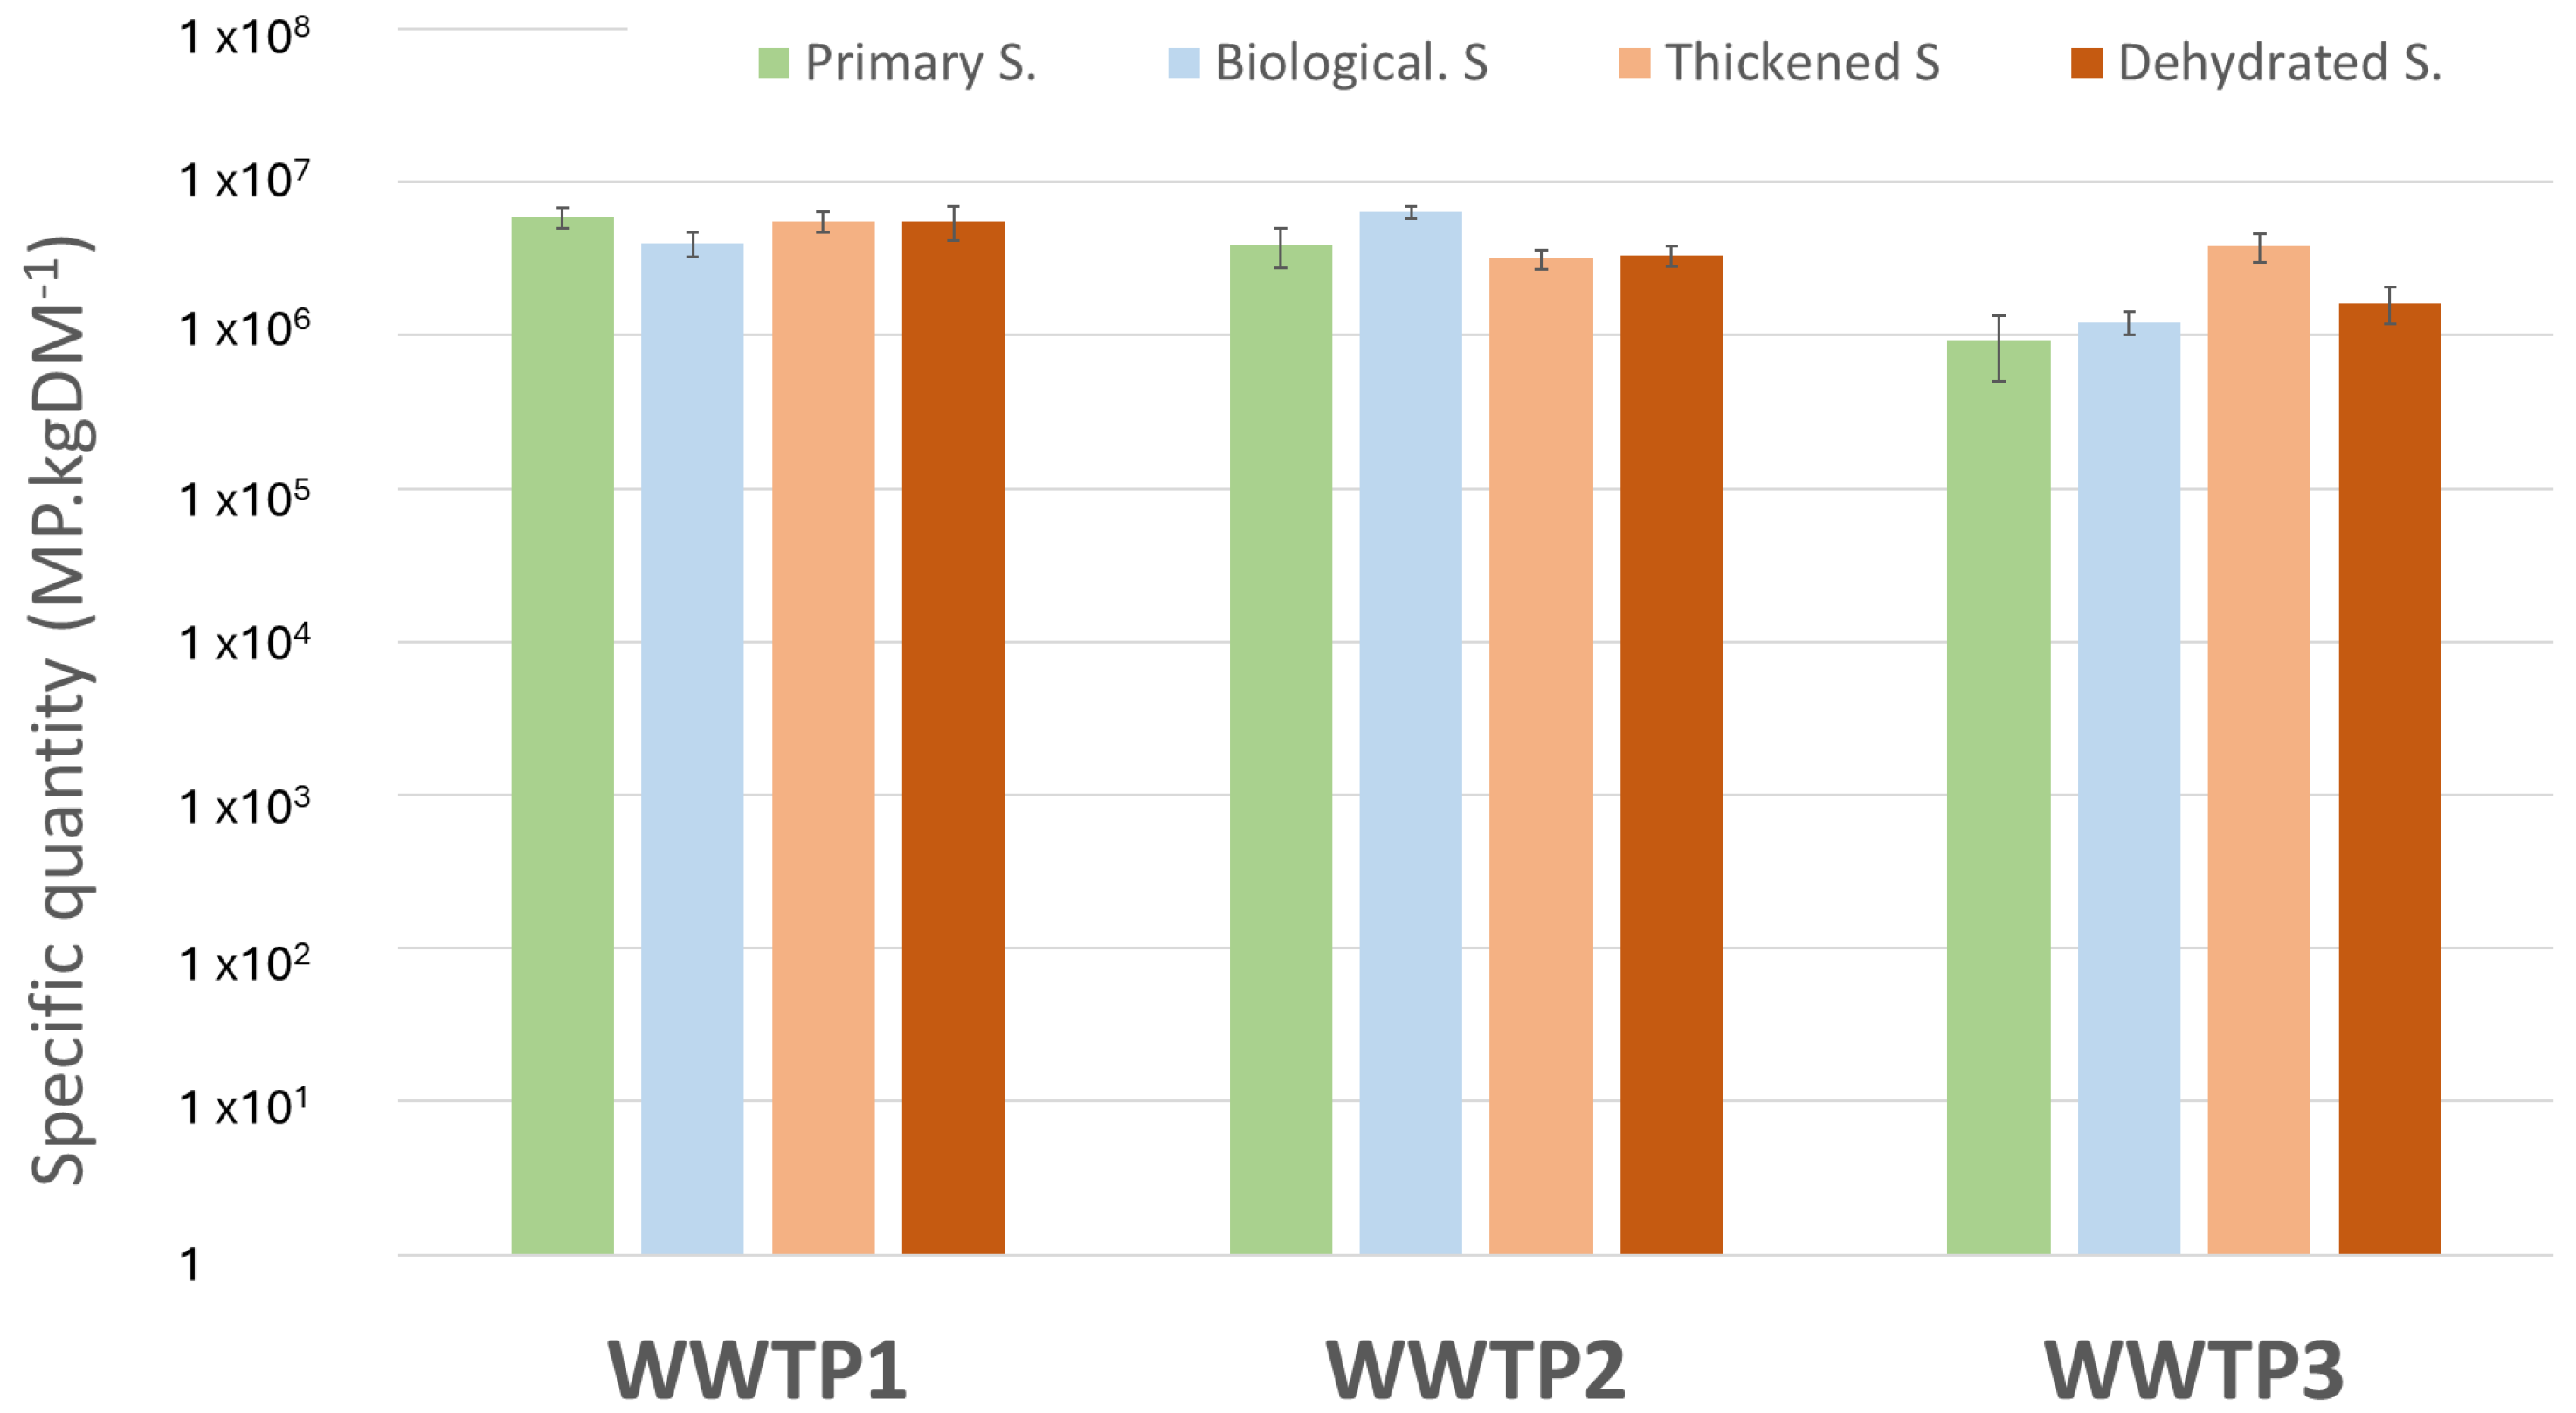
Figure 5 illustrates, for each WWTP, the specific quantities of MP measured in the different sludge samples. For the first two WWTPs, it appears that the specific quantities at the inlet and at the outlet of the thickening steps are similar. On WWTP1, the primary and the biological sludges enter with quantities of 6.77 and 6.60 log, respectively, and the thickened sludge exhibits a 6.74 log specific quantity. In WWTP2, the values in log are 6.59, 6.80 and 6.50, respectively. These data show that the two sludge thickening technologies, gravity thickening for primary sludge and DAF for biological sludge, are efficient for MP sequestration in sludge as the specific quantities are stable along the process. These results are consistent with the literature, which mentions that both technologies appear to be capable of removing the different types of microplastic particles depending on the phenomenon at stake: sedimentation or flotation. Indeed, research conducted by Bilgin et al. (2020) demonstrated that flotation applied in grit chambers was more effective in removing low-density microplastic particles such as fibres and film debris [42]. Conversely, sedimentation was found to be highly efficient in capturing fragments, with a removal rate of up to 89%. These results tend to corroborate the present findings, which suggest that MP captured by sedimentation (likely high-density and/or large-structure MP) during the primary settling follow the same fate in the gravity thickening and are concentrated in the sludge line. MP less prone to settling (low-density and/or flat-shape MP) are most probably conveyed in the biological treatment and eventually captured in the DAF.
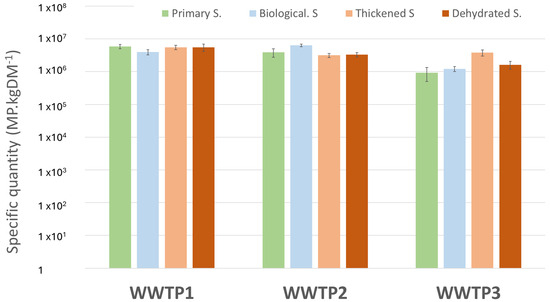
Figure 5.
Specific quantities of MP measured in primary sludge, biological sludge, thickened sludge and on the dehydrated sludge in all three plants.
The sequestration of microplastics in the sludge fraction through thickening technologies is also discussed in the literature. For example, the study by Alavian Petroody et al. (2021) reported only a 6% difference before and after thickening, highlighting the retention capacity of the sludge fraction through thickening [20]. Interestingly, the study explained that the 6% difference could be attributed to the presence of low-density microplastics, which are redirected to the supernatant phase. Therefore, the slight disparity observed in our study between the input and the output may have been due to either (1) the inherent limitations of the analytical methods used, which prevented us from achieving a high level of precision as mentioned earlier; or (2) the separation of low-density microplastics that were redirected to the water line.
In a similar manner to the thickening processes, the dewatering step shows a comparable trend. The specific quantities measured were remarkably stable before and after dewatering in the first two plants (6.74 for WWTP1 and 6.50 and 6.52, respectively, for WWTP2) equipped, respectively, with a centrifugation step and a press filter step. These results suggest that both centrifugation and press filter technologies are effective at concentrating MP into the sludge cake, rather than redirecting the pollution back in the water line. Nakao et al. (2021) found that 91% of microplastics are sequestered in the sludge line after dewatering (using centrifugation technology), with only 9% (mainly fibres) being redirected into the recirculated water, confirming our observation [43].
In WWTP3, the dewatered sludge presented a specific quantity of 6.21 log, while the two types of sludge entering the dewatered process were measured at 5.97 and 6.09 log, confirming the previous stability trend. On WWTP3, one grab sample was collected from the supernatant after centrifugation, revealing a concentration of 55.5 MP/L. This concentration was approximately 10% of the inlet concentration, but the water flow rate of the supernatant accounted for only 1% of the raw water entering the plant. Therefore, unlike previous studies [44,45], our results suggest that the contribution of the sludge line supernatant to the MP flow rate is minimal (0.11% in this case).
All things considered, these results from the thickening and dewatering processes suggest that most MPs follow the same path as the TSS along the sludge lines, regardless of the type of sludge treatment. This is further supported by the stable MP daily flow rates observed along the sludge line for all three plants. The latter are calculated based on the TSS flow rates and their stability demonstrates the link between the TSS and the MP paths. It is consistent with the literature, which mentions the mechanisms of MP trapping in the matrix of flocs [46] and the ability of flocs to retain particular pollution [47]. It also indicates that MPs are sustainably retained in the sludge, despite the mechanical stress that flocs undergo during treatment. However, as mentioned earlier, these results are based on MP quantifications without considering the size distribution of the particles. It was possible that the fragmentation of the plastic particles occurred, but it may not have significantly affected the specific quantities measured. Future studies could enhance this research by incorporating a qualitative characterization of MPs to further explore the evolution of particle size distribution along the sludge line, as already studied elsewhere [20,46,48].
4. Conclusions
This study provides valuable insights on the fate of microplastics in WWTPs. Key patterns and trends have been identified through concentration measurements and MP flow rate assessments that shed light on the microplastics’ path along the sludge and water lines. This study corroborates findings by demonstrating the important removal rates—higher than 97%—of the microparticular pollution along the water line, despite the diversity of the water treatment technologies audited (CAS, HRAS, MBR). It also demonstrates very similar behaviour between TSS and MP, since the sludge line is by far the primary pathway for microplastics to leave the WWTP.
In terms of technology employed, a lower performance of 0.75 mm screening regarding its MP capture compared to conventional primary settling was observed. This study also raises questions about the possibility of microplastic fragmentation in the primary settlers and/or biological tanks as, unexpectedly, no differences in the specific concentrations of microplastics between primary and biological sludge were detected for WWTP1 and 2. On the sludge line, whatever the sludge treatment process considered, no differences were observed in the thickening and dewatering steps across the three WWTPs considered, which shows the important role of these concentration stages in the sequestration of microplastics within the sludge fraction.
In summary, this research contributes to the foundation of future investigations, encouraging further exploration into the quantification of microplastics, for which the use of a normalized methodology is strongly advised. By expanding upon these findings, we can deepen our understanding of microplastic behaviour in WWTPs and contribute to effective mitigation strategies. These results can be used as a starting point to assess the impact of regulations such as the restriction of intentionally added plastic polymers in Europe or the obligation of filter-equipped washing machines.
Author Contributions
Conceptualization, T.S. and F.P.; validation, J.-F.L. and B.B.; formal analysis, S.R. and J.-C.A.; writing—original draft preparation, T.S. and F.P.; supervision, B.B. All authors have read and agreed to the published version of the manuscript.
Funding
This work is part of the French national MICROPLASTIC2 project, led by Suez and coordinated by Labocea. The project was funded by Suez, the French Fonds Unique Interministeriel (FUI) and the local communities (Brest and Toulon metropoles, Britany and PACA Regions, Var and Finistère districts).
Institutional Review Board Statement
Not applicable.
Informed Consent Statement
Not applicable.
Data Availability Statement
Data are contained within the article.
Acknowledgments
The authors are grateful to all the members of this national project. They also want to thank the staff of the three plants for their help and time.
Conflicts of Interest
Authors Thibaut Saur, Florian Paillet, Samuel Robert, Jean-Claude Alibar, Jean-François Loret and Bruno Barillon were employed by the company SUEZ, CIRSEE. The authors declare that the research was conducted in the absence of any commercial or financial relationships that could be construed as a potential conflict of interest.
References
- Janssens, V. Plastics—The Facts 2022. Plast. Eur. 2022, 2022, 1–81. [Google Scholar]
- Rochman, C.M.; Browne, M.A.; Halpern, B.S.; Hentschel, B.T.; Hoh, E.; Karapanagioti, H.K.; Rios-Mendoza, L.M.; Takada, H.; Teh, S.; Thompson, R.C. Classify Plastic Waste as Hazardous. Nature 2013, 494, 169–171. [Google Scholar] [CrossRef] [PubMed]
- OECD. Global Plastics Outlook: Economic Drivers, Environmental Impacts and Policy Options; OECD: Paris, France, 2022; ISBN 9789264654945. [Google Scholar]
- Gérigny, O.; Pedrotti, M.-L.; El Rakwe, M.; Brun, M.; Pavec, M.; Henry, M.; Mazeas, F.; Maury, J.; Garreau, P.; Galgani, F. Characterization of Floating Microplastic Contamination in the Bay of Marseille (French Mediterranean Sea) and Its Impact on Zooplankton and Mussels. Mar. Pollut. Bull. 2022, 175, 113353. [Google Scholar] [CrossRef]
- Seoane, M.; González-Fernández, C.; Soudant, P.; Huvet, A.; Esperanza, M.; Cid, Á.; Paul-Pont, I. Polystyrene Microbeads Modulate the Energy Metabolism of the Marine Diatom Chaetoceros Neogracile. Environ. Pollut. 2019, 251, 363–371. [Google Scholar] [CrossRef] [PubMed]
- SAPEA. Science Advice for Policy by European Academies: A Scientific Perspective on Microplastics in Nature and Society; SAPEA: Berlin, Germany, 2019. [Google Scholar]
- Acarer Arat, S. A Review of Microplastics in Wastewater Treatment Plants in Türkiye: Characteristics, Removal Efficiency, Mitigation Strategies for Microplastic Pollution and Future Perspective. Water Sci. Technol. 2024, 89, 1771–1786. [Google Scholar] [CrossRef]
- Talvitie, J.; Heinonen, M.; Pääkkönen, J.-P.; Vahtera, E.; Mikola, A.; Setälä, O.; Vahala, R. Do Wastewater Treatment Plants Act as a Potential Point Source of Microplastics? Preliminary Study in the Coastal Gulf of Finland, Baltic Sea. Water Sci. Technol. 2015, 72, 1495–1504. [Google Scholar] [CrossRef]
- Nie, H.; Wang, J.; Xu, K.; Huang, Y.; Yan, M. Microplastic Pollution in Water and Fish Samples around Nanxun Reef in Nansha Islands, South China Sea. Sci. Total Environ. 2019, 696, 134022. [Google Scholar] [CrossRef]
- Geilfus, N.-X.; Munson, K.M.; Sousa, J.; Germanov, Y.; Bhugaloo, S.; Babb, D.; Wang, F. Distribution and Impacts of Microplastic Incorporation within Sea Ice. Mar. Pollut. Bull. 2019, 145, 463–473. [Google Scholar] [CrossRef]
- Xiong, X.; Wu, C.; Elser, J.J.; Mei, Z.; Hao, Y. Occurrence and Fate of Microplastic Debris in Middle and Lower Reaches of the Yangtze River—From Inland to the Sea. Sci. Total Environ. 2019, 659, 66–73. [Google Scholar] [CrossRef]
- Boucher, J.; Friot, D. Primary Microplastics in the Oceans: A Global Evaluation of Sources; IUCN: Gland, Switzerland, 2017. [Google Scholar]
- Acarer, S. Microplastics in Wastewater Treatment Plants: Sources, Properties, Removal Efficiency, Removal Mechanisms, and Interactions with Pollutants. Water Sci. Technol. 2023, 87, 685–710. [Google Scholar] [CrossRef]
- Frère, L.; Paul-Pont, I.; Rinnert, E.; Petton, S.; Jaffré, J.; Bihannic, I.; Soudant, P.; Lambert, C.; Huvet, A. Influence of Environmental and Anthropogenic Factors on the Composition, Concentration and Spatial Distribution of Microplastics: A Case Study of the Bay of Brest (Brittany, France). Environ. Pollut. 2017, 225, 211–222. [Google Scholar] [CrossRef]
- Sun, J.; Dai, X.; Wang, Q.; van Loosdrecht, M.C.M.; Ni, B.-J. Microplastics in Wastewater Treatment Plants: Detection, Occurrence and Removal. Water Res. 2019, 152, 21–37. [Google Scholar] [CrossRef] [PubMed]
- Li, X.; Chen, L.; Mei, Q.; Dong, B.; Dai, X.; Ding, G.; Zeng, E.Y. Microplastics in Sewage Sludge from the Wastewater Treatment Plants in China. Water Res. 2018, 142, 75–85. [Google Scholar] [CrossRef]
- Salmi, P.; Ryymin, K.; Karjalainen, A.K.; Mikola, A.; Uurasjärvi, E.; Talvitie, J. Particle Balance and Return Loops for Microplastics in a Tertiary-Level Wastewater Treatment Plant. Water Sci. Technol. 2021, 84, 89–100. [Google Scholar] [CrossRef] [PubMed]
- Mintenig, S.M.; Int-Veen, I.; Löder, M.G.J.; Primpke, S.; Gerdts, G. Identification of Microplastic in Effluents of Waste Water Treatment Plants Using Focal Plane Array-Based Micro-Fourier-Transform Infrared Imaging. Water Res. 2017, 108, 365–372. [Google Scholar] [CrossRef]
- Sujathan, S.; Kniggendorf, A.-K.; Kumar, A.; Roth, B.; Rosenwinkel, K.-H.; Nogueira, R. Heat and Bleach: A Cost-Efficient Method for Extracting Microplastics from Return Activated Sludge. Arch. Environ. Contam. Toxicol. 2017, 73, 641–648. [Google Scholar] [CrossRef] [PubMed]
- Alavian Petroody, S.S.; Hashemi, S.H.; van Gestel, C.A.M. Transport and Accumulation of Microplastics through Wastewater Treatment Sludge Processes. Chemosphere 2021, 278, 130471. [Google Scholar] [CrossRef]
- Li, Q.; Wu, J.; Zhao, X.; Gu, X.; Ji, R. Separation and Identification of Microplastics from Soil and Sewage Sludge. Environ. Pollut. 2019, 254, 113076. [Google Scholar] [CrossRef]
- Hatinoğlu, M.D.; Sanin, F.D. Sewage Sludge as a Source of Microplastics in the Environment: A Review of Occurrence and Fate during Sludge Treatment. J. Environ. Manag. 2021, 295, 113028. [Google Scholar] [CrossRef]
- Bäuerlein, P.S.; Pieke, E.N.; Oesterholt, F.I.H.M.; ter Laak, T.; Kools, S.A.E. Microplastic Discharge from a Wastewater Treatment Plant: Long Term Monitoring to Compare Two Analytical Techniques, LDIR and Optical Microscopy While Also Assessing the Removal Efficiency of a Bubble Curtain. Water Sci. Technol. 2023, 87, 39–56. [Google Scholar] [CrossRef]
- ISO 5667-12:2011; Water Quality—Sampling—Part 13: Guidance on Sampling of Sludges. International Organization for Standardization: Geneva, Switzerland, 2011.
- Müller, Y.K.; Wernicke, T.; Pittroff, M.; Witzig, C.S.; Storck, F.R.; Klinger, J.; Zumbülte, N. Microplastic Analysis—Are We Measuring the Same? Results on the First Global Comparative Study for Microplastic Analysis in a Water Sample. Anal. Bioanal. Chem. 2020, 412, 555–560. [Google Scholar] [CrossRef] [PubMed]
- Mahon, A.M.; O’Connell, B.; Healy, M.G.; O’Connor, I.; Officer, R.; Nash, R.; Morrison, L. Microplastics in Sewage Sludge: Effects of Treatment. Environ. Sci. Technol. 2017, 51, 810–818. [Google Scholar] [CrossRef]
- ISO 11923:1997; Water Quality—Determination of Suspended Solids by Filtration Through Glass-Fibre Filters. International Organization for Standardization: Geneva, Switzerland, 1997.
- NF T90-105-2; Qualité de L’eau—Dosage des Matières en Suspension—Méthode par Centrifugation. Association Française de Normalisation: La Plaine Saint-Denis, France, 1997.
- Pedrotti, M.L.; Petit, S.; Eyheraguibel, B.; Kerros, M.E.; Elineau, A.; Ghiglione, J.F.; Loret, J.F.; Rostan, A.; Gorsky, G. Pollution by Anthropogenic Microfibers in North-West Mediterranean Sea and Efficiency of Microfiber Removal by a Wastewater Treatment Plant. Sci. Total Environ. 2021, 758, 144195. [Google Scholar] [CrossRef]
- Hann, S.; Sherrington, C.; Jamieson, O.; Hickman, M.; Kershaw, P.; Bapasola, A.; Cole, G. Investigating Options for Reducing Releases in the Aquatic Environment of Microplastics Emitted by (but Not Intentionally Added in) Products—Interim Report. Rep. DG Environ. Eur. Comm. 2018, 62, 1596–1605. [Google Scholar]
- Murphy, F.; Ewins, C.; Carbonnier, F.; Quinn, B. Wastewater Treatment Works (WwTW) as a Source of Microplastics in the Aquatic Environment. Environ. Sci. Technol. 2016, 50, 5800–5808. [Google Scholar] [CrossRef]
- Liu, W.; Zhang, J.; Liu, H.; Guo, X.; Zhang, X.; Yao, X.; Cao, Z.; Zhang, T. A Review of the Removal of Microplastics in Global Wastewater Treatment Plants: Characteristics and Mechanisms. Environ. Int. 2021, 146, 106277. [Google Scholar] [CrossRef] [PubMed]
- Koutnik, V.S.; Alkidim, S.; Leonard, J.; DePrima, F.; Cao, S.; Hoek, E.M.V.; Mohanty, S.K. Unaccounted Microplastics in Wastewater Sludge: Where Do They Go? ACS ES&T Water 2021, 1, 1086–1097. [Google Scholar] [CrossRef]
- Rasmussen, L.A.; Iordachescu, L.; Tumlin, S.; Vollertsen, J. A Complete Mass Balance for Plastics in a Wastewater Treatment Plant—Macroplastics Contributes More than Microplastics. Water Res. 2021, 201, 117307. [Google Scholar] [CrossRef]
- Krishnan, R.Y.; Manikandan, S.; Subbaiya, R.; Karmegam, N.; Kim, W.; Govarthanan, M. Recent Approaches and Advanced Wastewater Treatment Technologies for Mitigating Emerging Microplastics Contamination—A Critical Review. Sci. Total Environ. 2023, 858, 159681. [Google Scholar] [CrossRef]
- Talvitie, J.; Mikola, A.; Koistinen, A.; Setälä, O. Solutions to Microplastic Pollution—Removal of Microplastics from Wastewater Effluent with Advanced Wastewater Treatment Technologies. Water Res. 2017, 123, 401–407. [Google Scholar] [CrossRef]
- Jimenez, J.; Miller, M.; Bott, C.; Murthy, S.; De Clippeleir, H.; Wett, B. High-Rate Activated Sludge System for Carbon Management—Evaluation of Crucial Process Mechanisms and Design Parameters. Water Res. 2015, 87, 476–482. [Google Scholar] [CrossRef]
- Enfrin, M.; Dumée, L.F.; Lee, J. Nano/Microplastics in Water and Wastewater Treatment Processes—Origin, Impact and Potential Solutions. Water Res. 2019, 161, 621–638. [Google Scholar] [CrossRef]
- Mohanan, N.; Montazer, Z.; Sharma, P.K.; Levin, D.B. Microbial and Enzymatic Degradation of Synthetic Plastics. Front. Microbiol. 2020, 11, 580709. [Google Scholar] [CrossRef] [PubMed]
- Monira, S.; Roychand, R.; Hai, F.I.; Bhuiyan, M.; Dhar, B.R.; Pramanik, B.K. Nano and Microplastics Occurrence in Wastewater Treatment Plants: A Comprehensive Understanding of Microplastics Fragmentation and Their Removal. Chemosphere 2023, 334, 139011. [Google Scholar] [CrossRef] [PubMed]
- Wilkes, R.A.; Aristilde, L. Degradation and Metabolism of Synthetic Plastics and Associated Products by Pseudomonas sp.: Capabilities and Challenges. J. Appl. Microbiol. 2017, 123, 582–593. [Google Scholar] [CrossRef]
- Bilgin, M.; Yurtsever, M.; Karadagli, F. Microplastic Removal by Aerated Grit Chambers versus Settling Tanks of a Municipal Wastewater Treatment Plant. J. Water Process Eng. 2020, 38, 101604. [Google Scholar] [CrossRef]
- Nakao, S.; Akita, K.; Ozaki, A.; Masumoto, K.; Okuda, T. Circulation of Fibrous Microplastic (Microfiber) in Sewage and Sewage Sludge Treatment Processes. Sci. Total Environ. 2021, 795, 148873. [Google Scholar] [CrossRef]
- Talvitie, J.; Mikola, A.; Setala, O.; Heinonen, M.; Koistinen, A.; Setälä, O.; Heinonen, M.; Koistinen, A. How Well Is Microlitter Purified from Wastewater?—A Detailed Study on the Stepwise Removal of Microlitter in a Tertiary Level Wastewater Treatment Plant. Water Res. 2017, 109, 164–172. [Google Scholar] [CrossRef]
- Carnevale Miino, M.; Galafassi, S.; Zullo, R.; Torretta, V.; Rada, E.C. Microplastics Removal in Wastewater Treatment Plants: A Review of the Different Approaches to Limit Their Release in the Environment. Sci. Total Environ. 2024, 930, 172675. [Google Scholar] [CrossRef]
- Edo, C.; González-Pleiter, M.; Leganés, F.; Fernández-Piñas, F.; Rosal, R. Fate of Microplastics in Wastewater Treatment Plants and Their Environmental Dispersion with Effluent and Sludge. Environ. Pollut. 2020, 259, 113837. [Google Scholar] [CrossRef]
- Layer, M.; Bock, K.; Ranzinger, F.; Horn, H.; Morgenroth, E.; Derlon, N. Particulate Substrate Retention in Plug-Flow and Fully-Mixed Conditions during Operation of Aerobic Granular Sludge Systems. Water Res. X 2020, 9, 100075. [Google Scholar] [CrossRef] [PubMed]
- Carr, S.A.; Liu, J.; Tesoro, A.G. Transport and Fate of Microplastic Particles in Wastewater Treatment Plants. Water Res. 2016, 91, 174–182. [Google Scholar] [CrossRef] [PubMed]

Disclaimer/Publisher’s Note: The statements, opinions and data contained in all publications are solely those of the individual author(s) and contributor(s) and not of MDPI and/or the editor(s). MDPI and/or the editor(s) disclaim responsibility for any injury to people or property resulting from any ideas, methods, instructions or products referred to in the content. |
© 2025 by the authors. Licensee MDPI, Basel, Switzerland. This article is an open access article distributed under the terms and conditions of the Creative Commons Attribution (CC BY) license (https://creativecommons.org/licenses/by/4.0/).