
Influence on the Result by Abrasion on Filter Casings, Tested in the Environment in Finnmark, Norway

Abstract
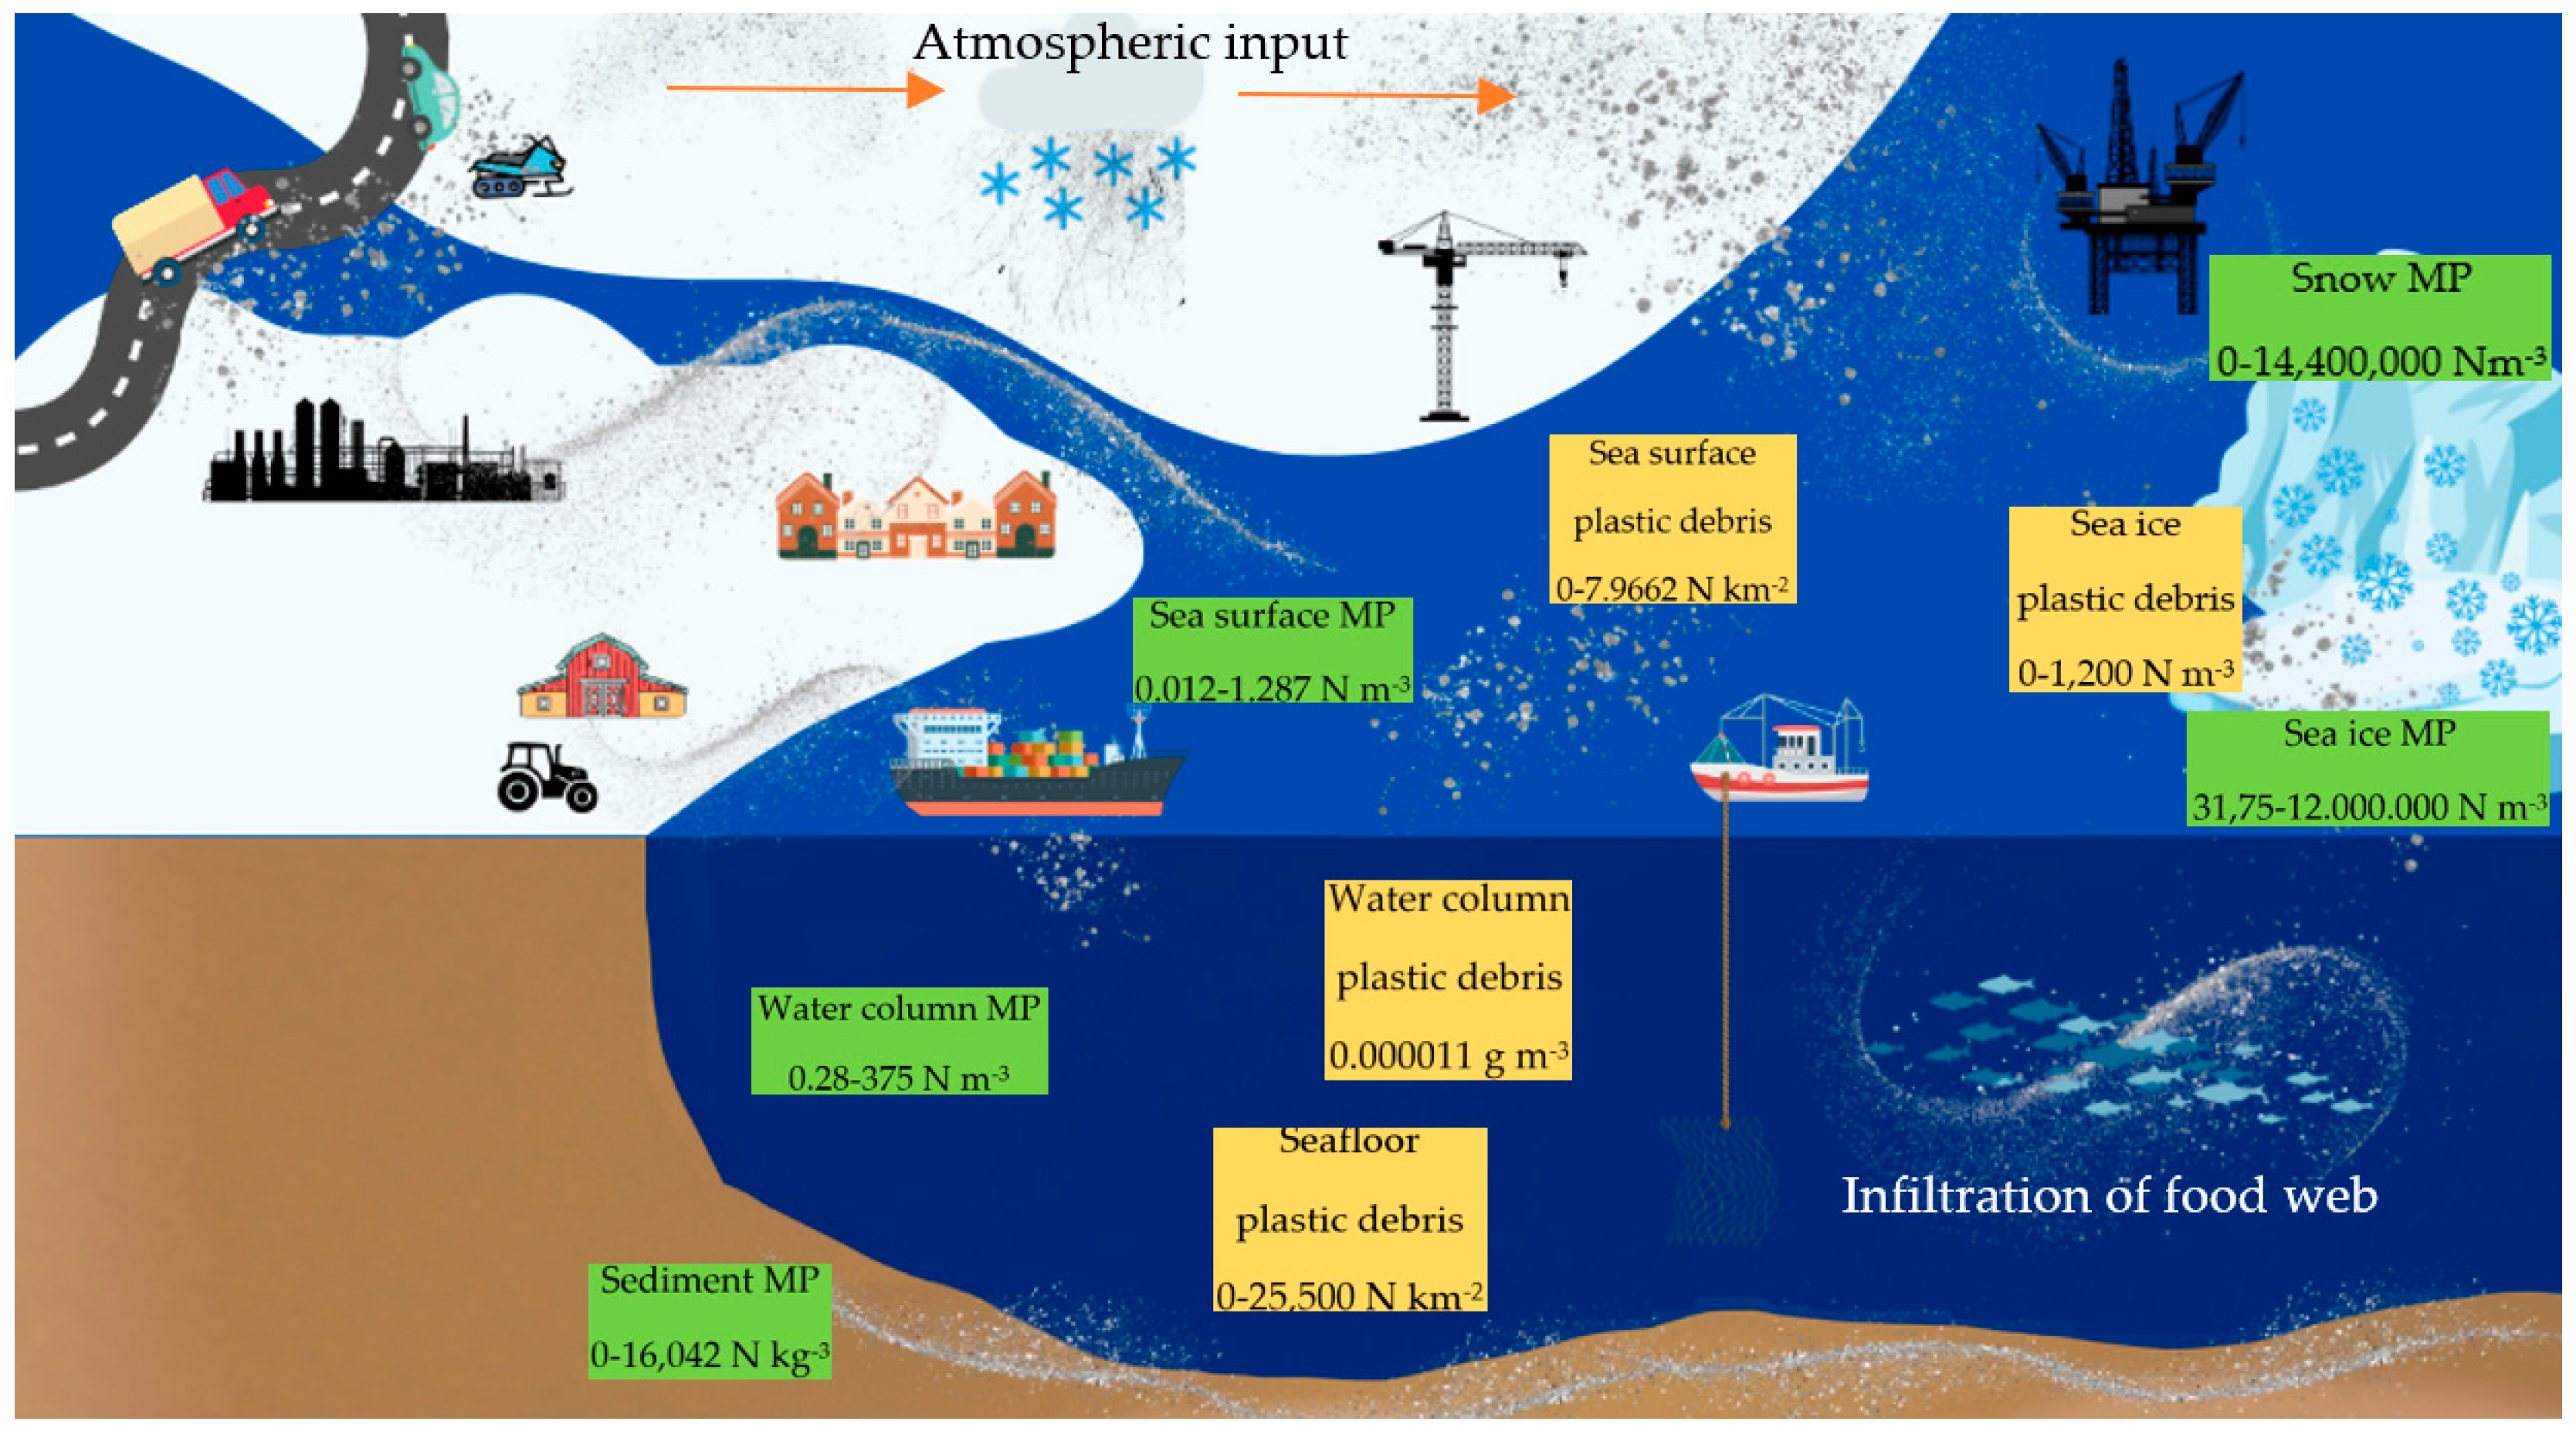
1. Introduction
2. Materials and Methods
2.1. Database Samples
2.2. Cartridge Filtration System
2.3. Sealing and Transportation of Environmental Samples
2.4. Environmental Sampling
2.5. Laboratory Setup and Contamination Mitigation
2.6. Laboratory Sampling
2.7. Sample Preparation
2.8. Analytic Methods
3. Results
3.1. Abrasion on the Cartridge Filtration Casing 01WTKF
3.1.1. Airborne Contamination During Laboratory Sampling
3.1.2. Negative Control
3.1.3. Positive Control
3.1.4. Abrasion on Lids and Bottom Parts
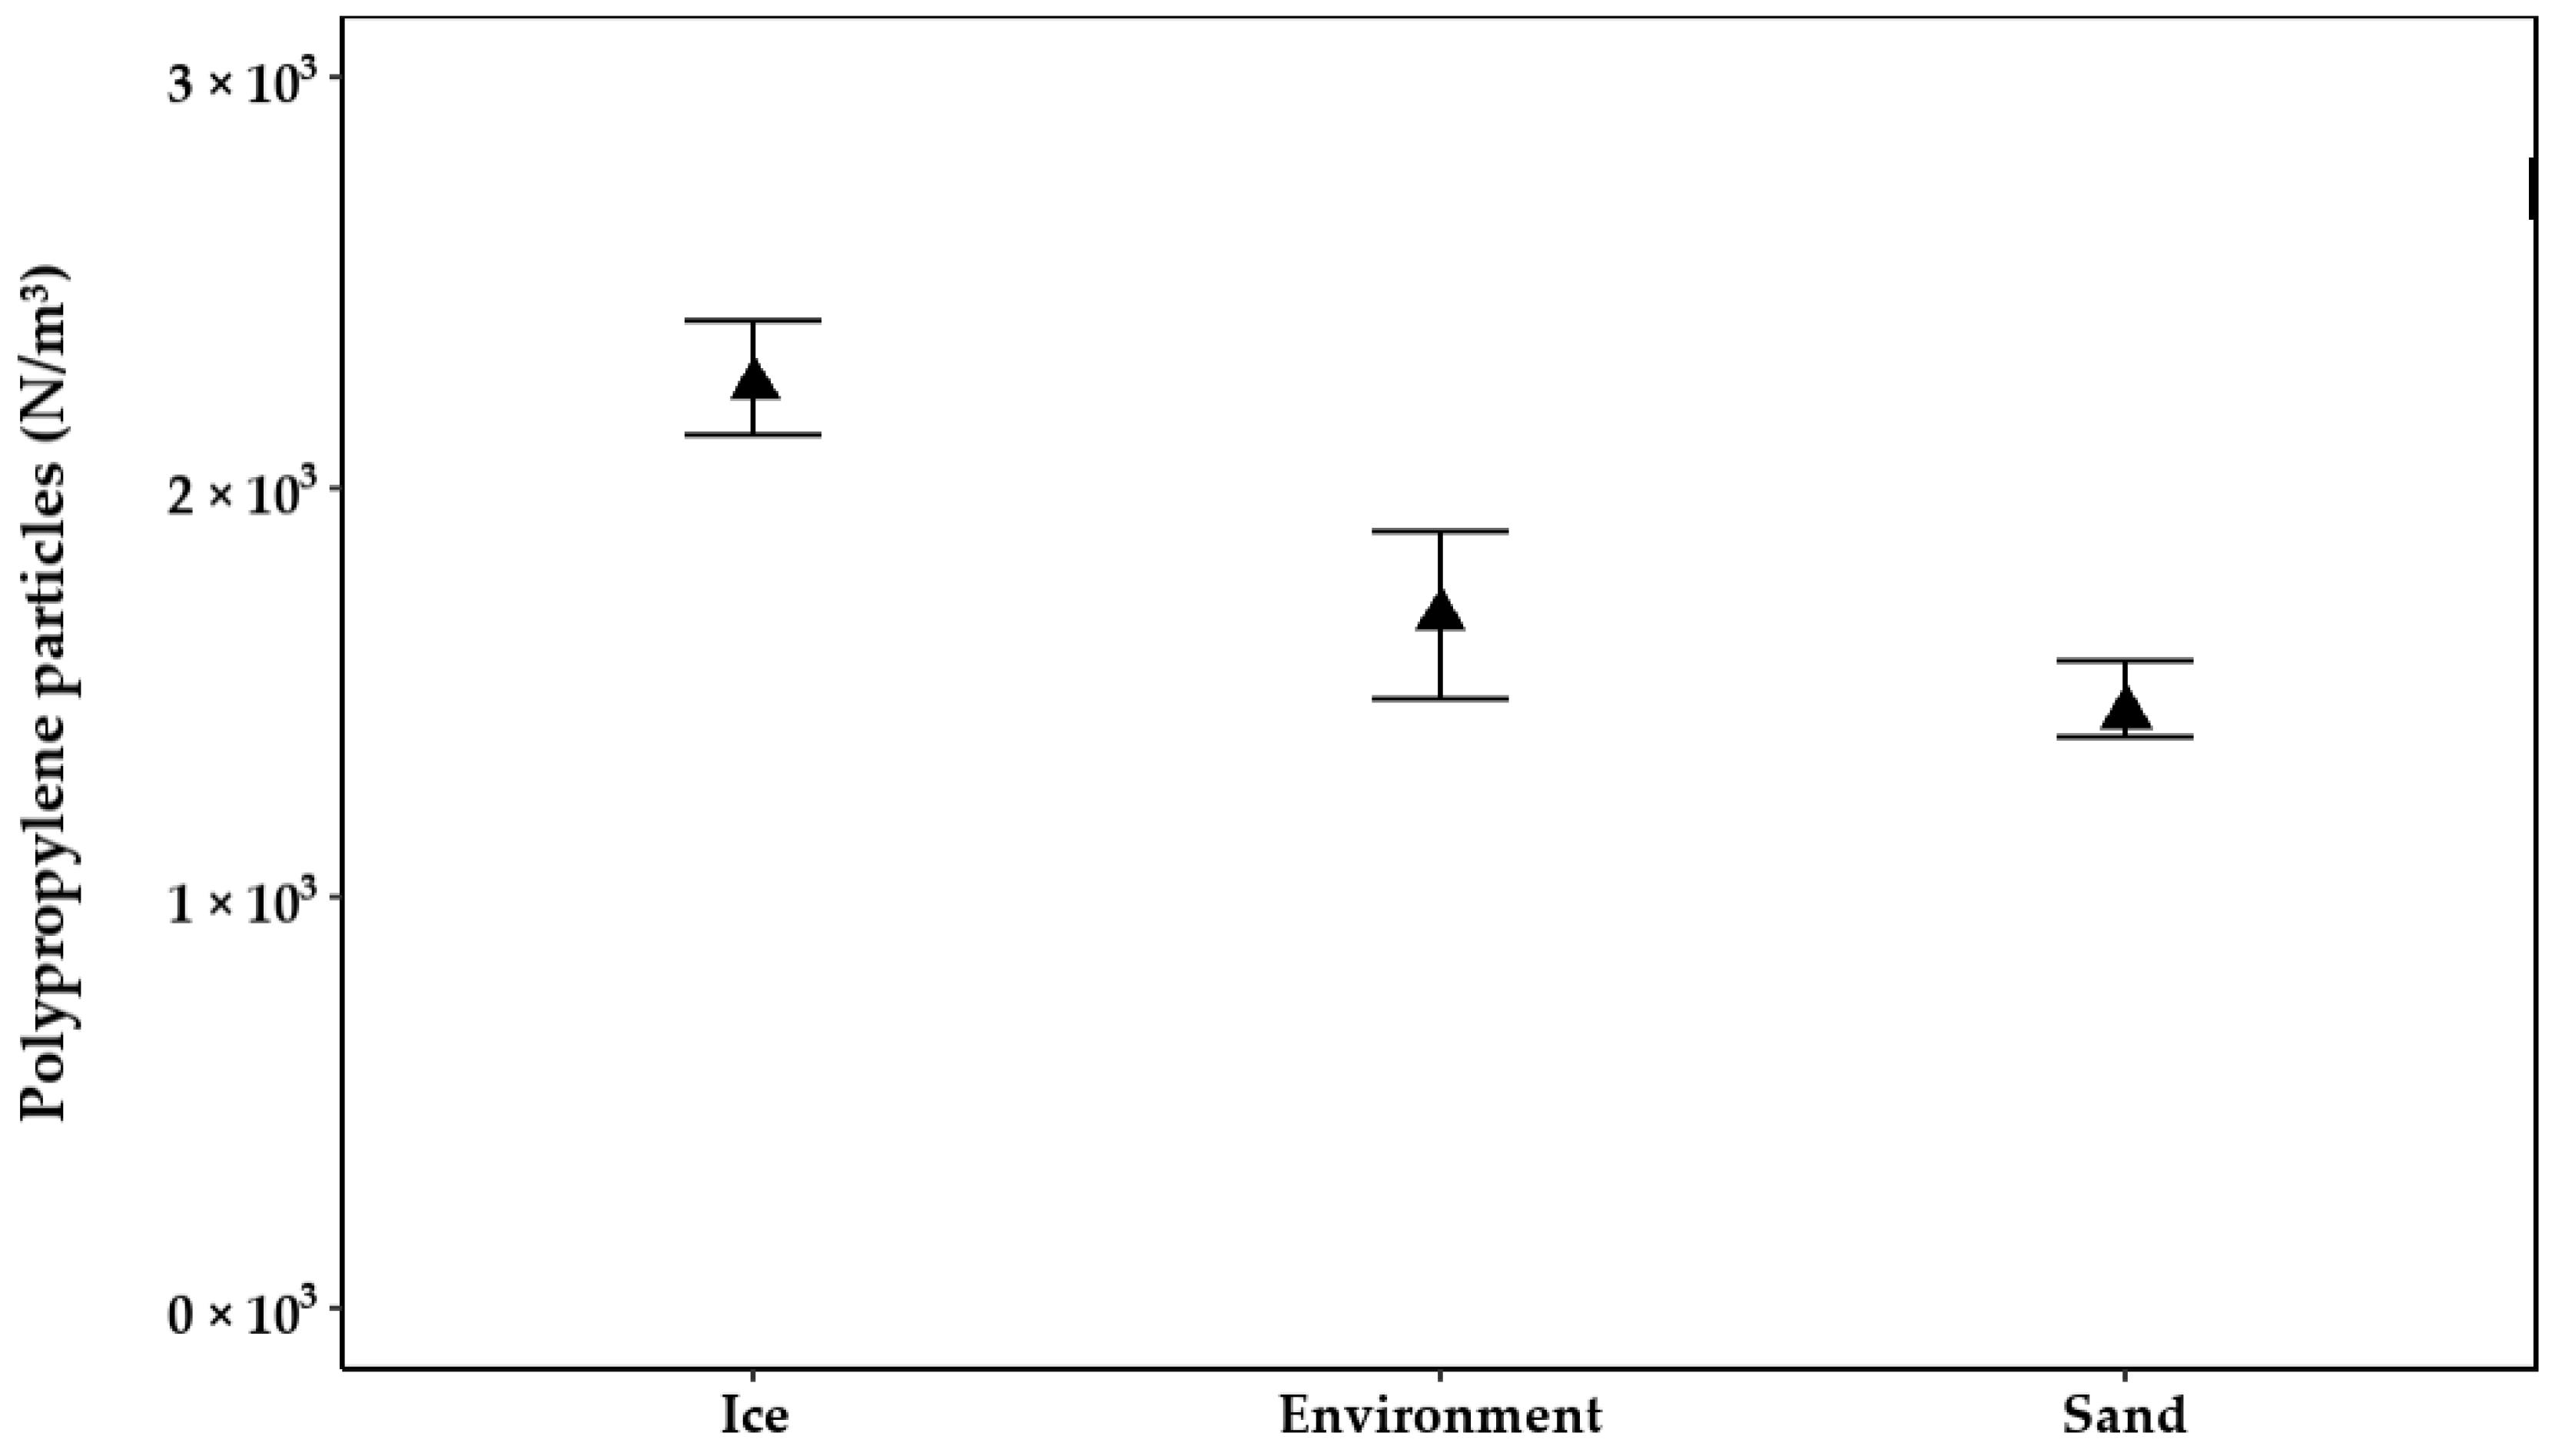
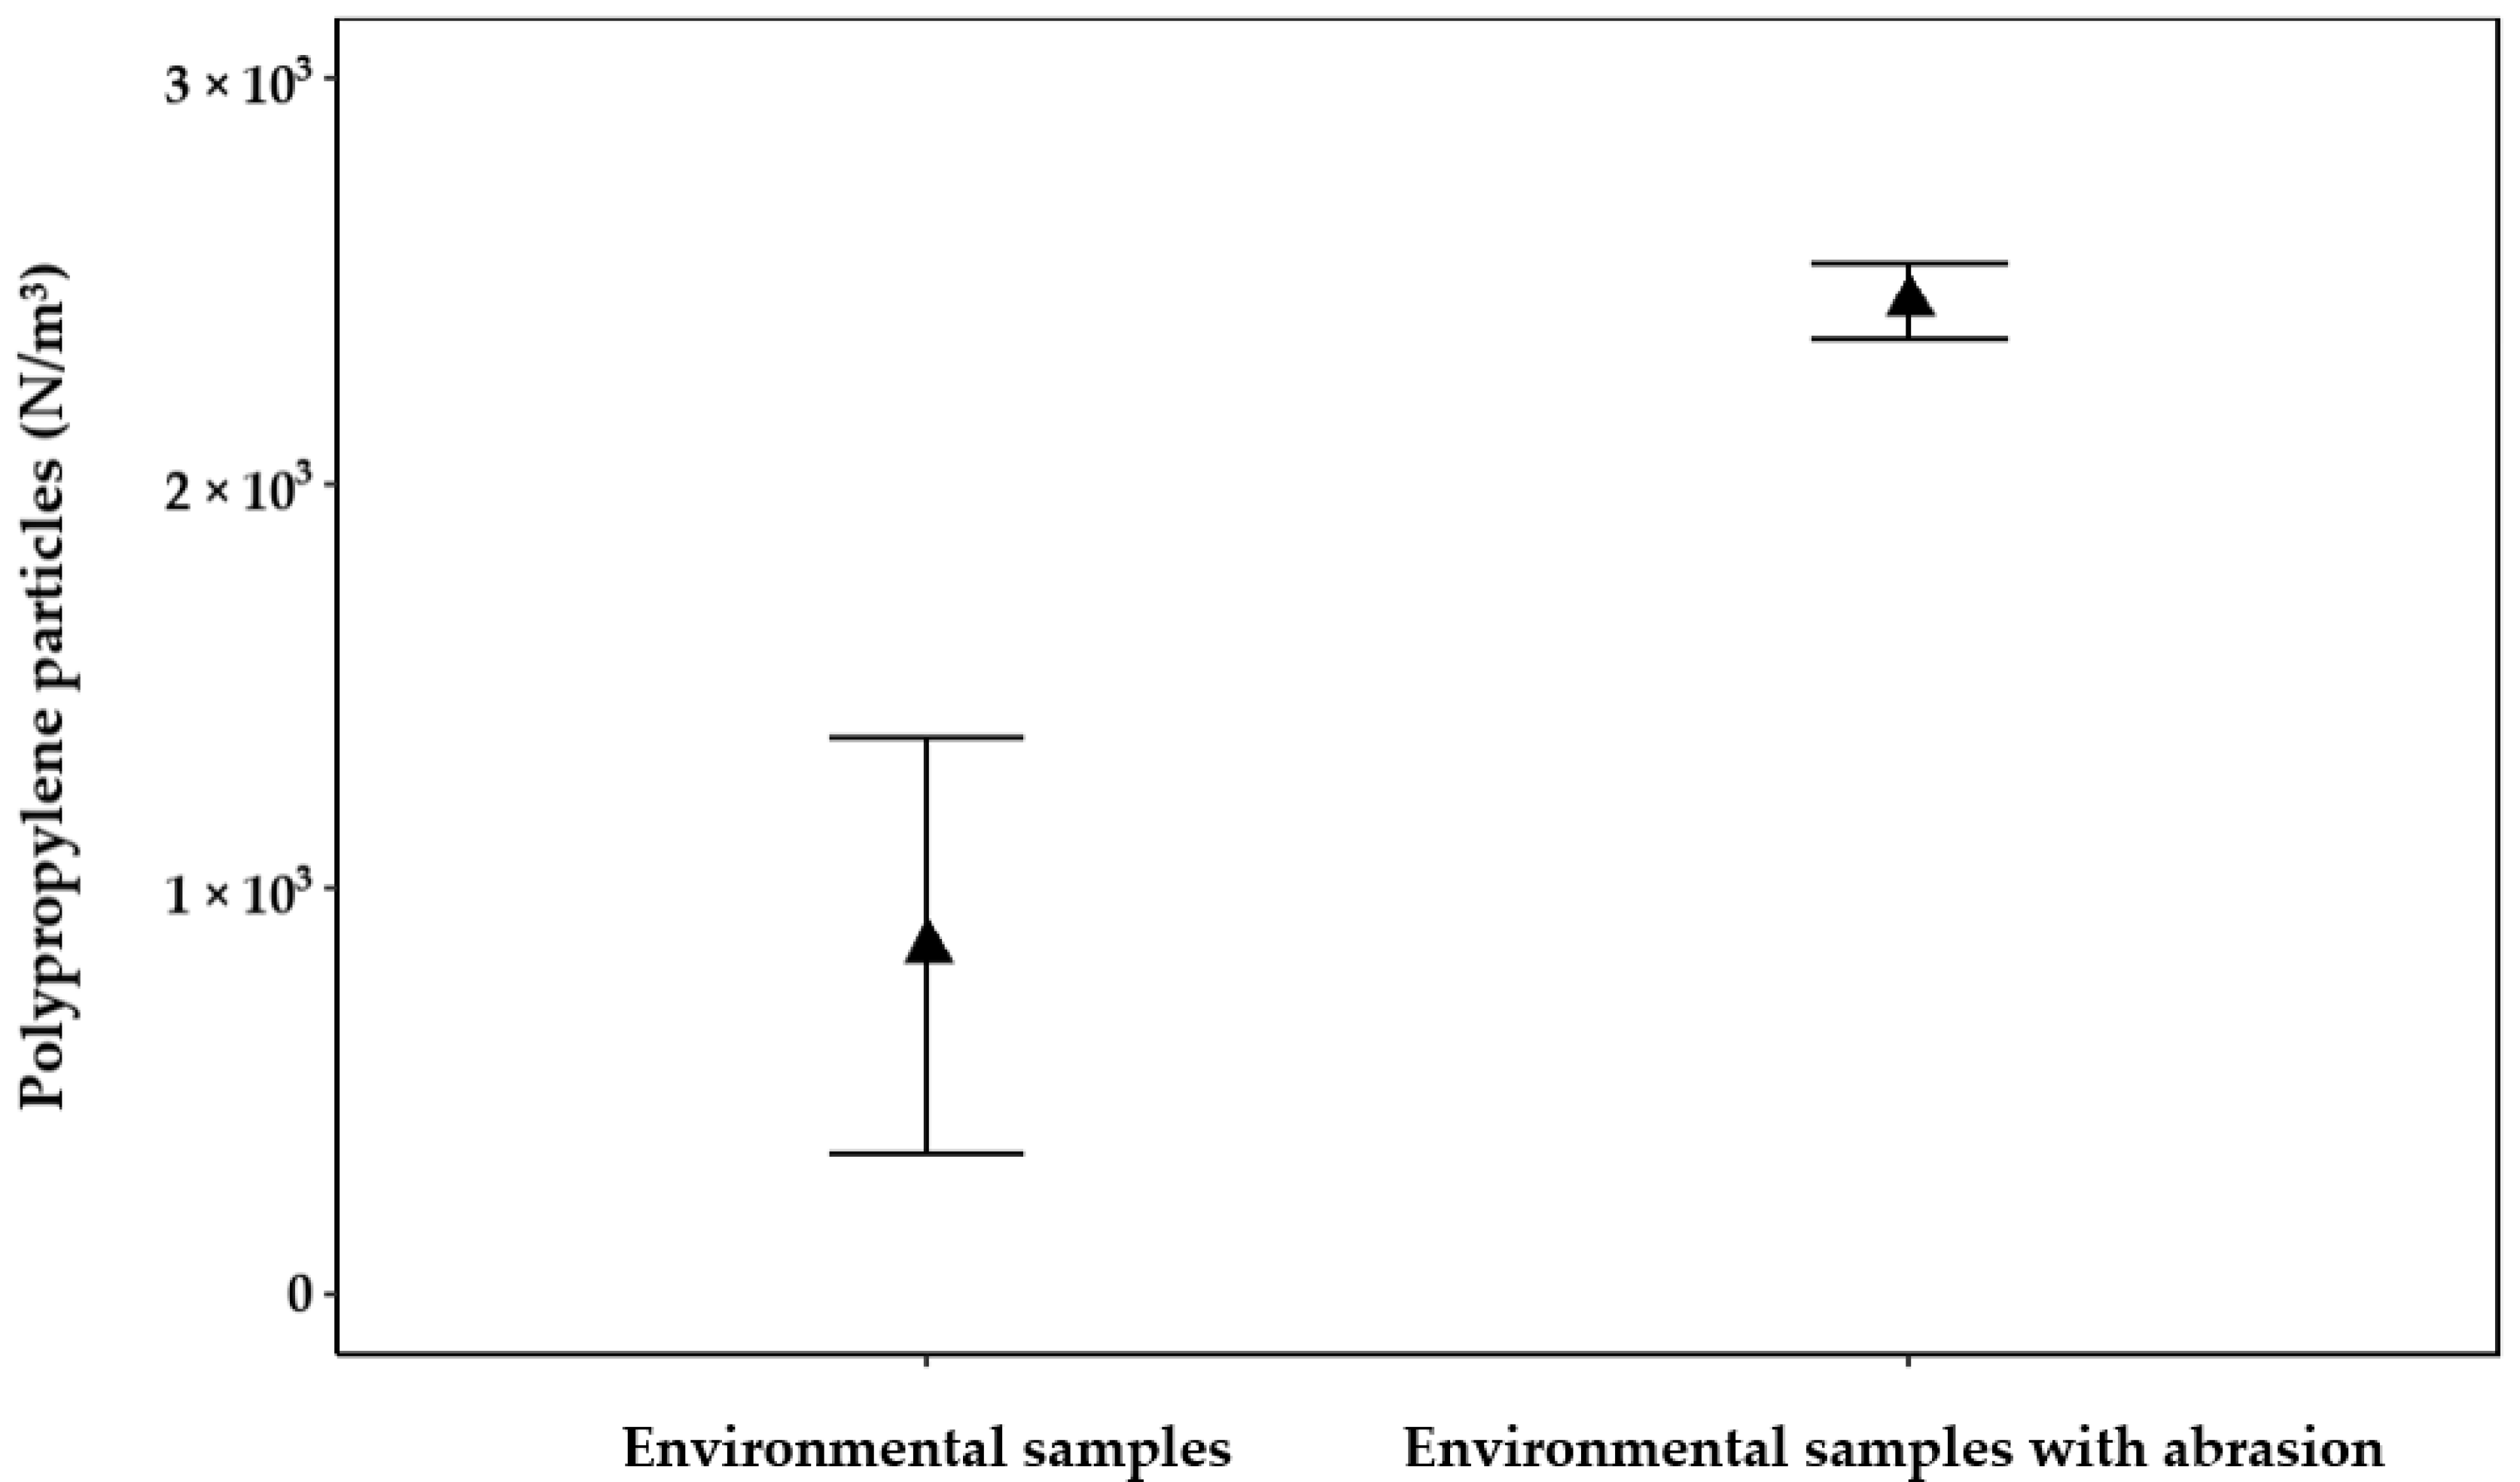
3.1.5. Contamination in Environmental Samples Introduced by Abrasion on Filter Casings
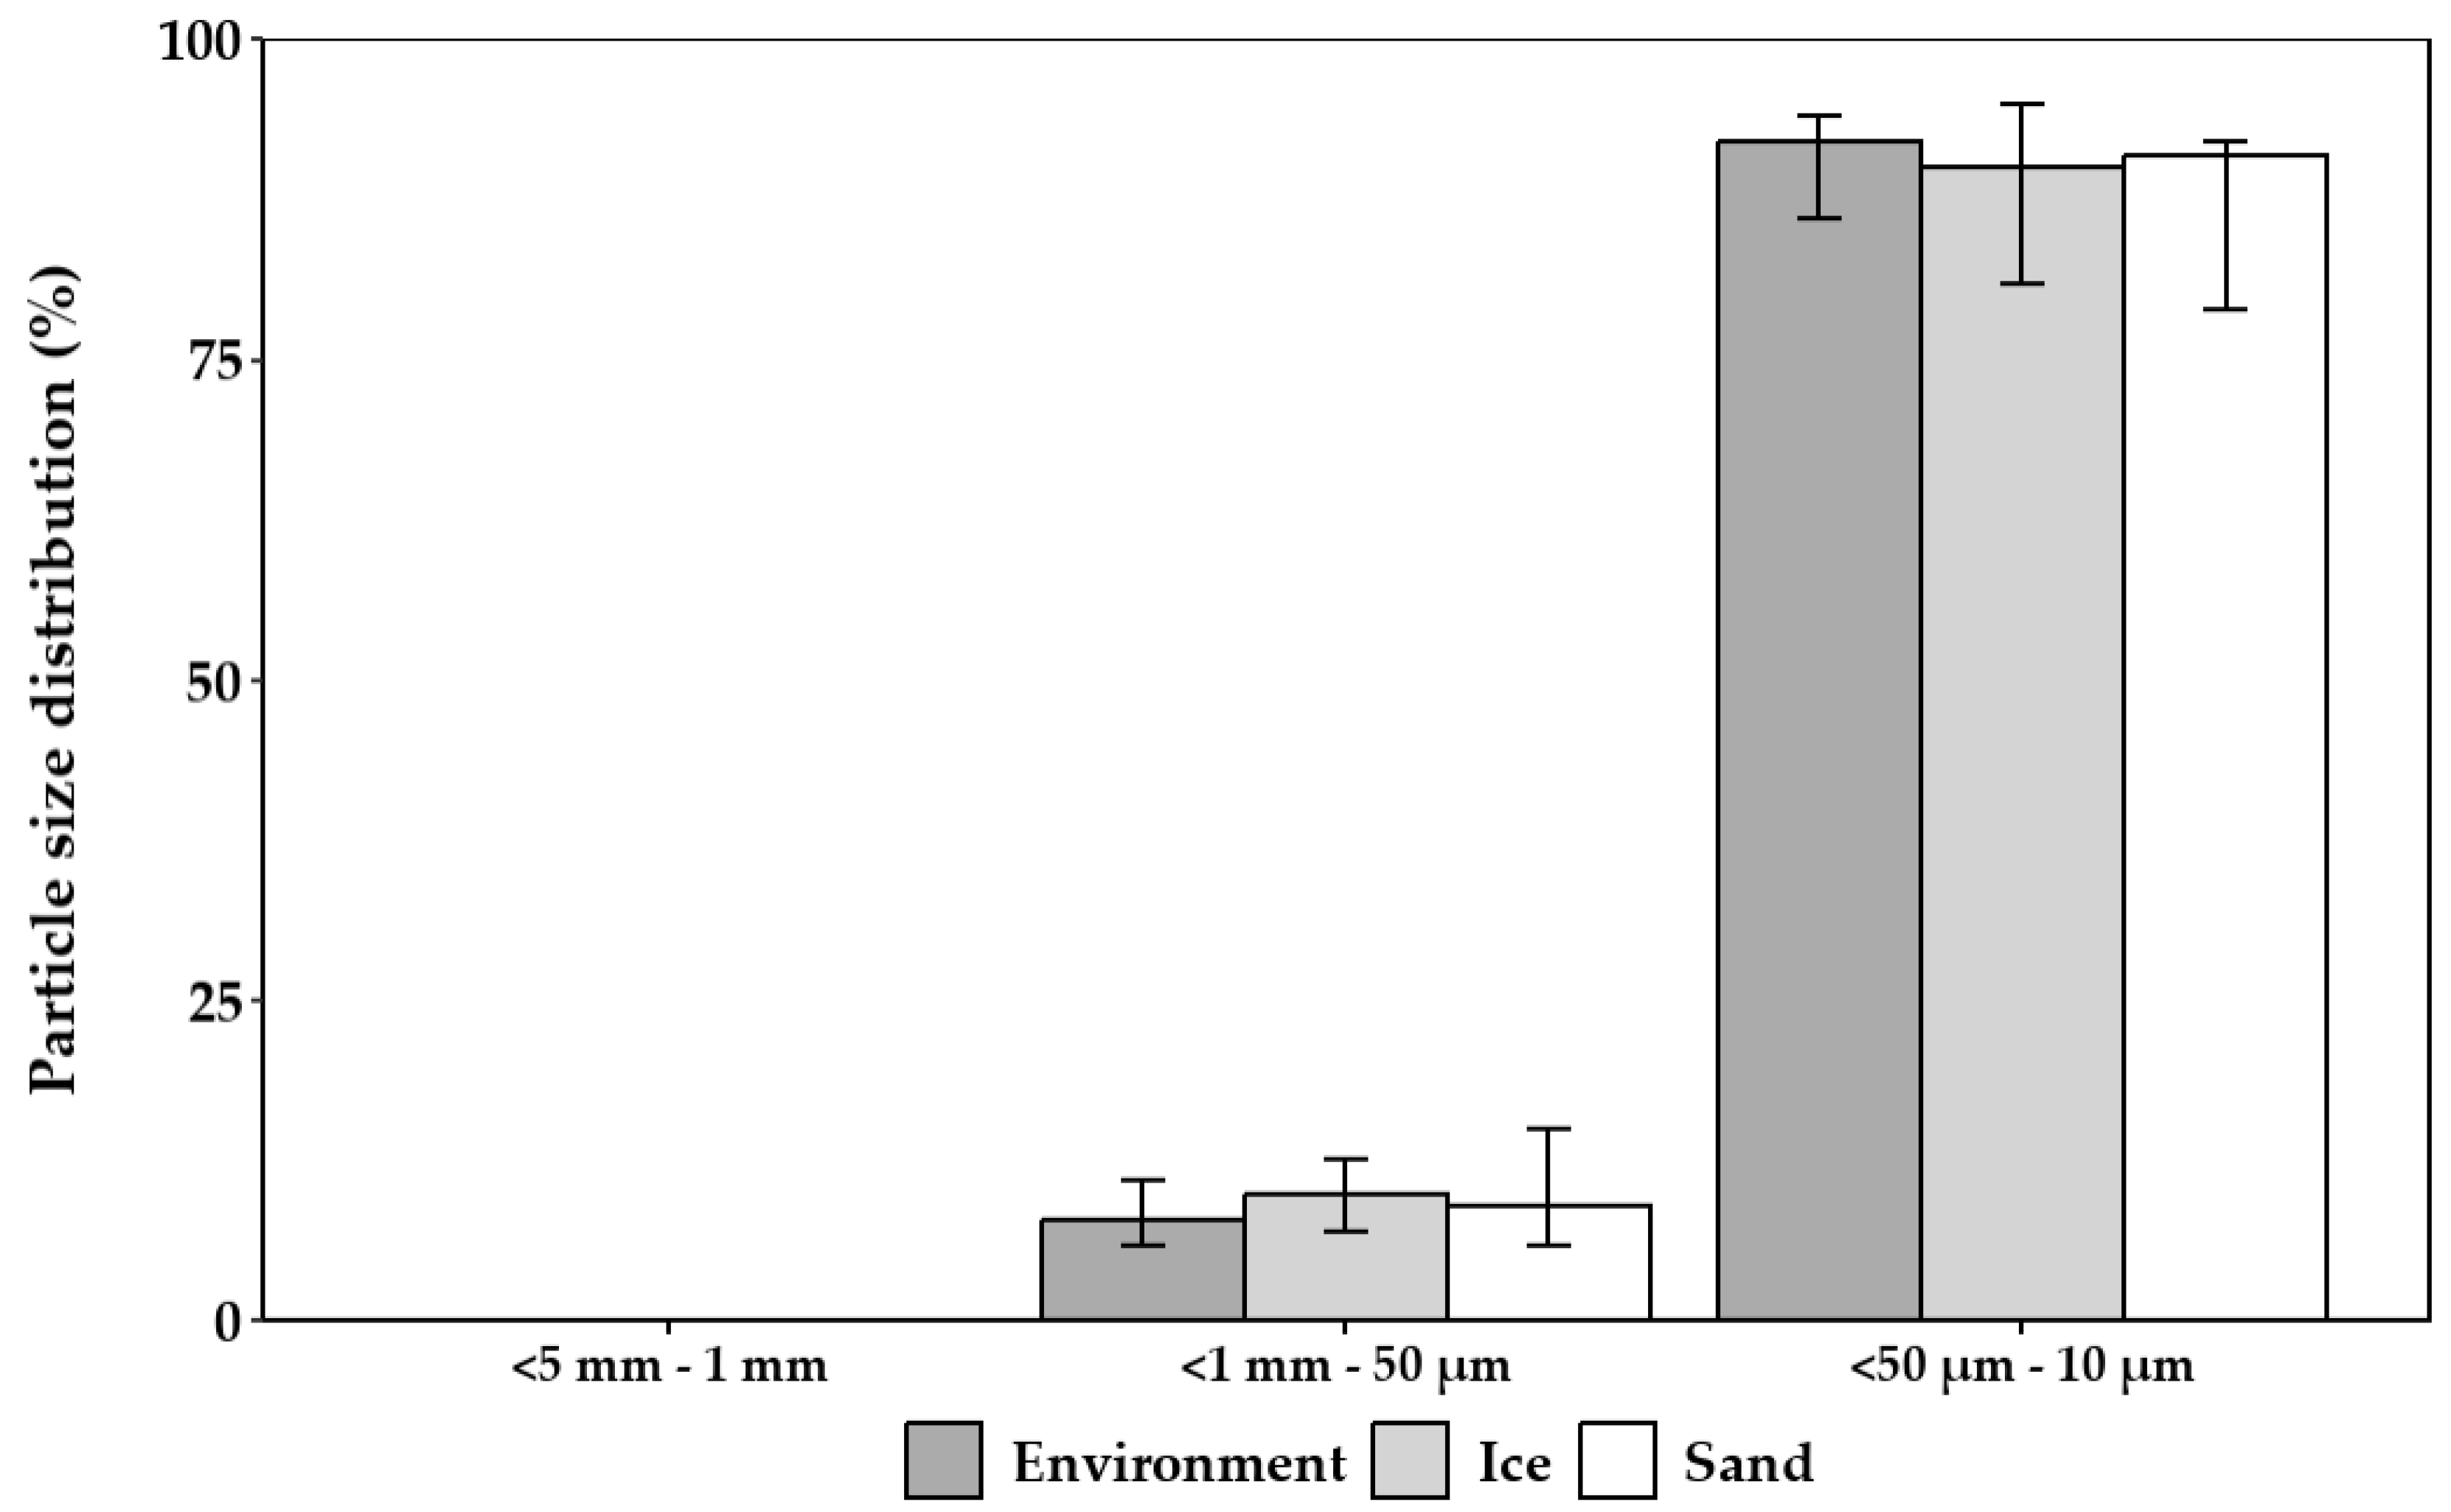
3.1.6. Particle Size Distribution for Particles Introduced by Abrasion on Filter Casings
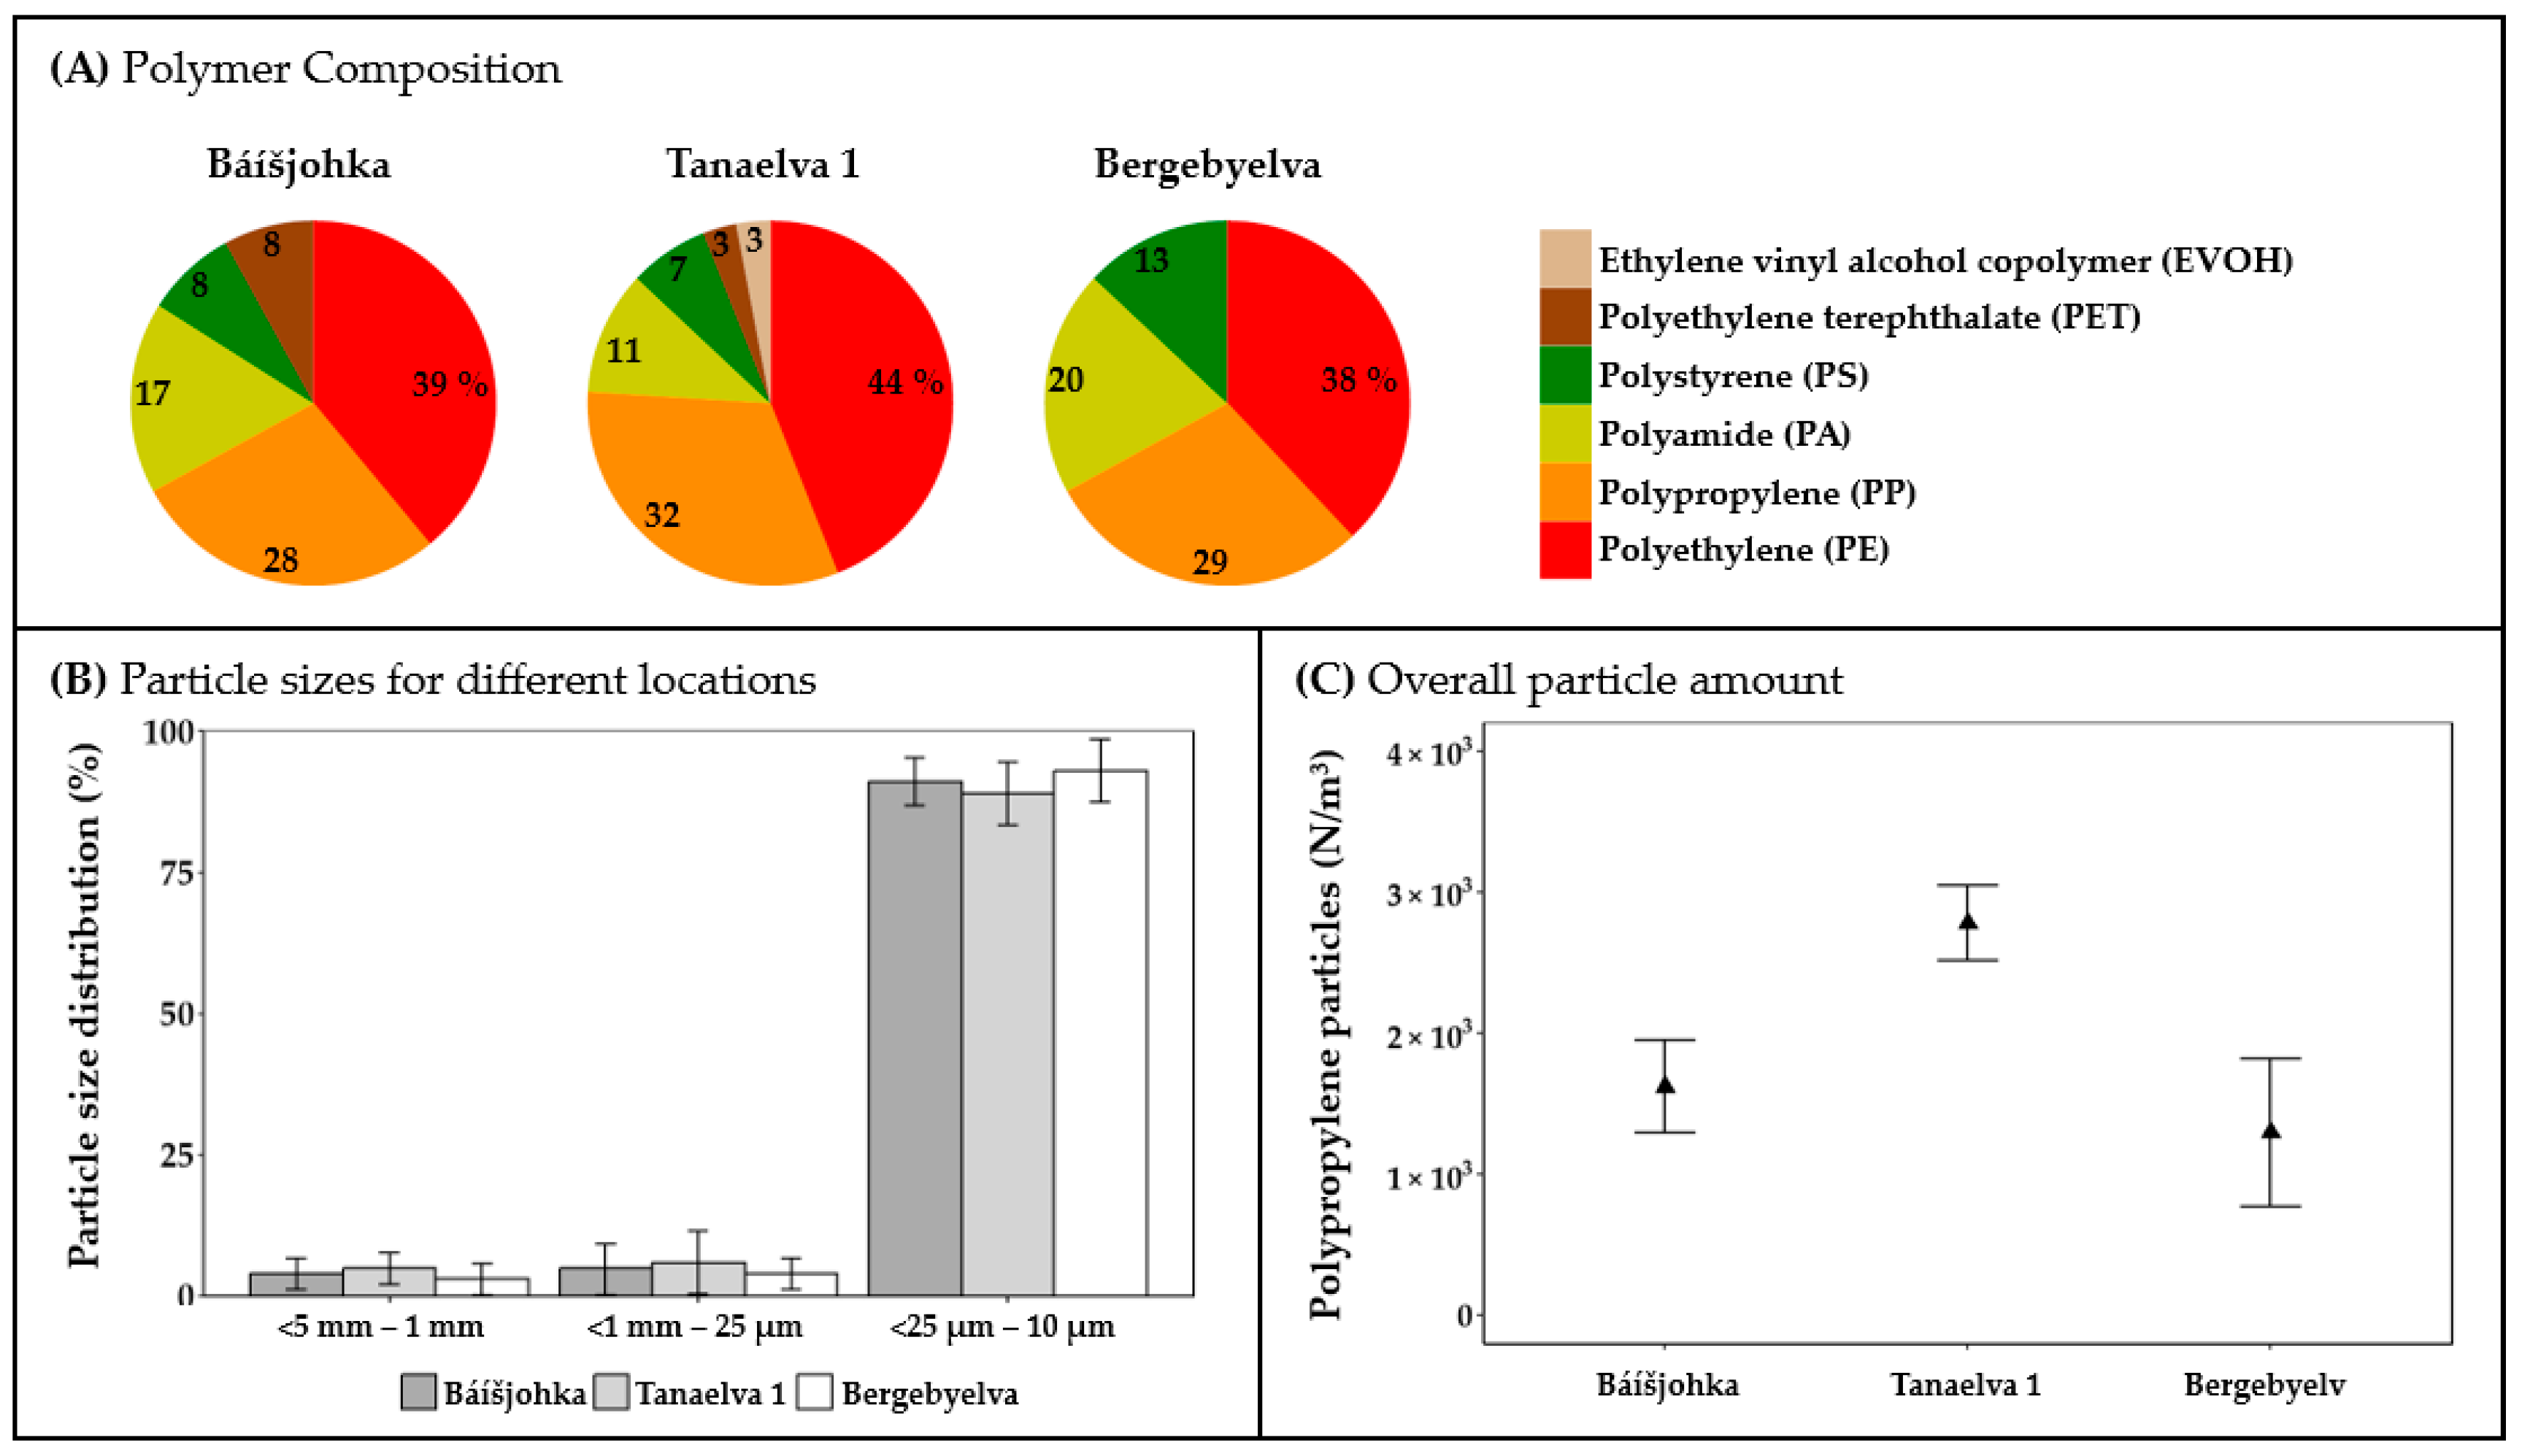
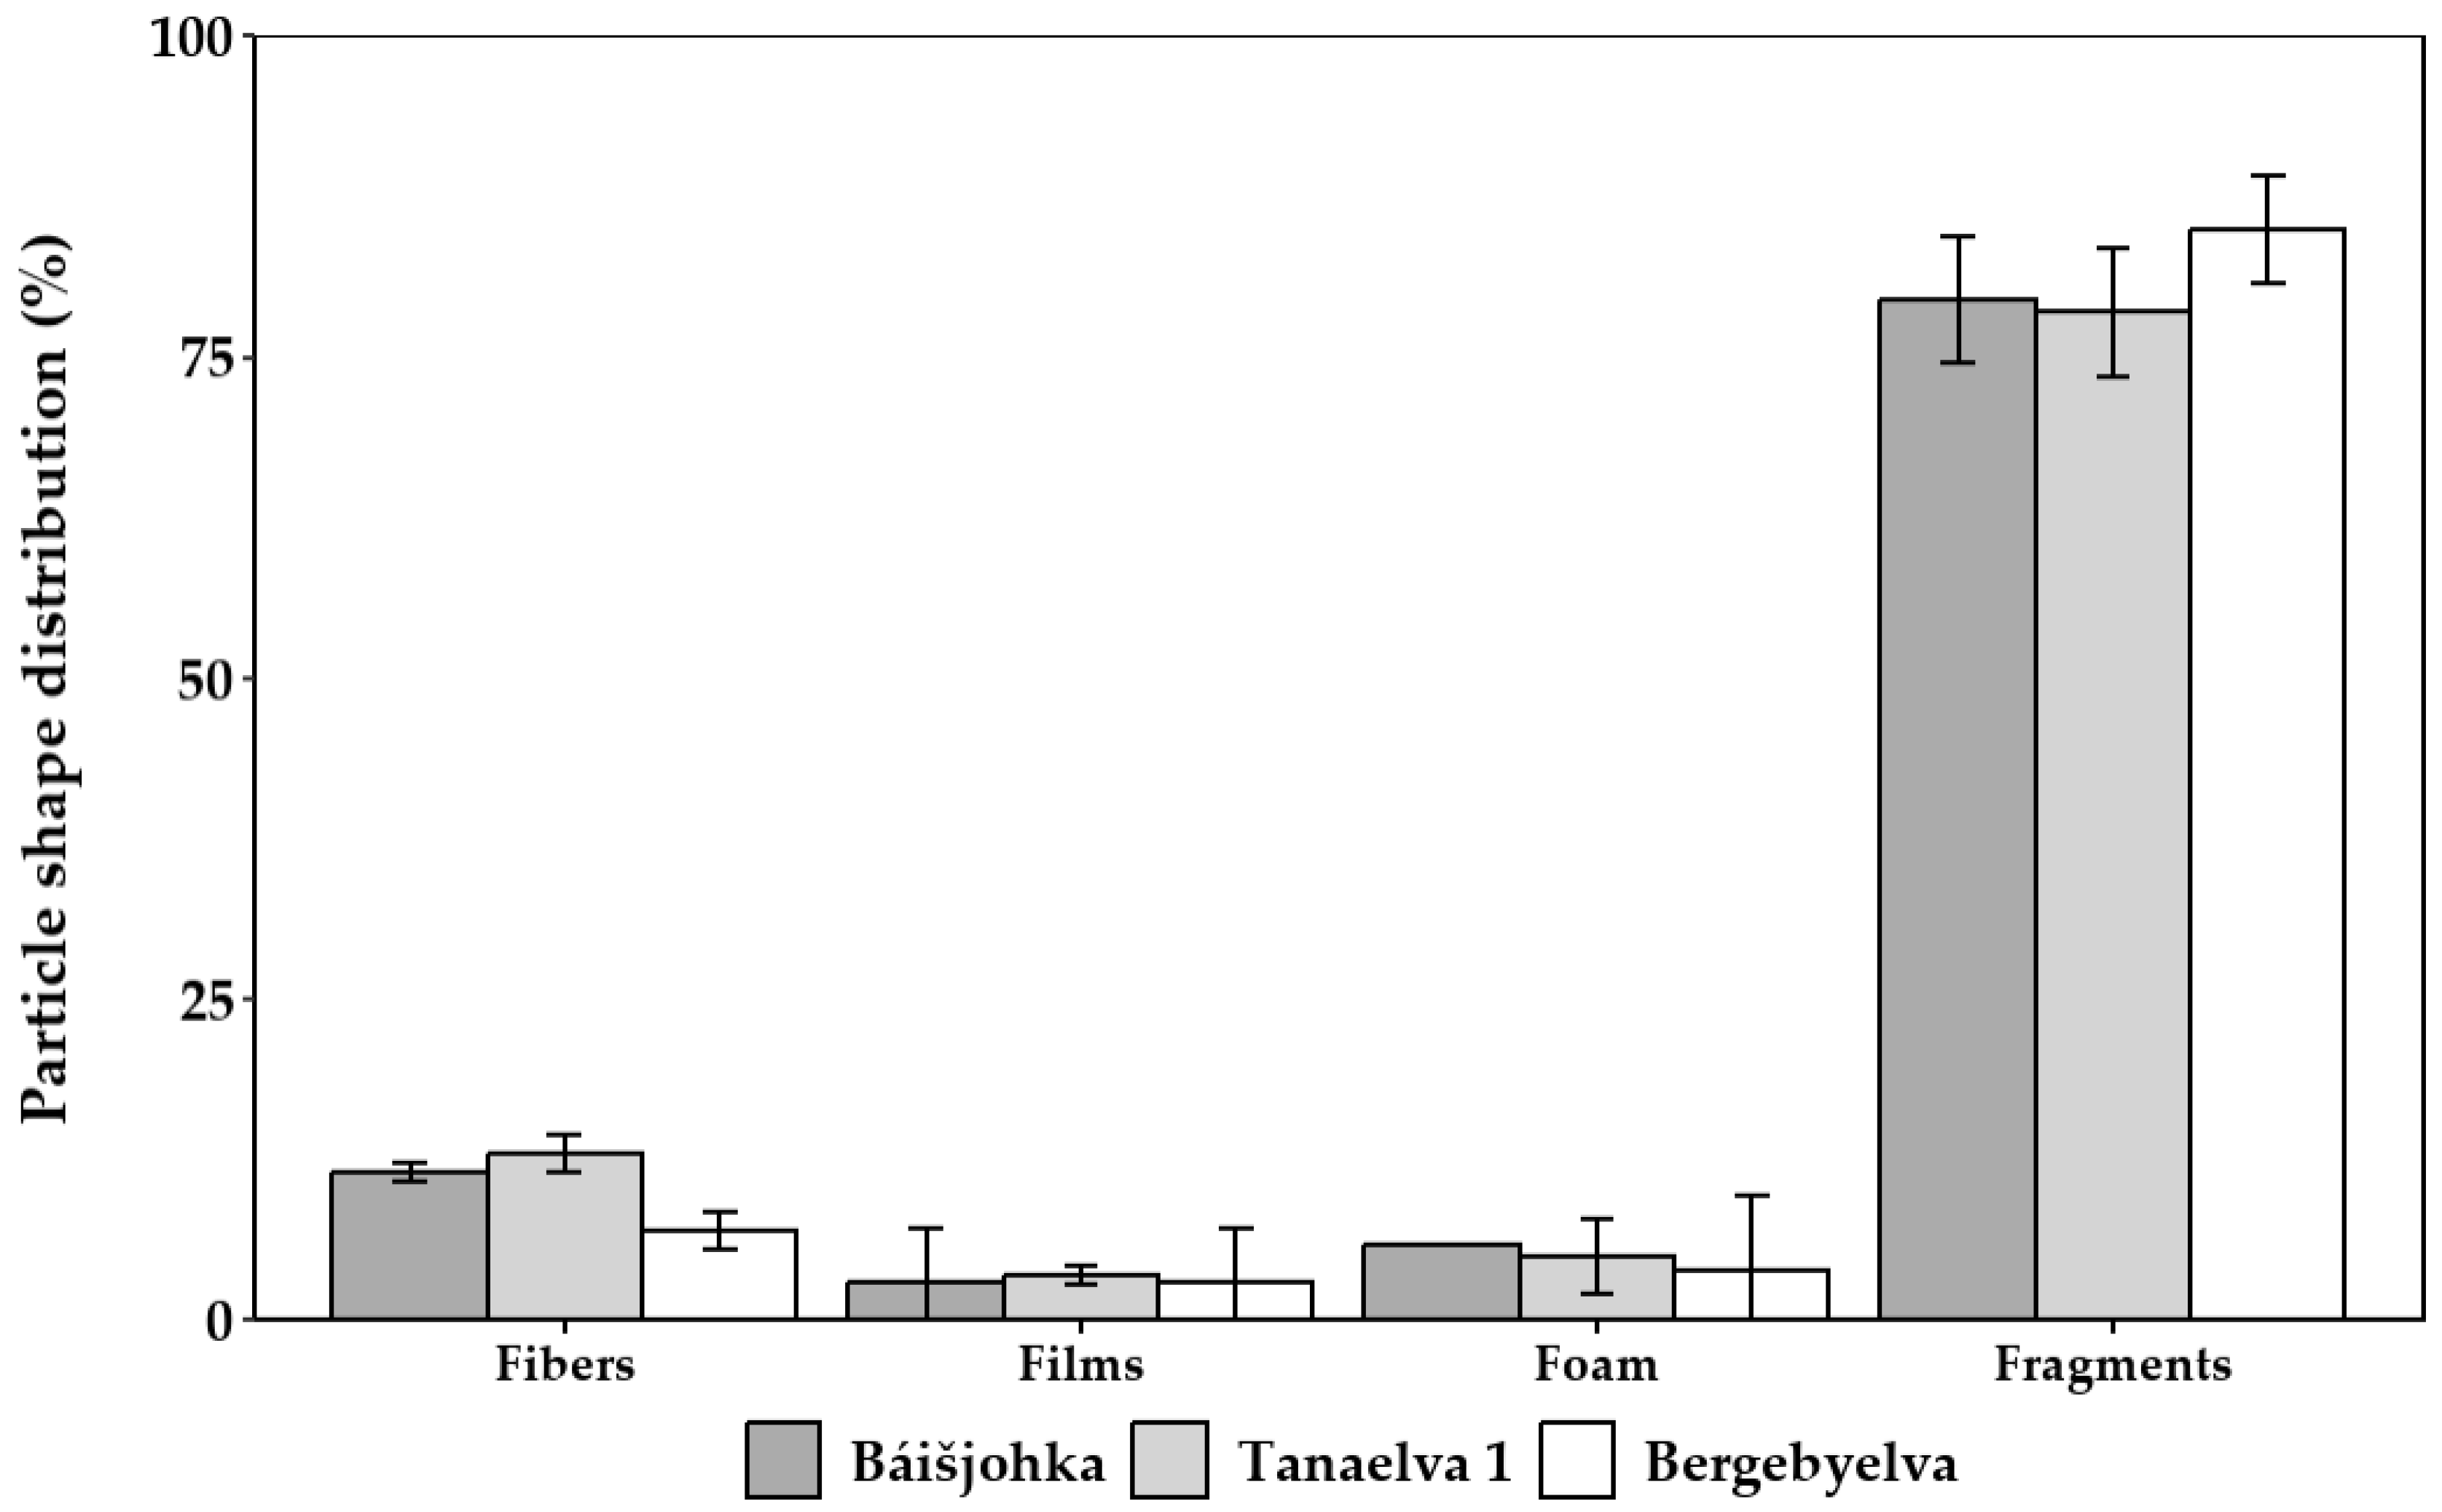
3.2. Microplastic Contamination in Finnmark, Norway
4. Discussion
4.1. Hydroabrasion on the Cartridge Filtration Casing 01WTKF
4.2. Microplastics in Surface Waters in Finnmark, Norway
5. Conclusions
- The cartridge filtration casing model 01WTKF was tested for its resistance to hydroabrasion during the sampling procedure. The results show that hydroabrasion occurs during sampling on the polypropylene (PP)-based bottom part and lid at subzero temperatures.
- To further emphasize this point, the cross-contamination leads to a significant difference (p < 0.05) when comparing results obtained with the model 01WTKF to the actual microplastic pollution in the environment measured with the model 01WTGD (Wolftechnik…).
- The obtained data support Jander et al. [39] in their suspicion of abrasion above 0 °C, by showing that abrasion is possible at least below 0 °C.
- Additionally, the use of PP-based components is suspected to cause microplastic pollution of particles <10 µm.
- For these reasons, the model 01WTGD with PP-based bottom parts and lids should not be used for sampling microplastics. Data obtained from PP-based components should be reviewed and evaluated to control the accuracy of the obtained data.
- The styrene–acrylonitrile copolymer (SAN)-based bottom parts withstood hydroabrasion and showed no abrasion <10 µm.
Supplementary Materials
Author Contributions
Funding
Institutional Review Board Statement
Informed Consent Statement
Data Availability Statement
Acknowledgments
Conflicts of Interest
References
- Galgani, F.; Hanke, G.; Werner, S.; De Vrees, L. Marine litter within the European Marine Strategy Framework Directive. ICES J. Mar. Sci. 2013, 70, 1055–1064. [Google Scholar] [CrossRef]
- Liedermann, M.; Gmeiner, P.; Pessenlehner, S.; Haimann, M.; Hohenblum, P.; Habersack, H. A Methodology for Measuring Microplastic Transport in Large or Medium Rivers. Water 2018, 10, 414. [Google Scholar] [CrossRef]
- Allen, S.; Allen, D.; Phoenix, V.R.; Le Roux, G.; Durántez Jiménez, P.; Simonneau, A.; Binet, S.; Galop, D. Atmospheric transport and deposition of microplastics in a remote mountain catchment. Nat. Geosci. 2019, 12, 339–344. [Google Scholar] [CrossRef]
- Bergmann, M.; Mützel, S.; Primpke, S.; Tekman, M.B.; Trachsel, J.; Gerdts, G. White and wonderful? Microplastics prevail in snow from the Alps to the Arctic. Sci. Adv. 2019, 5, eaax1157. [Google Scholar] [CrossRef]
- Askheim, S.; Dalfest, T.; Thorsnæs, G. Finnmark (Former County). In Store Norske Leksikon; Store Norske Leksikon: Oslo, Norway, 2024; Available online: https://snl.no/Finnmark (accessed on 26 May 2024).
- Norwegian Water Resources and Energy Directorate (NVE). 234/1 Tana (Deatnu). Published: 28 January 2009, Last Updated: 7 June 2023. [Online]. Available online: https://www.nve.no/vann-og-vassdrag/vassdragsforvaltning/verneplan-for-vassdrag/troms-og-finnmark/234-1-tana-deatnu/ (accessed on 26 May 2024).
- Norwegian Environment Agency. Riverine Inputs and Direct Discharges to Norwegian Coastal Waters—2016. Available online: https://www.miljodirektoratet.no/globalassets/publikasjoner/M862/M862.pdf (accessed on 26 May 2024).
- Johannesen, A.; Skonhoft, A. Local Common Property Exploitation with Rewards. Land Econ. 2009, 85, 637–654. [Google Scholar] [CrossRef]
- Kortekangas, O. The Sámi Peoples of the North. A Social and Cultural History. J. Soc. Hist. 2022, 55, 1078–1079. [Google Scholar] [CrossRef]
- Prata, J.C.; da Costa, J.P.; Lopes, I.; Andrady, A.L.; Duarte, A.C.; Rocha-Santos, T. A One Health perspective of the impacts of microplastics on animal, human and environmental health. Sci. Total Environ. 2021, 777, 146094. [Google Scholar] [CrossRef]
- Lusher, A.L.; McHugh, M.; Thompson, R.C. Occurrence of microplastics in the gastrointestinal tract of pelagic and demersal fish from the English Channel. Mar. Pollut. Bull. 2013, 67, 94–99. [Google Scholar] [CrossRef] [PubMed]
- Codina-García, M.; Militão, T.; Moreno, J.; González-Solís, J. Plastic debris in Mediterranean seabirds. Mar. Pollut. Bull. 2013, 77, 220–226. [Google Scholar] [CrossRef]
- Graham, E.R.; Thompson, J.T. Deposit- and suspension-feeding sea cucumbers (Echinodermata) ingest plastic fragments. J. Exp. Mar. Biol. Ecol. 2009, 368, 22–29. [Google Scholar] [CrossRef]
- Green, D.S. Effects of microplastics on European flat oysters, Ostrea edulis and their associated benthic communities. Environ. Pollut. 2016, 216, 95–103. [Google Scholar] [CrossRef] [PubMed]
- Fan, Z.; Xiao, T.; Luo, H.; Chen, D.; Lu, K.; Shi, W.; Sun, C.; Bian, Q. A study on the roles of long non-coding RNA and circular RNA in the pulmonary injuries induced by polystyrene microplastics. Environ. Int. 2022, 163, 107223. [Google Scholar] [CrossRef] [PubMed]
- Horton, A.A.; Walton, A.; Spurgeon, D.J.; Lahive, E.; Svendsen, C. Microplastics in freshwater and terrestrial environments: Evaluating the current understanding to identify the knowledge gaps and future research priorities. Sci. Total Environ. 2017, 586, 127–141. [Google Scholar] [CrossRef]
- Ziajahromi, S.; Neale, P.A.; Leusch, F.D.L. Wastewater treatment plant effluent as a source of microplastics: Review of the fate, chemical interactions and potential risks to aquatic organisms. Water Sci. Technol. 2016, 74, 2253–2269. [Google Scholar] [CrossRef] [PubMed]
- Kanhai, L.D.K.; Officer, R.; Lyashevska, O.; Thompson, R.C.; O’Connor, I. Microplastic abundance, distribution and composition along a latitudinal gradient in the Atlantic Ocean. Mar. Pollut. Bull. 2017, 115, 307–314. [Google Scholar] [CrossRef]
- Karlsson, T.M.; Vethaak, A.D.; Almroth, B.C.; Ariese, F.; van Velzen, M.; Hassellöv, M.; Leslie, H.A. Screening for microplastics in sediment, water, marine invertebrates and fish: Method development and microplastic accumulation. Mar. Pollut. Bull. 2017, 122, 403–408. [Google Scholar] [CrossRef]
- Waller, C.L.; Griffiths, H.J.; Waluda, C.M.; Thorpe, S.E.; Loaiza, I.; Moreno, B.; Pacherres, C.O.; Hughes, K.A. Microplastics in the Antarctic marine system: An emerging area of research. Sci. Total Environ. 2017, 598, 220–227. [Google Scholar] [CrossRef]
- Lusher, A.L.; Tirelli, V.; O’Connor, I.; Officer, R. Microplastics in Arctic polar waters: The first reported values of particles in surface and sub-surface samples. Sci. Rep. 2015, 5, 14947. [Google Scholar] [CrossRef]
- Schwabl, P.; Koppel, S.; Königshofer, P.; Bucsics, T.; Trauner, M.; Reiberger, T.; Liebmann, B. Detection of various microplastics in human stool. Ann. Intern. Med. 2019, 171, 453. [Google Scholar] [CrossRef]
- Leslie, H.A.; van Velzen, J.M.; Brandsma, S.H.; Vethaak, A.D.; Garcia-Vallejo, J.J.; Lamoree, M.H. Discovery and quantification of plastic particle pollution in human blood. Environ. Int. 2022, 163, 107199. [Google Scholar] [CrossRef]
- Jenner, L.C.; Rotchell, J.M.; Bennett, R.T.; Cowen, M.; Tentzeris, V.; Sadofsky, L.R. Detection of microplastics in human lung tissue using FTIR spectroscopy. Sci. Total Environ. 2022, 831, 154907. [Google Scholar] [CrossRef] [PubMed]
- Ragusa, A.; Svelato, A.; Santacroce, C.; Catalano, P.; Notarstefano, V.; Carnevali, O.; Papa, F.; Rongioletti, M.C.A.; Baiocco, F.; Draghi, S.; et al. Plasticenta: First evidence of microplastics in human placenta. Environ. Int. 2021, 146, 106274. [Google Scholar] [CrossRef] [PubMed]
- Wright, S.L.; Kelly, F.J. Plastic and human health: A micro issue? Environ. Sci. Technol. 2017, 51, 6634–6647. [Google Scholar] [CrossRef]
- Lusher, A.; Hollman, P.; Mendoza-Hill, J. Microplastics in Fisheries and Aquaculture: Status of Knowledge on Their Occurrence and Implications for Aquatic Organisms and Food Safety; FAO: Rome, Italy, 2017; Available online: https://oceanrep.geomar.de/id/eprint/49179/1/Microplastics%20in%20fisheries%20and%20aquaculture.pdf (accessed on 29 May 2024).
- Liang, W.; Li, B.; Jong, M.C.; Ma, C.; Zuo, C.; Chen, Q.; Shi, H. Process-oriented impacts of microplastic fibers on behavior and histology of fish. J. Hazard. Mater. 2023, 448, 130856. [Google Scholar] [CrossRef]
- Kwon, J.H.; Chang, S.; Hong, S.H.; Shim, W.J. Microplastics as a vector of hydrophobic contaminants: Importance of hydrophobic additives. Integr. Environ. Assess. Manag. 2017, 13, 494–499. [Google Scholar] [CrossRef] [PubMed]
- Granby, K.; Bhattarai, B.; Johannsen, N.; Kotterman, M.J.J.; Sloth, J.J.; Cederberg, T.L.; Marques, A.; Larsen, B.K. Microplastics in Feed Affect the Toxicokinetics of Persistent Halogenated Pollutants in Atlantic Salmon. Environ. Pollut. 2024, 357, 124421. [Google Scholar] [CrossRef]
- Zhang, H.; Fei, Y.; Wang, H.; Chen, Y.; Huang, S.; Yu, B.; Wang, J.; Tong, Y.; Wen, D.; Zhou, B.; et al. Interaction of microplastics and organic pollutants: Quantification, environmental fates, and ecological consequences. In Handbook of Environmental Chemistry; Springer: Cham, Switzerland, 2020; Volume 95, pp. 161–184. [Google Scholar] [CrossRef]
- Zhang, S.; Wang, J.; Liu, X.; Qu, F.; Wang, X.; Wang, X.; Li, Y.; Sun, Y. Microplastics in the environment: A review of analytical methods, distribution, and biological effects. TrAC Trends Anal. Chem. 2019, 111, 62–72. [Google Scholar] [CrossRef]
- Czichos, H. Tribologie Handbuch Tribometrie, Tribomaterialien, Tribotechnik, 5th ed.; Springer: Berlin/Heidelberg, Germany, 2020; ISBN 978-3-658-29483-0. ISBN: 978-3-658-29484-7 (eBook). [Google Scholar] [CrossRef]
- Geier, S.; Elsner, P.; Eyerer, P.; Hirth, T. Synthetische Kunststoffe. In Kunststoffe; VDI-Buch; Springer: Berlin/Heidelberg, Germany, 2012; pp. 213–420. [Google Scholar] [CrossRef]
- Kern GmbH Kunststoffwerke. Ausdruck der Werkstoffdatenbank RIWETA 4.2 Polypropylen Homopolymer (PP-H). Available online: https://www.kern.de/de/technisches-datenblatt/polypropylen-pp-h?n=1502_1 (accessed on 29 May 2024).
- Kern GmbH Kunststoffwerke. Ausdruck der Werkstoffdatenbank RIWETA 4.2 Styrol/Acrylnitril (SAN). Available online: https://www.kern.de/de/technisches-datenblatt/styrol-acrylnitril-san?n=2120_1 (accessed on 29 May 2024).
- Correia Prata, J.; da Costa, J.P.; Duarte, A.C.; Rocha-Santos, T. Methods for sampling and detection of microplastics in water and sediment: A critical review. TrAC Trends Anal. Chem. 2019, 110, 150–159. [Google Scholar] [CrossRef]
- Kiefer, T.; Knoll, M.; Fath, A. Comparing Methods for Microplastic Quantification Using the Danube as a Model. Microplastics 2023, 2, 322–333. [Google Scholar] [CrossRef]
- Jander, J.; Loritz, J.; Beyer, B.; Stürmer, S.; Schary, W.; Monteleone, A.; Dümichen, E.; Knoll, M.; Primpke, S.; Gerdts, G.; et al. Change of perspective through quality assurance measures on microplastic particle counts in surface waters of the Rhine River—Importance of LOD and LOQ. Res. Sq. 2023; peer review. [Google Scholar] [CrossRef]
- Roscher, L.; Fehres, A.; Reisel, L.; Halbach, M.; Scholz-Böttcher, B.; Gerriets, M.; Badewien, T.; Shiravani, G.; Wurpts, A.; Primpke, S.; et al. Microplastic pollution in the Weser estuary and the German North Sea. Environ. Pollut. 2021, 288, 117681. [Google Scholar] [CrossRef]
- Kernchen, S.; Schmalz, H.; Löder, M.; Georgi, C.; Einhorn, A.; Greiner, A.; Nölscher, A.; Laforsch, C.; Held, A. Wet and Dry Deposition Flux Measurements of Atmospheric Microplastic Particles in Central Germany. Available online: https://www.researchsquare.com/article/rs-1355961/v1 (accessed on 12 February 2025).
- Hansen, J.; Hildebrandt, L.; Zimmermann, T.; El Gareb, F.; Fischer, E.; Pröfrock, D. Quantification and characterization of microplastics in surface water samples from the Northeast Atlantic Ocean using laser direct infrared imaging. Mar. Pollut. Bull. 2023, 190, 114880. [Google Scholar] [CrossRef]
- Primpke, S.; Cross, R.K.; Mintenig, S.M.; Simon, M.; Vianello, A.; Gerdts, G.; Vollertsen, J. Toward the Systematic Identification of Microplastics in the Environment: Evaluation of a New Independent Software Tool (siMPle) for Spectroscopic Analysis. Appl. Spectrosc. 2020, 74, 1127–1138. [Google Scholar] [CrossRef] [PubMed]
- Fundneider, T. Filtration und Aktivkohleadsorption zur Weitergehenden Aufbereitung von Kommunalem Abwasser—Phosphor—Und Spurenstoffentfernung. Ph.D. Thesis, Verein zur Förderung des Institutes IWAR der Technischen Universität Darmstadt e. V., Darmstadt, Germany, 2020. [Google Scholar] [CrossRef]
- Weisser, J.; Hufnagl, B.; Beer, I.; Ivleva, N.; Lohninger, H.; Hofmann, T.; Glas, K. Cover of Water; MDPI: Basel, Switzerland, 2021; Volume 13. [Google Scholar]
- Bitter, H.; Krause, L.; Kirchen, F.; Fundneider, T.; Lackner, S. Semi-crystalline microplastics in wastewater plant effluents and removal efficiencies of post-treatment filtration systems. Water Res. X 2022, 17, 100156. [Google Scholar] [CrossRef]
- Hildebrandt, L.; El Gareb, F.; Zimmermann, T.; Klein, O.; Kerstan, A.; Emeis, K.; Pröfrock, D. Spatial distribution of microplastics in the tropical Indian Ocean based on laser direct infrared imaging and microwave-assisted matrix digestion. Environ. Pollut. 2022, 307, 119457. [Google Scholar] [CrossRef]
- Leistenschneider, C.; Le Bohec, C.; Eisen, O.; Houstin, A.; Neff, S.; Primpke, S.; Zitterbart, D.P.; Burkhardt-Holm, P.; Gerdts, G. No evidence of microplastic ingestion in emperor penguin chicks (Aptenodytes forsteri) from the Atka Bay colony (Dronning Maud Land, Antarctica). Sci. Total Environ. 2022, 851 Pt 2, 158314. [Google Scholar] [CrossRef]
- Hellmer, H.H.; Holtappels, M. The Expedition PS124 of the Research Vessel POLARSTERN to the southern Weddell Sea in 2021. Ber. Polar Meeresforsch. 2021, 755, 237. [Google Scholar] [CrossRef]
- Enders, K.; Lenz, R.; Ivar do Sul, J.A.; Tagg, A.S.; Labrenz, M. When every particle matters: A QuEChERS approach to extract microplastics from environmental samples. MethodsX 2020, 7, 100784. [Google Scholar] [CrossRef] [PubMed]
- Lenz, R.; Labrenz, M. Small Microplastic Sampling in Water: Development of an Encapsulated Filtration Device. Water 2018, 10, 1055. [Google Scholar] [CrossRef]
- Sturm, M.T.; Myers, E.; Schober, D.; Korzin, A.; Thege, C.; Schuhen, K. Comparison of AOP, GAC, and Novel Organosilane-Based Process for the Removal of Microplastics at a Municipal Wastewater Treatment Plant. Water 2023, 15, 1164. [Google Scholar] [CrossRef]
- Kalyanasundaram, B.; Goh, S.-H. Characterisation of Contact Parameters of Sand Grains to be Used for Discrete Element Modelling. E3S Web Conf. 2019, 92, 14002. [Google Scholar] [CrossRef]
- Nimmo, F. Europa’s Icy Shell: What is the Young’s Modulus of Ice? Department of Earth and Space Sciences, University of California Los Angeles: Los Angeles, CA, USA, 2004; Available online: https://websites.pmc.ucsc.edu/~fnimmo/website/draft5.pdf (accessed on 26 May 2024).
- Hönig, T. Hydroabrasion beim Rühren: Überprüfung des Bestehenden Modells und Erarbeitung einer Eventuell Notwendigen Korrektur. Diplomarbeit, Hochschule Anhalt, Köthen, Germany, 29 October 2013. Available online: https://opendata.uni-halle.de/bitstream/1981185920/12435/1/Hoenig_Tobias_2013_10.pdf (accessed on 26 May 2024).
- Cascajo-Castresana, M.; Morin, S.; Bittner, A.M. The Ice–Vapour Interface During Growth and Sublimation. Atmos. Chem. Phys. 2021, 21, 18629–18640. [Google Scholar] [CrossRef]
- Nichols, G. Sedimentology and Stratigraphy, 2nd ed.; Wiley-Blackwell: Chichester, UK, 2009; pp. 123–145, ISBN 978-1-4051-3592-4 (pbk.); ISBN 978-1-4051-9379-5 (hardcover); Available online: https://raregeologybooks.wordpress.com/wp-content/uploads/2014/09/sedimentology-and-stratigraphy-by-gary-nichols.pdf (accessed on 26 May 2024).
- Thomas, M.J.; Tømmerås, A.M. Norway’s 2022 National Population Projections: Results, Methods and Assumptions; Statistisk Sentralbyrå: Oslo, Norway, 2022; ISBN 978-82-587-1552-5 (printed); 978-82-587-1553-2 (electronic). [Google Scholar]
- International Commission for the Protection of the Danube River (ICPDR). The Danube River Basin: Facts and Figures; ICPDR: Vienna, Austria, 2022; Available online: https://www.thegef.org/sites/default/files/council-meeting-documents/GEF.C.27.Inf_.6.Annex_.1.pdf (accessed on 28 December 2024).
- Uehlinger, U.F.; Wantzen, K.M.; Leuven, R.S.; Arndt, H. Rivers of Europe; Tockner, K., Ed.; Acad. Pr.: London, UK, 2009; pp. 199–245. Available online: http://nbn-resolving.de/urn:nbn:de:bsz:352-opus-75190 (accessed on 28 December 2024).
- Gao, S.; Orlowski, N.; Bopf, F.K.; Breuer, L. A Review on Microplastics in Major European Rivers. WIREs Water 2024, 11, e1713. [Google Scholar] [CrossRef]
- Wang, Y.; Okochi, H.; Tani, Y.; Lin, L.; Wei, K.; Li, X.; Shi, J.; Chen, X.; Zhang, Y.; Kawamura, K. Airborne Hydrophilic Microplastics in Cloud Water at High Altitudes and Their Role in Cloud Formation. Environ. Chem. Lett. 2023, 21, 3055–3062. [Google Scholar] [CrossRef]
- Meade, R.H. Movement and Storage of Sediment in River Systems. In Physical and Chemical Weathering in Geochemical Cycles; NATO ASI Series; Lerman, A., Meybeck, M., Eds.; Springer: Dordrecht, The Netherlands, 1988; Volume 251. [Google Scholar] [CrossRef]
- Huang, J.-N.; Wen, B.; Zhu, J.-G.; Zhang, Y.-S.; Gao, J.-Z.; Chen, Z.-Z. Exposure to Microplastics Impairs Digestive Performance, Stimulates Immune Response and Induces Microbiota Dysbiosis in the Gut of Juvenile Guppy (Poecilia reticulata). Sci. Total Environ. 2020, 733, 138929. [Google Scholar] [CrossRef] [PubMed]
- Mu, X.; Qi, S.; Liu, J.; Yuan, L.; Huang, Y.; Xue, J.; Qian, L.; Wang, C.; Li, Y. Toxicity and Behavioral Response of Zebrafish Exposed to Combined Microplastic and Bisphenol Analogues. Environ. Chem. Lett. 2021, 20, 41–48. [Google Scholar] [CrossRef]
- Zhou, Q.; Zhang, H.; Fu, C.; Zhou, Y.; Dai, Z.; Li, Y.; Tu, C.; Luo, Y.s. The Distribution and Morphology of MPs in Coastal Soils Adjacent to the Bohai Sea and the Yellow Sea. Geoderma 2018, 322, 201–208. [Google Scholar] [CrossRef]
- Zhang, X.; Xia, M.; Zhao, J.; Cao, Z.; Zou, W.; Zhou, Q. Photoaging Enhanced the Adverse Effects of Polyamide MPs on the Growth, Intestinal Health, and Lipid Absorption in Developing Zebrafish. Environ. Int. 2022, 158, 106922. [Google Scholar] [CrossRef]

| Locations | Used Setup | Date and Time |
|---|---|---|
| Báišjohka | Stainless steel and SAN | 1 March 2024; 09:42 a.m. |
| Tanaelva 1 | Stainless steel and PP | 3 March 2024; 10:12 a.m. |
| Tanaelva 2 | Only SAN * | 3 March 2024; 10:42 a.m. |
| Bergebyelva | Stainless steel and PP | 3 March 2024; 12:02 p.m. |
| Suspension | Mean | Standard Deviation | Coefficient of Variation | Absolute Error | Relative Error |
|---|---|---|---|---|---|
| NL−1 | NL−1 | % | NL−1 | % | |
| Ice | 2434 | ±65 | 2.67 | 66 | 2.64 |
| Sand | 2416 | ±70 | 2.90 | 84 | 3.38 |
| Environment | 2428 | ±49 | 2.02 | 72 | 2.89 |
Disclaimer/Publisher’s Note: The statements, opinions and data contained in all publications are solely those of the individual author(s) and contributor(s) and not of MDPI and/or the editor(s). MDPI and/or the editor(s) disclaim responsibility for any injury to people or property resulting from any ideas, methods, instructions or products referred to in the content. |
© 2025 by the authors. Licensee MDPI, Basel, Switzerland. This article is an open access article distributed under the terms and conditions of the Creative Commons Attribution (CC BY) license (https://creativecommons.org/licenses/by/4.0/).
Share and Cite
Manna, F.; Mues, M.; Wiebensohn, C.; Dukat, M.; Fath, A. Influence on the Result by Abrasion on Filter Casings, Tested in the Environment in Finnmark, Norway. Microplastics 2025, 4, 14. https://doi.org/10.3390/microplastics4010014
Manna F, Mues M, Wiebensohn C, Dukat M, Fath A. Influence on the Result by Abrasion on Filter Casings, Tested in the Environment in Finnmark, Norway. Microplastics. 2025; 4(1):14. https://doi.org/10.3390/microplastics4010014
Chicago/Turabian StyleManna, Fabio, Michel Mues, Clara Wiebensohn, Maja Dukat, and Andreas Fath. 2025. "Influence on the Result by Abrasion on Filter Casings, Tested in the Environment in Finnmark, Norway" Microplastics 4, no. 1: 14. https://doi.org/10.3390/microplastics4010014
APA StyleManna, F., Mues, M., Wiebensohn, C., Dukat, M., & Fath, A. (2025). Influence on the Result by Abrasion on Filter Casings, Tested in the Environment in Finnmark, Norway. Microplastics, 4(1), 14. https://doi.org/10.3390/microplastics4010014