Article

Microplastic Filtration by a Coastal Mangrove Wetland as a Novel Ecosystem Service

1
Institute of Environment, Department of Earth and Environment, Florida International University, Modesto Maidique Campus, 11200 SW 8th Street, Miami, FL 33199, USA
2
Institute of Environment, Department of Chemistry and Biochemistry, Florida International University, Biscayne Bay Campus, 3000 NE 151st Street North, Miami, FL 33181, USA
*
Author to whom correspondence should be addressed.
Microplastics 2025, 4(2), 15; https://doi.org/10.3390/microplastics4020015
Submission received: 23 November 2024 / Revised: 4 February 2025 / Accepted: 25 March 2025 / Published: 6 April 2025

Abstract

:
Biscayne Bay in southeastern Florida, USA, has experienced dramatic ecological declines due to pollution. The Biscayne Bay and Southeastern Everglades Ecosystem Restoration will deliver water from a canal adjacent to coastal mangroves, intercepting pollutants before they are deposited into the estuary. Given their demonstrated capacity to filter nutrients and other contaminants from the water column, we hypothesized that mangrove wetlands also filter microplastics (“MPs”). Water and sediment samples were taken from 3 “zones”: the L-31E canal, a potential MP source; interior, dwarf mangroves; and coastal, tidal fringe mangroves. These three environments were replicated in coastal basins with and without canal culverts. MPs were expected to vary seasonally and be more abundant and larger in the dwarf zone and in low-bulk density sediments as particles settled into peat soils. In sediment, MPs were more abundant in the dry season (average 0.073 ± 0.102 (SD) MPs/g dw) before getting flushed by overland runoff resulting in greater concentrations in water during the wet season (average 0.179 ± 0.358 (SD) MPs/L). MPs were most abundant and larger in the low bulk density sediments of the dwarf zone, likely due to sheltering from fragmentation. Culvert presence had no effect, but MPs may increase as waterflows increase to planned volumes. Understanding MP dynamics enables managers to predict water quality impacts and leverage the potential ecosystem service of MP filtration by mangrove wetlands.

Graphical Abstract

1. Introduction

The emergent, ubiquitous, and often nonpoint source nature of microplastics (“MPs”; plastic particles < 5 mm in size) makes them challenging to manage. MPs are recognized as a priority pollutant, posing a transboundary threat to both natural and anthropogenic systems [1,2,3,4,5]. The lack of reliable techniques for removal from the environment [6,7] calls for nature-based solutions that can work at landscape scales. It is generally known that coastal vegetation traps plastic debris [8,9,10,11,12,13,14], although this waste remediation function may come with negative consequences [15,16]. Balancing advantages and disadvantages of managing the potential ecosystem service of plastic sequestration highlights evolving strategies to maintain water quality amidst increasing inputs of anthropogenic pollutants [17,18]. Importantly, considering plastic pollution mitigation from a nature-based solutions point of view would improve our understanding of MP dynamics while simultaneously generating management opportunities [19,20].
MPs are generally viewed to behave like sedimentary particles [21,22]. Well-documented mangrove ecosystem services like carbon sequestration are now being assessed in parallel with MP accumulation [17,18,23,24]. At global scales, some studies partially attribute missing proportions of MPs in the open ocean to their sequestration within coastal ecosystems [14,21,25]. The potential for plastics to be stored indefinitely in depositional environments has prompted researchers to cautiously consider the ecosystem service of MP retention over time [17,25,26,27,28,29,30] Building upon this framework, which situates a relatively recent (i.e., mid-1900’s [24]) contaminant like plastic pollution into sedimentary processes, provides broader context, guiding MP research and supporting the protection of coastal ecosystems. However, the mechanisms of MP retention are not well understood.
The capacity of wetlands to filter contaminants like heavy metals [31], excess nutrients [32,33], and bacteria [34] has been studied extensively for water management. The ability of estuaries and coastal environments to filter MPs out of the water column, preventing MP distribution downstream or offshore, has been suggested [2,24,35,36,37,38]. Deposition of MPs out of the water column via sedimentation [19,27,39], burial by physical and biological processes [21,30,40,41], and biological uptake by specialized bacteria [42,43,44,45] and plants [26,46] are some of the studied mechanisms. Constructed wetlands [47,48] and anthropogenic drainage systems [49,50,51,52] are also garnering attention regarding their capacity to reduce MP loads in influent. Characterization of this potential ecosystem service and its application through ecological restorations could inform coastal, natural infrastructure design to maximize benefits from water quality improvement projects.
Canals act as sources of pollutants like debris [53], excess nutrients [54,55], and other anthropogenic pollutants [56] from densely urbanized areas, agricultural lands, and industrial zones to Biscayne Bay, an estuary in southeastern Florida, USA. Studies documenting MPs in Florida and concerns about potential adverse ecological impacts are also increasing [57,58,59]. Declining water quality in Biscayne Bay and warning signs of ecological collapse, including algal blooms, seagrass die-offs, and fish kills [60,61], have prompted significant public interest in restoring the Bay [62,63]. As a result, millions of dollars have been dedicated to various local water restoration projects [64]. One such project, the Biscayne Bay Coastal Wetlands restoration, entails increasing freshwater deliveries through a coastal mangrove wetland (see Section 2). This redistribution of water through the wetland may also affect the dispersal of MPs. Currently, MPs are not monitored in this region, but considering rising concerns over the impacts of this emergent contaminant on ecosystem functioning and living resources [65,66,67], strategies for MP mitigation are needed. Moreover, public preference for green infrastructure for coastal flooding protection in the area [68] suggests the importance of nature-based solutions for future water quality improvement of plastic pollution as well.
Borrowing from the literature on treatment wetlands and coastal ecology, this experiment is one of few studies to directly assess the potential for MP filtration by a natural mangrove wetland [69] and its relevance to local water quality restoration. We focus here on the physical removal of MPs from the water column via gravitational settling under low water velocity and interception by vegetation. Using a hydrologic restoration site within the Biscayne Bay Coastal Wetlands for an experimental field study allowed us the unique opportunity to compare sections of the wetland with and without freshwater inputs. We hypothesized that MPs from upstream runoff are introduced into the wetland via water through culverts, and MPs would be most abundant during the wet season due to increased entrainment during rain events [70,71], and within the basin-like zone of dwarf mangroves compared to other zones, as suspended plastics settled into the sediment [69]. MPs were also expected to be larger in sediments and in the dwarf zone due to sheltering by low water velocity conditions [2,39]. Finally, it was expected that MP concentrations would be negatively correlated with bulk density as organic sediments that accumulate under low flow conditions may be more effective at adhering to and, therefore, trapping MPs [21,24]. This experiment will fill critical knowledge gaps on MP occurrence in Florida wetlands and MP dynamics to predict water quality impacts. It also contributes to the growing body of literature on the potential ecosystem service of MP sequestration by mangrove wetlands to inform local management strategies.

2. Study Area

Biscayne Bay is a shallow, brackish urban estuary in southeastern Florida. The hydrology of the Bay is largely impacted by water management throughout the watershed, including canals and scheduled water releases via pump systems, as well as sea level rise and saltwater intrusion due to climate change [72]. Mangrove wetlands, with dominant species Rhizophora mangle (red mangrove), Avicennia germinans (black mangrove), and Laguncularia racemosa (white mangrove), line much of Biscayne Bay’s southern coastline; in contrast, mangrove forests are less common along the central and northern coastlines of the Bay, which are more urbanized. Water quality across Biscayne Bay can be categorized into distinct zones based on the influence of major canals, urban development, landfill and wastewater infrastructure, and the limited circulation within the Bay and with the Atlantic Ocean, with the northern Bay experiencing overall lower water quality than other regions of the Bay [54,56,73,74].
The Biscayne Bay and Southeastern Everglades Ecosystem Restoration (BBSEER) project comprises several components of the Comprehensive Everglades Restoration Program focused on improving water quantity and quality in Biscayne Bay [64]. One restoration component is the L-31E flow-way in the Biscayne Bay Coastal Wetlands of southwestern Biscayne Bay. The L-31E flow-way includes the north–south running L-31E canal, which receives water from urban, agricultural, and industrial inland sources and releases it through culverts to disperse in a more natural “sheet flow” manner through coastal mangroves directly to the east. Construction of pumps to replace passive flow through these culverts is expected to improve drainage of inland urban and agricultural areas during the wet season, increase freshwater inputs to the Bay, and create a more natural distribution of water through the mangroves before reaching the estuary. Completion of these pumps was delayed, and discharges to the mangroves had not reached planned levels before the wet season sampling described below. However, the reduced volumes of water flowing through parts of the system [75] provided a pre-restoration baseline.
The flow-way has 3 distinct zones: the L-31E canal, which is expected to be a source of MPs coming from upstream, the dwarf mangrove basin in the middle of the wetland, where mangroves disperse incoming water, and the coastal fringe mangroves, which are the last barrier before freshwater reaches the Bay and are subjected to daily tides. The dwarf mangrove zone experiences less frequent interchanges of tidal water than the fringe forest, and therefore, water occasionally ponds in these basins for extended periods [76]. The mangrove forest is further divided into blocks that are separated from one other by humanmade banks that enclose drainage ditches constructed during the mid-20th century perpendicular to the Bay. Not all blocks are directly connected to the L-31E via a culvert.

3. Methods

3.1. Field Sampling

Surficial water and sediment samples were taken from each of the three zones in the L-31E flow-way: the L-31E canal, dwarf, and fringe. Six blocks were sampled, three of which are connected to the L31-E canal via a direct culvert (“treatment” blocks) and three without culverts, which are therefore only subject to rain and overland runoff or tides (“control” blocks) (Figure 1). It is expected that MPs originate from upstream sources, therefore culverts are hypothesized to introduce MPs into the flow-way.
Sampling locations (3 replicates in each block within each zone) were selected ahead of time via Google Earth satellite imagery and expert input. Locations in the canal and fringe were selected such that there was at least ~40–50 m distance from the North or South boundaries and between sampling locations. In the canal, the midpoint of each block was directly adjacent to the culvert, if present, whereas the fringe locations were spread more evenly along each block. Fringe samples were evenly spaced to account for the potential effects of longshore currents, wind, and creeks, or other coastal features which could disperse the water coming from the blocks. Within the dwarf mangroves, samples were taken 50 m away from the canal levee, immediately east of the culvert (if present), and 30 m north and south of that point. A sample location at the intersection of the L-31E and Gould’s canals was included because of the potential for a unique MP source to the L-31E from a nearby landfill. In total, 55 locations were sampled. Samples were taken in dry (December–April) and wet (May–November) seasons for comparison. The dry season samples were taken on 29 March 2022 (Fringe), 6 April 2022 and 9 April 2022 (Canal), and 21 April 2022 (Dwarf); the wet season samples were taken on 4 September 2022 (Canal), 9 September 2022 (Dwarf), and 11 September 2022 and 16 September 2022 (Fringe). In total, 110 sediment and 110 water samples were collected.
Water was sampled by scooping ~2400 mL of the top 5–10 cm of water using a mason jar and poured through a U.S. standard sediment sieve, mesh size 80, opening size 0.180 mm. The retentate on the sieve was tilted and carefully rinsed several times with deionized water into a glass vial for storage. In the dwarf and fringe, 10 cm depth by 12 cm diameter cores were taken in the middle of 0.5 m by 0.5 m quadrats using metal tubes and stored in aluminum tins. Auxiliary information collected at each quadrat included water depth if present, salinity (in ppt), water current direction, any visible debris within the quadrat or within 2 m of the quadrat (distinguished between the two), and date and time of collection, and these data are included in the Supplementary Materials. In the canal, benthic sediments were collected using a WildCo Ekman dredge (Yulee, FL, USA) launched from the canal bank. The bank was rocky for one to two meters away from the levee; therefore, sample volumes using the dredge were more variable than cores. Water samples were stored in the refrigerator, while sediment samples were frozen.

3.2. Bulk Density and Organic Matter Content

For dwarf and fringe mangrove sediment samples, a 2 × 1 × 1 cm rectangular prism was cut out of the middle portion of the surface of each frozen core. These subsections were placed into pre-weighed crucibles, weighed, then dried in an oven at 60 °C for 24–48 h until completely dry and weighed again to calculate bulk density [77,78]. The remainder of the sediment samples were also dried at the same temperature for up to 3 weeks, and the pre-weighed sample tins were subtracted from the mass to measure the sample dry weight before MP analysis [28,79,80]. The subsections were then placed in a furnace and combusted at 500 °C for 4 h (and an additional 0.5–1 h depending on the starting temperature of the furnace [77]). The final weight was taken and subtracted from the oven-dry subsection weight to calculate the organic matter content.
For some canal benthic sediments, bulk density was determined with a slightly modified method. These sediments contained more water and were mostly non-cohesive compared to fringe and dwarf sediments. Two mL aliquots of sediment were scooped from the center of each sample into glass vials for drying and combustion, being careful to avoid compacting the collected aliquots as much as possible.

3.3. Method Validation Tests

Nitric acid, Fenton’s reagent, and 30% hydrogen peroxide were tested as oxidizing agents for excess organic matter. Considering tradeoffs in organic matter removal, material costs, and chemical safety, and the fact that mangrove roots would only be destroyed with reagents strong enough to also destroy plastics, hydrogen peroxide (Lab Alley, Austin, TX, USA), at room temperature for 24 h was selected as the organic matter reduction method for this study. The percentage of organic matter reduction in additional test sediments collected from fringe mangroves was calculated.
To ensure that MPs were not negatively impacted by the oxidizing agent, a single replicate of 10 types of polymers (between 4 and 10 particles per polymer) were each exposed to ~2–5 mL of peroxide for 24 h. MPs between about 1–5 mm in the longest dimension were produced by hand, and included low- and high-density polyethylene films, polypropylene beads, polystyrene fragments, expanded polystyrene fragments, nylon fragments, polyester fragments, polyvinyl chloride fragments, polyethylene terephthalate films, and polyester fibers. Details on the materials for each MP standard are provided in Supplementary Materials (Table S1). The number of particles and mass were recorded before and after oxidation.
The same MP standards were spiked in additional Bay water (n = 10) and mangrove fringe sediment samples (n = 6) to quantify the recovery efficiency of the isolation method, which is described in the next section.

3.4. R.O.S.E.S. Microplastic Isolation and Identification

MPs were isolated and identified via the R.O.S.E.S. procedure (Rinse, Oxidize, Separate, Extract, Search), combining modified methods from Liu et al. [81], Hurley et al. [82], and Nuelle et al. [83]. Dried sediment samples were submerged in beakers of deionized water, covered, and sonicated to gently break the sediments apart. Samples were rinsed with deionized water through stacked 4 mm and 0.125 mm U.S. standard brass sieves (Fisher Scientific, Waltham, MA, USA), and the retentate on the 4 mm sieve was visually inspected. Suspected particles were stored for later measuring and scanning in a Nicolet iS5 FTIR spectrometer with Attenuated Total Reflectance (ATR) attachment (Thermo Fisher, Madison, WI, USA), and their spectra were qualitatively compared to a reference library of common plastic polymer standards from the Hawai’i Pacific University Center for Marine Debris Research Polymer Kit 1.0 [84]. However, only particles large enough to be handled in the spectrometer (generally, those greater than approximately 4 mm in size depending on the particle form) could be scanned. The retentate on the 0.125 mm sieve was then rinsed into a vacuum filter using 0.7 µm pore size glass fiber filter papers (GF/F, 47 mm diameter; Tisch Scientific, Cleves, OH, USA).
Each filter was then submerged in 3 mL or 100 mL of 30% hydrogen peroxide (for water and sediment samples, respectively) for 24 h in a fume hood at room temperature [79,83,85]. The samples were vacuum filtered, and sediments underwent a sequential series of density separations using NaCl (aq) (1.20 ± 0.010 g/mL; Aquasalt, Houston, TX, USA) and NaBr (aq) (1.40 ± 0.010 g/mL; Thermo Scientific, Waltham, MA, USA) solutions [81,83]. The solutions were re-filtered and frequently retested to maintain the appropriate densities before processing additional samples. We did not assess those filters as blank controls, but the lack of identified MPs of sufficient size to have penetrated through the filters (0.7 µm) suggests that contamination of the solutions was not an issue. Oxidized samples were thoroughly rinsed with water prior to flotation to avoid exothermic reactions between hydrogen peroxide and the salt ions [83], especially since the solutions were recycled. Water samples did not undergo density separation because the samples were taken from the water surface, thus all particles were buoyant.
Sediment samples were first subdivided into 2 to 4 subsamples to avoid clogging the filters, then transferred into centrifuge jars. NaCl (aq) was added to reach 250 mL volumes, and the sample was centrifuged at 4000 rpm at 20 °C for 15 min in a Heraeus Varifuge 3.0R (Hanau, Germany). The supernatant was carefully extracted from the surface using a manual siphon (turkey baster) and rinsed into a vacuum filter using salt solution, and those filters were stored in cleaned, covered Petri dishes. The remaining sediments were filtered again to recycle the NaCl solution, transferred back into cleaned centrifuge jars, and NaBr (aq) was added to reach 250 mL volumes. Samples were again centrifuged, and the supernatants were extracted and delivered onto the final filter papers, which were stored in covered Petri dishes, and the NaBr (aq) was recycled. A workflow diagram outlining each step is shown in Figure 2, and a step-by-step image series of the isolation process is shown in Figure 3.
Samples were assessed visually under a dissecting microscope sweeping across the entire filter paper. Each suspected MP particle was recorded with its length in the longest dimension, color, and form (fiber, fragment, film, or pellet). Examples of particle forms are shown in Figure 4. At the beginning of wet season analysis, the microscope for visual analysis became nonfunctional and was changed from an Olympus stereomicroscope (Tokyo, Japan) with QImaging MicroPublisher 3.3 RTV camera (Burnaby, BC, Canada) to a Keyence AHX3000 Z100 microscope (Itasca, IL, USA). Samples were still searched using the Olympus microscope, but were measured and imaged in the Keyence. Microplastic identification criteria are shown in Table 1. Suspected MPs were carefully removed from filters and mounted on separate Whatman microfiber filter papers (GF/F and GF/D; Thermo Scientific, Waltham, MA, USA) and index cards.

3.5. Contamination Prevention and Correction

A cotton lab coat was worn, all equipment was thoroughly washed several times with deionized water between samples, and samples were covered with aluminum foil when not in use. Sample blanks for water and sediment samples in the field and during laboratory analyses were collected. Filter papers wetted with deionized water were also set out near all processing and analysis activities, and were assessed for MP contamination. Limits of Quantification (LOQ) were calculated for particles based on form (fiber, film, fragment, or pellet) and color of each particle found in the contamination blanks according to the season and compartment of the associated samples:
L O Q = m e a n + ( 10 × σ )
Methods of contamination correction are variable in the MP literature, but use of LOQ (and/or Limits of Detection, LOD) is a rigorous, conservative method that is also utilized in analytical chemistry [86,87,88,89,90]. In this study, we opted for the method of excluding MP counts that were equal to or below the corresponding LOQ. The authors also compared this corrected dataset to those calculated using other methods of LOD/LOQ calculation, i.e., across all samples and according to season only, and raw data and found that the methods of calculation produced similar corrected results (Supplementary Materials Figure S1). The most conservative correction was chosen.

3.6. Statistical Tests of MP Concentrations and Size
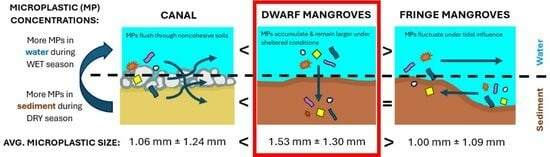
Linear regression and nonparametric robust regression models for MP concentrations by volume (for water samples) and per gram of dry sediment (for sediment samples) were run against season, zone, treatment, and an interaction between zone and treatment, to account for the possibility of culvert presence influencing the concentration of MPs in each zone. MP concentrations in sediments were also regressed against bulk density and organic matter content by linear and nonparametric rank-based estimation models. Finally, MP size was compared between compartments and zones with an ANOVA test. All analyses were conducted in R software version 4.2.3 [91], and plots were generated using the package “ggpubr” [92].

4. Results

The results of method validation tests are reported first, followed by statistics on identified contamination particles. Statistical analyses of MP concentrations in water, sediment, and MP sizes in both compartments are then reported. The original data collected in this study are available in the Supplementary Materials.

4.1. Method Validation and Spiked Test Samples

After exposing test sediment samples to 30% hydrogen peroxide for 24 h at room temperature, organic matter reduction ranged from 11.8–76.2% and averaged 38.4% ± 15.6% (n = 10). Sediments with more amorphous organic matter were oxidized more effectively than those with more calcium carbonates. In a test of 10 different MPs exposed to hydrogen peroxide for the same amount of time (the number of spiked particles in each sample was variable based on polymer weights and sizes, ranging from 4–10 particles), most plastic particles were recovered (except for polyester fibers), ranging from 16.7–100% (average of 88.7% ± 26.2%) by count and from 75.2–117% (average of 98.5% ± 13.8%) by weight, not including polyester fibers which were too small to be weighed (Figure S2). Particles did not appear to be changed visually, but any variation in weight loss for polymers fully recovered by count may be due to internal chemical reactions within the particles [81,82]. Overall, the recovery of plastics was not found to be significantly impacted by the peroxide. The reduction in organic matter was sufficient amid tradeoffs in plastic impacts, health risk of the oxidizing reagent, and ease of post-oxidation analysis.
In Figure 5 (left), the recovery by count and weight of MPs from test water samples following the entire analysis procedure are shown: 68% ± 34.6%–100% ± 0% by count and 80.8% ± 13.6%–101.0% ± 1.66% by weight in water (n = 10 replicates). Figure 5 (right) shows recovery from test sediment samples (n = 6 replicates), ranging from 10.0% ± 24.5% for PET to 100% ± 0% for PP by count and from 4.96% ± 7.70% for PVC to 115% ± 27.0% for EPS by weight. Figure S3 also shows sediment recoveries at each density separation step, but MP concentrations found in environmental sediment samples are reported here for the total particles found after both density separation steps. These recoveries were comparable to previous methodological studies except for PET, PVC, and to a lesser extent PA, although the tested forms of these polymers varied in previous studies [81,82,83,93]. For the water samples, most plastics were recovered by count and weight, whereas in sediments, recovery was strongly dependent on polymer type. By both count and weight, the method appears to work best for EPS, PP, and PS. EPS had weight recoveries over 100% due to some residual organic matter remaining in the irregular surface of the particles. Overall, lower sediment recoveries are expected due to the large amount of organic material compared to relatively clean water samples.

4.2. Contamination

In 28 contamination blanks (four lab procedural blanks, four field procedural blanks, and 20 ambient air blanks), 319 particles were identified, mostly from the ambient air during sample processing and MP analysis. Correcting the dataset based on the LOQ by season and compartment, 73.0% of the raw (uncorrected) environmental sample data were excluded because they were below the LOQ for the corresponding particle forms and colors. Horton et al. [89] discuss other studies that experienced difficulties in reporting numbers where counts of MPs are low (relatively “clean” samples) when using the LOD/LOQ correction method, emphasizing that contamination is inevitable.
Overall, most contamination particles were black (53.9%) or colorless (16.3%), and the majority were fibers (93.1%) (Supplementary Materials Table S2). The size distribution of contamination particles followed that of environmental samples being highly right-skewed (Supplementary Materials Figure S4). Further comparison of particle forms according to the “medium” in which the particles were sampled (i.e., air, lab and field blanks, sediment, and water) are provided in Figure S5.

4.3. Microplastic Concentrations in Water

In water samples, three particles were captured on the top sieve and were identified by FTIR analysis as expanded polystyrene, polyethylene, and polypropylene. On the final filter papers (i.e., captured on the 0.125 mm sieve), a total of 63 suspected MP particles were identified. Three of these particles were large enough for FTIR analysis and are suspected to be expanded polystyrene (n = 2) and polyethylene (n = 1). This corresponds to a low validation rate of the analyzed particles (4.76%); therefore, these data should be interpreted with caution. The most common colors were light blue (30.2%), colorless (20.6%), and red (17.5%), followed by white (11.1%). Fragments (57.1%) and fibers (30.2%) were the most common, followed by films (6.35%) and pellets (6.35%). Concentrations ranged between 0–1.562 MPs/L, with a mean of 0.179 ± 0.358 (SD) MPs/L. The distribution of MPs by volume in water is highly right-skewed.
The MP data was not normally distributed (Shapiro–Wilk test p-value = 1.92 × 10⁻⁹; Figure S6a), and variances were equal, as determined with a Levene Test (p-value = 0.106). Seven outliers, six of which were “extreme”, were detected but retained in the dataset due to the highly variable nature of MP abundance and our use of a conservative correction (LOQ). For these reasons, we also used a confidence level of 90%. Transformations were unsuccessful in normalizing the dataset (Figure S6b), potentially because of the prevalence of ‘zero’ counts, and a nonparametric robust regression was run for comparison but resulted in no significant variables. The results of the linear model are presented here.
Significant differences in MP concentrations in water were found between seasons (p-value = 0.00164) and zones (p-value = 0.06593). A Wilcox test of MP concentration and season was significant, with more MPs in the wet season than the dry (p-value = 0.00247 with a small effect size of r = 0.289) (Figure 6a). A Kruskal–Wallis test to follow up the significant zone variable was nonsignificant (p-value = 0.15; Figure 6b); however, the range of concentrations was the widest in the dwarf mangrove zone.

4.4. Microplastic Concentrations in Sediment

In sediment samples, 24 particles were captured on the top sieve (n = 19) or in remaining sediment after flotation and extraction (n = 5) and were identified by FTIR analysis as polyamide (n = 6), ethylene-vinyl acetate (n = 4), polyethylene (n = 4), polystyrene (n = 3), expanded polystyrene (n = 2), polyethylene terephthalate (n = 2), polypropylene (n = 2), and acrylonitrile butadiene styrene (n = 1). On the final filter papers (i.e., captured on the 0.125 mm sieve), 189 suspected MP particles were found in sediments. None of these particles could be validated by FTIR analysis; therefore, these data should be interpreted with caution. The most common particle colors were colorless (35.4%), blue (19.6%), and white (16.4%). Fragments were the most common forms (77.8%), followed by films (8.99%), fibers (7.94%), and pellets (5.29%). MP concentrations in sediment ranged from 0 to 0.649 MPs/g dry weight (dw), with an average of 0.073 ± 0.102 (SD) MPs/g dw. MP concentrations were again highly right-skewed.
The MP data was non-normal (Shapiro–Wilk test p-value = 2.78 × 10⁻¹⁰), and variances were equal, as determined with a Levene Test (p-value = 0.217). Eight outliers, five of which were “extreme”, were detected, but again, were retained in the dataset. The ANOVA was compared to a nonparametric, robust regression, which found no significant variables, but a rank-based estimation regression found the same significant variables as in the ANOVA. The results for the ANOVA are presented below.
There were significant differences between MP concentrations in sediments between seasons (p-value = 0.004494) and zones (p-value = 0.000522). MP concentrations were higher in the dry season compared to the wet (Wilcox test p-value = 0.000459 with a moderate effect size of r = 0.334) (Figure 7a). A follow-up Kruskal–Wallis test of MP concentrations between zones was significant (p-value = 0.000106), with a large effect size of eta2 = 0.152. A pairwise comparison showed that MP concentrations in the canal were significantly lower than in the dwarf (adjusted p-value = 0.00926) or fringe mangroves (adjusted p-value = 0.000104) (Figure 7b), but concentrations in the two mangrove zones did not differ.
In line with other studies that have compared MP concentration with sediment properties to understand if sediment type can predict MP accumulation [39,80,94,95,96,97], it was hypothesized that MP concentrations would be higher in sediments that had lower bulk density due to the inherent “stickiness” and trapping capacity of organic soils. Bulk density was greatest in the canal sediments, followed by fringe and dwarf sediments (Figure 8a). Bulk density was negatively correlated with MP concentration by a simple linear regression (p-value = 0.00194), but the model was not normally distributed (Shapiro–Wilk test p-value = 6.33 × 10⁻¹¹), was homoscedastic, and had a low multiple R2 value of 0.08785 (Figure 8b and Equation (1)). Bulk density was still significantly related to MP concentration by nonparametric rank-based estimation (p-value = 0.001368; multiple R2 = 0.0606). There was no significant relationship between MPs/g dw and organic matter content by parametric or nonparametric tests.
Equation (1) Linear regression of MP concentration in sediments as a function of bulk density with error parameter.
y = 0.11561 0.14513 x + ε

4.5. Microplastic Size

It was hypothesized that MPs would be larger in sediment and in the dwarf zone due to the sheltered, relatively stagnant conditions in the basins compared to the canal or fringe mangrove forest [76]. MP sizes by zone are shown in Table 2. Overall, MP sizes in sediments ranged from 0.077 to 7.26 mm (average 1.30 ± 1.27 mm) and from 0.062 to 5.54 mm (average 1.12 ± 1.14 mm) in water. Sizes are right-skewed, but similarly distributed in each compartment (Figure 9a). Six particles measured over 5 mm in length and are technically mesoplastics. These particles were maintained in the dataset as they were captured via the same procedure as MPs despite the upper mesh size boundary, and therefore, were quantified together. After log-transforming length, size by compartment and zone was close to normal (Shapiro–Wilk test p-value = 0.351), and the variances remained equal (Levene’s Test p-value = 0.328). A linear regression of log-transformed size against compartment and zone shows that size differs significantly by zone (p-value = 0.0000468). A Dunn’s Test pairwise comparison shows that MP size is significantly larger in the dwarf zone compared to the canal and fringe zones (Figure 9b).

5. Discussion

Limitations of this study include the reliance on visual identification of plastic particles and low (4.76% for water samples) or no spectroscopic validation (for sediment samples) of particles analyzed in the hypothesis testing. Other studies have discussed similar limitations, documenting the potential for under or overestimation using visual identification alone [71,98,99,100]. The conservative correction method for contamination and identification of plastic particles captured on the top sieve or in remaining sediments after flotation and extraction may ameliorate these limitations to some degree, but the results should nonetheless be interpreted with caution.
Using estimates of water volumes flowing through culverts for Water Year 2022 [75] to scale up average MP concentrations in canal water samples, over 3,310,000,000 MPs are introduced into the wetland in the wet season, and over 121,000,000 MPs are introduced in the dry season. MPs in sediment during the dry season may be washed out during the wet season when the pattern reverses and concentrations in water become higher. Others have also suggested the importance of wet season runoff and flooding in the dispersal of MPs [70,71,101,102]. Similar MP concentrations have been reported in wetland (including constructed wetland) sediments [28,80,94,96,103,104,105] and water [48,105,106,107]. However, our results are much lower, if not at the low end of concentration ranges reported in many other wetland studies [2,22,24,27,39]. The recovery rates of MPs using the R.O.S.E.S. method as measured by spiked test samples suggest that actual concentrations in the environment may be higher than reported, especially in sediments [93]. Overall, sediments of the L-31E flow-way appear to be a sink for MPs over time, which are likely coming from upstream in the watershed.
The lack of significant effect of treatment precludes our ability to say that MPs originated from the canal, entering the wetland through the culverts. However, as discussed by Badylak et al. [70], greater MP concentrations in water of southern Biscayne Bay during the wet season suggests that upstream runoff is a major source of MPs, and therefore, MPs could come from various, inland origins. Tidal events that breach the coastal, fringe mangrove berm occur primarily during seasonal high tide events [76], so the influence of MPs from tidal sources is expected to be minimal in the dwarf zone, but this influence will change as water levels rise. In terms of form, the abundance of fragments and, to a lesser extent, fibers also reflects the likely importance of runoff introducing secondary MPs generated from land-based sources (plastic particles derived from the breakdown of larger plastic products, as opposed to primary particles manufactured in their same form). Yu et al. [108] and Tunnell et al. [109] also reported a scarcity of primary, pre-production pellets on Florida coastlines which, if present, would indicate an offshore source from coastal manufacturing plants, such as those located elsewhere in the Gulf of Mexico where they are most prevalent [110].
Although not significant, a wider range of MP concentrations in the water of the dwarf zone and similar concentrations in sediments of the dwarf and fringe zones suggests that the presence of mangrove vegetation impacts MP concentrations. Other studies have found similar patterns of MP accumulation in vegetated wetlands and seagrass beds [19,25,26,27,36,71,96,111,112]. Fewer MPs in canal zone sediments than the dwarf or fringe, combined with a negative correlation between bulk density (canal sediments had the highest bulk densities) and MP concentrations in sediment, suggests that the mangrove sediments are effective at trapping MPs. These results may also reflect the fact that MPs accumulate in the interior basin and coastal fringe of the flow-way as water moves through the system and MPs are intercepted by vegetation and become less prone to resuspension [30,38,71]. This filtration mechanism has been demonstrated with MP removal efficiencies between 53–95% in freshwater urban wetlands [39,106] and 27–89% in natural and constructed treatment wetlands [113,114]. The canal had the least MPs in water as well. MPs may be more mobile and easily washed out of the noncohesive canal sediments. Slightly greater, although not significantly different, median concentrations in fringe sediments than in the dwarf may be the result of additional MP accumulation under the constant tidal influence of the Bay. However, the influence of tides was not explicitly factored into concentration measurements.
MPs may be stored in peat soils with low bulk density more than in rocky, shelly substrates, but there was no relationship between MP concentration and organic matter content. Several other studies have reported contradictory evidence regarding the relationship of MP concentrations and soil properties, such as grain size distribution and soil organic carbon [2,24,69,79,80,94,95,97,115]. Perhaps MP storage has more to do with the conditions under which organic soils are deposited rather than the soil itself. Size differences of MPs by zone suggest a sheltering effect in the dwarf zone where MPs accumulate and are protected from friction under relatively placid water conditions, remaining larger compared to other zones [12,14,29,116]. Xia et al. [39] reported the greatest concentrations of large MPs (0.5–5 mm) in sediments of an urban wetland, likely due to settling, but the smallest surveyed MPs (0.05–0.1 mm) may have also accumulated due to hyporheic exchange [40], a mechanism that merits further exploration in coastal wetlands. The possibility that size differences in the present study may also reflect a difference in MP source cannot be excluded. Polymer characterization by spectroscopy would better elucidate any differences in source [117]. Overall, the predominance of MPs < 1 mm in size corroborates with other studies in mangrove wetlands [69].
It is unclear if there is net MP storage over time, or if MP accumulation is temporary due to flushing of sediments during the wet season. Sediment samples represent accumulation over long periods of time compared to water, which is in continual flux. To assess the rates of MP deposition in sediments, sediment traps are required (see Nolte et al. [118] for examples of sedimentation measurement methods) and would be informative in the context of MP accumulation rates throughout the soil profile [24,25]. Moreover, our study took place during the preliminary stage of Biscayne Bay restoration. Water volumes released into the L-31E flow-way will increase as the ecosystem restoration progresses, and differences in MP concentrations between blocks with and without culverts may become more pronounced and provide a clearer picture of the wetland’s MP sources. On the contrary, raised water heights in the dwarf zone may exceed the coastal berm more often, causing tidal flooding to become more frequent and obscuring the signal of freshwater inputs. Long term monitoring and resampling will be needed to clarify these processes, but these results may be used to make predictions about MP dynamics post-restoration and to characterize the ecosystem properties that promote MP retention.
Considering the unique properties of wetlands and how they function is therefore useful for designing and guiding MP research to better understand the broader ecological processes that drive MP fate [22,39]. To understand MP retention and implications for water quality, it will be necessary to build on lessons learned from treatment wetlands performance and MP monitoring, particularly in: (1) developing MP mass balances for wetlands, (2) optimizing MP retention, borrowing from studies on phosphorus in the Everglades Stormwater Treatment Areas [33,119,120], and (3) developing ecotoxicological risk assessments of MPs following the Chesapeake Bay, Great Lakes, and California models [121,122]. Descriptions of these key research topics and suggested research directions are provided in the Supplementary Materials (Table S3). Infrastructure changes to minimize stormwater runoff, e.g., in marinas or near coastal roadways and canals, should also be assessed for their potential to reduce the dispersal of MP pollution [47,51,123]. Bioswales, retention ponds, and nutrient runoff filtration by urban greenspace [124,125] are examples of nature-based solutions that have improved water quality for other pollutants [126]. These case studies and innovations in landscaping and other “green industries” point to their potential for mitigating a ubiquitous contaminant like MPs.

6. Conclusions

The purpose of this study was to investigate patterns of MP accumulation in a coastal wetland with an experimental field study to determine if mangrove vegetation can filter MPs from the water column. Coastal mangroves in southwestern Biscayne Bay appear to intercept MPs in the L-31E flow-way, trapping them in organic, cohesive dwarf mangrove sediments. The nature and local context of wetlands, including sheltering, water supply, and accumulation of organic peat with low bulk density, affect the distribution, storage, and potentially the size (e.g., by reducing particle fragmentation) of retained MPs. Characterizing the properties of natural sediments that enable them to capture MPs and identifying where and when these properties may be optimized moves this field beyond case studies and closer to a shared understanding of MP sequestration as a quantifiable ecosystem service that is applicable to coastal management.
Because of its recent ecological declines, improving water quality in Biscayne Bay is time sensitive. Biscayne Bay is currently listed by the EPA as ‘Impaired’ by bacteria, nitrogen, chlorophyl, and iron according to Florida Statutes and the Clean Water Act [127]. The Biscayne Bay Task Force, a multidisciplinary stakeholder group focused on the health of the Bay, has also identified marine debris and plastic pollution as management priorities [63]. Proactive management should include monitoring of MPs in the context of other water quality parameters and encouragement of coordinated sample collection.
Using MPs as a complementary metric for assessing water quality could provide a broader picture of ecological and human health. For example, De Witte et al. [86] incorporated MP analyses into assessments of mussel quality, which included additional OSPAR and European Union indicators and contamination limits. If we are to manage the ecosystem service of wetlands in filtering MPs, the effects of MP accumulation on the recipient ecosystems and the fate of those contaminants if the wetland is disturbed will also need to be considered within the scope of impacts. In addition to policies that address the broader issue of plastic pollution sources and macro-sized debris, such strategies are needed to advance an ecological approach to MP management.

Supplementary Materials

The following supporting information can be downloaded at: https://www.mdpi.com/article/10.3390/microplastics4020015/s1, L-31E_data_SI.xlsx: Experimental data including microplastic concentrations in water and sediment, microplastic recovery from spiked samples, and sediment sample bulk densities. auxiliary_info.csv: Environmental data associated with sediment and water samples. Figure S1: Comparison of datasets with (3 different methods) and without (“raw”) contamination correction. Table S1: Homemade microplastic standard sources and sizes. Figure S2: Recovery of 10 different microplastics exposed to hydrogen peroxide for 24 h. Figure S3: Recovery of plastic particles by count (top graph) and weight (bottom graph) from test sediment samples. The “macro” size category refers to particles that were found on top of the larger 4 mm sieve before the filtering process. Table S2: Form, color, and count of contamination particles. Figure S4: Size of particles in contamination filters and environmental samples. Figure S5: Forms of MP particles found in sediment, water, field and lab blanks, and ambient air samples. Figure S6a: Residuals of untransformed linear model for water samples. Figure S6b: Residuals of transformed linear model for water samples. Table S3: Key research topics and directions to advance the field of MP management [119,128,129,130].

Author Contributions

Conceptualization, M.P. and M.R.; Data curation, M.P.; Formal analysis, M.P.; Funding acquisition, M.P.; Investigation, M.P.; Methodology, M.P., M.R. and P.G.; Project administration, M.P.; Resources, M.P., M.R. and P.G.; Supervision, M.P.; Validation, M.P.; Visualization, M.P.; Writing—original draft, M.P.; Writing—review & editing, M.P., M.R. and P.G. All authors have read and agreed to the published version of the manuscript.

Funding

This work was supported by The Everglades Foundation award number AWD000000008951 and is based upon work supported by the National Science Foundation under Grant No. HRD-1547798 and Grant No. HRD-2111661. These NSF Grants were awarded to Florida International University as part of the Centers of Research Excellence in Science and Technology (CREST) Program. Support was also provided through the Quad Fellowship by Schmidt Futures and the Institute of International Education. This is contribution #1851 from the Institute of Environment, a Preeminent Program at Florida International University.

Institutional Review Board Statement

Not applicable.

Informed Consent Statement

Not applicable.

Data Availability Statement

Data are contained within the Supplementary Materials.

Acknowledgments

The authors thank the FIU South Florida Terrestrial Ecology Lab, Environmental Analysis Research Lab, Florida Center for Analytical Electron Microscopy, and Ecosystem Ecology Lab for providing space and materials to conduct these experiments, and those who assisted with field work and method testing, including Rosario Vidales, Joshua Linenfelser, Carlos Pulido, Bianca Constant, Katherine Castrillon, Paige Stephenson, Keren Duran, Rigoberto Olivera, Shanece Esdaille, Abby Schuster, Marin Wilhelm, Stefanie Landeweer, Kassidy Troxell, Milena Ceccopieri da Rocha, and Patrick Roman.

Conflicts of Interest

The authors declare no conflict of interest.

References

  1. UN Habitat; WHO. Progress on Wastewater Treatment—Global Status and Acceleration Needs for SDG Indicator 6.3.1.; World Health Organization: Geneva, Switzerland, 2021. [Google Scholar]
  2. Kumar, R.; Sharma, P.; Bandyopadhyay, S. Evidence of microplastics in wetlands: Extraction and quantification in Freshwater and coastal ecosystems. J. Water Process. Eng. 2021, 40, 101966. [Google Scholar] [CrossRef]
  3. Ghosh, S.; Sinha, J.K.; Ghosh, S.; Vashisth, K.; Han, S.; Bhaskar, R. Microplastics as an Emerging Threat to the Global Environment and Human Health. Sustainability 2023, 15, 10821. [Google Scholar] [CrossRef]
  4. Abalansa, S.; El Mahrad, B.; Vondolia, G.K.; Icely, J.; Newton, A. The Marine Plastic Litter Issue: A Social-Economic Analysis. Sustainability 2020, 12, 8677. [Google Scholar] [CrossRef]
  5. Khan, A.; Jie, Z.; Wang, J.; Nepal, J.; Ullah, N.; Zhao, Z.-Y.; Wang, P.-Y.; Ahmad, W.; Khan, A.; Wang, W.; et al. Ecological risks of microplastics contamination with green solutions and future perspectives. Sci. Total Environ. 2023, 899, 165688. [Google Scholar] [CrossRef]
  6. Ismanto, A.; Hadibarata, T.; Kristanti, R.A.; Zainuri, M.; Sugianto, D.N.; Kusumastuti, W.; Anindita, M.A. Microplastics in ecological system: Their prevalence, health effects, and remediation. Environ. Nanotechnol. Monit. Manag. 2024, 22, 101007. [Google Scholar] [CrossRef]
  7. Padervand, M.; Lichtfouse, E.; Robert, D.; Wang, C. Removal of microplastics from the environment. A review. Environ. Chem. Lett. 2020, 18, 807–828. [Google Scholar] [CrossRef]
  8. Viehman, S.; Pluym, J.L.V.; Schellinger, J. Characterization of marine debris in North Carolina salt marshes. Mar. Pollut. Bull. 2011, 62, 2771–2779. [Google Scholar] [CrossRef]
  9. Brennan, E.; Wilcox, C.; Hardesty, B.D. Connecting flux, deposition and resuspension in coastal debris surveys. Sci. Total Environ. 2018, 644, 1019–1026. [Google Scholar] [CrossRef]
  10. Cordeiro, C.; Costa, T. Evaluation of solid residues removed from a mangrove swamp in the São Vicente Estuary, SP, Brazil. Mar. Pollut. Bull. 2010, 60, 1762–1767. [Google Scholar] [CrossRef]
  11. Paduani, M.; Ross, M.; Odom, G. Mangrove Forests of Biscayne Bay, FL, USA may Act as Sinks for Plastic Debris. Wetlands 2024, 44, 32. [Google Scholar] [CrossRef]
  12. Martin, C.; Almahasheer, H.; Duarte, C.M. Mangrove forests as traps for marine litter. Environ. Pollut. 2019, 247, 499–508. [Google Scholar] [CrossRef] [PubMed]
  13. Cesarini, G.; Scalici, M. Riparian vegetation as a trap for plastic litter. Environ. Pollut. 2022, 292, 118410. [Google Scholar] [CrossRef]
  14. Olivelli, A.; Hardesty, B.D.; Wilcox, C. Coastal margins and backshores represent a major sink for marine debris: Insights from a continental-scale analysis. Environ. Res. Lett. 2020, 15, 074037. [Google Scholar] [CrossRef]
  15. Rangel-Buitrago, N.; González-Fernández, D.; Defeo, O.; Neal, W.; Galgani, F. Rethinking plastic entrapment: Misconceptions and implications for ecosystem services in coastal habitats. Mar. Pollut. Bull. 2024, 205, 116665. [Google Scholar] [CrossRef] [PubMed]
  16. Su, X.; Yuan, J.; Lu, Z.; Xu, J.; He, Y. An enlarging ecological risk: Review on co-occurrence and migration of microplastics and microplastic-carrying organic pollutants in natural and constructed wetlands. Sci. Total Environ. 2022, 837, 155772. [Google Scholar] [CrossRef]
  17. Noman, A.; Adyel, T.M.; Trevathan-Tackett, S.; Macreadie, P.I. Plastic Paradox in Blue Carbon Ecosystems. Environ. Sci. Technol. 2024, 58, 4469–4475. [Google Scholar] [CrossRef]
  18. Watson, S.C.; Paterson, D.M.; Queirós, A.M.; Rees, A.P.; Stephens, N.; Widdicombe, S.; Beaumont, N.J. A conceptual framework for assessing the ecosystem service of waste remediation: In the marine environment. Ecosyst. Serv. 2016, 20, 69–81. [Google Scholar] [CrossRef]
  19. Deng, J.; Guo, P.; Zhang, X.; Su, H.; Zhang, Y.; Wu, Y.; Li, Y. Microplastics and accumulated heavy metals in restored mangrove wetland surface sediments at Jinjiang Estuary (Fujian, China). Mar. Pollut. Bull. 2020, 159, 111482. [Google Scholar] [CrossRef]
  20. Vogelsang, C.; Lusher, A.; Dadkhah, M.E.; Sundvor, I.; Umar, M.; Ranneklev, S.B.; Eidsvoll, D.; Meland, S. Microplastics in Road Dust—Characteristics, Pathways and Measures. 7361. 2019. Available online: https://toi.brage.unit.no/toi-xmlui/handle/11250/2670146 (accessed on 28 January 2024).
  21. Harris, P.T. The fate of microplastic in marine sedimentary environments: A review and synthesis. Mar. Pollut. Bull. 2020, 158, 111398. [Google Scholar] [CrossRef]
  22. Paduani, M. Microplastics as novel sedimentary particles in coastal wetlands: A review. Mar. Pollut. Bull. 2020, 161, 111739. [Google Scholar] [CrossRef]
  23. Rillig, M.C. Microplastic Disguising As Soil Carbon Storage. Environ. Sci. Technol. 2018, 52, 6079–6080. [Google Scholar] [CrossRef] [PubMed]
  24. Hall, E. Blue Carbon and Microplastic Sequestration in Coastal Habitats of the Philippines; University of Rhode Island: Kingston, RI, USA, 2023. [Google Scholar]
  25. Martin, C.; Baalkhuyur, F.; Valluzzi, L.; Saderne, V.; Cusack, M.; Almahasheer, H.; Krishnakumar, P.K.; Rabaoui, L.; Qurban, M.; Arias-Ortiz, A.; et al. Exponential increase of plastic burial in mangrove sediments as a major plastic sink. Sci. Adv. 2020, 6, eaaz5593. [Google Scholar] [CrossRef] [PubMed]
  26. Adaro, M.E.; Ronda, A.C. Natural filters of marine microplastic pollution: Implications for plants and submerged environments. Environ. Adv. 2024, 16, 100535. [Google Scholar] [CrossRef]
  27. Qian, J.; Tang, S.; Wang, P.; Lu, B.; Li, K.; Jin, W.; He, X. From source to sink: Review and prospects of microplastics in wetland ecosystems. Sci. Total Environ. 2021, 758, 143633. [Google Scholar] [CrossRef] [PubMed]
  28. Townsend, K.R.; Lu, H.-C.; Sharley, D.J.; Pettigrove, V. Associations between microplastic pollution and land use in urban wetland sediments. Environ. Sci. Pollut. Res. 2019, 26, 22551–22561. [Google Scholar] [CrossRef]
  29. Sanchez-Vidal, A.; Canals, M.; de Haan, W.P.; Romero, J.; Veny, M. Seagrasses provide a novel ecosystem service by trapping marine plastics. Sci. Rep. 2021, 11, 254. [Google Scholar] [CrossRef]
  30. Ogbuagu, C.C.; Kassem, H.; Udiba, U.U.; Stead, J.L.; Cundy, A.B. Role of saltmarsh systems in estuarine trapping of microplastics. Sci. Rep. 2022, 12, 15546. [Google Scholar] [CrossRef]
  31. Nguyễn, T.N.; Trương, V.V.; Phạm, T.T. Methodology for Assessing the Role of Mangroves in Trace Metal(loid) Filtration to Develop a Mechanism of Payments for Environmental Services for Mangroves in Vietnam (268); Center for International Forestry Research (CIFOR) and World Agroforestry Centre (ICRAF): Bogor, Indonesia, 2020. [Google Scholar]
  32. Chen, H.; Ivanoff, D.; Pietro, K. Long-term phosphorus removal in the Everglades stormwater treatment areas of South Florida in the United States. Ecol. Eng. 2015, 79, 158–168. [Google Scholar] [CrossRef]
  33. Armstrong, C.; Piccone, T.; Dombrowski, J. The largest constructed treatment wetland project in the world: The story of the Everglades stormwater treatment areas. Ecol. Eng. 2023, 193, 107005. [Google Scholar] [CrossRef]
  34. Vymazal, J. The Historical Development of Constructed Wetlands for Wastewater Treatment. Land 2022, 11, 174. [Google Scholar] [CrossRef]
  35. Harris, P.; Westerveld, L.; Nyberg, B.; Maes, T.; Macmillan-Lawler, M.; Appelquist, L. Exposure of coastal environments to river-sourced plastic pollution. Sci. Total Environ. 2021, 769, 145222. [Google Scholar] [CrossRef] [PubMed]
  36. Huang, Y.; Xiao, X.; Xu, C.; Perianen, Y.D.; Hu, J.; Holmer, M. Seagrass beds acting as a trap of microplastics—Emerging hotspot in the coastal region? Environ. Pollut. 2020, 257, 113450. [Google Scholar] [CrossRef] [PubMed]
  37. López, A.G.; Najjar, R.G.; Friedrichs, M.A.M.; Hickner, M.A.; Wardrop, D.H. Estuaries as Filters for Riverine Microplastics: Simulations in a Large, Coastal-Plain Estuary. Front. Mar. Sci. 2021, 8, 1200. [Google Scholar] [CrossRef]
  38. McIlwraith, H.K.; Lindeque, P.K.; Miliou, A.; Tolhurst, T.J.; Cole, M. Microplastic shape influences fate in vegetated wetlands. Environ. Pollut. 2024, 345, 123492. [Google Scholar] [CrossRef]
  39. Xia, F.; Liu, H.; Zhang, J.; Wang, D. Migration characteristics of microplastics based on source-sink investigation in a typical urban wetland. Water Res. 2022, 213, 118154. [Google Scholar] [CrossRef]
  40. Drummond, J.D.; Nel, H.A.; Packman, A.I.; Krause, S. Significance of Hyporheic Exchange for Predicting Microplastic Fate in Rivers. Environ. Sci. Technol. Lett. 2020, 7, 727–732. [Google Scholar] [CrossRef]
  41. Iribarne, O.; Botto, F.; Martinetto, P.; Gutierrez, J.L. The Role of Burrows of the SW Atlantic Intertidal Crab Chasmagnathus granulata in Trapping Debris. Mar. Pollut. Bull. 2000, 40, 1057–1062. [Google Scholar] [CrossRef]
  42. Accinelli, C.; Saccà, M.L.; Mencarelli, M.; Vicari, A. Deterioration of bioplastic carrier bags in the environment and assessment of a new recycling alternative. Chemosphere 2012, 89, 136–143. [Google Scholar] [CrossRef]
  43. Kathiresan, K. Polythene and Plastics-Degrading Microbes from the Mangrove Soil. Revista de Biología Tropical, 51. 2003. Available online: https://www.scielo.sa.cr/scielo.php?script=sci_arttext&pid=S0034-77442003000300003 (accessed on 28 January 2024).
  44. Sridewi, N.; Bhubalan, K.; Sudesh, K. Degradation of commercially important polyhydroxyalkanoates in tropical mangrove ecosystem. Polym. Degrad. Stab. 2006, 91, 2931–2940. [Google Scholar] [CrossRef]
  45. Kumar, S.; Hatha, A.; Christi, K. Diversity and effectiveness of tropical mangrove soil microflora on the degradation of polythene carry bags. Rev. De Biol. Trop. 2007, 55, 777–786. [Google Scholar] [CrossRef]
  46. Azeem, I.; Adeel, M.; Ahmad, M.A.; Shakoor, N.; Jiangcuo, G.D.; Azeem, K.; Ishfaq, M.; Shakoor, A.; Ayaz, M.; Xu, M.; et al. Uptake and Accumulation of Nano/Microplastics in Plants: A Critical Review. Nanomaterials 2021, 11, 2935. [Google Scholar] [CrossRef] [PubMed]
  47. Stang, C.; Mohamed, B.A.; Li, L.Y. Microplastic removal from urban stormwater: Current treatments and research gaps. J. Environ. Manag. 2022, 317, 115510. [Google Scholar] [CrossRef] [PubMed]
  48. Lu, H.-C.; Ziajahromi, S.; Locke, A.; Neale, P.A.; Leusch, F.D. Microplastics profile in constructed wetlands: Distribution, retention and implications. Environ. Pollut. 2022, 313, 120079. [Google Scholar] [CrossRef] [PubMed]
  49. García-Haba, E.; Hernández-Crespo, C.; Martín, M.; Andrés-Doménech, I. The role of different sustainable urban drainage systems in removing microplastics from urban runoff: A review. J. Clean. Prod. 2023, 411, 137197. [Google Scholar] [CrossRef]
  50. Österlund, H.; Blecken, G.; Lange, K.; Marsalek, J.; Gopinath, K.; Viklander, M. Microplastics in urban catchments: Review of sources, pathways, and entry into stormwater. Sci. Total Environ. 2023, 858, 159781. [Google Scholar] [CrossRef]
  51. Koutnik, V.S.; Leonard, J.; Glasman, J.B.; Brar, J.; Koydemir, H.C.; Novoselov, A.; Bertel, R.; Tseng, D.; Ozcan, A.; Ravi, S.; et al. Microplastics retained in stormwater control measures: Where do they come from and where do they go? Water Res. 2022, 210, 118008. [Google Scholar] [CrossRef]
  52. Gilbreath, A.; McKee, L.; Shimabuku, I.; Lin, D.; Werbowski, L.M.; Zhu, X.; Grbic, J.; Rochman, C. Multiyear Water Quality Performance and Mass Accumulation of PCBs, Mercury, Methylmercury, Copper, and Microplastics in a Bioretention Rain Garden. J. Sustain. Water Built Environ. 2019, 5, 04019004. [Google Scholar] [CrossRef]
  53. Ocean Conservancy; International Coastal Cleanup. We Clean On 2021 Report. 2021. Available online: https://oceanconservancy.org/wp-content/uploads/2021/09/2020-ICC-Report_Web_FINAL-0909.pdf (accessed on 12 February 2024).
  54. Millette, N.C.; Kelble, C.; Linhoss, A.; Ashby, S.; Visser, L. Using Spatial Variability in the Rate of Change of Chlorophyll a to Improve Water Quality Management in a Subtropical Oligotrophic Estuary. Estuaries Coasts 2019, 42, 1792–1803. [Google Scholar] [CrossRef]
  55. Caccia, V.G.; Boyer, J.N. A nutrient loading budget for Biscayne Bay, Florida. Mar. Pollut. Bull. 2007, 54, 994–1008. [Google Scholar] [CrossRef]
  56. Troxell, K.; Ceccopieri, M.; Gardinali, P. Unraveling the chemical fingerprint of the Miami River sources: Insights from high-resolution mass spectrometry and nontarget analysis. Chemosphere 2024, 349, 140863. [Google Scholar] [CrossRef]
  57. Kleinschmidt, J.M.; Janosik, A.M. Microplastics in Florida, United States: A Case Study of Quantification and Characterization with Intertidal Snails. Front. Ecol. Evol. 2021, 9, 638. [Google Scholar] [CrossRef]
  58. Walters, L.J.; Craig, C.A.; Dark, E.; Wayles, J.; Encomio, V.; Coldren, G.; Sailor-Tynes, T.; Fox, D.W.; Zhai, L. Quantifying Spatial and Temporal Trends of Microplastic Pollution in Surface Water and in the Eastern Oyster Crassostrea virginica for a Dynamic Florida Estuary. Environments 2022, 9, 131. [Google Scholar] [CrossRef]
  59. McEachern, K.; Alegria, H.; Kalagher, A.L.; Hansen, C.; Morrison, S.; Hastings, D. Microplastics in Tampa Bay, Florida: Abundance and variability in estuarine waters and sediments. Mar. Pollut. Bull. 2019, 148, 97–106. [Google Scholar] [CrossRef] [PubMed]
  60. Cole, A.M.; Durako, M.J.; Hall, M.O. Multivariate Analysis of Water Quality and Benthic Macrophyte Communities in Florida Bay, USA Reveals Hurricane Effects and Susceptibility to Seagrass Die-Off. Front. Plant Sci. 2018, 9, 630. [Google Scholar] [CrossRef]
  61. Yan, Z.; Kamanmalek, S.; Alamdari, N. Predicting coastal harmful algal blooms using integrated data-driven analysis of environmental factors. Sci. Total Environ. 2024, 912, 169253. [Google Scholar] [CrossRef]
  62. Wester, J. Public perception of an important urban estuary: Values, attitudes, and policy support in the Biscayne Bay-Miami Social Ecological System. PLoS ONE 2023, 18, e0287930. [Google Scholar] [CrossRef]
  63. Biscayne Bay Task Force. A Unified Approach to Recovery for a Healthy & Resilient Biscayne Bay. 2020. Available online: https://www.scribd.com/document/474305052/Recommendations-of-the-Biscayne-Bay-Task-Force#download&from_embed (accessed on 3 May 2023).
  64. U.S. Army Corps of Engineers; South Florida Water Management District. Central and Southern Florida Project Comprehensive Everglades Restoration Plan Project Management Plan. 2020. Available online: https://www.saj.usace.army.mil/BBSEER/ (accessed on 12 February 2024).
  65. Kibria, G. Impacts of microplastic on fisheries and seafood security—Global analysis and synthesis. Sci. Total Environ. 2023, 904, 166652. [Google Scholar] [CrossRef]
  66. McAfee, D.; Leung, J.Y.; Connell, S.D. Improving ecological function of polluted coasts under a tide of plastic waste. Front. Ecol. Environ. 2023, 21, 435–442. [Google Scholar] [CrossRef]
  67. Chiappone, M.; White, A.; Swanson, D.; Miller, S. Occurrence and biological impacts of fishing gear and other marine debris in the Florida Keys. Mar. Pollut. Bull. 2002, 44, 597–604. [Google Scholar] [CrossRef]
  68. Dario, C.; Molina, R.; Kelly, D.L. Public preferences for coastal adaptation: Economic evidence from a discrete choice experiment for hard structures and nature-based solutions in Miami, Florida. Mar. Policy 2024, 165, 106217. [Google Scholar] [CrossRef]
  69. Deng, H.; He, J.; Feng, D.; Zhao, Y.; Sun, W.; Yu, H.; Ge, C. Microplastics pollution in mangrove ecosystems: A critical review of current knowledge and future directions. Sci. Total Environ. 2021, 753, 142041. [Google Scholar] [CrossRef] [PubMed]
  70. Badylak, S.; Phlips, E.; Batich, C.; Jackson, M.; Wachnicka, A. Polystyrene microplastic contamination versus microplankton abundances in two lagoons of the Florida Keys. Sci. Rep. 2021, 11, 6029. [Google Scholar] [CrossRef]
  71. Almeida, C.M.R.; Sáez-Zamacona, I.; Silva, D.M.; Rodrigues, S.M.; Pereira, R.; Ramos, S. The Role of Estuarine Wetlands (Saltmarshes) in Sediment Microplastics Retention. Water 2023, 15, 1382. [Google Scholar] [CrossRef]
  72. Davis, S.M.; Childers, D.L.; Lorenz, J.J.; Wanless, H.R.; Hopkins, T.E. A Conceptual Model of Ecological Interactions in the Mangrove Estuaries of the Florida Everglades. Wetlands 2005, 25, 832–842. [Google Scholar] [CrossRef]
  73. Caccia, V.G.; Boyer, J.N. Spatial patterning of water quality in Biscayne Bay, Florida as a function of land use and water management. Mar. Pollut. Bull. 2005, 50, 1416–1429. [Google Scholar] [CrossRef]
  74. Ng, B.; Quinete, N.; Maldonado, S.; Lugo, K.; Purrinos, J.; Briceño, H.; Gardinali, P. Understanding the occurrence and distribution of emerging pollutants and endocrine disruptors in sensitive coastal South Florida Ecosystems. Sci. Total Environ. 2021, 757, 143720. [Google Scholar] [CrossRef]
  75. Charkhian, B.; Baldwin, L.; Deal, C.; Hazelton, D.; Niemeyer, N.; Hill, S.; Possley, J. South Florida Environmental Report-Volume III Appendix 2–3: Annual Permit Report for the Biscayne Bay Coastal Wetlands Project; South Florida Water Management District: West Palm Beach, FL, USA, 2023. [Google Scholar]
  76. Ross, M.S. The L-31E Surface Water Rediversion Project Final Report: Implementation, Results, and Recommendations. 2003. Available online: http://serc.fiu.edu/ (accessed on 1 September 2020).
  77. Castañeda-Moya, E.; Twilley, R.R.; Rivera-Monroy, V.H.; Zhang, K.; Davis, S.E.; Ross, M. Sediment and Nutrient Deposition Associated with Hurricane Wilma in Mangroves of the Florida Coastal Everglades. Estuaries Coasts 2010, 33, 45–58. [Google Scholar] [CrossRef]
  78. Charles, S.P.; Kominoski, J.S.; Armitage, A.R.; Guo, H.; Weaver, C.A.; Pennings, S.C. Quantifying how changing mangrove cover affects ecosystem carbon storage in coastal wetlands. Ecology 2020, 101, e02916. [Google Scholar] [CrossRef]
  79. Li, R.; Zhang, L.; Xue, B.; Wang, Y. Abundance and characteristics of microplastics in the mangrove sediment of the semi-enclosed Maowei Sea of the south China sea: New implications for location, rhizosphere, and sediment compositions. Environ. Pollut. 2019, 244, 685–692. [Google Scholar] [CrossRef]
  80. Lo, H.-S.; Xu, X.; Wong, C.-Y.; Cheung, S.-G. Comparisons of microplastic pollution between mudflats and sandy beaches in Hong Kong. Environ. Pollut. 2018, 236, 208–217. [Google Scholar] [CrossRef]
  81. Liu, M.; Song, Y.; Lu, S.; Qiu, R.; Hu, J.; Li, X.; Bigalke, M.; Shi, H.; He, D. A method for extracting soil microplastics through circulation of sodium bromide solutions. Sci. Total Environ. 2019, 691, 341–347. [Google Scholar] [CrossRef] [PubMed]
  82. Hurley, R.R.; Lusher, A.L.; Olsen, M.; Nizzetto, L. Validation of a Method for Extracting Microplastics from Complex, Organic-Rich, Environmental Matrices. Environ. Sci. Technol. 2018, 52, 7409–7417. [Google Scholar] [CrossRef]
  83. Nuelle, M.-T.; Dekiff, J.H.; Remy, D.; Fries, E. A new analytical approach for monitoring microplastics in marine sediments. Environ. Pollut. 2014, 184, 161–169. [Google Scholar] [CrossRef] [PubMed]
  84. Tewari, A.; Almuhtaram, H.; McKie, M.J.; Andrews, R.C. Microplastics for Use in Environmental Research. J. Polym. Environ. 2022, 30, 4320–4332. [Google Scholar] [CrossRef]
  85. Li, R.; Zhang, S.; Zhang, L.; Yu, K.; Wang, S.; Wang, Y. Field Study of the Microplastic Pollution in Sea Snails (Ellobium Chinense) from Mangrove Forest and Their Relationships with Microplastics in Water/Sediment Located on the North of Beibu Gulf. Environ. Pollut. 2020, 263, 114368. [Google Scholar] [CrossRef]
  86. De Witte, B.; Devriese, L.; Bekaert, K.; Hoffman, S.; Vandermeersch, G.; Cooreman, K.; Robbens, J. Quality assessment of the blue mussel (Mytilus edulis): Comparison between commercial and wild types. Mar. Pollut. Bull. 2014, 85, 146–155. [Google Scholar] [CrossRef]
  87. Waddell, E.N.; Lascelles, N.; Conkle, J.L. Microplastic contamination in Corpus Christi Bay blue crabs, Callinectes sapidus. Limnol. Oceanogr. Lett. 2020, 5, 92–102. [Google Scholar] [CrossRef]
  88. Johnson, A.C.; Ball, H.; Cross, R.; Horton, A.A.; Jürgens, M.D.; Read, D.S.; Vollertsen, J.; Svendsen, C. Identification and Quantification of Microplastics in Potable Water and Their Sources within Water Treatment Works in England and Wales. Environ. Sci. Technol. 2020, 54, 12326–12334. [Google Scholar] [CrossRef]
  89. Horton, A.A.; Cross, R.K.; Read, D.S.; Jürgens, M.D.; Ball, H.L.; Svendsen, C.; Vollertsen, J.; Johnson, A.C. Semi-automated analysis of microplastics in complex wastewater samples. Environ. Pollut. 2021, 268, 115841. [Google Scholar] [CrossRef]
  90. Tsering, T.; Viitala, M.; Hyvönen, M.; Reinikainen, S.-P.; Mänttäri, M. The assessment of particle selection and blank correction to enhance the analysis of microplastics with Raman microspectroscopy. Sci. Total Environ. 2022, 842, 156804. [Google Scholar] [CrossRef]
  91. R Core Team. R: A Language and Environment for Statistical Computing; R Foundation for Statistical Computing: Vienna, Austria, 2023; Available online: https://www.R-project.org/ (accessed on 11 December 2023).
  92. Kassambara, A. _ggpubr: ‘ggplot2’ Based Publication Ready Plots_. R package version 0.6.0. 2023. Available online: https://CRAN.R-project.org/package=ggpubr (accessed on 11 December 2023).
  93. Way, C.; Hudson, M.D.; Williams, I.D.; Langley, G.J. Evidence of underestimation in microplastic research: A meta-analysis of recovery rate studies. Sci. Total Environ. 2022, 805, 150227. [Google Scholar] [CrossRef] [PubMed]
  94. Nor, N.H.M.; Obbard, J.P. Microplastics in Singapore’s coastal mangrove ecosystems. Mar. Pollut. Bull. 2014, 79, 278–283. [Google Scholar] [CrossRef]
  95. Lourenço, P.M.; Serra-Gonçalves, C.; Ferreira, J.L.; Catry, T.; Granadeiro, J.P. Plastic and other microfibers in sediments, macroinvertebrates and shorebirds from three intertidal wetlands of southern Europe and west Africa. Environ. Pollut. 2017, 231, 123–133. [Google Scholar] [CrossRef] [PubMed]
  96. Li, J.; Zhang, H.; Zhang, K.; Yang, R.; Li, R.; Li, Y. Characterization, source, and retention of microplastic in sandy beaches and mangrove wetlands of the Qinzhou Bay, China. Mar. Pollut. Bull. 2018, 136, 401–406. [Google Scholar] [CrossRef] [PubMed]
  97. Browne, M.A.; Galloway, T.S.; Thompson, R.C. Spatial Patterns of Plastic Debris along Estuarine Shorelines. Environ. Sci. Technol. 2010, 44, 3404–3409. [Google Scholar] [CrossRef]
  98. Lusher, A.L.; Munno, K.; Hermabessiere, L.; Carr, S. Isolation and Extraction of Microplastics from Environmental Samples: An Evaluation of Practical Approaches and Recommendations for Further Harmonization. Appl. Spectrosc. 2020, 74, 1049–1065. [Google Scholar] [CrossRef]
  99. Hanvey, J.S.; Lewis, P.J.; Lavers, J.L.; Crosbie, N.D.; Pozo, K.; Clarke, B.O. A review of analytical techniques for quantifying microplastics in sediments. Anal. Methods 2017, 9, 1369–1383. [Google Scholar] [CrossRef]
  100. Lusher, A.L.; Bråte, I.L.N.; Munno, K.; Hurley, R.R.; Welden, N.A. Is It or Isn’t It: The Importance of Visual Classification in Microplastic Characterization. Appl. Spectrosc. 2020, 74, 1139–1153. [Google Scholar] [CrossRef]
  101. Hurley, R.; Woodward, J.; Rothwell, J.J. Microplastic contamination of river beds significantly reduced by catchment-wide flooding. Nat. Geosci. 2018, 11, 251–257. [Google Scholar] [CrossRef]
  102. Yonkos, L.T.; Friedel, E.A.; Perez-Reyes, A.C.; Ghosal, S.; Arthur, C.D. Microplastics in four estuarine rivers in the Chesapeake Bay, U.S.A. Environ. Sci. Technol. 2014, 48, 14195–14202. [Google Scholar] [CrossRef]
  103. Fraser, M.A.; Chen, L.; Ashar, M.; Huang, W.; Zeng, J.; Zhang, C.; Zhang, D. Occurrence and distribution of microplastics and polychlorinated biphenyls in sediments from the Qiantang River and Hangzhou Bay, China. Ecotoxicol. Environ. Saf. 2020, 196, 110536. [Google Scholar] [CrossRef] [PubMed]
  104. Naji, A.; Esmaili, Z.; Mason, S.A.; Vethaak, A.D. The occurrence of microplastic contamination in littoral sediments of the Persian Gulf, Iran. Environ. Sci. Pollut. Res. 2017, 24, 20459–20468. [Google Scholar] [CrossRef] [PubMed]
  105. Ziajahromi, S.; Drapper, D.; Hornbuckle, A.; Rintoul, L.; Leusch, F.D. Microplastic pollution in a stormwater floating treatment wetland: Detection of tyre particles in sediment. Sci. Total Environ. 2020, 713, 136356. [Google Scholar] [CrossRef] [PubMed]
  106. Liu, Q.; Hu, H.; Xiong, X.; Zhao, E.; Wang, K.; Wu, C. Urban natural wetland as a sink for microplastics: A case from Lalu Wetland in Tibet, China. Sci. Total Environ. 2022, 828, 154399. [Google Scholar] [CrossRef]
  107. Rasta, M.; Sattari, M.; Taleshi, M.S.; Namin, J.I. Identification and distribution of microplastics in the sediments and surface waters of Anzali Wetland in the Southwest Caspian Sea, Northern Iran. Mar. Pollut. Bull. 2020, 160, 111541. [Google Scholar] [CrossRef]
  108. Yu, X.; Ladewig, S.; Bao, S.; Toline, C.A.; Whitmire, S.; Chow, A.T. Occurrence and distribution of microplastics at selected coastal sites along the southeastern United States. Sci. Total Environ. 2018, 613–614, 298–305. [Google Scholar] [CrossRef]
  109. Tunnell, J.W.; Dunning, K.H.; Scheef, L.P.; Swanson, K.M. Measuring plastic pellet (nurdle) abundance on shorelines throughout the Gulf of Mexico using citizen scientists: Establishing a platform for policy-relevant research. Mar. Pollut. Bull. 2020, 151, 110794. [Google Scholar] [CrossRef]
  110. Grace, J.K.; Duran, E.; Ottinger, M.A.; Woodrey, M.S.; Maness, T.J. Microplastics in the Gulf of Mexico: A Bird’s Eye View. Sustainability 2022, 14, 7849. [Google Scholar] [CrossRef]
  111. Helcoski, R.; Yonkos, L.T.; Sanchez, A.; Baldwin, A.H. Wetland soil microplastics are negatively related to vegetation cover and stem density. Environ. Pollut. 2020, 256, 113391. [Google Scholar] [CrossRef]
  112. Yao, W.; Di, D.; Wang, Z.; Liao, Z.; Huang, H.; Mei, K.; Dahlgren, R.A.; Zhang, M.; Shang, X. Micro- and macroplastic accumulation in a newly formed Spartina alterniflora colonized estuarine saltmarsh in southeast China. Mar. Pollut. Bull. 2019, 149, 110636. [Google Scholar] [CrossRef]
  113. Sarkar, D.J.; Das Sarkar, S.; Das, B.K.; Sahoo, B.K.; Das, A.; Nag, S.K.; Manna, R.K.; Behera, B.K.; Samanta, S. Occurrence, fate and removal of microplastics as heavy metal vector in natural wastewater treatment wetland system. Water Res. 2021, 192, 116853. [Google Scholar] [CrossRef] [PubMed]
  114. Zhou, X.; Zhao, Y.; Pang, G.; Jia, X.; Song, Y.; Guo, A.; Wang, A.; Zhang, S.; Ji, M. Microplastic abundance, characteristics and removal in large-scale multi-stage constructed wetlands for effluent polishing in northern China. Chem. Eng. J. 2022, 430, 132752. [Google Scholar] [CrossRef]
  115. Vianello, A.; Boldrin, A.; Guerriero, P.; Moschino, V.; Rella, R.; Sturaro, A.; Da Ros, L. Microplastic particles in sediments of Lagoon of Venice, Italy: First observations on occurrence, spatial patterns and identification. Estuarine Coast. Shelf Sci. 2013, 130, 54–61. [Google Scholar] [CrossRef]
  116. Andrady, A.L. Microplastics in the marine environment. Mar. Pollut. Bull. 2011, 62, 1596–1605. [Google Scholar] [CrossRef]
  117. Ochoa, L.; Chan, J.; Auguste, C.; Arbuckle-Keil, G.; Fahrenfeld, N. Stormwater runoff microplastics: Polymer types, particle size, and factors controlling loading rates. Sci. Total Environ. 2024, 929, 172485. [Google Scholar] [CrossRef]
  118. Nolte, S.; Koppenaal, E.C.; Esselink, P.; Dijkema, K.S.; Schuerch, M.; De Groot, A.V.; Bakker, J.P.; Temmerman, S. Measuring sedimentation in tidal marshes: A review on methods and their applicability in biogeomorphological studies. J. Coast. Conserv. 2013, 17, 301–325. [Google Scholar] [CrossRef]
  119. Dierberg, F.E.; DeBusk, T.A.; Kharbanda, M.D.; Potts, J.A.; Grace, K.A.; Jerauld, M.J.; Ivanoff, D.B. Long-term sustainable phosphorus (P) retention in a low-P stormwater wetland for Everglades restoration. Sci. Total Environ. 2021, 756, 143386. [Google Scholar] [CrossRef]
  120. Walker, W.W. Design basis for Everglades Stormwater Treatment Areas. JAWRA J. Am. Water Resour. Assoc. 1995, 31, 671–685. [Google Scholar] [CrossRef]
  121. California Water Boards. Policy Handbook Establishing a Standard Method of Testing and Reporting of Microplastics in Drinking Water. 2022. Available online: https://www.waterboards.ca.gov/drinking_water/certlic/drinkingwater/docs/2022/mp-hndbk.pdf (accessed on 3 May 2023).
  122. Tetra Tech. Preliminary Conceptual Model for an Ecological Risk Assessment for Microplastics on Striped Bass in the Potomac River Estuary. 2021. Available online: https://d18lev1ok5leia.cloudfront.net/chesapeakebay/documents/FINAL_ERA_02102021.pdf (accessed on 3 May 2023).
  123. Bodus, B.; O’Malley, K.; Dieter, G.; Gunawardana, C.; McDonald, W. Review of emerging contaminants in green stormwater infrastructure: Antibiotic resistance genes, microplastics, tire wear particles, PFAS, and temperature. Sci. Total Environ. 2024, 906, 167195. [Google Scholar] [CrossRef]
  124. Alarcon, V.J.; Linhoss, A.C.; Kelble, C.R.; Mickle, P.F.; Fine, A.; Montes, E. Potential challenges for the restoration of Biscayne Bay (Florida, USA) in the face of climate change effects revealed with predictive models. Ocean Coast. Manag. 2023, 247, 106929. [Google Scholar] [CrossRef]
  125. 125. Public-Sector Green Infrastructure on the Rise, New Report Finds—Stormwater Report. (n.d.). Available online: https://stormwater.wef.org/2023/05/public-sector-green-infrastructure-on-the-rise-new-report-finds/ (accessed on 3 May 2023).
  126. Burgis, C.R.; Hayes, G.M.; Zhang, W.; Henderson, D.A.; Macko, S.A.; Smith, J.A. Tracking denitrification in green stormwater infrastructure with dual nitrate stable isotopes. Sci. Total Environ. 2020, 747, 141281. [Google Scholar] [CrossRef] [PubMed]
  127. 2022–2024 Biennial Assessment Draft Verified and Delist Lists|Florida Department of Environmental Protection. (n.d.). Available online: https://floridadep.gov/dear/watershed-assessment-section/content/2022-2024-biennial-assessment-draft-verified-and-delist (accessed on 28 January 2024).
  128. Peller, J.; Nevers, M.B.; Byappanahalli, M.; Nelson, C.; Babu, B.G.; Evans, M.A.; Kostelnik, E.; Keller, M.; Johnston, J.; Shidler, S. Sequestration of microfibers and other microplastics by green algae, Cladophora, in the US Great Lakes. Environ. Pollut. 2021, 276, 116695. [Google Scholar] [CrossRef] [PubMed]
  129. Shabbir, S.; Faheem, M.; Ali, N.; Kerr, P.G.; Wang, L.-F.; Kuppusamy, S.; Li, Y. Periphytic biofilm: An innovative approach for biodegradation of microplastics. Sci. Total Environ. 2020, 717, 137064. [Google Scholar] [CrossRef] [PubMed]
  130. Fla. Stat. § 376 et seq. Available online: http://www.leg.state.fl.us/statutes/index.cfm?App_mode=Display_Statute&URL=0300-0399/0376/0376.html (accessed on 10 October 2024).
Figure 1. Map of sampling locations (colored dots according to zone) in the L-31E Flow-way with insets of the USA, State of Florida, Miami-Dade County, and the Biscayne Bay Coastal Wetlands.
Microplastics 04 00015 g001
Figure 2. Workflow diagrams of sediment and water sample processing.
Microplastics 04 00015 g002
Figure 3. Workflow of R.O.S.E.S. microplastic isolation procedure.
Microplastics 04 00015 g003
Figure 4. Examples of particle forms. Fragment, Film, Fiber, and Pellet.
Microplastics 04 00015 g004
Figure 5. Average recovery of plastics by count and weight in test water (left) and sediment (right) samples ± standard deviation.
Microplastics 04 00015 g005
Figure 6. (a) Microplastic concentrations in water by season with asterisks denoting significant Wilcoxon test results at p-value between 0.001–0.01 and (b) Microplastic concentrations by zone with Kruskal–Wallis test results.
Microplastics 04 00015 g006
Figure 7. (a) Microplastic concentrations in sediment per gram dry weight (dw) by season with Wilcox test results and (b) Microplastic concentrations by zone with Kruskal–Wallis test results. Asterisks denote significant test results at p-values between 0.001–0.01 (**) and 0–0.001 (***).
Microplastics 04 00015 g007
Figure 8. (a) Bulk density by sampling zone and (b) Microplastic concentration in sediment as a function of sediment bulk density with Spearman correlation.
Microplastics 04 00015 g008
Figure 9. (a) Histogram of size distributions by compartment and (b) Log-transformed microplastic size by zone with asterisks denoting significant ANOVA test results at p-values between 0.01–0.05 (*) and 0–0.001 (***).
Microplastics 04 00015 g009
Table 1. Criteria for identifying microplastics.
Microplastic Identification Criteria
Distinct shape, clean edges, glows brightly, may look translucent
No scales, hairs, spots/stripes, bark, or cellular structures
Fibers equally thick and not twisted along their length; clean-cut ends
Non-natural color (optional)
Relatively even or consistent scratch marks/human-made indentations or markings (optional)
Table 2. Microplastic size (in millimeters) by zone.
ZonenMinMaxMeansd
Canal470.0777.261.061.24
Dwarf1130.1026.181.531.30
Fringe910.0626.311.001.09
Disclaimer/Publisher’s Note: The statements, opinions and data contained in all publications are solely those of the individual author(s) and contributor(s) and not of MDPI and/or the editor(s). MDPI and/or the editor(s) disclaim responsibility for any injury to people or property resulting from any ideas, methods, instructions or products referred to in the content.

