
Investigating the Epigenetic Effects of Polystyrene Nanoplastic Exposure in Bluegill (Lepomis macrochirus) Epithelial Cells Using Methylation-Sensitive AFLPs


Abstract
1. Introduction
1.1. Microplastics
1.2. Epigenetics and DNA Methylation
1.3. Bluegill Sunfish
2. Materials and Methods
2.1. Culture of BF-2 Cells
2.2. Nanoplastic Treatment
2.3. MS-AFLP Analysis of the Methylation State
2.4. Fragment and Statistical Analysis
3. Results
3.1. MMA
3.2. MMC
4. Discussion
Supplementary Materials
Author Contributions
Funding
Institutional Review Board Statement
Informed Consent Statement
Data Availability Statement
Acknowledgments
Conflicts of Interest
References
- Carpenter, E.J.; Smith, K.L., Jr. Plastics on the Sargasso Sea surface. Science 1972, 175, 1240–1241. [Google Scholar] [CrossRef]
- Andrady, A.L. Microplastics in the marine environment. Mar. Pollut. Bull. 2011, 62, 1596–1605. [Google Scholar] [CrossRef]
- Chamas, A.; Moon, H.; Zheng, J.; Qiu, Y.; Tabassum, T.; Jang, J.H.; Abu-Omar, M.; Scott, S.L.; Suh, S. Degradation rates of plastics in the environment. ACS Sustain. Chem. Eng. 2020, 8, 3494–3511. [Google Scholar] [CrossRef]
- Derraik, J.G. The pollution of the marine environment by plastic debris: A review. Mar. Pollut. Bull. 2002, 44, 842–852. [Google Scholar] [CrossRef] [PubMed]
- Barnes, D.K.A.; Galgani, F.; Thompson, R.C.; Barlaz, M. Accumulation and fragmentation of plastic debris in global environments. Philos. Trans. R. Soc. Lond. Ser. B 2009, 364, 1985–1998. [Google Scholar] [CrossRef]
- Ryan, P.G.; Moore, C.J.; van Franeker, J.A.; Moloney, C.L. Monitoring the abundance of plastic debris in the marine environment. Philos. Trans. R. Soc. Lond. Ser. B 2009, 364, 1999–2012. [Google Scholar] [CrossRef]
- Cózar, A.; Echevarría, F.; González-Gordillo, J.I.; Irigoien, X.; Úbeda, B.; Hernández-León, S.; Palma, Á.T.; Navarro, S.; García-de-Lomas, J.; Ruiz, A.; et al. Plastic debris in the open ocean. Proc. Natl. Acad. Sci. USA 2014, 111, 10239–10244. [Google Scholar] [CrossRef]
- Eriksen, M.; Lebreton, L.C.M.; Carson, H.S.; Theil, S.; Moore, C.J.; Borerro, J.C.; Galgani, F.; Ryan, P.G.; Reisser, J. Plastic pollution in the world’s oceans: More than 5 trillion plastic pieces weighing over 250,000 tons afloat at sea. PLoS ONE 2014, 9, e111913. [Google Scholar] [CrossRef]
- Wagner, M.; Scherer, C.; Alvarez-Muñoz, D.; Brennholt, N.; Bourrain, X.; Buchinger, S.; Fries, E.; Grosbois, C.; Klasmeier, J.; Marti, T.; et al. Microplastics in freshwater ecosystems: What we know and what we need to know. Environ. Sci. Eur. 2014, 26, 12. [Google Scholar] [CrossRef] [PubMed]
- Klein, S.; Dimzon, I.K.; Eubeler, J.; Knepper, T.P. Analysis, occurrence, and degradation of microplastics in the aqueous environment. In Freshwater Microplastics: The Handbook of Environmental Chemistry; Wagner, M., Lambert, S., Eds.; Springer: Cham, Switzerland, 2018; Volume 58, pp. 51–67. [Google Scholar]
- Forrest, S.A.; Holman, L.; Murphy, M.; Vermaire, J.C. Citizen Science sampling programs as a technique for monitoring microplastic pollution: Results, lessons learned and recommendations for working with volunteers for monitoring plastic pollution in freshwater ecosystems. Environ. Monit. Assess. 2019, 191, 172. [Google Scholar] [CrossRef]
- Gopinath, K.; Seshachalam, S.; Neelavannan, K.; Anburaj, V.; Rachel, M.; Ravi, S.; Bharath, M.; Achyuthan, H. Quantification of microplastic in Red Hills Lake of Chennai city, Tamil Nadu, India. Environ. Sci. Pollut. Res. 2020, 27, 33297–33306. [Google Scholar] [CrossRef]
- Rowley, K.H.; Cucknell, A.C.; Smith, B.D.; Clark, F.P.; Morritt, D. London’s river of plastic: High levels of microplastics in the Thames water column. Sci. Total Environ. 2020, 740, 140018. [Google Scholar] [CrossRef]
- Egessa, R.; Nankabirwa, A.; Ocaya, H.; Pabire, W.G. Microplastic pollution in surface water of Lake Victoria. Sci. Total Environ. 2020, 741, 140201. [Google Scholar] [CrossRef]
- Lestari, P.; Trihadiningrum, Y.; Wijaya, B.A.; Yunus, K.A.; Firdaus, M. Distribution of microplastics in Surabaya River, Indonesia. Sci. Total Environ. 2020, 726, 138560. [Google Scholar] [CrossRef] [PubMed]
- Liu, Y.; Zhang, J.D.; Cai, C.Y.; He, Y.; Chen, L.; Xiong, X.; Huang, H.; Tao, S.; Liu, W. Occurrence and characteristics of microplastics in the Haihe River: An investigation of a seagoing river flowing through a megacity in northern China. Environ. Pollut. 2020, 262, 114261. [Google Scholar] [CrossRef]
- Campanale, C.; Stock, F.; Massarelli, C.; Kochleus, C.; Bagnuolo, G.; Reifferscheid, G.; Uricchio, V.F. Microplastics and their possible sources: The example of Ofanto river in southeast Italy. Environ. Pollut. 2020, 258, 113284. [Google Scholar] [CrossRef]
- Li, J.; Liu, H.; Chen, J.P. Microplastics in freshwater systems: A review on occurrence, environmental effects, and methods for microplastics detection. Water Res. 2018, 137, 362–374. [Google Scholar] [CrossRef] [PubMed]
- Au, S.Y.; Lee, C.M.; Weinstein, J.E.; van den Hurk, P.; Klaine, S.J. Trophic transfer of microplastics in aquatic ecosystems: Identifying critical research needs. Integr. Environ. Assess. Manag. 2017, 13, 505–509. [Google Scholar] [CrossRef]
- Mattsson, K.; Adolfsson, K.; Ekvall, M.T.; Hansson, L.A.; Linse, S.; Cedervall, T.; Prinz, C.N. Translocation of 40 nm diameter nanowires through the intestinal epithelium of Daphnia magna. Nanotoxicology 2016, 10, 1160–1167. [Google Scholar] [CrossRef]
- Watts, A.J.R.; Lewis, C.; Goodhead, R.M.; Beckett, S.J.; Moger, J.; Tyler, C.R.; Galloway, T.S. Uptake and retention of microplastics by the shore crab Carcinus maenas. Environ. Sci. Technol. 2014, 48, 8823–8830. [Google Scholar] [CrossRef]
- Tanaka, K.; Takada, H.; Yamashita, R.; Mizukawa, K.; Fukuwaka, M.; Watanuki, Y. Accumulation of plastic-derived chemicals in tissues of seabirds ingesting marine plastics. Mar. Pollut. Bull. 2013, 69, 219–222. [Google Scholar] [CrossRef]
- Rehse, S.; Kloas, W.; Zarfl, C. Short-term exposure with high concentrations of pristine microplastic particles leads to immobilisation of Daphnia magna. Chemosphere 2016, 153, 91–99. [Google Scholar] [CrossRef]
- O’Brine, T.; Thompson, R.C. Degradation of plastic carrier bags in the marine environment. Mar. Pollut. Bull. 2010, 60, 2279–2283. [Google Scholar] [CrossRef] [PubMed]
- Lambert, S.; Wagner, M. Characterisation of nanoplastics during the degradation of polystyrene. Chemosphere 2016, 145, 265–268. [Google Scholar] [CrossRef]
- Gigault, J.; Pedrono, B.; Maxit, B.; Ter Halle, A. Marine plastic litter: The unanalyzed nano-fraction. Environ. Sci. Nano 2016, 3, 346–350. [Google Scholar] [CrossRef]
- Dawson, A.L.; Kawaguchi, S.; King, C.K.; Townsend, K.A.; King, R.; Huston, W.M.; Bengtson Nash, S.M. Turning microplastics into nanoplastics through digestive fragmentation by Antarctic krill. Nat. Commun. 2018, 9, 1001. [Google Scholar] [CrossRef] [PubMed]
- Kashiwada, S. Distribution of nanoparticles in the see-through medaka (Oryazias latipes). Environ. Health Perspect. 2006, 114, 1697–1702. [Google Scholar] [CrossRef] [PubMed]
- von Moos, N.; Burkhardt-Holm, P.; Kohler, A. Uptake and effects of microplastics on cells and tissue of the blue mussel Mytilus edulis L. after an experimental exposure. Environ. Sci. Technol. 2012, 46, 11327–11335. [Google Scholar] [CrossRef] [PubMed]
- Cedervall, T.; Hansson, L.A.; Lard, M.; Frohm, B.; Linse, S. Food chain transport of nanoparticles affects behaviour and fat metabolism in fish. PLoS ONE 2012, 7, e32254. [Google Scholar] [CrossRef] [PubMed]
- Mattsson, K.; Ekvall, M.T.; Borgstrom, M.T.; Linse, S.; Hansson, L.A.; Malmendal, A.; Cedervall, T. Altered behavior, physiology, and metabolism in fish exposed to polystyrene nanoparticles. Environ. Sci. Technol. 2015, 49, 553–561. [Google Scholar] [CrossRef] [PubMed]
- Karami, A.; Groman, D.B.; Wilson, S.P.; Ismail, P.; Neela, V.K. Biomarker response in zebrafish (Danio rerio) larvae exposed to pristine low-density polyethylene fragments. Environ. Pollut. 2017, 223, 466–475. [Google Scholar] [CrossRef] [PubMed]
- LeMoine, C.M.R.; Kelleher, B.M.; Lagarde, R.; Northam, C.; Elebute, O.O.; Cassone, B.J. Transcriptional effects of polyethylene microplastics ingestion in developing zebrafish (Danio rerio). Environ. Pollut. 2018, 243, 591–600. [Google Scholar] [CrossRef]
- Olsvik, P.A.; Whatmore, P.; Penglase, S.J.; Skjaerven, K.H.; d’Auriac, M.A.; Ellingsen, S. Associations between behavioral effects of bisphenol A and DNA methylation in zebrafish embryos. Front. Genet. 2019, 10, 184. [Google Scholar] [CrossRef]
- Cole, M.; Lindeque, P.; Fileman, E.; Halsband, C.; Goodhead, R.; Moger, J.; Galloway, T.S. Microplastic ingestion by zooplankton. Environ. Sci. Technol. 2013, 47, 6646–6655. [Google Scholar] [CrossRef]
- Fossi, M.C.; Coppola, D.; Baini, M.; Giannetti, M.; Guerranti, C.; Marsili, L.; Panti, C.; de Sabata, E.; Cló, S. Large filter feeding marine organisms as indicators of microplastic in the pelagic environment: The case studies of the Mediterranean basking shark (Cetorhinus maximus) and fin whale (Balaenoptera physalus). Mar. Environ. Res. 2014, 100, 17–24. [Google Scholar] [CrossRef]
- Fossi, M.C.; Baini, M.; Panti, C.; Galli, M.; Jiménez, B.; Muñoz-Arnanz, J.; Marsili, L.; Finoia, M.G.; Ramírez-Macías, D. Are whale sharks exposed to persistent organic pollutants and plastic pollution in the Gulf of California (Mexico)? First ecotoxicological investigation using skin biopsies. Comp. Biochem. Physiol. Part C 2017, 199, 48–58. [Google Scholar] [CrossRef] [PubMed]
- Murphy, F.; Russell, M.; Ewins, C.; Quinn, B. The uptake of macroplastic and microplastic by demersal and pelagic fish in the Northeast Atlantic around Scotland. Mar. Pollut. Bull. 2017, 122, 353–359. [Google Scholar] [CrossRef]
- Kleinschmidt, J.M.; Janosik, A.M. Microplastics in Florida, United States: A case study of quantification and characterization with intertidal snails. Front. Ecol. Evol. 2021, 9, 645727. [Google Scholar] [CrossRef]
- Prior, J.H.; Whitaker, J.M.; Janosik, A.M. Short-term microplastics exposure to the common mysid shrimp, Americamysis bahia: Effects on mortality and DNA methylation. Microplastics 2024, 3, 234–249. [Google Scholar] [CrossRef]
- Metzger, D.C.H.; Schulte, P.M. Epigenomics in marine fishes. Mar. Genom. 2016, 30, 43–54. [Google Scholar] [CrossRef]
- Richards, E.J. Inherited epigenetic variation—Revisiting soft inheritance. Natl. Rev. Genet. 2006, 7, 395–401. [Google Scholar] [CrossRef] [PubMed]
- Cubas, P.; Vincent, C.; Coen, E. An epigenetic mutation responsible for natural variation in floral symmetry. Nature 1999, 401, 157–161. [Google Scholar] [CrossRef]
- Morgan, H.D.; Sutherland, H.E.; Martin, D.I.K.; Whitelaw, E. Epigenetic inheritance at the agouti locus in the mouse. Nat. Genet. 1999, 23, 314–318. [Google Scholar] [CrossRef]
- Rakyan, V.K.; Chong, S.; Champ, M.E.; Cuthbert, P.C.; Morgan, H.D.; Luu, K.V.K.; Whitelaw, E. Transgenerational inheritance of epigenetic states at the murine Axin(Fu) allele occurs after maternal and paternal transmission. Proc. Natl. Acad. Sci. USA 2003, 100, 2538–2543. [Google Scholar] [CrossRef]
- Schrey, A.W.; Alvarez, M.; Foust, C.M.; Kilvitis, H.J.; Lee, J.D.; Liebl, A.L.; Martin, L.B.; Richards, C.L.; Robertson, M. Ecological epigenetics: Beyond MS-AFLP. Integr. Comp. Biol. 2013, 53, 340–350. [Google Scholar] [CrossRef] [PubMed]
- Bossdorf, O.; Richards, C.L.; Pigliucci, M. Epigenetics for ecologists. Ecol. Lett. 2008, 11, 106–115. [Google Scholar] [CrossRef] [PubMed]
- Jablonka, E.; Lamb, M.J. The evolution of information in the major transitions. J. Theor. Biol. 2006, 239, 236–246. [Google Scholar] [CrossRef]
- Li, E.; Zhang, Y. DNA methylation in mammals. Cold Spring Harb. Perspect. Biol. 2014, 6, a019133. [Google Scholar] [CrossRef] [PubMed]
- Jiang, L.; Zhang, J.; Wang, J.-J.; Wang, L.; Zhang, L.; Li, G.; Yang, X.; Ma, X.; Sun, X.; Cai, J.; et al. Sperm, but not oocyte, DNA methylome is inherited by zebrafish early embryos. Cell 2013, 153, 773–784. [Google Scholar] [CrossRef]
- Potok, M.E.; Nix, D.A.; Parnell, T.J.; Cairns, B.R. Reprogramming the maternal zebrafish genome after fertilization to match the paternal methylation pattern. Cell 2013, 153, 759–772. [Google Scholar] [CrossRef] [PubMed]
- Devlin, R.H.; Nagahama, Y. Sex determination and sex differentiation in fish: An overview of genetic, physiological, and environmental influences. Aquaculture 2002, 208, 191–364. [Google Scholar]
- Varriale, A.; Bernardi, G. DNA methylation and body temperature in fishes. Gene 2006, 385, 111–121. [Google Scholar] [CrossRef] [PubMed]
- Navarro-Martin, L.; Viñas, J.; Ribas, L.; Díaz, N.; Gutiérrez, A.; Di Croce, L.; Piferrer, F. DNA methylation of the gonadal aromatase (cyp19a) promoter is involved in temperature-dependent sex ratio shifts in the European seabass. PLoS Genet. 2011, 7, e1002447. [Google Scholar] [CrossRef] [PubMed]
- Timme-Laragy, A.R.; Meyer, J.N.; Waterland, R.A.; Di Giulio, R.T. Analysis of CpG methylation in the killifish CYP1A promoter. Comp. Biochem. Physiol. Part C Toxicol. Pharmacol. 2005, 141, 406–411. [Google Scholar] [CrossRef]
- Pierron, F.; Baillon, L.; Sow, M.; Gotreau, S.; Gonzalez, P. Effect of low-dose cadmium exposure on DNA methylation in the endangered European eel. Environ. Sci. Technol. 2014, 48, 797–803. [Google Scholar] [CrossRef]
- Ehrlich, M. Expression of various genes is controlled by DNA methylation during mammalian development. J. Cell Biochem. 2003, 88, 899–910. [Google Scholar] [CrossRef] [PubMed]
- Li, W.; Wang, Y.; Zhu, J.; Wang, Z.; Tang, G.; Huang, B. Differential DNA methylation may contribute to temporal and spatial regulation of gene expression and the development of mycelia and conidia in entomopathogenic fungus Metarhizium robertsii. Fungal Biol. 2017, 121, 293–303. [Google Scholar] [CrossRef]
- Kawakatsu, T.; Nery, J.R.; Castanon, R.; Ecker, J.R. Dynamic DNA methylation reconfiguration during seed development and germination. Genome Biol. 2017, 18, 171–183. [Google Scholar] [CrossRef] [PubMed]
- Garcia-Fernandez, P.; Gestal, C.; Garcia-Souto, D.; Moran, P.; Almansa, E. Epigenetic DNA methylation mediating Octopus vulgaris early development: Effect of essential fatty acids enriched diet. Front. Physiol. 2017, 8, 292. [Google Scholar] [CrossRef]
- Zhao, Y.; Wan, K.; Wang, J.; Wang, S.; Chang, Y.; Du, Z.; Zhang, L.; Dong, L.; Zhou, D.; Zhang, W.; et al. DNA methylation and gene expression profiling reveal the potential association of retinol metabolism-related genes with hepatocellular carcinoma development. PeerJ 2024, 12, e17916. [Google Scholar] [CrossRef]
- Hughes, T.; Ture-Ozdemir, F.; Alibaz-Oner, F.; Coit, P.; Direskeneli, H.; Sawalha, A.H. Epigenome-wide scan identifies a treatment-responsive pattern of altered DNA methylation among cytoskeletal remodeling genes in monocytes and CD4+ T cells from patients with Behçet’s disease. Arthritis Rheumatol. 2014, 66, 1648–1658. [Google Scholar] [CrossRef] [PubMed]
- Katto, J.; Mahlknecht, U. Epigenetic regulation of cellular adhesion in cancer. Carcinogenesis 2011, 32, 1414–1418. [Google Scholar] [CrossRef]
- Mahmud, F.; Sarker, D.B.; Jocelyn, J.A.; Sang, Q.-X.A. Molecular and cellular effects of microplastics and nanoplastics: Focus on inflammation and senescence. Cells 2024, 13, 1788. [Google Scholar] [CrossRef] [PubMed]
- Martin-Folgar, R.; González-Caballero, M.C.; Torres-Ruiz, M.; Cañas-Portilla, A.I.; de Alba González, M.; Liste, I.; Morales, M. Molecular effects of polystyrene nanoplastics on human neural stem cells. PLoS ONE 2024, 19, e0295816. [Google Scholar] [CrossRef]
- Poma, A.M.; Morciano, P.; Aloisi, M. Beyond genetics: Can micro and nanoplastics induce epigenetic and gene-expression modifications? Front. Epigenet. Epigenom. 2023, 1, 1241583. [Google Scholar] [CrossRef]
- Espinosa-Pérez, H.; Lambarri-Martínez, C. NatureServe. Lepomis macrochirus. The IUCN Red List of Threatened Species. 2019. Available online: https://doi.org/10.2305/IUCN.UK.2019-2.RLTS.T61260A58309944.en (accessed on 11 October 2024).
- Palchaudhuri, S.; Raymond, A.; Carlson, E.A.; Li, Y.; Zelikoff, J.T. Cytotoxic and cytoprotective effects of selenium on bluegill sunfish (Lepomis macrochirus) phagocytic cells in vitro. Bull. Environ. Contam. Toxicol. 2001, 67, 672–679. [Google Scholar] [CrossRef] [PubMed]
- Connelly, H.; Means, J.C. Immunomodulatory effects of dietary exposure to selected polycyclic aromatic hydrocarbons in the bluegill (Lepomis macrochirus). Int. J. Toxicol. 2010, 29, 532–545. [Google Scholar] [CrossRef] [PubMed]
- Srikanth, K.; Sundar, L.S.; Pereira, E.; Duarte, A.C. Graphene oxide induces cytotoxicity and oxidative stress in bluegill sunfish cells. J. Appl. Toxicol. 2018, 38, 504–513. [Google Scholar] [CrossRef]
- Poornavaishnavi, C.; Gowthamia, R.; Srikantha, K.; Bramhacharic, P.V.; Venkatramaiahd, N. Nickel nanoparticles induces cytotoxicity, cell morphology and oxidative stress in bluegill sunfish (BF-2) cells. Appl. Surf. Sci. 2019, 483, 1174–1181. [Google Scholar] [CrossRef]
- Browser, P.R.; Plumb, J.A. Channel catfish virus: Comparative replication and sensitivity of cell lines from channel catfish ovary and the brown bullhead. J. Wildl. Dis. 1980, 16, 451–454. [Google Scholar] [CrossRef]
- Mekarunothai, A.; Bacher, M.; Buathong, R.; Intarasam, S.; Tayana, N.; Kongkiatpaiboon, S.; Charoenrat, T.; Napiroon, T. β-sitosterol isolated from the leaves of Trema orientalis (Cannabaceae) promotes viability and proliferation of BF-2 cells. PeerJ 2024, 12, e16774. [Google Scholar] [CrossRef] [PubMed]
- MilliporeSigma; European Collection of Authenticated Cell Cultures. Subculture of adherent cell lines. In Fundamental Techniques in Cell Culture Laboratory Handbook, 4th ed.; Sigma-Aldrich: St. Louis, MO, USA, 2017; pp. 37–40. [Google Scholar]
- Vos, P.; Hogers, R.; Bleeker, M.; Reijans, M.; van de Lee, T.; Hornes, M.; Frijters, A.; Pot, J.; Peleman, J.; Kuiper, M.; et al. AFLP: A new technique for DNA fingerprinting. Nucleic Acids Res. 1995, 23, 4407–4414. [Google Scholar] [CrossRef] [PubMed]
- Xiong, L.Z.; Saghai Maroof, M.A.; Zhang, Q. Patterns of cytosine methylation in an elite rice hybrid and its parental lines, detected by a methylation-sensitive amplification polymorphism technique. Mol. Gen. Genet. 1999, 261, 439–446. [Google Scholar] [CrossRef]
- Li, S.; He, F.; Wen, H.; Li, J.; Si, Y.; Liu, M.; He, H.; Huang, Z. Analysis of DNA methylation level by methylation-sensitive amplification polymorphism in half-smooth tongue sole (Cynoglossus semilaevis) subjected to salinity stress. J. Ocean Univ. China 2017, 16, 269–278. [Google Scholar] [CrossRef]
- Kearse, M.; Moir, R.; Wilson, A.; Stones-Havas, S.; Cheung, M.; Sturrock, S.; Buxton, S.; Coope, A.; Markowitz, S.; Duran, C.; et al. Geneious Basic: An integrated and extendable desktop software platform for the organization and analysis of sequence data. Bioinformatics 2012, 28, 1647–1649. [Google Scholar] [CrossRef]
- Morán, P.; Pérez-Figueroa, A. Methylation changes associated with early maturation stages in the Atlantic salmon. BMC Genet. 2011, 12, 86–93. [Google Scholar] [CrossRef] [PubMed]
- Pérez-Figueroa, A. msap: A tool for the statistical analysis of methylation-sensitive amplified polymorphism data. Mol. Ecol. Resour. 2013, 13, 522–527. [Google Scholar] [CrossRef] [PubMed]
- R Core Team. R: A Language and Environment for Statistical Computing; R Foundation for Statistical Computing: Vienna, Austria, 2024; Available online: https://www.R-project.org/ (accessed on 5 October 2024).
- Alberti, G.; Chisquare: Chi-Square and G-Square Test of Independence, Power and Residual Analysis, Measures of Categorical Association. R Package Version 1.0. 2024. Available online: https://CRAN.R-project.org/package=chisquare (accessed on 5 October 2024).
- Morán, P.; Marco-Rius, F.; Megías, M.; Covelo-Soto, L.; Pérez-Figueroa, A. Environmental induced methylation changes associated with seawater adaptation in brown trout. Aquaculture 2013, 392–395, 77–83. [Google Scholar] [CrossRef]
- Jayaseelan, C.; Rahuman, A.A.; Ramkumar, R.; Perumal, P.; Rajakumar, G.; Kirthi, A.V.; Santhoshkumar, T.; Marimuthu, S. Effects of sub-acute exposure to nickel nanoparticles on oxidative stress and histopathological changes in Mozambique tilapia, Oreochromis mossambicus. Ecotox Environ. Saf. 2014, 107, 220–228. [Google Scholar] [CrossRef]
- Peters, C.A.; Bratton, S.P. Urbanization is a major influence on microplastic ingestion by sunfish in the Brazos River Basin, Central Texas, USA. Environ. Pollut. 2016, 210, 380–387. [Google Scholar] [CrossRef]
- Peters, C.A.; Thomas, P.A.; Rieper, K.B.; Bratton, S.P. Foraging preferences influence microplastic ingestion by six marine fish species from the Texas Gulf Coast. Mar. Pollut. Bull. 2017, 124, 82–88. [Google Scholar] [CrossRef] [PubMed]
- Varriale, A. DNA methylation, epigenetics, and evolution in vertebrates: Facts and challenges. Int. J. Evol. Biol. 2014, 2014, 475981. [Google Scholar] [CrossRef]
- Leslie, H.A.; van Velzen, M.J.M.; Brandsma, S.H.; Vethaak, A.D.; Garcia-Vallejo, J.J.; Lamoree, M.H. Discovery and quantification of plastic particle pollution in human blood. Environ. Int. 2022, 163, 107199. [Google Scholar] [CrossRef] [PubMed]
- Wang, H.; Shi, X.; Gao, Y.; Zhang, X.; Zhao, H.; Wang, L.; Zhang, X.; Chen, R. Polystyrene nanoplastics induce profound metabolic shift in human cells as revealed by integrated proteomic and metabolomic analysis. Environ. Int. 2022, 166, 107349. [Google Scholar] [CrossRef]
- Kyriakopoulos, G.L.; Zamparas, M.G.; Kapsalis, V.C. Investigating the human impacts and the environmental consequences of microplastics disposal into water resources. Sustainability 2022, 14, 828. [Google Scholar] [CrossRef]
- Zantis, L.J.; Carroll, E.L.; Nelms, S.E.; Bosker, T. Marine mammals and microplastics: A systematic review and call for standardization. Environ. Pollut. 2021, 269, 116142. [Google Scholar] [CrossRef]
- Goswami, S.; Adhikary, S.; Bhattacharya, S.; Agarwal, R.; Ganguly, A.; Nanda, S.; Rajak, P. The alarming link between environmental microplastics and health hazards with special emphasis on cancer. Life Sci. 2024, 355, 122937. [Google Scholar] [CrossRef]

| Experiment | Time Period | Total Concentration (Particles) |
|---|---|---|
| I (Low Concentration) | T1 (24 h) | 2.84 × 10¹¹ |
| T2 (48 h) | 2.84 × 10¹¹ | |
| T3 (72 h) | 2.84 × 10¹¹ | |
| II (Medium Concentration) | T1 (24 h) | 5.68 × 10¹¹ |
| T2 (48 h) | 5.68 × 10¹¹ | |
| T3 (72 h) | 5.68 × 10¹¹ | |
| III (High Concentration) | T1 (24 h) | 8.52 × 10¹¹ |
| T2 (48 h) | 8.52 × 10¹¹ | |
| T3 (72 h) | 8.52 × 10¹¹ | |
| IV (Bioaccumulation) | T1 (24 h) | 2.84 × 10¹¹ |
| T2 (48 h) | 5.68 × 10¹¹ | |
| T3 (72 h) | 8.52 × 10¹¹ |
| Experiment | Number of MSL | Number of NML | Number of Polymorphic MSL | Number of Polymorphic NML | |
|---|---|---|---|---|---|
| Number | Time | ||||
| I | T1 | 220 (78.6%) | 60 (21.4%) | 116 | 14 |
| T2 | 211 (75.4%) | 69 (24.6%) | 81 | 4 | |
| T3 | 199 (71.1%) | 81 (28.9%) | 69 | 5 | |
| II | T1 | 206 (73.8%) | 73 (26.2%) | 83 | 0 |
| T2 | 198 (71.0%) | 81 (29.0%) | 80 | 1 | |
| T3 | 189 (67.7%) | 90 (32.3%) | 64 | 2 | |
| III | T1 | 182 (65.5%) | 96 (34.5%) | 70 | 8 |
| T2 | 181 (65.1%) | 97 (34.9%) | 64 | 1 | |
| T3 | 186 (66.9%) | 92 (33.1%) | 64 | 2 | |
| IV | T1 | 203 (66.3%) | 103 (33.7%) | 91 | 4 |
| T2 | 196 (64.1%) | 110 (35.9%) | 65 | 7 | |
| T3 | 216 (70.6%) | 90 (29.4%) | 77 | 2 | |
| Experiment | Number of MSL | Number of NML | Number of Polymorphic MSL | Number of Polymorphic NML | |
|---|---|---|---|---|---|
| Number | Time | ||||
| I | T1 | 151 (65.1%) | 81 (34.9%) | 55 | 2 |
| T2 | 162 (69.8%) | 70 (30.2%) | 62 | 7 | |
| T3 | 139 (59.9%) | 93 (40.1%) | 48 | 3 | |
| II | T1 | 149 (60.1%) | 99 (39.9%) | 59 | 0 |
| T2 | 175 (70.6%) | 73 (29.4%) | 70 | 3 | |
| T3 | 168 (67.7%) | 80 (32.3%) | 67 | 2 | |
| III | T1 | 144 (59.5%) | 98 (40.5%) | 58 | 2 |
| T2 | 160 (66.1%) | 82 (33.9%) | 60 | 0 | |
| T3 | 162 (66.9%) | 80 (33.1%) | 61 | 7 | |
| IV | T1 | 185 (67.3%) | 90 (32.7%) | 80 | 2 |
| T2 | 171 (62.2%) | 104 (37.8%) | 55 | 4 | |
| T3 | 189 (68.7%) | 86 (31.3%) | 63 | 1 | |
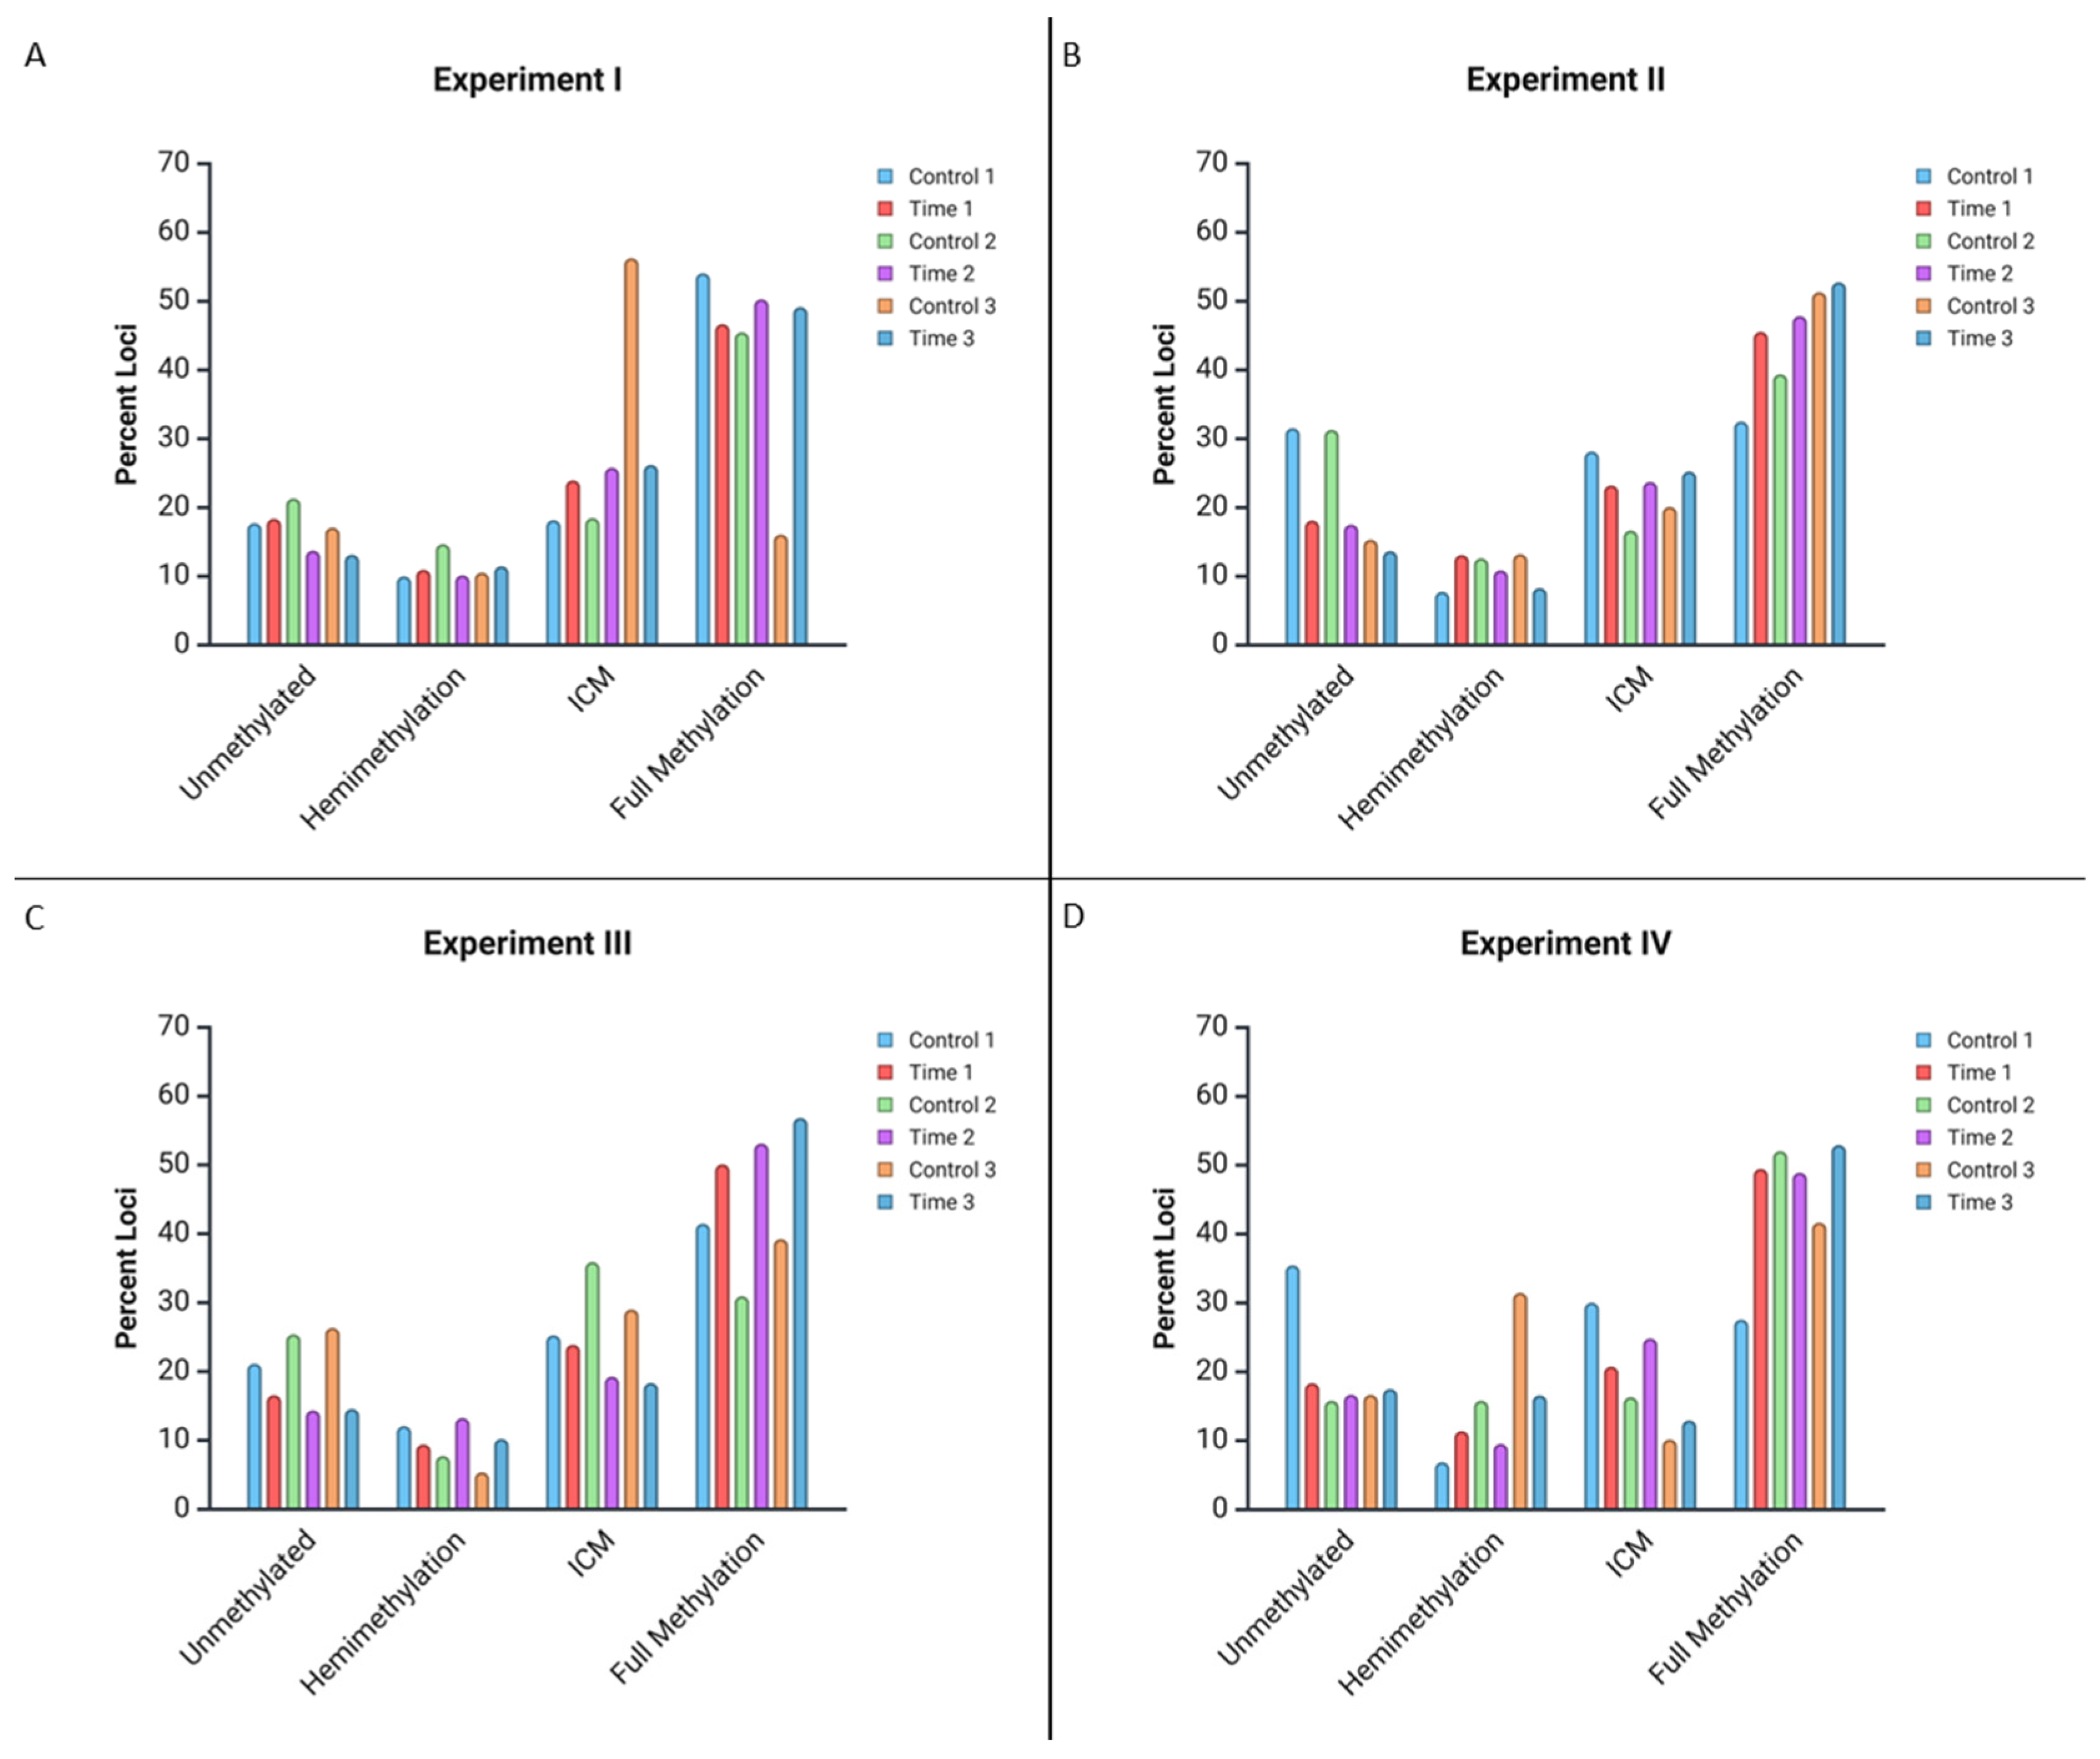
| Experiment Number | C1 | T1 | C2 | T2 | C3 | T3 | |
|---|---|---|---|---|---|---|---|
| I | No Methylation | 17.73% | 18.38% | 21.33% | 13.74% | 17.09% | 13.15% |
| Hemimethylation | 10% | 10.97% | 14.69% | 10.16% | 10.55% | 11.47% | |
| Internal Cytosine Methylation | 18.18% | 23.96% | 18.48% | 25.8% | 56.28% | 26.21% | |
| Full Methylation | 54.09% | 46.69% | 45.5% | 50.3% | 16.08% | 49.16% | |
| II | No Methylation | 31.55% | 18.12% | 31.31% | 17.53% | 15.34% | 13.68% |
| Hemimethylation | 7.77% | 13.11% | 12.63% | 10.89% | 13.23% | 8.31% | |
| Internal Cytosine Methylation | 28.16% | 23.22% | 16.67% | 23.74% | 20.11% | 25.25% | |
| Full Methylation | 32.52% | 45.55% | 39.39% | 47.84% | 51.32% | 52.76% | |
| III | No Methylation | 21.15% | 16.58% | 25.41% | 14.36% | 26.34% | 14.58% |
| Hemimethylation | 12.09% | 9.43% | 7.74% | 13.26% | 5.38% | 10.22% | |
| Internal Cytosine Methylation | 25.27% | 23.90% | 35.91% | 19.26% | 29.03% | 18.35% | |
| Full Methylation | 41.48% | 50.09% | 30.94% | 53.12% | 39.25% | 56.85% | |
| IV | No Methylation | 35.47% | 18.37% | 15.82% | 16.69% | 16.67% | 17.52% |
| Hemimethylation | 6.90% | 11.40% | 15.82% | 9.55% | 31.48% | 16.59% | |
| Internal Cytosine Methylation | 30.05% | 20.76% | 16.33% | 24.85% | 10.19% | 12.96% | |
| Full Methylation | 27.59% | 49.47% | 52.04% | 48.91% | 41.67% | 52.93% | |
| Experiment Number | Control | T1 | T2 | T3 | |
|---|---|---|---|---|---|
| I (Low Concentration) | Control | 0.7141 | 0.2703 | 3.162 × 10⁻⁶ | |
| T1 | 1.364 | 0.8245 | 0.7908 | ||
| T2 | 3.919 | 0.904 | 0.9908 | ||
| T3 | 28.286 | 1.043 | 0.109 | ||
| II (Medium Concentration) | Control | 0.0539 | 0.1082 | 0.6104 | |
| T1 | 7.647 | 0.9643 | 0.5107 | ||
| T2 | 6.072 | 0.277 | 0.775 | ||
| T3 | 1.821 | 2.309 | 1.109 | ||
| III (High Concentration) | Control | 0.6303 | 0.0015 | 0.0147 | |
| T1 | 1.730 | 0.707 | 0.7252 | ||
| T2 | 15.398 | 1.394 | 0.9092 | ||
| T3 | 10.512 | 1.317 | 0.544 | ||
| IV (Bioaccumulation) | Control | 0.0024 | 0.3296 | 0.0977 | |
| T1 | 14.449 | 0.8933 | 0.4067 | ||
| T2 | 3.433 | 0.614 | 0.121 | ||
| T3 | 6.305 | 2.904 | 5.814 |
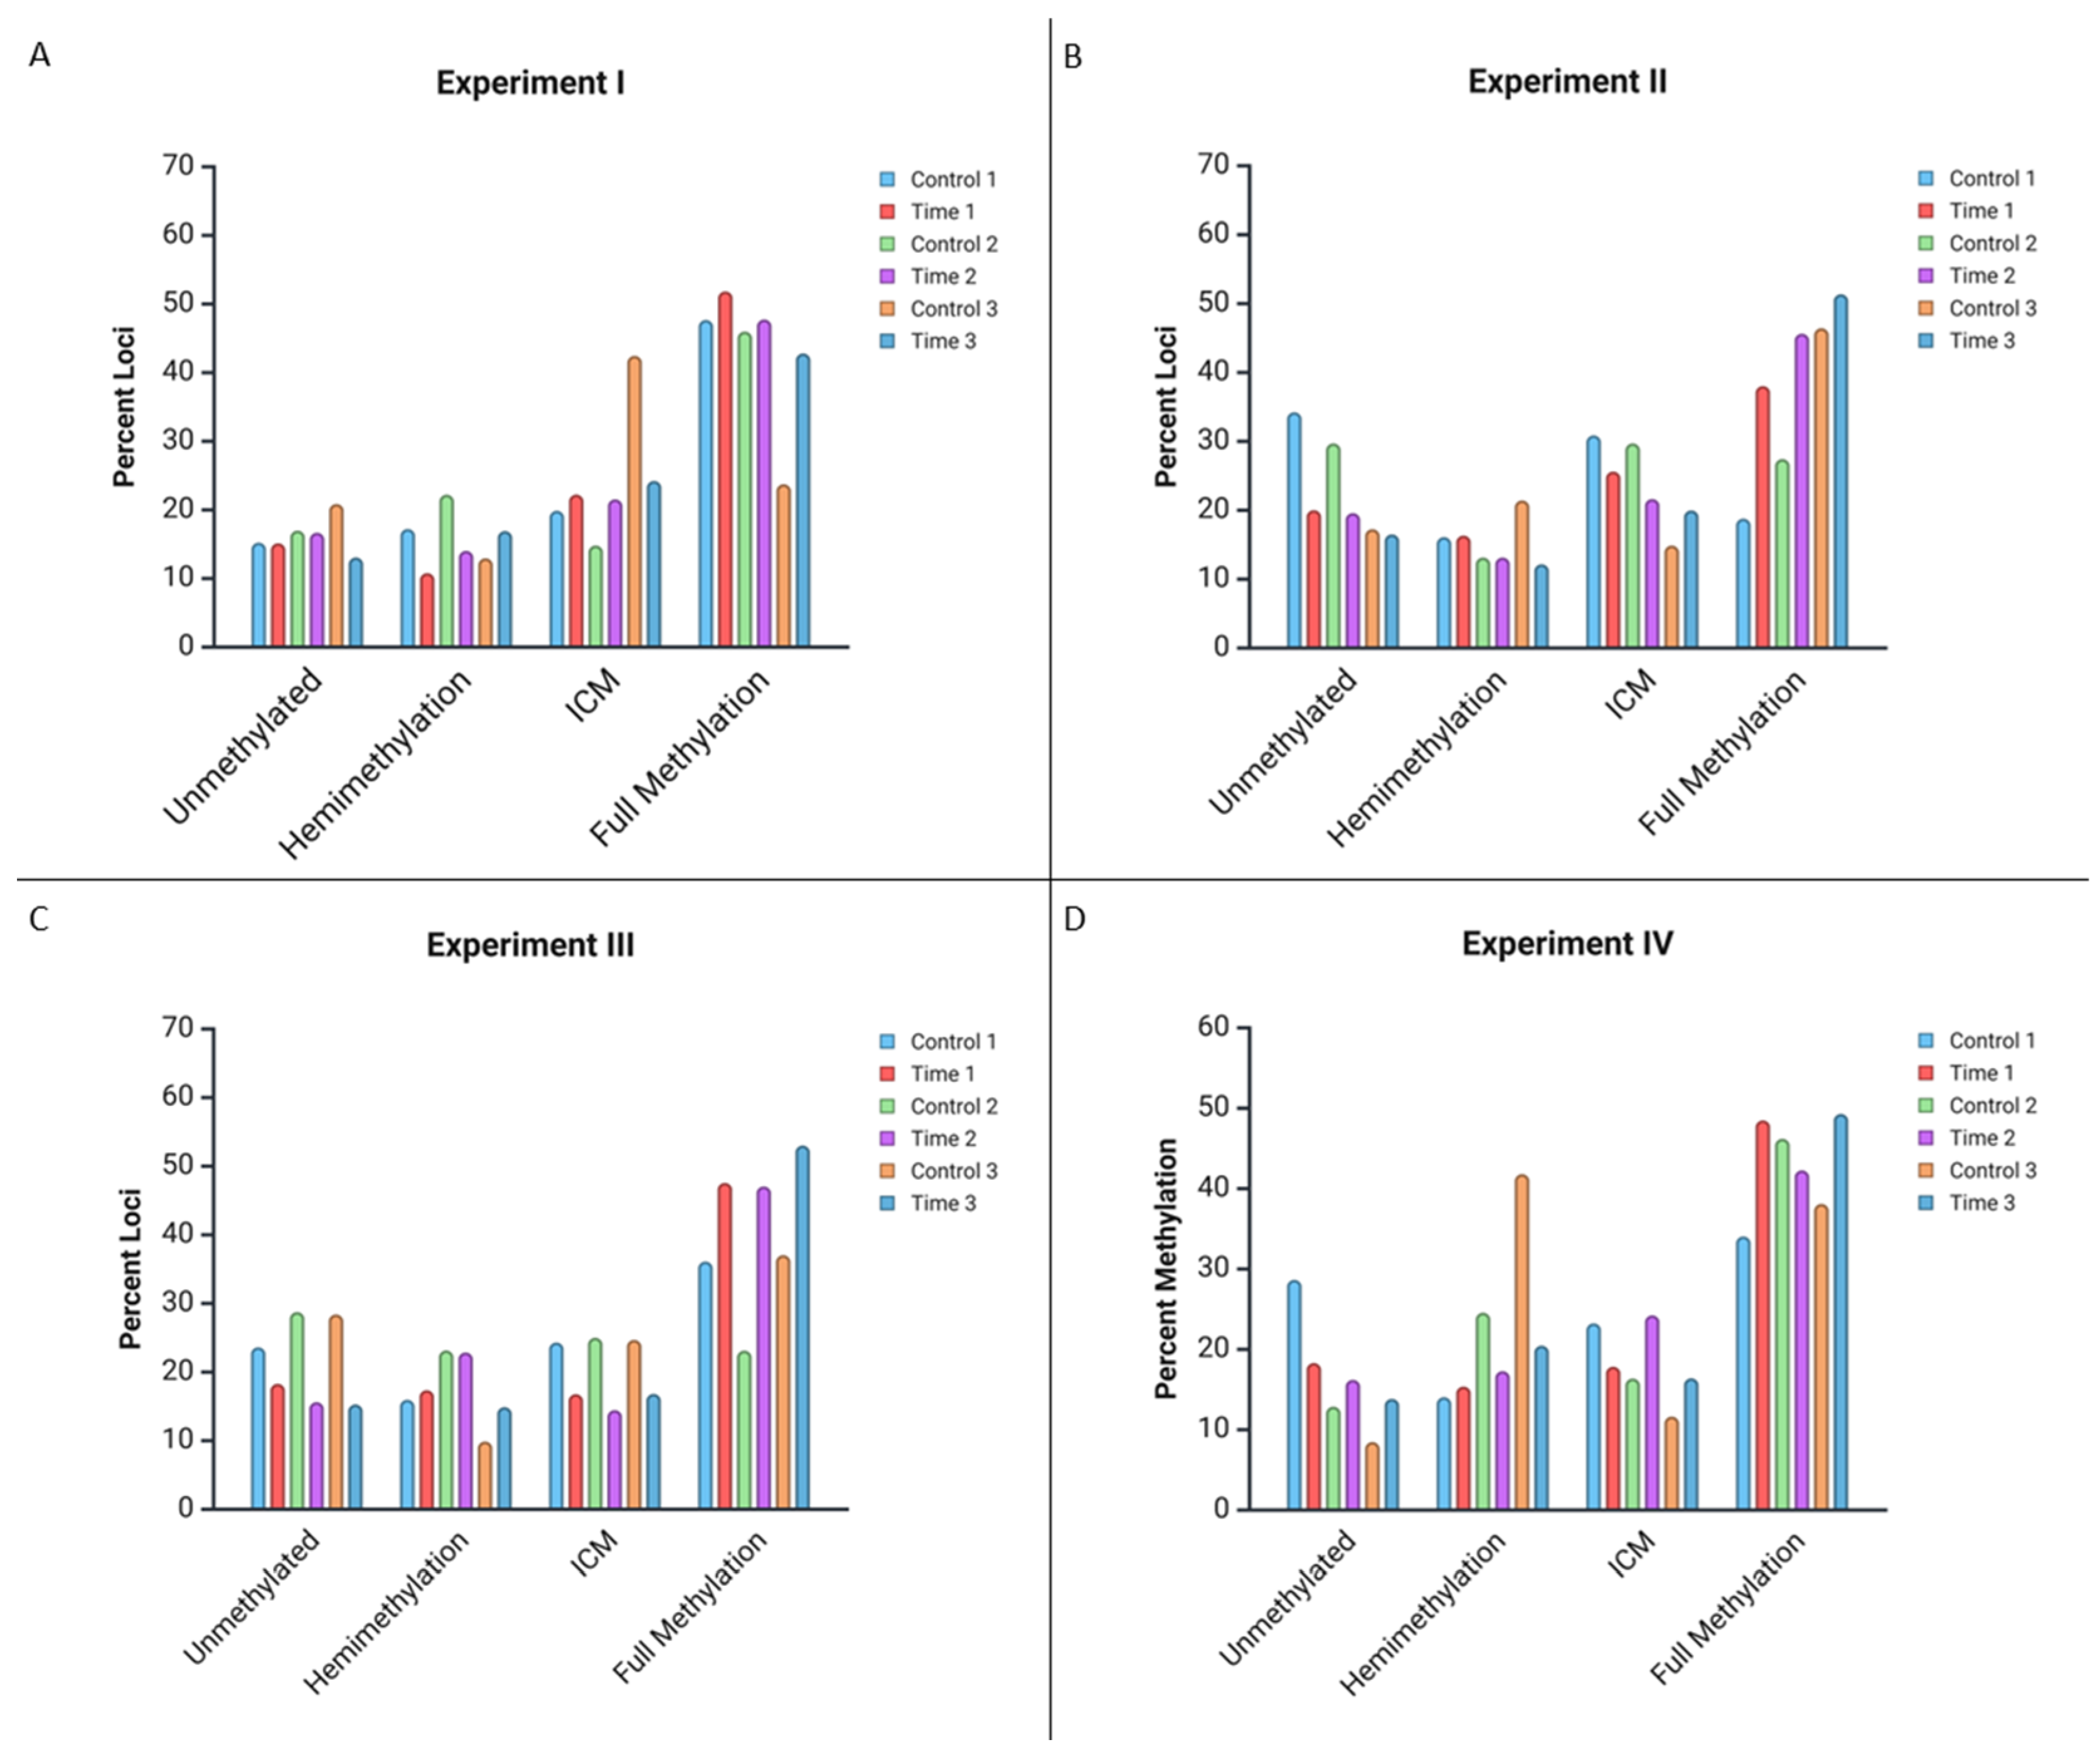
| Experiment Number | C1 | T1 | C2 | T2 | C3 | T3 | |
|---|---|---|---|---|---|---|---|
| I | No Methylation | 15.23% | 15.14% | 16.98% | 16.68% | 20.86% | 13.07% |
| Hemimethylation | 17.22% | 10.79% | 22.22% | 14.03% | 12.95% | 16.91% | |
| Internal Cytosine Methylation | 19.87% | 22.23% | 14.81% | 21.54% | 42.45% | 24.22% | |
| Full Methylation | 47.68% | 51.84% | 45.99% | 47.75% | 23.74% | 42.80% | |
| II | No Methylation | 34.23% | 20.02% | 29.71% | 19.59% | 17.26% | 16.50% |
| Hemimethylation | 16.11% | 16.33% | 13.14% | 13.14% | 21.43% | 12.16% | |
| Internal Cytosine Methylation | 30.87% | 25.62% | 29.71% | 21.63% | 14.88% | 19.98% | |
| Full Methylation | 18.79% | 38.03% | 27.43% | 45.63% | 46.43% | 51.36% | |
| III | No Methylation | 23.61% | 18.29% | 28.75% | 15.62% | 28.40% | 15.28% |
| Hemimethylation | 15.97% | 17.36% | 23.15% | 22.86% | 9.88% | 14.89% | |
| Internal Cytosine Methylation | 24.31% | 16.78% | 25.00% | 14.46% | 24.69% | 16.82% | |
| Full Methylation | 36.11% | 47.57% | 23.13% | 47.05% | 37.04% | 53.01% | |
| IV | No Methylation | 28.65% | 18.30% | 12.87% | 16.21% | 8.47% | 13.84% |
| Hemimethylation | 14.05% | 15.37% | 24.56% | 17.29% | 41.80% | 20.46% | |
| Internal Cytosine Methylation | 23.24% | 17.84% | 16.37% | 24.23% | 11.64% | 16.40% | |
| Full Methylation | 34.05% | 48.49% | 46.20% | 42.27% | 38.10% | 49.29% | |
| Experiment Number | Control | T1 | T2 | T3 | |
|---|---|---|---|---|---|
| I (Low Concentration) | Control | 0.6187 | 0.3717 | 0.0053 | |
| T1 | 1.783 | 0.8788 | 0.4922 | ||
| T2 | 3.132 | 0.676 | 0.7799 | ||
| T3 | 12.715 | 2.408 | 1.088 | ||
| II (Medium Concentration) | Control | 0.0133 | 0.0485 | 0.3118 | |
| T1 | 10.726 | 0.7109 | 0.3037 | ||
| T2 | 7.883 | 1.377 | 0.8717 | ||
| T3 | 3.570 | 3.635 | 0.706 | ||
| III (High Concentration) | Control | 0.2978 | 0.0019 | 0.0258 | |
| T1 | 3.683 | 0.768 | 0.8606 | ||
| T2 | 14.855 | 1.138 | 0.5281 | ||
| T3 | 9.278 | 0.753 | 2.220 | ||
| IV (Bioaccumulation) | Control | 0.1341 | 0.3417 | 0.0126 | |
| T1 | 5.577 | 0.6512 | 0.7034 | ||
| T2 | 3.343 | 1.636 | 0.4752 | ||
| T3 | 10.848 | 1.409 | 2.500 |
Disclaimer/Publisher’s Note: The statements, opinions and data contained in all publications are solely those of the individual author(s) and contributor(s) and not of MDPI and/or the editor(s). MDPI and/or the editor(s) disclaim responsibility for any injury to people or property resulting from any ideas, methods, instructions or products referred to in the content. |
© 2025 by the authors. Licensee MDPI, Basel, Switzerland. This article is an open access article distributed under the terms and conditions of the Creative Commons Attribution (CC BY) license (https://creativecommons.org/licenses/by/4.0/).
Share and Cite
Wilkinson, S.M.; Whitaker, J.M.; Janosik, A.M. Investigating the Epigenetic Effects of Polystyrene Nanoplastic Exposure in Bluegill (Lepomis macrochirus) Epithelial Cells Using Methylation-Sensitive AFLPs. Microplastics 2025, 4, 10. https://doi.org/10.3390/microplastics4010010
Wilkinson SM, Whitaker JM, Janosik AM. Investigating the Epigenetic Effects of Polystyrene Nanoplastic Exposure in Bluegill (Lepomis macrochirus) Epithelial Cells Using Methylation-Sensitive AFLPs. Microplastics. 2025; 4(1):10. https://doi.org/10.3390/microplastics4010010
Chicago/Turabian StyleWilkinson, Sheridan M., Justine M. Whitaker, and Alexis M. Janosik. 2025. "Investigating the Epigenetic Effects of Polystyrene Nanoplastic Exposure in Bluegill (Lepomis macrochirus) Epithelial Cells Using Methylation-Sensitive AFLPs" Microplastics 4, no. 1: 10. https://doi.org/10.3390/microplastics4010010
APA StyleWilkinson, S. M., Whitaker, J. M., & Janosik, A. M. (2025). Investigating the Epigenetic Effects of Polystyrene Nanoplastic Exposure in Bluegill (Lepomis macrochirus) Epithelial Cells Using Methylation-Sensitive AFLPs. Microplastics, 4(1), 10. https://doi.org/10.3390/microplastics4010010