Article

A Feasible and Efficient Monitoring Method of Synthetic Fibers Released during Textile Washing

by
Oskar Świątek
and
Agnieszka Dąbrowska
*
Laboratory of Spectroscopy and Intermolecular Interactions, Faculty of Chemistry, University of Warsaw, 02-093 Warsaw, Poland
*
Author to whom correspondence should be addressed.
Microplastics 2024, 3(1), 67-81; https://doi.org/10.3390/microplastics3010005
Submission received: 30 October 2023 / Revised: 29 December 2023 / Accepted: 24 January 2024 / Published: 30 January 2024
(This article belongs to the Collection Current Opinion in Microplastics)

Abstract

:
Microfibers (MFs) are one of the most common and hazardous forms of microplastic found in the aquatic environment. The methods of collecting and analyzing MFs released during washing have to be developed and standardized to understand and model the process of microfibers’ emission better. This study tests a new, innovative method to check if laundry fiber sampling can be approached comprehensively. Pieces of synthetic materials (aged and new polyester, polyester-cotton blend) were placed in chromium-nickel filters envelope-like folded. Then, textile weathering during washing was monitored by the quality and quantity of fibers found directly on the filter surface. Laundry parameters like temperature, detergent presence, and filter size were changed, and results were monitored by Fourier-transform infrared spectroscopy (FTIR), a well-known standard in microplastic identification. In addition, ATR spectra were collected to characterize the materials in detail and evaluate their aging level. Spectroscopy can be used to detect and examine both mechanical and chemical degradation, and the collected microfibers can be assigned to the material they come from. Finally, a quantitative comparison of fibers released during different washing conditions can be used for the process optimization to minimize its environmental impact.

1. Introduction

Microplastics (MPs) are particles of synthetic material smaller than 5 mm in length. Due to their size, they can be easily spread among different environments. MPs can be produced in small sizes (primary microplastic), e.g., resins and fibers, or transformed into smaller particles (secondary microplastic) due to UV exposure or mechanical treatment. Synthetic materials are found helpful in many branches of the industry thanks to their physical and chemical properties (intense, flexible, quickly produced, and modified). Among the most common ones can be listed: polyvinylchloride (PVC), polypropylene (PP), polyethylene (high and low density, respectively HDPE and LDPE), polystyrene (PS), polyurethane (PU) and polyethylene [1]. Synthetic materials can be modified by additives that change their structural and mechanical properties. The additives can be divided into plasticizers, dyes, burning retardants, and antioxidants. Their presence can influence the future possibility of mechanical or chemical recycling due to the increasing possibility of their impact on material degradation, meaning the possibility for the additive to (due to chemical recycling) transform into a compound that enhances processes of (photo)oxidation within the material leading to their internal decomposition [2]. Alongside positive aspects of synthetic materials, a vast amount of them is designated to be consumable and are disposed of quickly, which shortens their lifetime and effects in aggregation on landfills (circa 40% of plastic waste (PW)) and the environment (circa 32% of PW) [3,4]. According to data from plasticseurope.org (accessed on 16 March 2023) [5], the demand for plastic in 2020 for household, leisure, and sports end-use markets was 2,111,300 tons. In 2016, 20% of synthetic materials produced were synthetic textile fibers [6]. In the fashion industry, an unprecedented and hazardous trend can be noticed under the name of fast fashion, which means producing a vast number of new, synthetic, and affordable garments. As fast as the fashion changes, the production of new textiles accelerates. It intensifies the amount of thrown garments. For instance, an average American produces circa 82 pounds of textile waste annually [6]. Microfibers (MFs) are MPs obtained in the manufacturing, use, or degradation of synthetic textiles and are the most common type of MPs found in the environment. It is estimated that over 9 million tons of fibers were produced in 2016 [7], and in 2020, EU citizens bought around 6.6 million tons of clothing and footwear, which gives 14.8 kg per person [8].
More attention should be drawn to microfibers as they are unnoticed hazardous microparticles of synthetic materials. Researchers indicate that surface morphology, volume-to-surface ratio, adsorption properties, and presence of additives are crucial factors that make these microplastics especially threatening to marine life forms. MFs are found in aquatic environments (rivers [9], shorelines [10], oceans) and can have hazardous effects on marine biota when ingested—there are confirmed cases of ingested and egested MPs by marine organisms and microorganisms that affected their particular life functions. Research shows that microbeads (a spherical form of MP) with rough surfaces considerably influence marine biota. The developed surface makes a proper environment for bacterial cultures, which are more recognizable to microorganisms and thus willingly ingested, causing their stress levels to rise and making irreversible changes.
In comparison with microbeads, microfibers are considered even more hazardous [11]. They can cause the creation of tangled balls of fibers in the gut of the Norway lobster (Nephrops norvegicus) [12] or a reduction in photosynthesis in aquatic flora. Eventually, through a diet rich in shellfish, MPs can enter the human body, which confirms the discovery of plastic particles in human blood [13]. Microfibers from textile materials comprise a specific set of polymers and chemical compounds (additives).
Consequently, possible effects on the marine biota can be far more damaging [14]. Nevertheless, the undesirable effects of MFs are understudied [11]. For instance, relatively little is known about the POPs (persistent organic pollutants) sorption on their surface. Also, microfibers are considered the dominant form of microplastic on beaches and in the oceans. In the post-pandemic times, more microfibers entered the aquatic environment via disposable masks [15]. Thus, the number of works tackling the methodology of textile fiber removal from water increases [14]. Simultaneously, technologies to filter and remove fibers from sludge are developed. For instance, under laboratory conditions, an experiment by Vasiljevic et al. [16] was conducted on removing microfibers with FeCl3 and polyaluminum chloride (PACl). Using FeCl3 showed up to 99% effectiveness in removing MFs from a water mixture of cotton and synthetic polymers. PACl was more effective in removing MFs from the water surface, representing 74% of effectiveness.
The main source of microfibers that later enter the water-circulating system is related to washing machines’ wastewater [17]. Many studies were conducted to explore the factors that enhance MFs emission—washing condition (water volume [17], presence of detergent, temperature [18], washing load [19]), age of garments [17], textiles parameters (finishing, hairiness, yarn twist, composition) [20,21], type of washing machine (top- or front load) [16]. The main conclusions are that aged materials, increased water volume, and high temperature increase the release of microfibers, while the greater mass of the washing load and more compact structure of the fibers decrease the emission. MFs from aged materials have greater mass and are more often recoverable than MFs from new textiles. Moreover, the greater the filter size, the broader the range of recovered microfibers [16]. According to the literature, the most common method used in the experiments to obtain the samples was the filtration of after-wash water.
The analytical techniques used commonly in the research considering microplastics can be divided into techniques to examine the morphology of the surface, size, and form and the techniques that identify analyzed synthetic material. In the first group, optical and electron microscopy can be placed. The latter group comprises spectroscopic techniques, e.g., FTIR, Raman spectroscopy, and X-ray fluorescence [22]. FTIR and Raman spectroscopy are two main techniques for identifying aquatic microplastic samples [23,24]. Both spectroscopic methods are interchangeable as they carry comparable spectral information, leading to more correct synthetic material identification [25]. What is essential is the right choice choosing the technique to the length of the particle, as FTIR spectroscopy showed better results for particles bigger than 50 µm, while Raman spectroscopy is more suitable for particles within the range of 1–50 µm [24,25].
The fate of microplastic fibers is determined and considered hazardous. There are methods of preventing MF emissions. Mechanical finishing such as brushing, shearing, raising, and napping are considered semi-durable methods—the effect obtained vanishes after a few washing cycles [26]. Chemical finishing is more labor-intensive and material-consuming but can provide better effects. On the contrary witch, mechanical finishing is more flexible and innovative due to the possibility of experimenting with new substances and techniques; for instance, finishing with polylactic acid (biodegradable polymer) on PA fabric caused a 63.4% reduction in fiber emissions [27], finishing with pectin (enzymatic treatment) resulted in 90% decrease of MFs release on PA fabric [28]. Besides the ways of finishing synthetic textiles and washing conditions, more factors influencing MF emission can be listed and divided into dependent and independent: drying conditions, material structure (e.g., twist of yarns) [26], and previously mentioned textile finishing and washing conditions are dependent factors—they can be influenced and changed. In the independent group, sunlight exposure, sweating, CO2, and NO exposure [26] can be placed, as they cannot be changed, or the introduced modification would strictly interfere with the primary purpose of the treated textile material.
As crucial as finishing methods are to decrease MF emissions, the washing conditions and the type of material structure are also significant. Powder detergents cause higher MF emissions than liquid detergents due to the increased friction between the materials [29]. The chemical composition of used detergent is also essential, e.g., alkali-based detergents can hydrolyze fiber structure [26], therefore causing higher emissions. The increased temperature also contributes to greater MF release [26]. The type of material structure (knitted or woven), yarn (type, composition), and the exploitation rate are also crucial as they directly influence MF release. With these parameters combined, the complexity and importance of further microfiber emission study are underlined.
To address the main pending issues related to MFs, a new methodology for collecting samples was introduced in this study and coupled with spectral identification and characterization. The proposed solution for direct monitoring is to put fragments of examined textiles into chromium-nickel filters with different pore sizes. The aim is to catch the fibers earlier and limit the possible loss of MFs. Also, the temperature, the presence of the detergent, and the filter size were examined as their potential influence on the estimations of MFs’ emission. Furthermore, in this study, ATR-FTIR and FTIR spectroscopy were used as standard spectral techniques for analyzing microplastics. For practical reasons, the mapping mode was recommended in the case of FTIR.

2. Materials and Methods

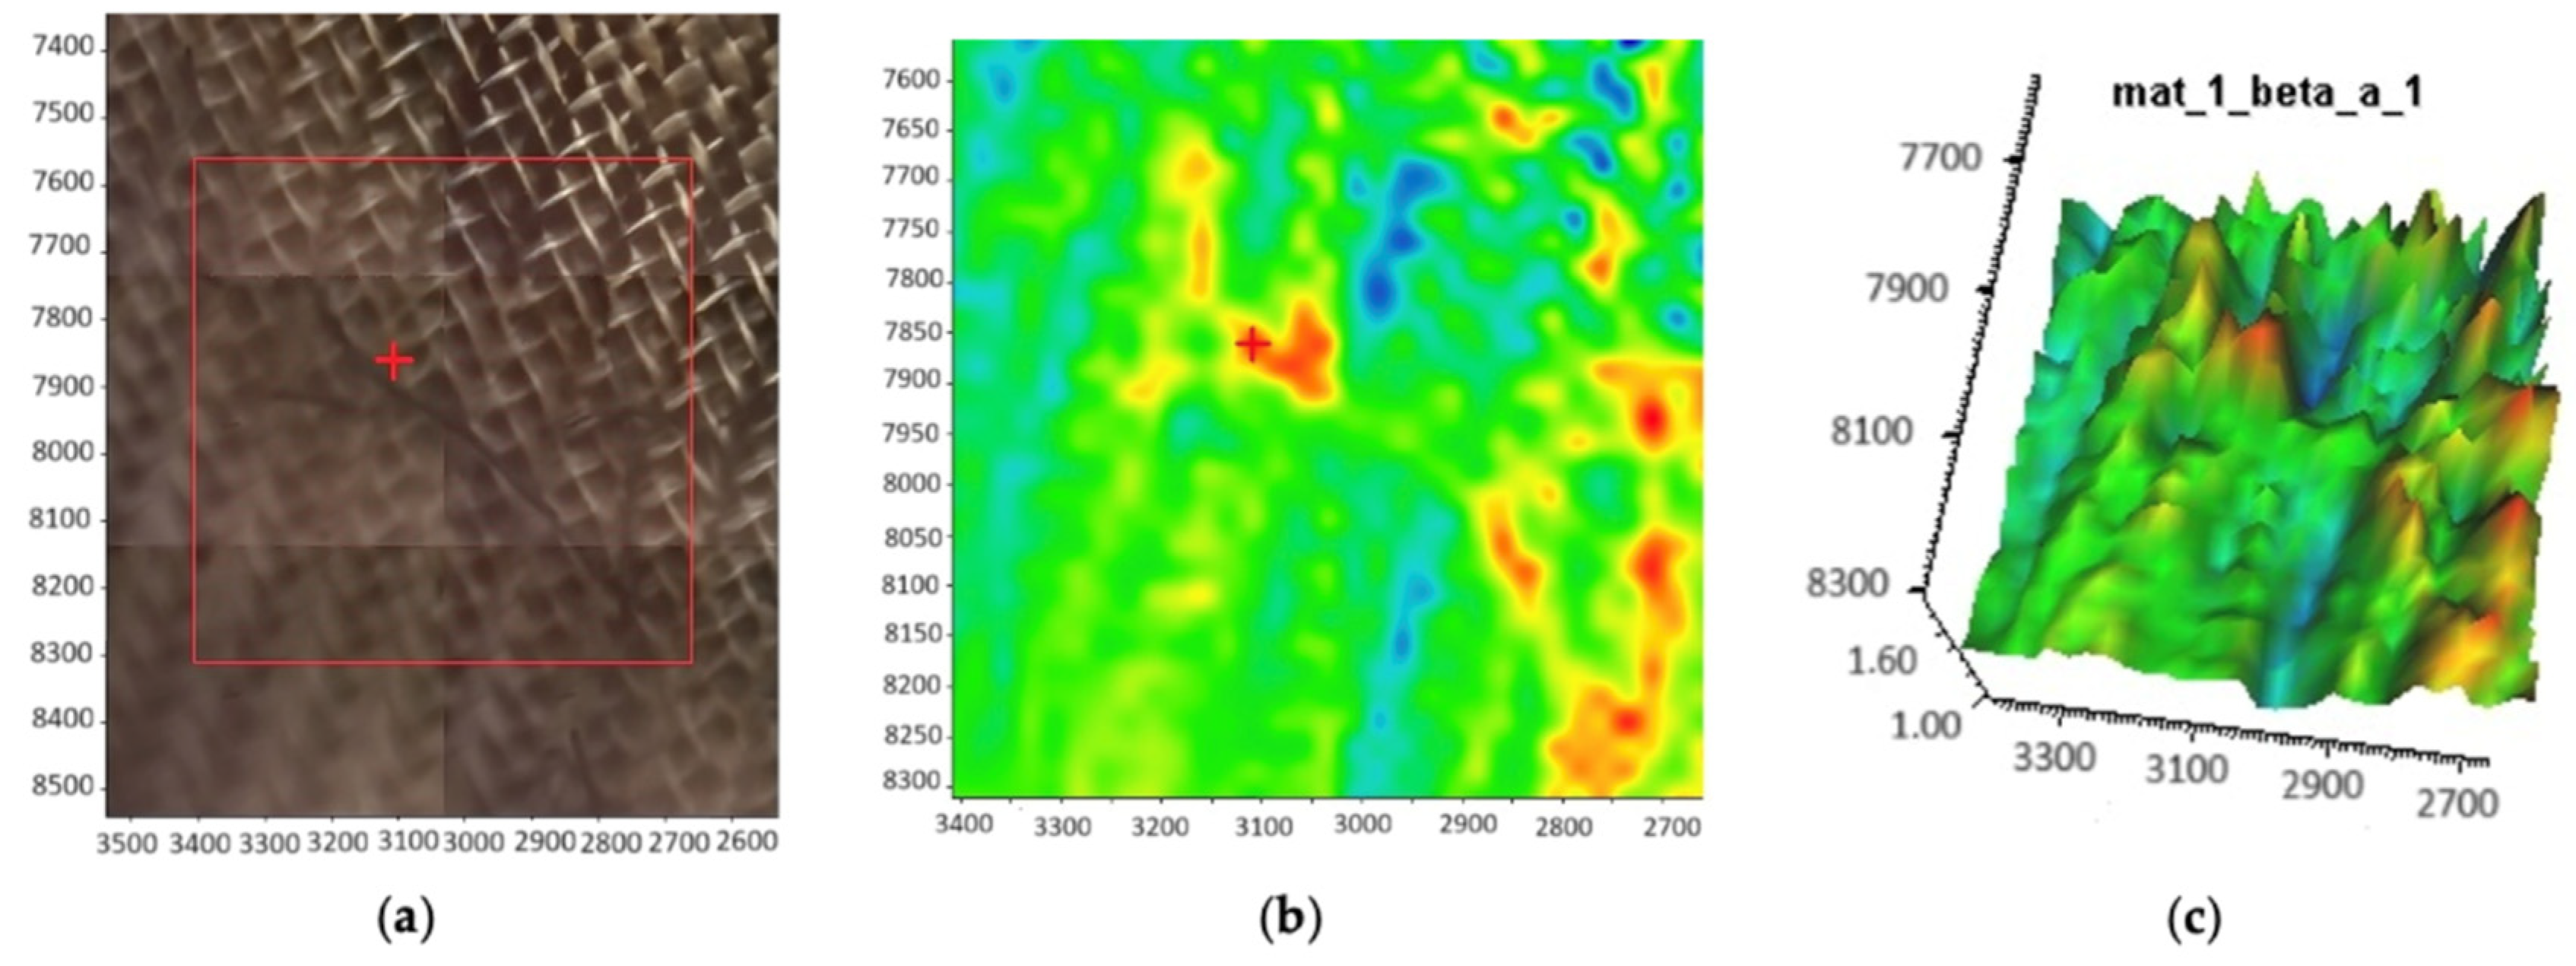
2.1. Monitoring and Fiber Collecting

Chromium-nickel woven filters with different pore sizes (25, 100, 300, 500 µm) were used to collect samples, which were inserted into filters in the form of material pieces that were 2 cm × 3 cm (Supplementary Material S1, Figure S1). The samples were taken from 4 types of garments—new polyester knitted leggings, polyester knitted sweaters, polyester cotton woven shirts, and new cotton woven bags. Producers indicated that the materials are 100% polyester (leggings and fleece), 65% polyester, 35% cotton (shirt), and 100% cotton (bag). The washing machine used in the experiment was Indesit ITW A 51.052 W (EU). The samples were divided into 3 groups in which different parameters of mechanical wash were measured. Every experiment was repeated 3 times simultaneously—as Max R. Kelly et al. [17] stated, most of the microfibers are released during the first wash. Thus, to increase the experiment’s efficiency, samples were treated simultaneously, which means that group a1 was conducted in 3 copies in 4 different types of filters, so were samples from group b1, c1, and d1, which gives 12 samples in one wash.
Additionally, another set of samples was created, which were added to the samples from cotton bag polycarbonate filters. This experiment was conducted only once in every type of wash (without repetition), which gives n = 192 for all samples. The parameters of each wash are as follows in Table 1.
The chosen wash program was dedicated to synthetic materials like polyester or nylon, and it was available in two options: with the temperature of the wash at 40 °C and 60 °C. The prepared samples were put into the laundry machine in the manner as it was stated. The proposed method changes the scale of samples from full-size garments into small, representative pieces enclosed in an envelope-shaped filter. Within each treatment, examined samples were under the same conditions as full-sized garment parts would be. It means that one chosen material can be examined under various conditions, which allows the analysis of parameters such as emission and length of obtained MFs. Accordingly, the structure of each examined material must be breached, and additional action that would protect the edges from further shredding was not applied because it would be physically challenging to execute. Potential microfibers were only collected and analyzed from the inside of prepared envelope-shaped filters. Thus, washing wastewater was not collected for further analysis. As the proposed method is considered innovative, there is a risk of over- or underestimation of released microfibers.
The nomenclature used in Table 2 indicates the treatment type (alpha, beta, gamma for plain, temperature, and detergent, respectively), the filter size (A, B, C, D for 25 µm, 100 µm, 300 µm and 500 µm respectively) and the number assigned to the examined material (new polyester/1, aged polyester/2, blend/3, cotton/4). The detergent used in the conducted experiments was material softener Silan (Henkel, Düsseldorf, Germany) in the volume of 50 mL.
The graph representing the number of particles and measured length was created for each group of samples that contained more than 8 microfibers. Based on the collected data, on each graph (Figure 1), the mean value and the standard deviation were presented. Statistical parameters were calculated using the Origin 2019 (Academic) 64-bit software.

2.2. Monitoring and Fiber Collecting

After every wash examined, samples were left to dry at room temperature and were spectrally measured directly on the filters. FTIR spectroscope with the microscope was used to identify the samples pre- and after-wash to confirm the presence of eventual foreign materials. Also, the 2D mapping of after-wash samples was performed to quantify MP release. The FTIR Thermo Scientific Nicolet iN10 MX spectrometer (Waltham, MA, USA) was used to collect spectral data. The measuring was conducted with reflectance mode. The detector was cooled by liquid nitrogen. Table 3 presents the diagnostically important band assignment for polyester materials.
In addition, ATR spectroscopy (Nicolet iS50, diamond crystal) provided additional information directly from the surface of selected fibres.

3. Results and Discussion

Before washing, materials were examined macroscopically, and the reference spectral signals were collected. The surface of textiles differs according to the kind of sample—the new polyester material was plain, without any visible defects. The used fleece showed elements of developed surfaces such as pilled areas. The aged shirt, composed of two polyester and cotton, showed tiny balls on the top of the surface. The new cotton bag did not show any microscopically visible surface defects. This pre-examination was conducted to foresee the possible outcome of the wash experiment—the more developed the surface, the more MFs are usually collected in this kind of experiment [11].
Through all the groups of samples, the most prominent results appeared on the smallest filters (according to the used nomenclature filters A and B) of every examined textile except for samples taken from 100% cotton bags. The holes in other filters were permeable for the MFs, and the obtained results were not quantified. The comparable results were reported while collecting microplastic particles from the water surface where smaller mesh sizes (5–50 µm) gave higher concentrations of found particles [14]. That is why the samples obtained from experimenting on filters C and D were not further analyzed. It is particularly important, as the larger filters were already used in numerous research studies on textile fibers in sludge and wastewater treatment plants, which may underestimate the total number of microplastic particles. Our recommendation is always to consider the lowest possible fraction of MFs.

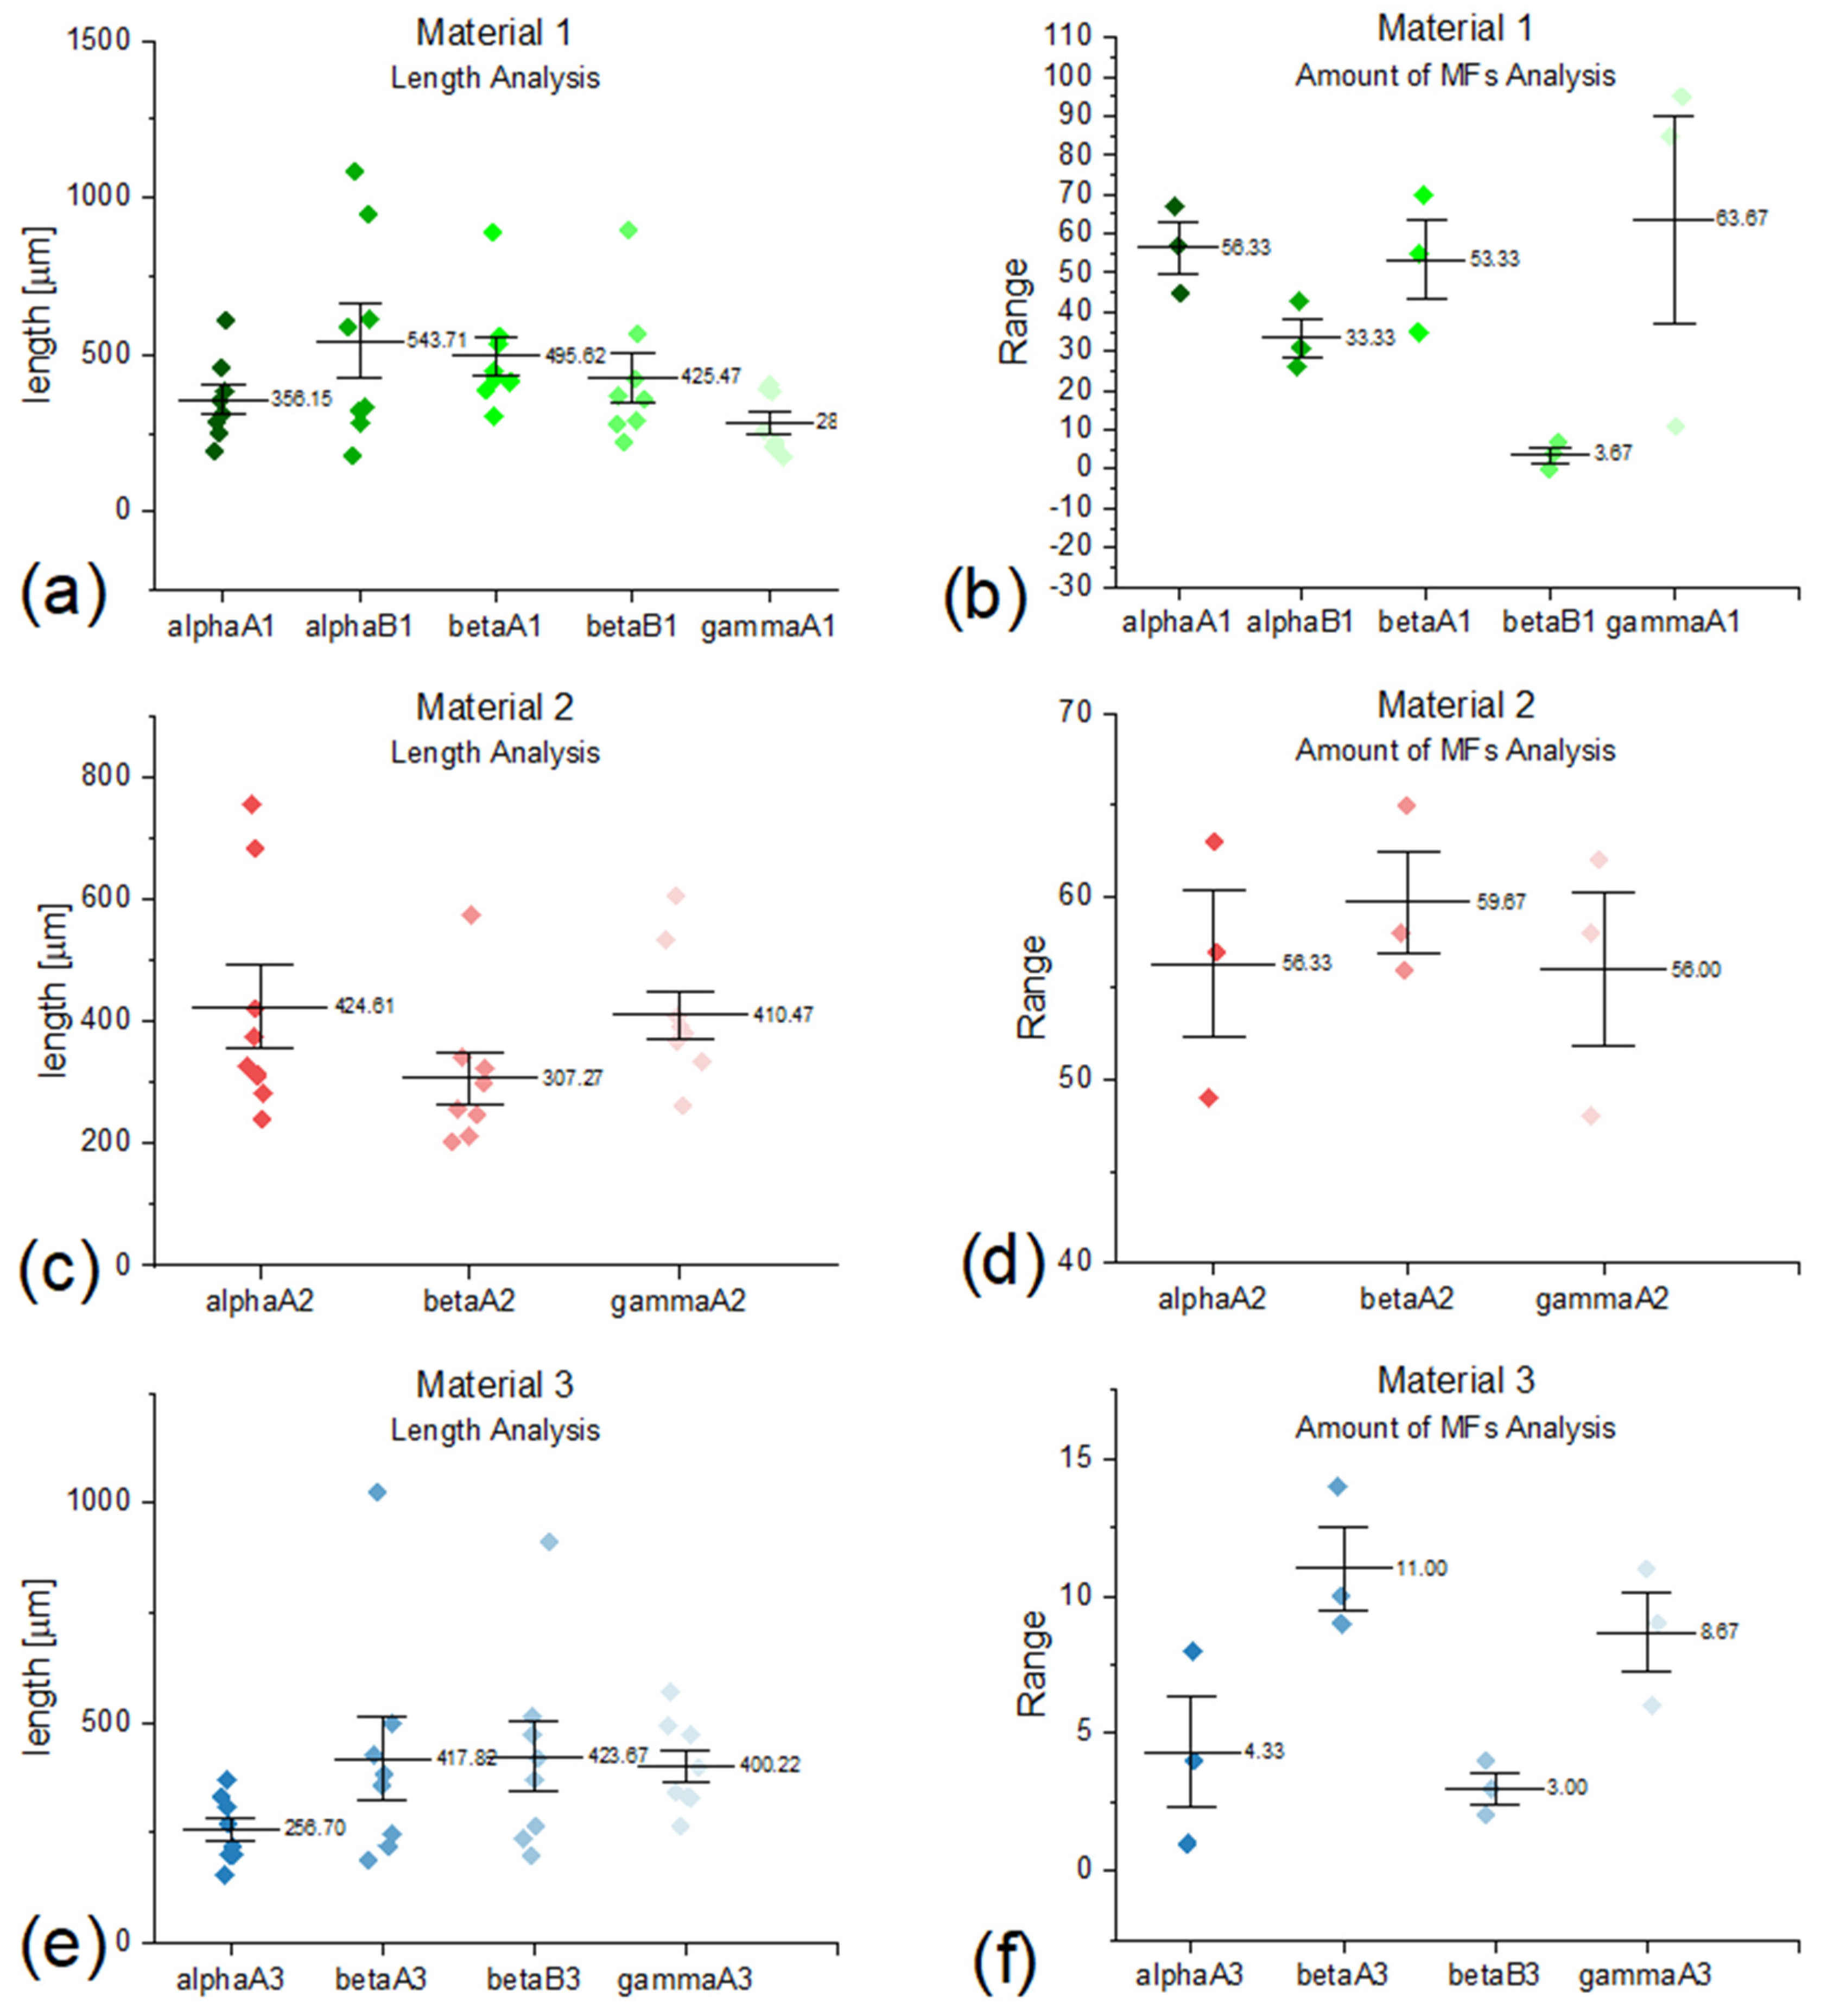
3.1. Amount of Found Particles

As was stated before, only filters with tiny pores showed the most prominent results. It can be observed in the results presented in Figure 1a,e when the number of found particles on smaller filters is greater than on bigger ones. In Figure 1a,c, the number of captured MFs is on the same level. Table 4 presents the release of microfibers per square meter (considering the area of the used piece of analyzed material). The idea was to calculate how many microplastic particles would be released if the considered area was extrapolated into meters squared (instead of centimeters squared), which is a far more suitable unit for the textile industry. As Napper et al. [18] stated, the release of MFs from a polyester-cotton blend is smaller than from pure polyester materials, which is acceptable for the conducted experiment.
The examined emission is around six times smaller than from polyester fabrics. Aged fleece did not show much difference in the amount of released MFs. Focusing on examined wash conditions, raising temperature caused slightly higher emission of MFs in aged polyester fleece and blended shirts. The results of adding detergents were hard to compare, as the results were not conclusive. Furthermore, the difference in released microfibers between 100% polyester materials and the polyester cotton blend can be explained by considering the material specification. It is known that knitted materials tend to release more MFs than woven ones due to twisted yarns within their structure [21]. As it was presented in Figure 1, woven material 3 released fewer microfibers than knitted material 2. Another reason is that material 3 was a polyester cotton blend. The quantity of released MFs from aged polyester was not as expected—mechanical degradation of the synthetic material should cause a more significant amount of found microplastics than new ones, as Weis and DeFalco [11] stated. Our research confirmed the observed tendency for the knitted materials to release more MFs than the woven ones. One should focus more on this issue during the ongoing discussion about the feasibility of using recycled materials in textiles [22]. Our data are comparable with the general recommendations collected in [26] for reducing fibre release during washing. Those are the following: lowering the temperature, spin speed, and concentration of detergents, shortening the time, and avoiding enhanced drying.

3.2. Length of Found Particles

The most common form of MFs found on the filters after washing was the randomly dispersed single fiber, but clusters were also common. Mainly in the samples from polyester-cotton shirts and cotton bags, the origin of the fibers on the filters was the mechanical degradation of the material (shredding)—the particles were too big to classify them as microplastics or microfibers. As can be observed in Figure 1b,f within the same type of wash (beta), the length of obtained MFs is similar, regardless of the filter size. However, in material 1 (Figure 1b), the same conditions of the conducted experiment caused the elongation of recovered MFs. The most remarkable diversity in released microfibers can be observed in the case of material 1, where it varies from 280 to 544 µm, while the difference between the highest and lowest mean value of obtained length in material 2 is 117.341 µm. It is hard to state the effect of detergent as the data are inconsistent, and no statistically significant conclusion can be formulated. However, one may point out a plausible explanation for the increased inhomogeneity due to aging.

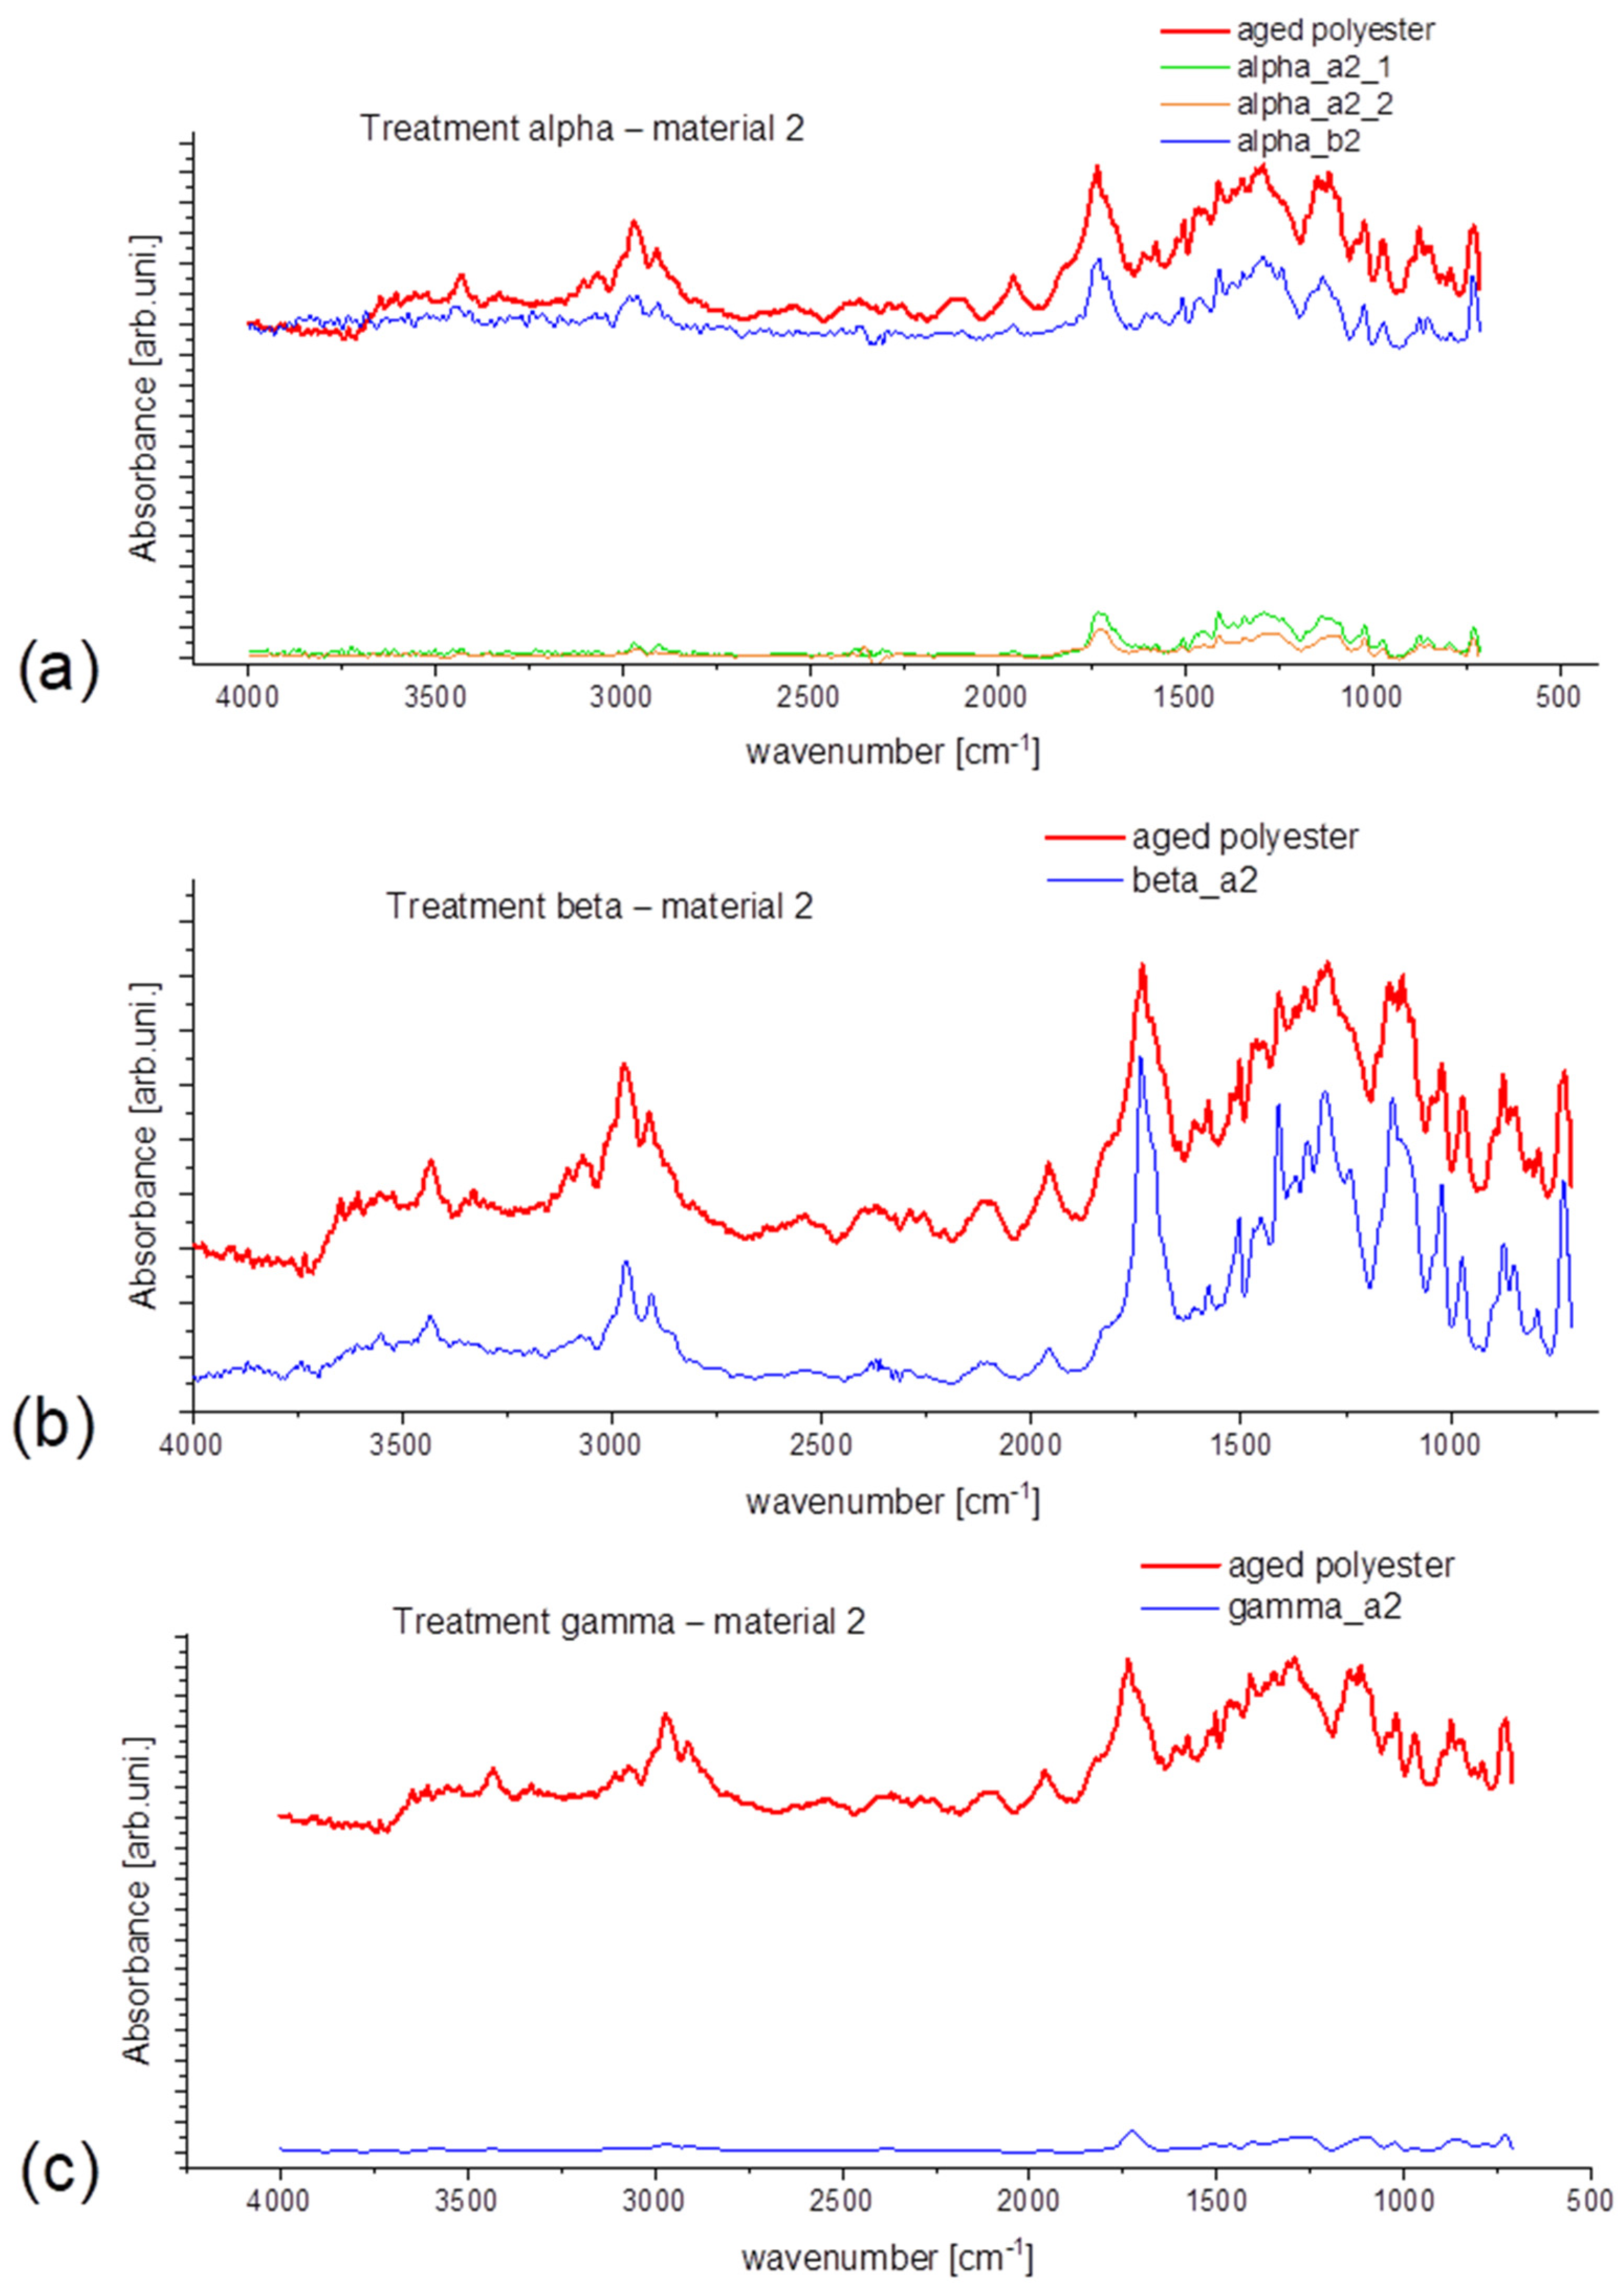
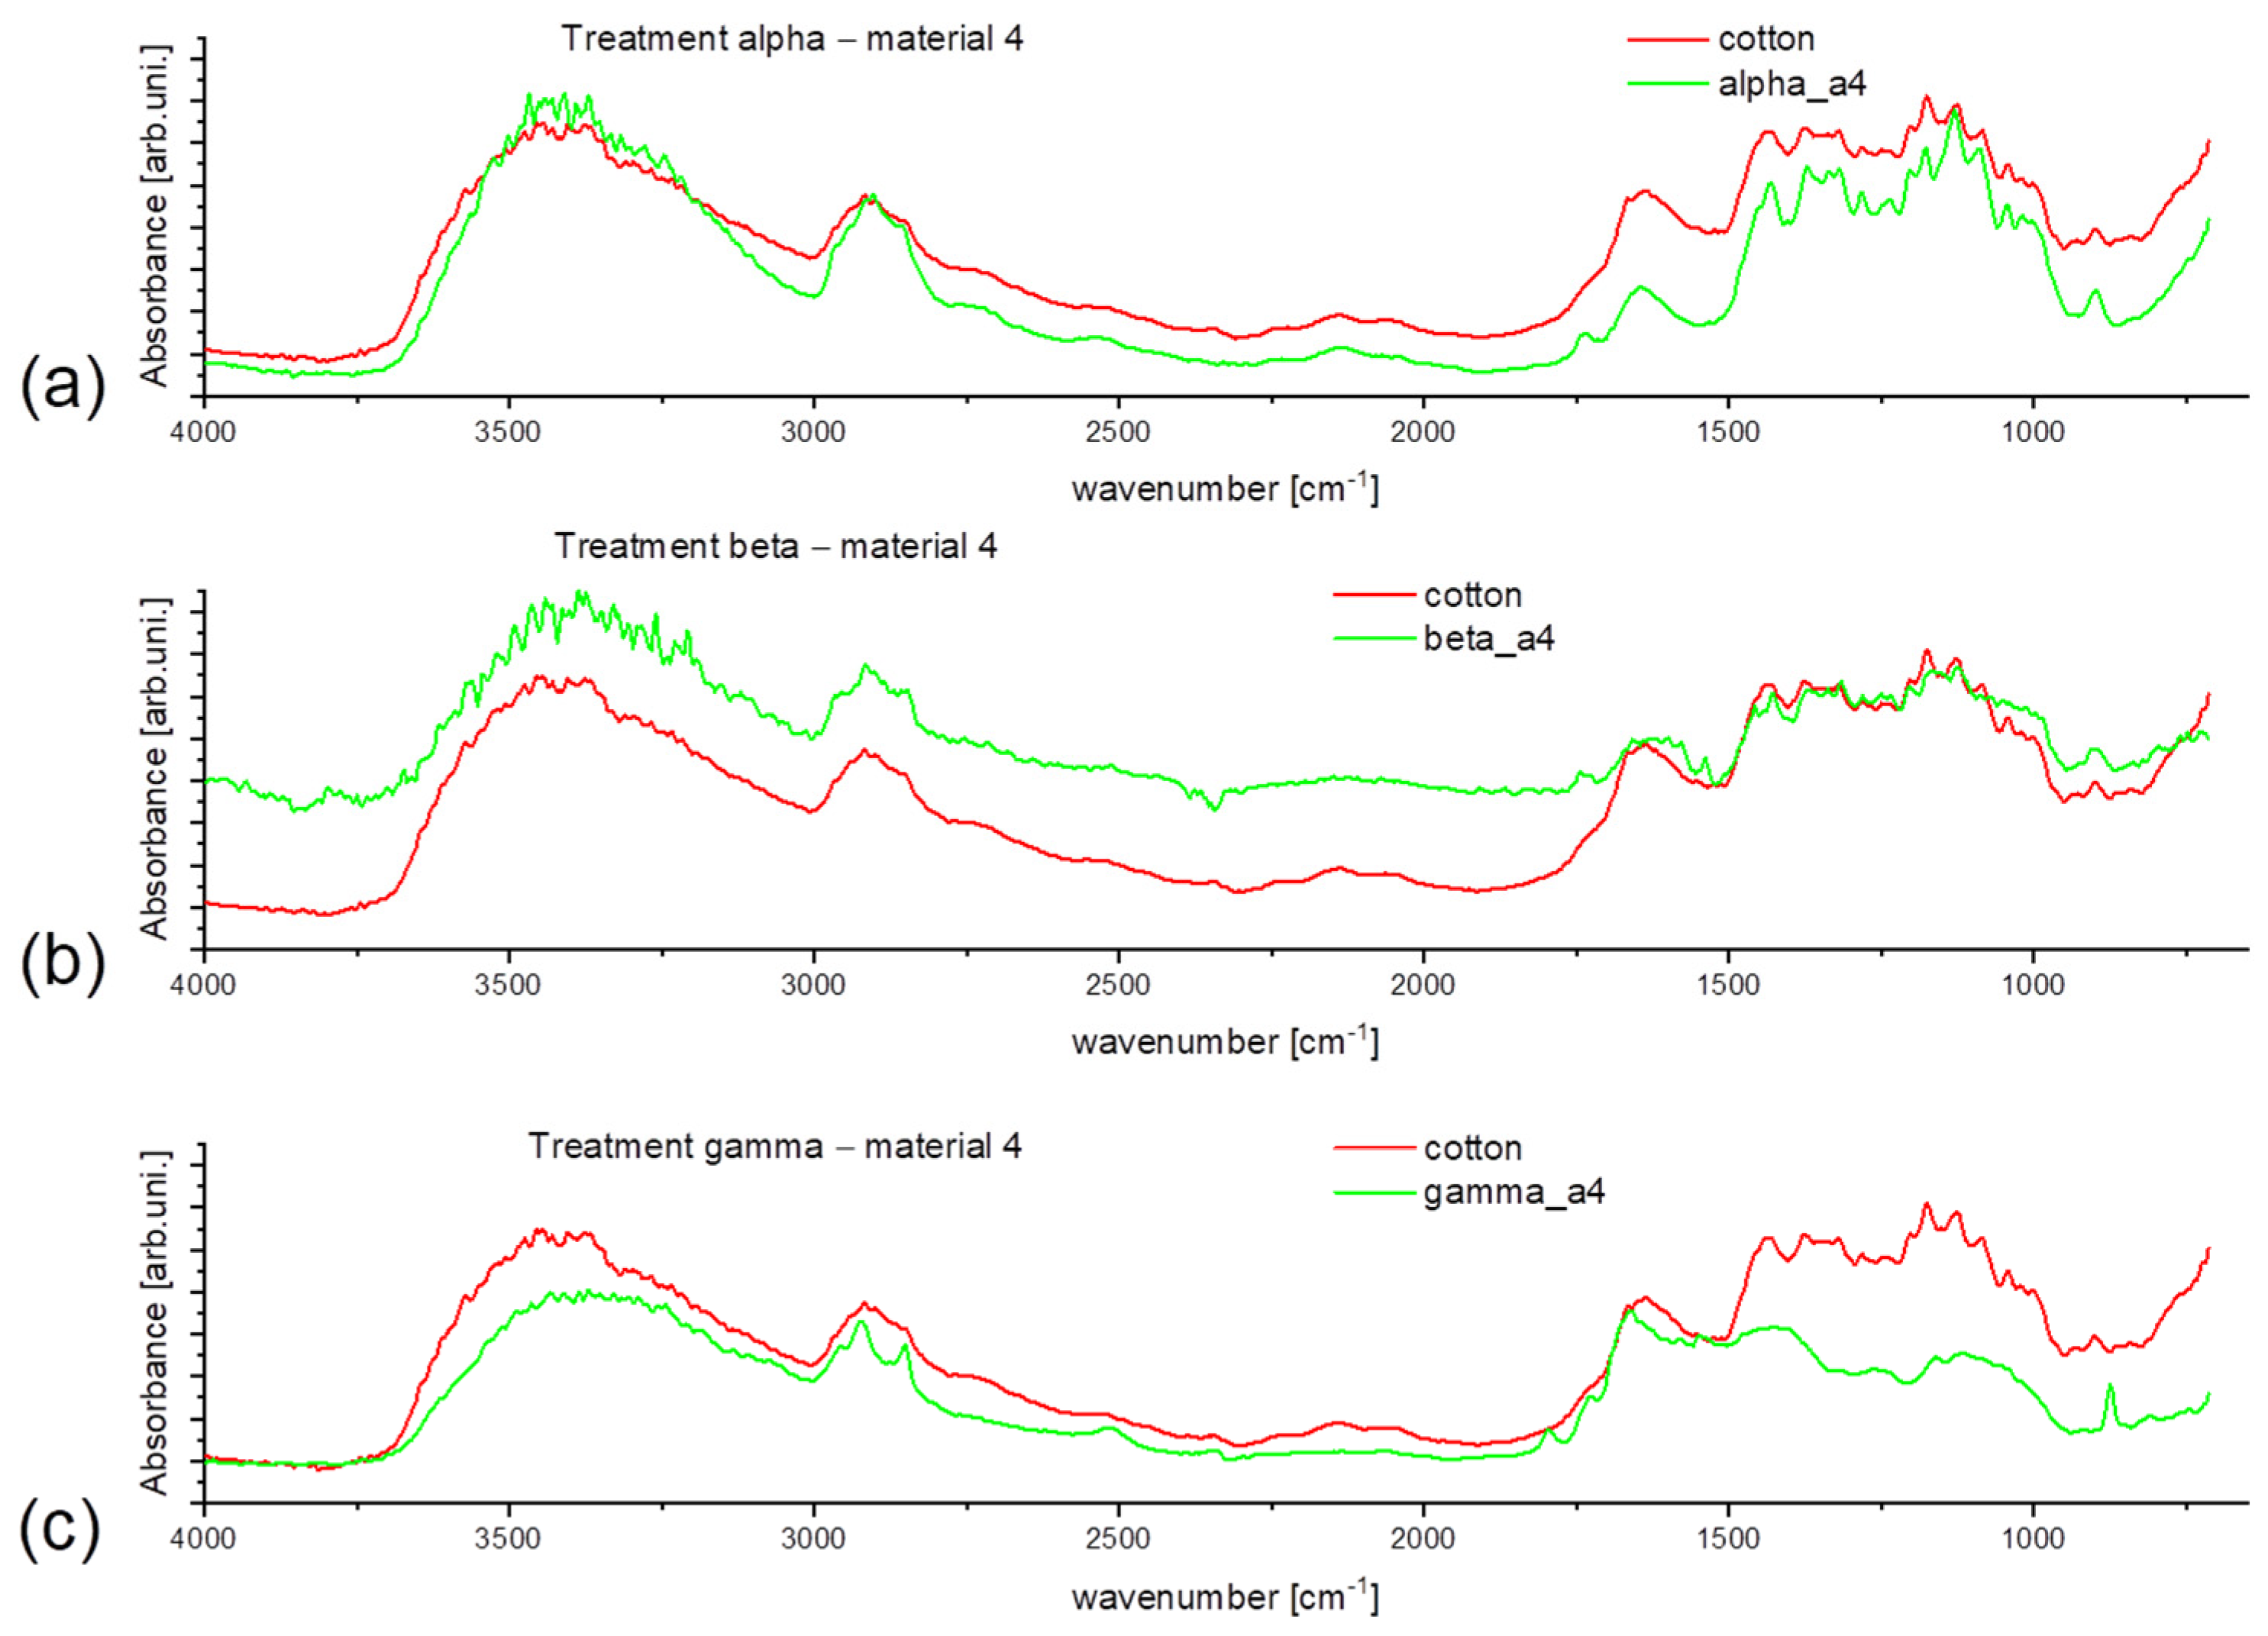
3.3. Spectral Analysis

From 192 of the total made samples, 17 were taken into further consideration if it comes to spectral analysis—it is correlated with what was possible to find on the obtained samples and which one gave the best spectral result (precise spectra with visible analytical vibration bands). For each sample, the spectra from the original material (which was not subjected to any treatment) were measured for reference if any change in sample spectra appeared. All the bands found in the spectra were assigned based on Table 3—the assignment is presented in Supplementary Materials (Table S1). The spectral data were compared within the examined material and selected treatment. The nomenclature used on presented spectra is as follows: [name of the treatment]_[filter size][material number]_[additional section to distinguish samples].
In addition to the point spectra analysis, the 2D and 3D maps collected from the most representative samples were presented. Here is an exemplary one (Figure 2. The rest can be found in Supplementary Materials (Figures S2–S6). The scale of color represented on the 2D and 3D maps stands for the intensity selected on the spectra band that is diagnostically important for each polymer. FTIR mapping can be used efficiently in microplastic data collection and visualization. It is essential for fast scanning of the filter’s total surface. Mapping provides an overview of the whole specimen at once, not just of a few subjectively selected debris. It may be helpful to see the spatial pattern in MF distribution or agglomeration tendencies. Moreover, 3D reconstruction can better visualize the MFs’ morphology and their complex interface structure.
ATR spectra were collected to provide more information on the fibers’ surface. Only the most prominent (meaning giving the largest numbers of emitted MFs) samples were considered and spectroscopically analyzed. The presented data shows the reference spectra and spectra taken from 2 different samples from one treatment. In Section 3.3.1, a set of obtained spectra was presented. The rest is available in Supplementary Materials (Figure S7).

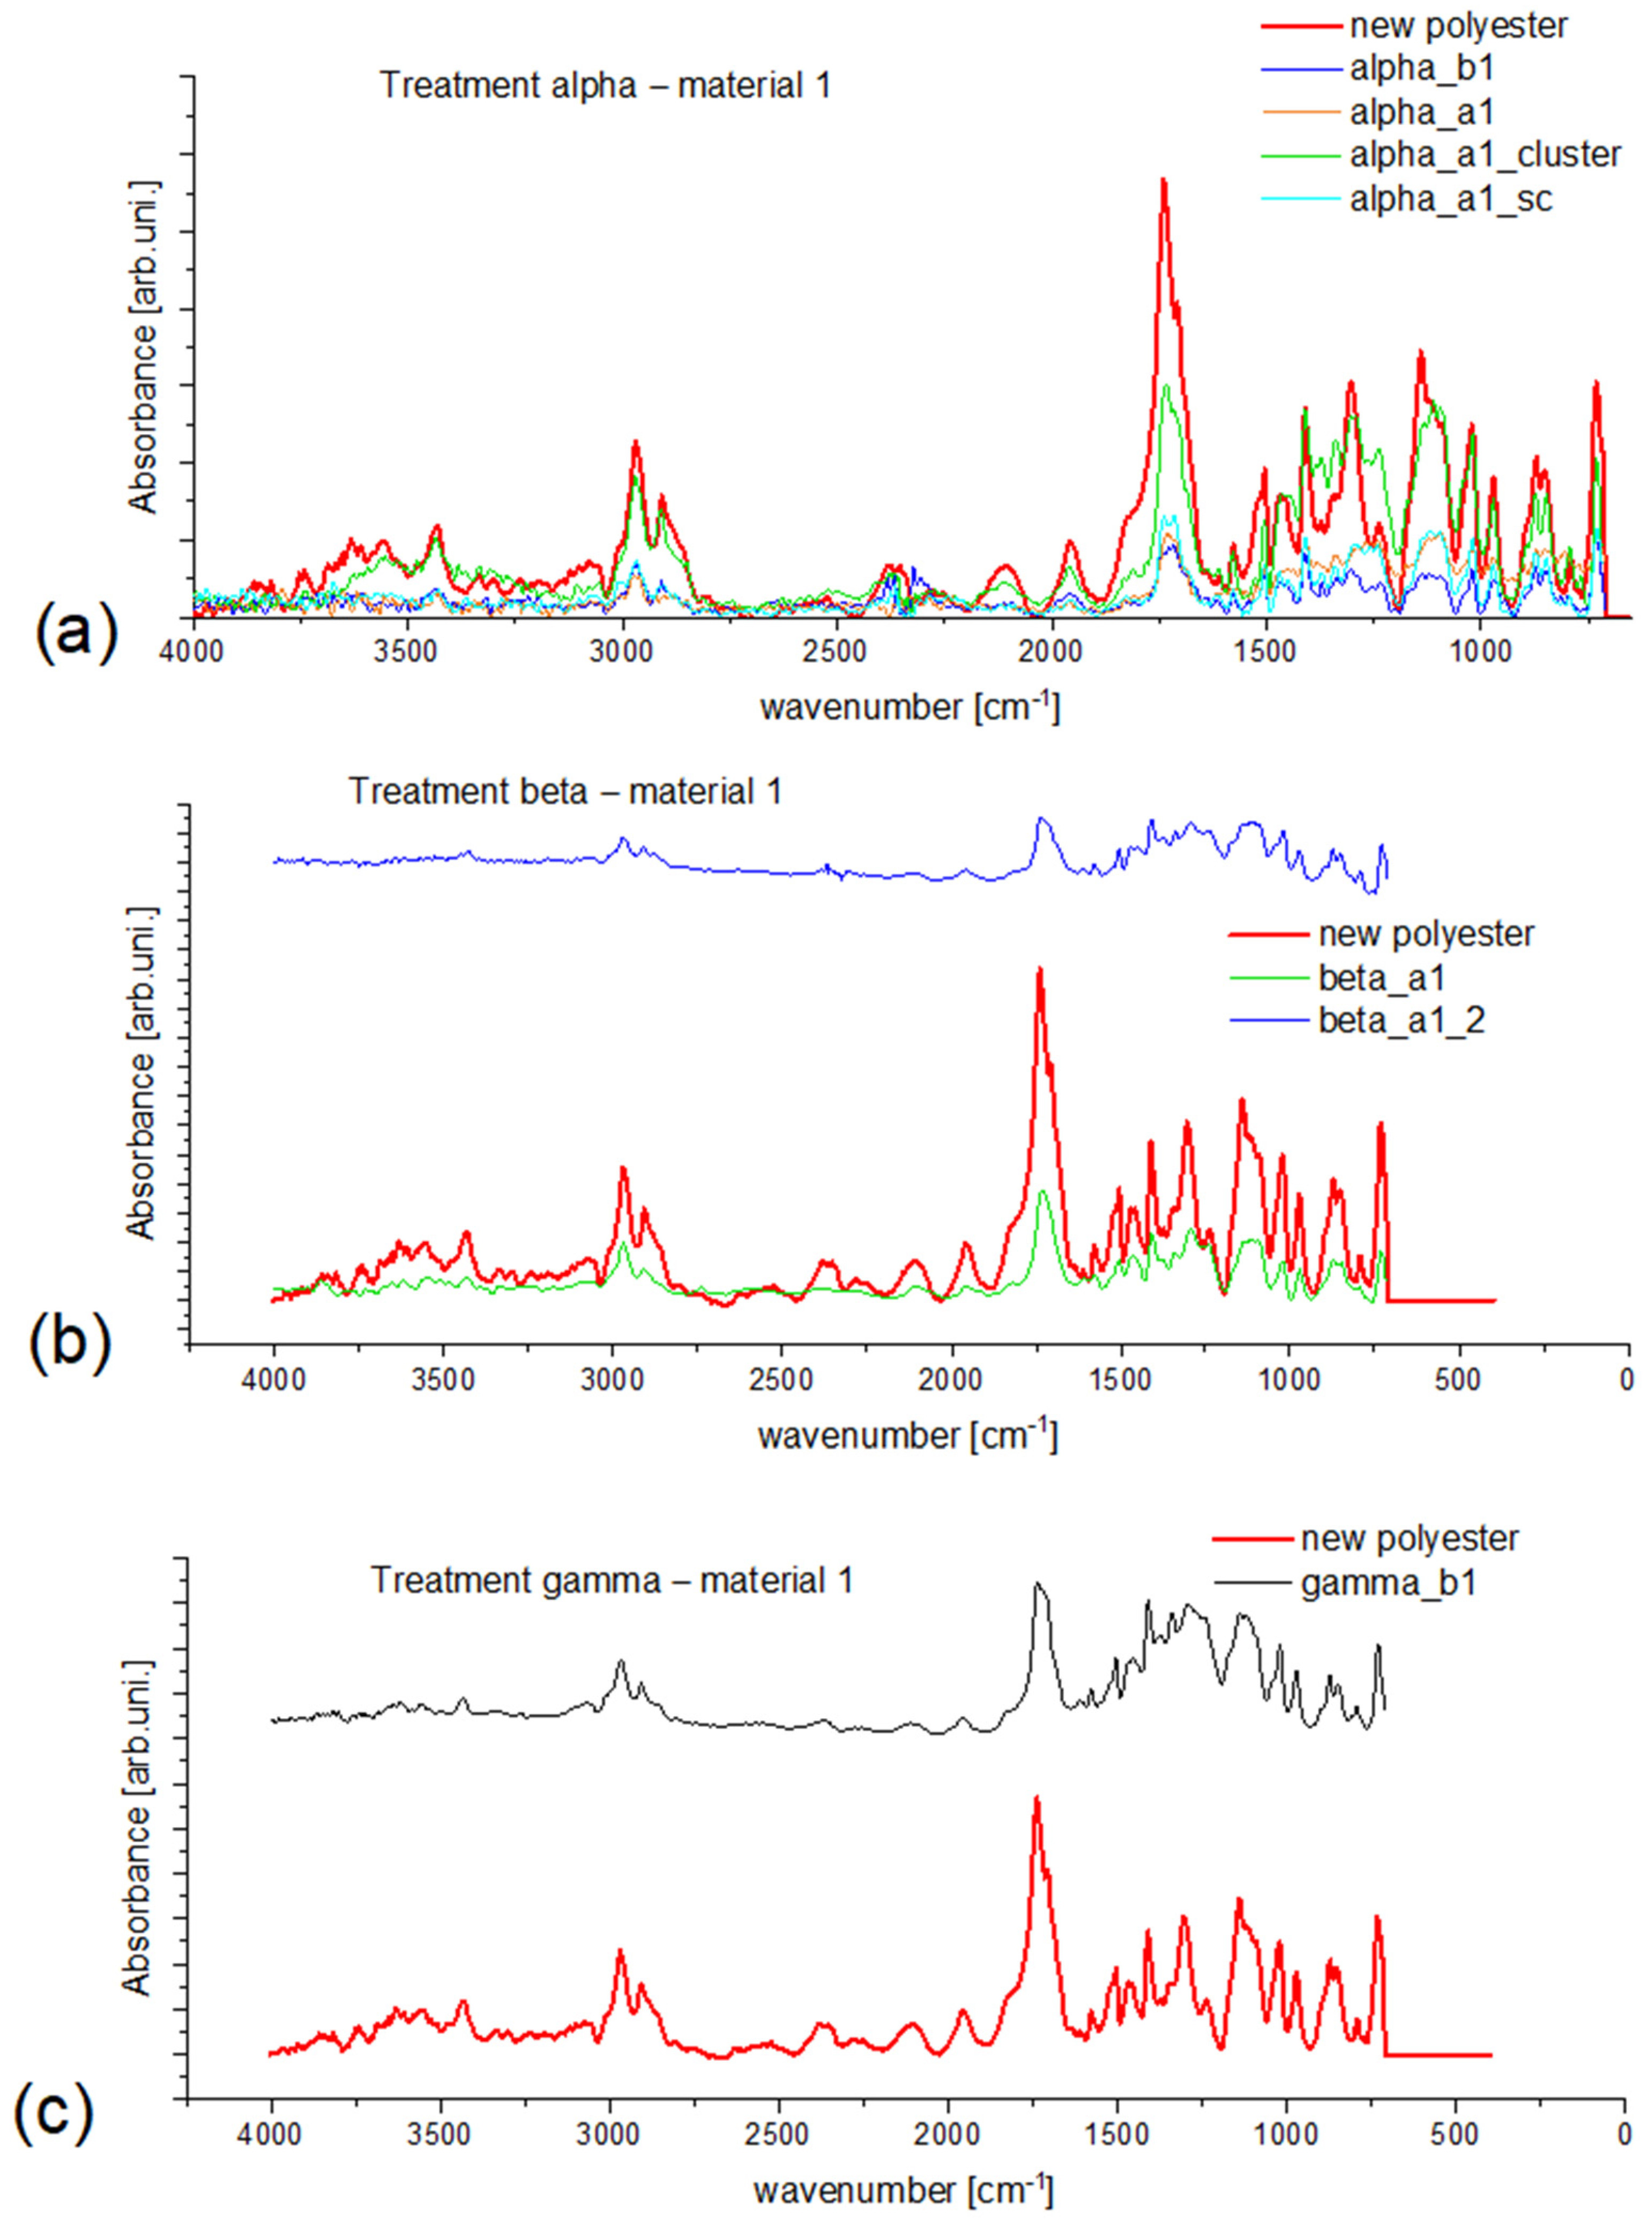
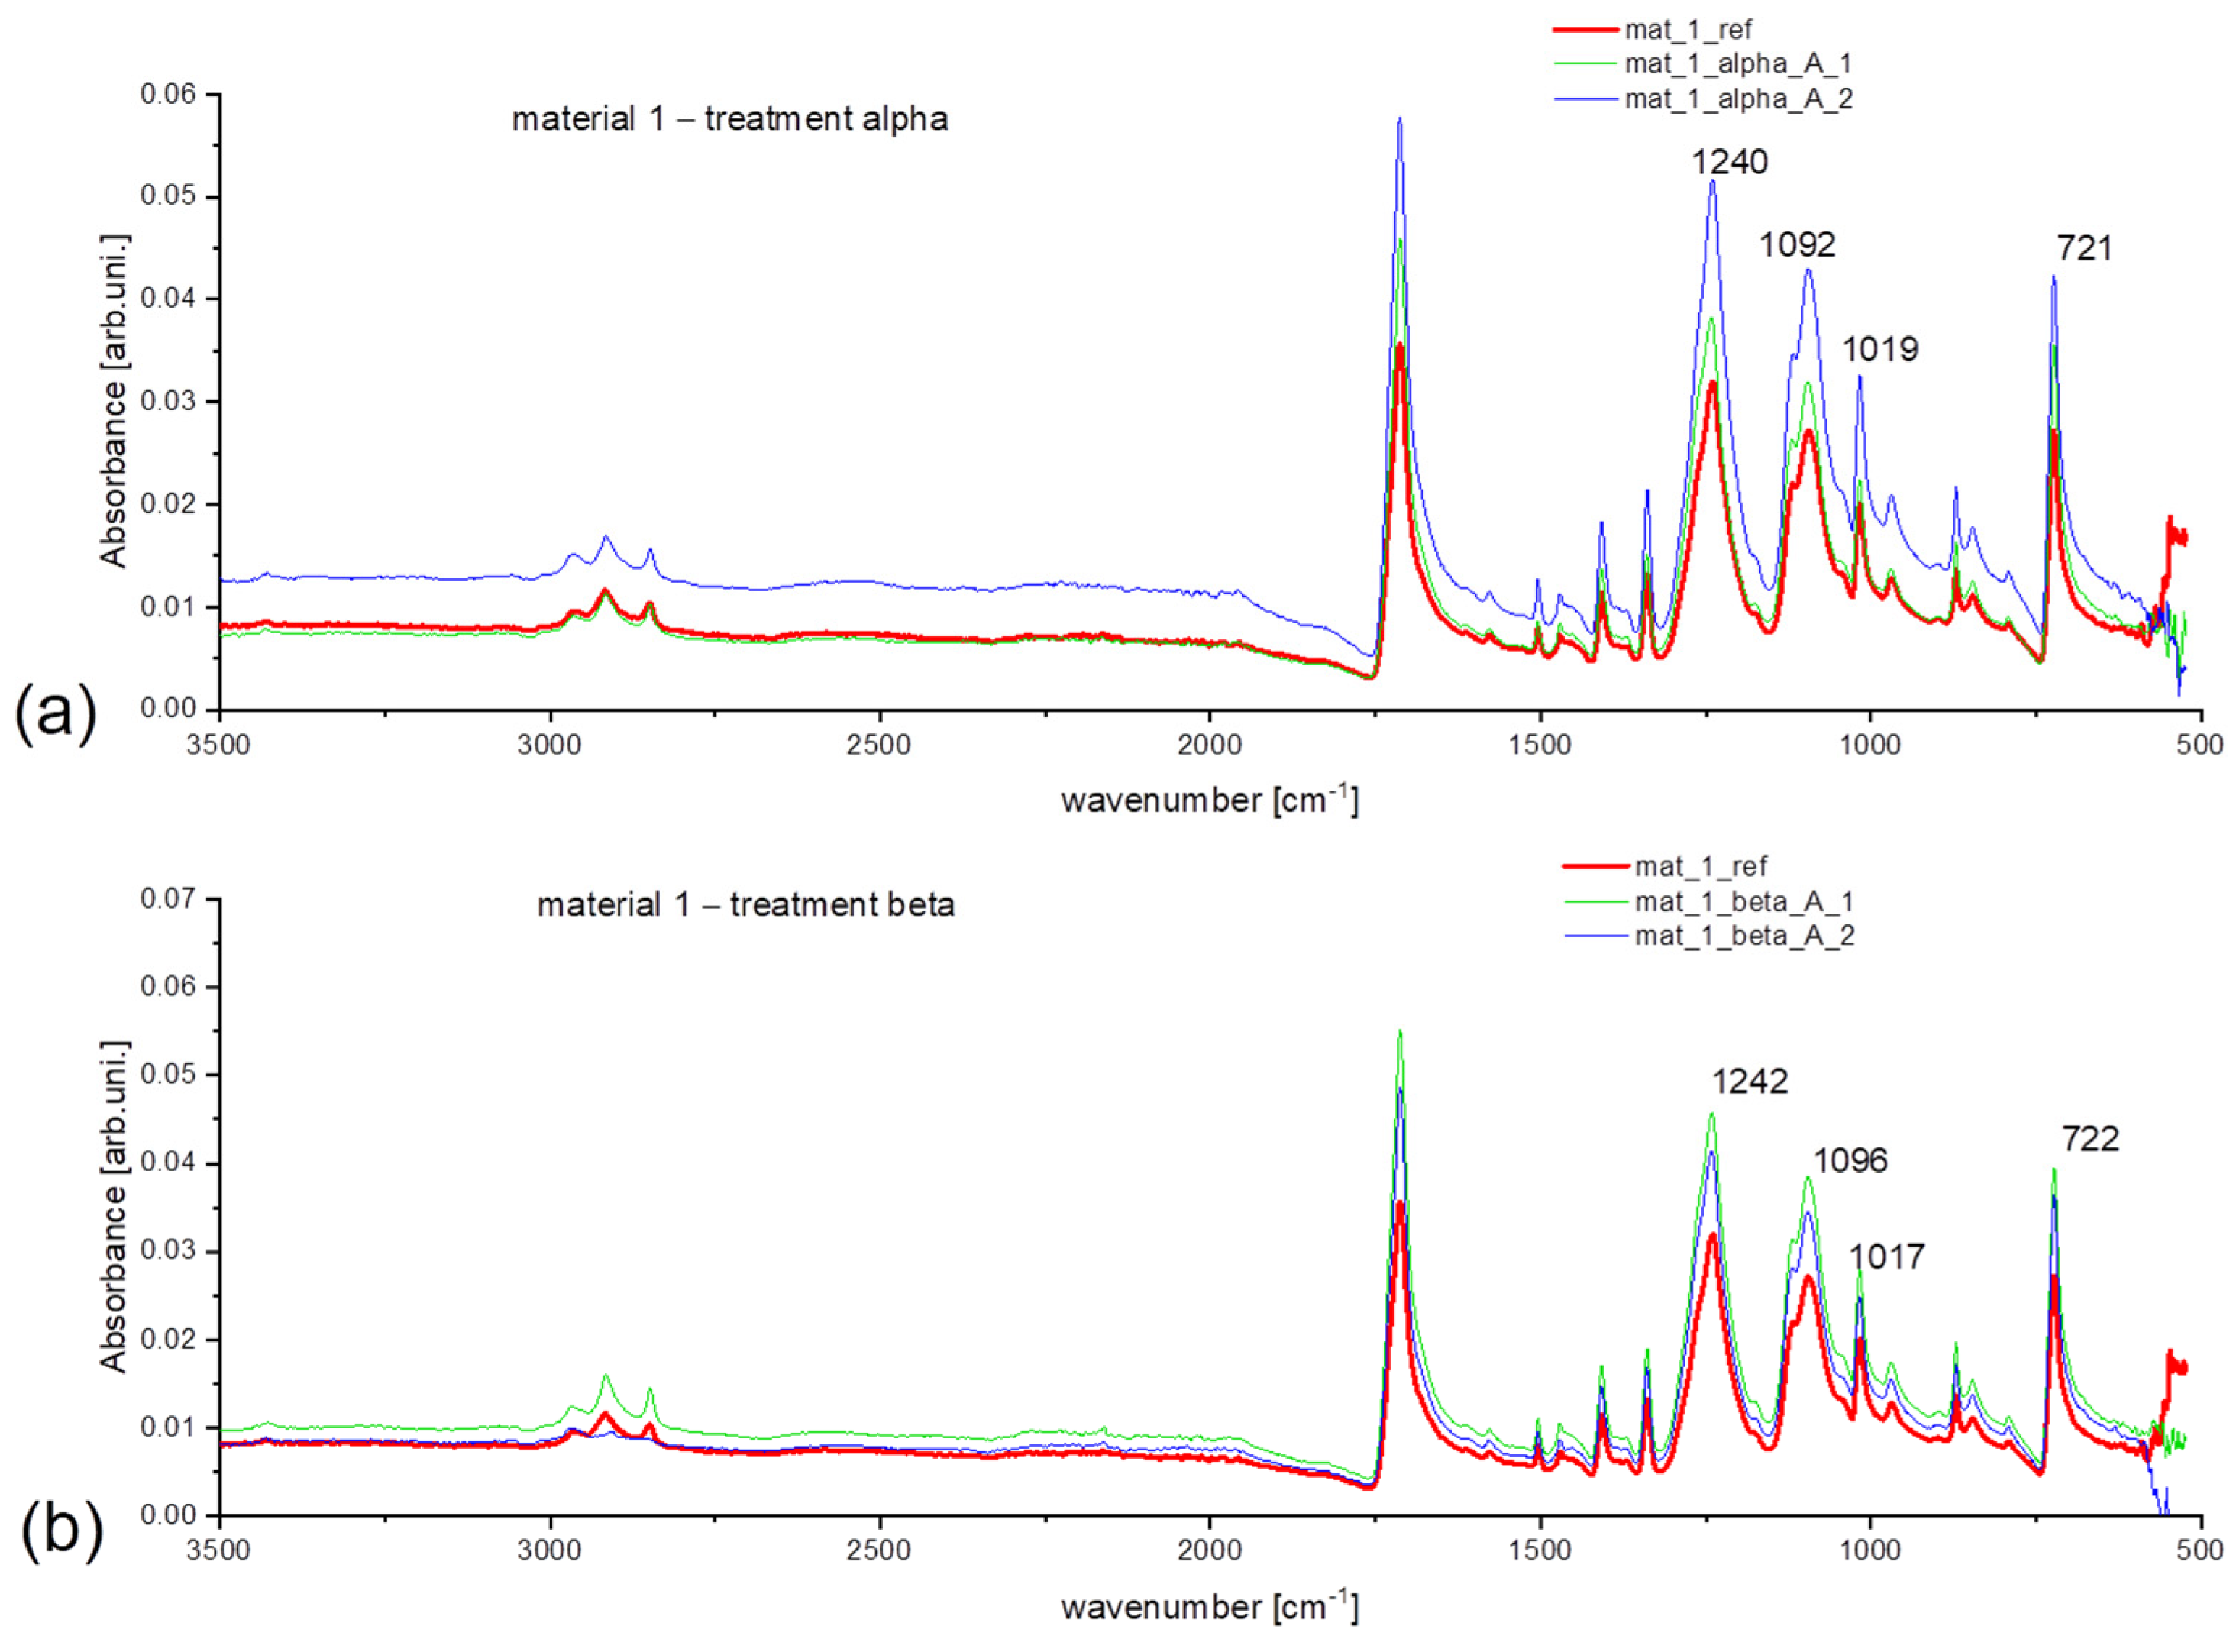
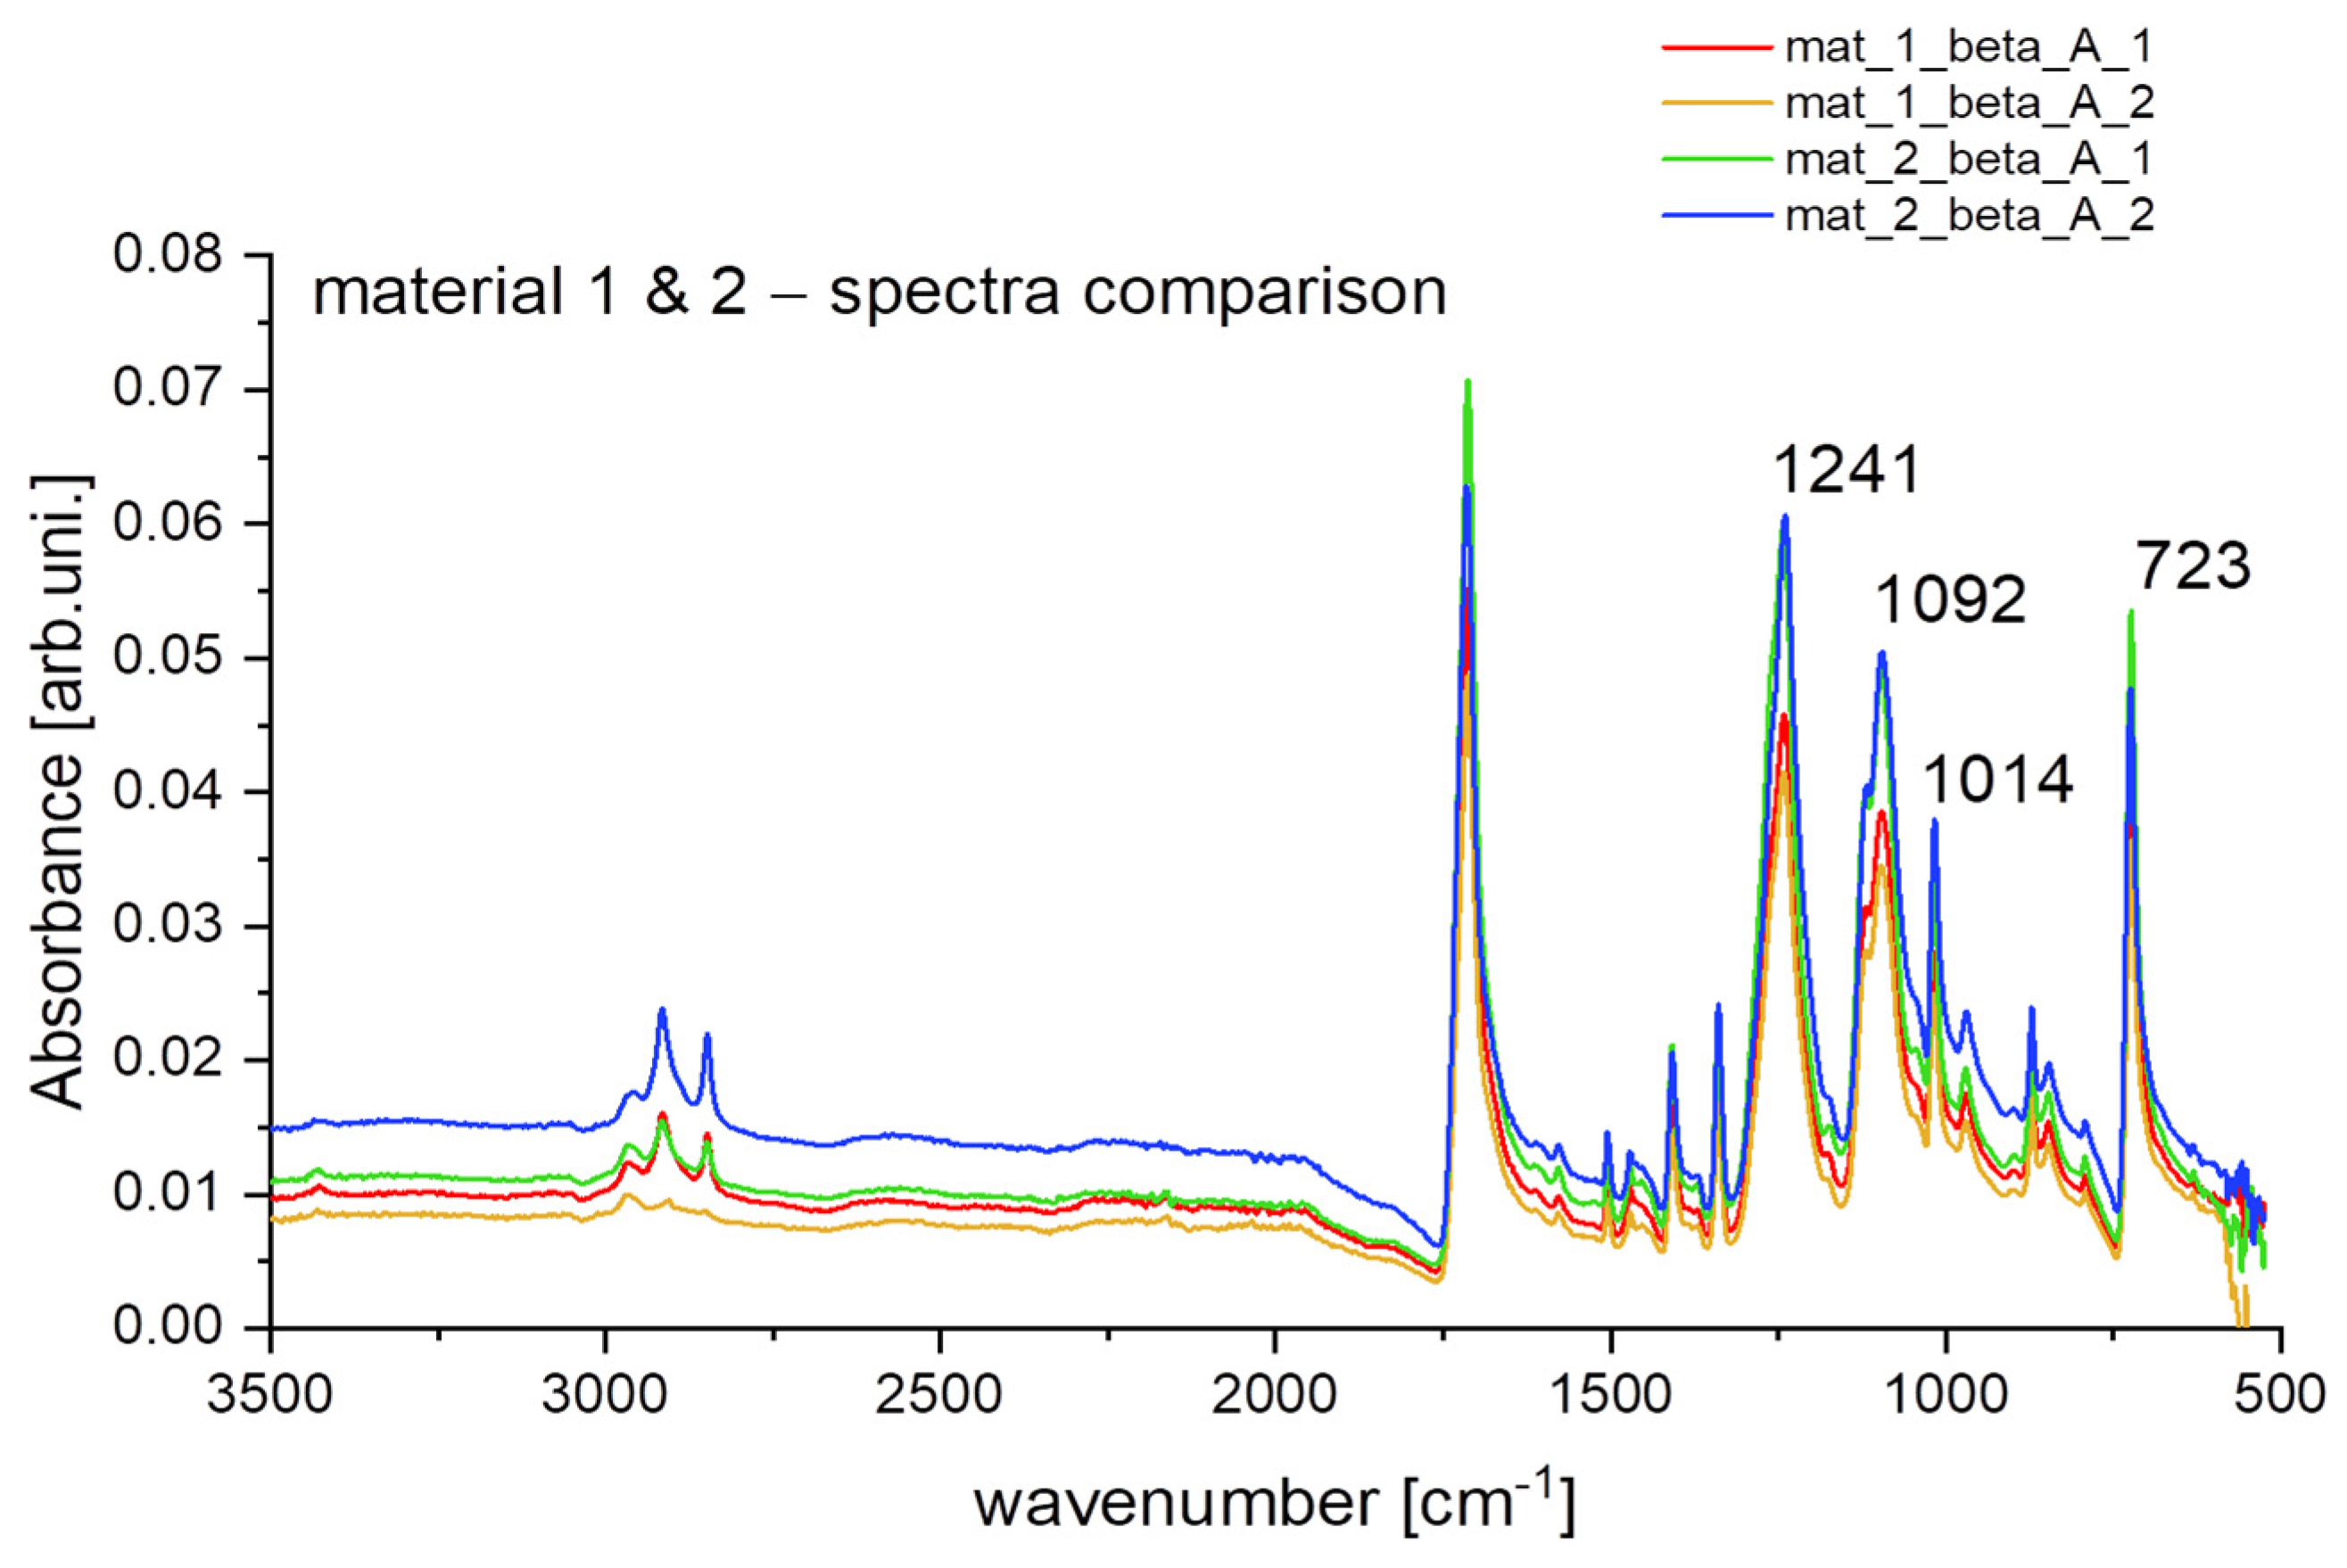
3.3.1. Material 1—New Polyester

In Figure 2, the spectral results for material 1 were compared. The difference in intensity of collected data can be separated into two types: type one, which is a consequence of occurring vibrations, and type two, which can be observed as a higher stated baseline (compare the spectra in Figure 2b for reference material and sample beta_a1_2). It is hard to define the origin of this second type difference and their analytical applies since no pattern can be found while analyzing spectral data through the type of examined material or type of selected treatment. The same problem appeared on the other obtained spectra. Nevertheless, all analytically diagnostic bands can be assigned (Supplementary Materials). The type one intensity difference in Figure 2a shows that microfibers (even if taken from the same type of treatment and filter size) differ according to their spectra. Not all signals are as sharp as from the reference material, which means that during the wash, their structure was interfered with, e.g., mechanical degradation. Also, it shows the contribution of each type of structure that can be found in the polyester structure, which gives insight into how the selected treatment influences the examined material. Regardless of the type two intensity difference in Figure 2b, it is clearly visible that the collected spectra from the samples show weaker intensity than the reference material, which in this case can be assigned to the type of treatment during which the microfibers were released at 60 °C. One can conclude that higher temperature enhances aging and fiber release. In the case of clustering, the weathering is partially inhibited, and as a consequence, spectra for clusters and semi-clusters differ less from the reference material than randomly dispersed ones (Figure 2a green curve).
Figure 3 visualizes the single fiber analysis by FTIR mapping and the anisotropy in surface chemistry (namely, the distribution of oxygen-containing functional groups).
The difference in intensity can be noticed in the ATR spectra of selected samples from treatment alpha and beta (Figure 4a,b). Elevated intensity is evident at 713 cm−1, 1240 cm−1, 1095 cm−1 and 1017 cm−1. It means that after treatment, the contribution of oxygen-containing functional groups (for instance -C=O) has increased. That is a direct indication of the degradation of synthetic material. To prove this statement, one can compare the spectra for new and aged synthetic materials that were submitted under the same washing treatment (Figure 5). Clearly, higher intensity for samples from aged fleece at previously specified wavenumbers can be considered as a factor in stating the synthetic material degradation [33,34].
Figure 2. Obtained spectral data for material 1 (new polyester) for treatment: (a) alpha, (b) beta, (c) gamma. In (a), the abbreviation sc stands for semi–cluster.
Microplastics 03 00005 g002
Figure 3. Images taken from sample beta_a1 (values in micrometers): (a) microscopic photo, (b) 2D map, (c) 3D map that enables the overall filter visualization and the fast scanning of the sample as a whole.
Microplastics 03 00005 g003
Figure 4. Obtained ATR spectra for material 1 (new polyester) for treatment: (a) alpha, (b) beta.
Microplastics 03 00005 g004
Figure 5. Obtained ATR spectra for material 1 and material 2 (respectively: new polyester and aged fleece) for treatment beta.
Microplastics 03 00005 g005

3.3.2. Material 2—Aged Polyester

In Figure 6, the spectra for material 2 are presented. At first, the substantial difference in intensity can be seen in Figure 6a. Generally, the microfibers released on filter B have a similar or higher intensity than the reference material, making it difficult to connect this feature with any potential cause. Also, broader signals can be observed in the region 1250–1500 cm−1 for material 2 and the MFs collected from it. It is connected with the fact that aged materials were already subjected to mechanical or UV degradation. Hence, the found signals are broader than ones from new materials. Through all analyzed samples in this section, spectra of reference material are characterized with the highest intensity. The shape of signals was not significantly changed due to the previous aging. That is why—in the case of aged synthetic material—it is difficult to recognize and distinguish the changes caused by selected treatments, as they are not sufficiently visible. Traces of the detergents may also hamper the signal to some extent.

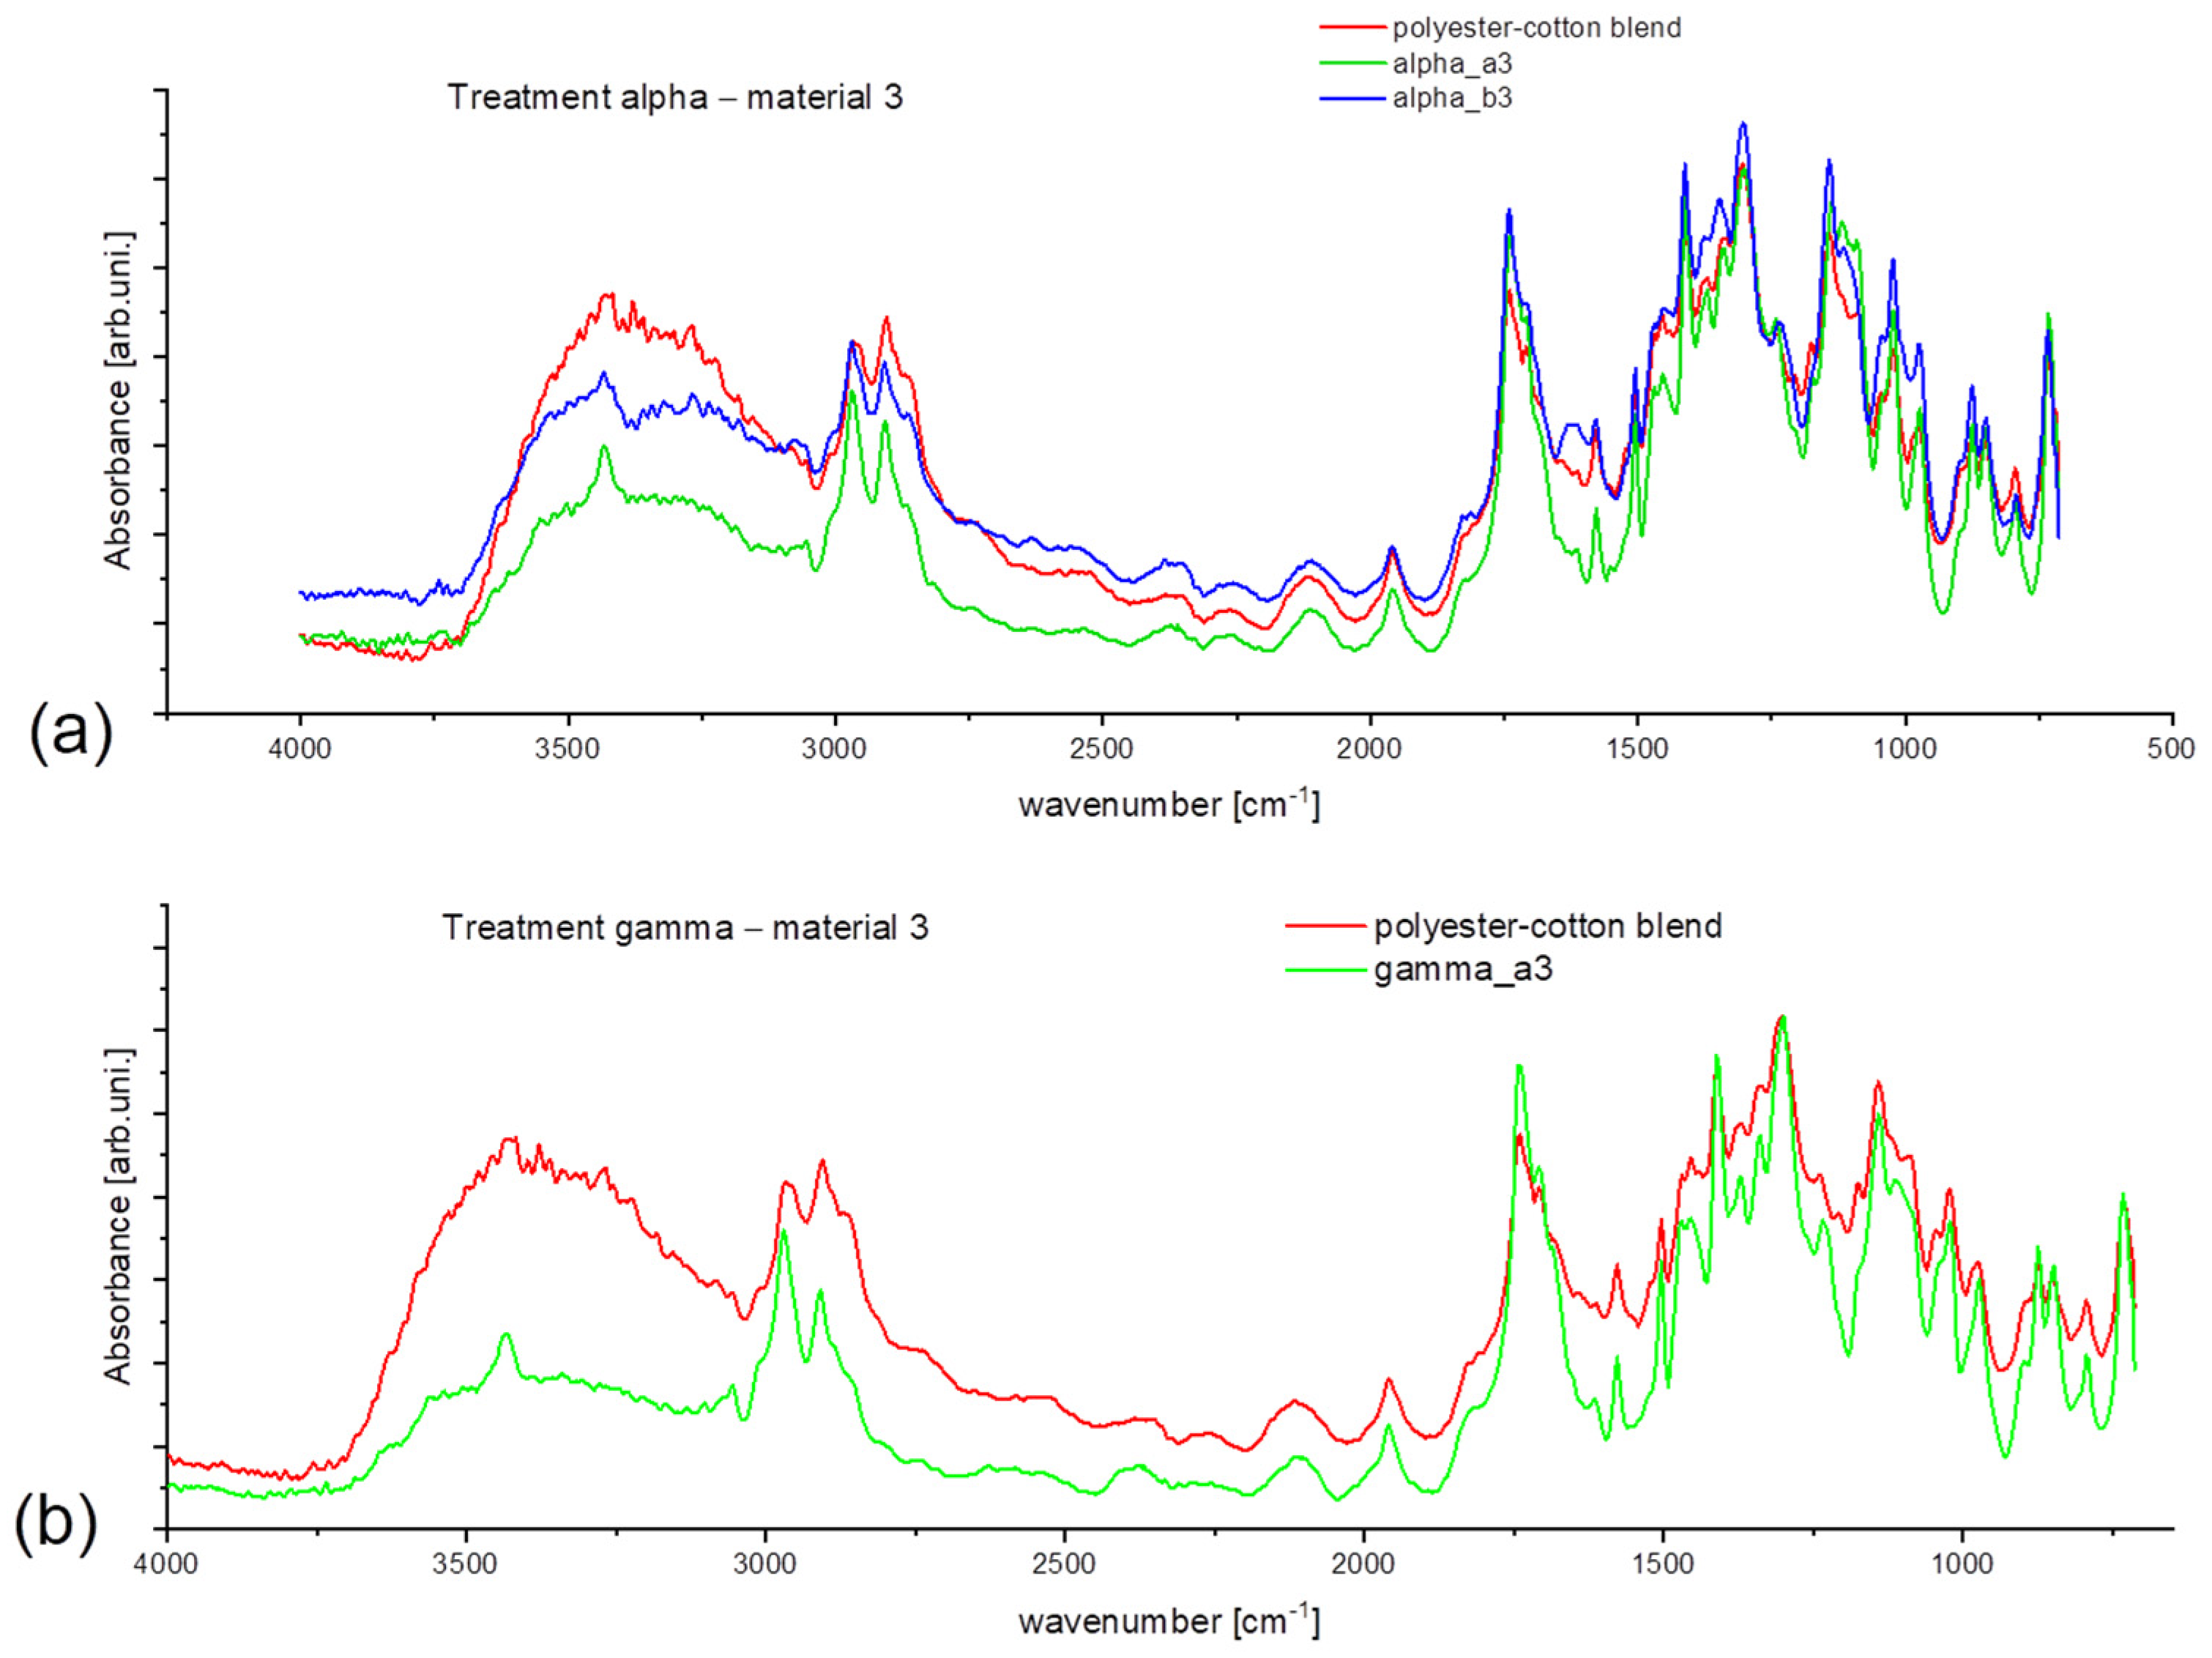
3.3.3. Materials 3 and 4—Polyester—Cotton Blend and Pure Cotton (Respectively)

Figure 7 represents the spectra taken from material 3 after the treatment. At first sight, the new, broad signal around 3450 cm−1 is visible, and if compared with the spectra of Figure 8, it can be assigned as a signal from the cellulose -OH group [35]. As it leads to intensity comparison, treated samples show decreased intensity, especially in the -OH vibration region (Figure 7a,b), which shows the visible influence of washing treatment on the fiber structure. Spectra presented in Figure 8 are only used as reference material to understand better the polyester-cotton blend behavior. However, the added detergent enables lower washing temperature with maintained cleaning efficiency and lack of high-temperature seams favorable regarding material conservation.

4. Conclusions

As the research presented, microfibers easily and quickly transfer from the original synthetic material to the environment. The proposed technique of collecting samples with woven metal filters in situ can be considered feasible for further applications and efficient monitoring. What was worth noticing is that shortening the distance between the material and filter pores shows that the form of the filter (folded envelope) could stabilize the sample and consequently inhibit the emission of MFs. On the other hand, the smaller pieces of material may enhance the release from the edges. However, qualitative and relative quantitative comparisons between different types of textiles and washing conditions are still possible.
Nevertheless, a few problems were found during the process: (1) It is hard to explain why, on the same type of filters within the same treatment, the amount of collected microfibers differs from substantial to none, (2) from 48 distinguished groups of samples (treatment type—filter size—selected material) only 12 gave results that could be further analyzed leading to the conclusive statements. As Weis and De Falco [11] pointed out, standardized methods for collecting and analyzing data considering microplastics are lacking. It is hard to compare the results between the researchers if they use different methods and techniques. FTIR mapping can be applied to examine the large filter area and easily track microfibers. Furthermore, it is better to evaluate their weathering level. The detailed physical and chemical characterization of the surface can be obtained by ATR. Also, the immediate indications of fiber weathering are observed.
Besides the mentioned problem, introducing innovative ways of collecting and analyzing microplastic samples is another step in developing this branch of environmental study. In the future perspective, the idea of monitoring simultaneously the amount of MFs obtained on the filter (envelope) and the amount of MFs collected from the after-wash water filtration is worth exploring. Potentially, it would reveal how much of the microfibers is let through during the standard wash. As Zhang et al. [36] presented, industrial and household laundry is the most common origin (35%) of microfibers. Also, many researchers have investigated and estimated the amount of MFs released into the environment from laundry, and the numbers presented range from hundreds to thousands of kilograms per year. Selected MF emission (domestic laundry) is one of many underlined ways of potential microplastic release from textile materials, which only shows the importance of the persistent urge to invent and develop methods that can be used in the future to collect and analyze microplastic samples.

Supplementary Materials

The following supporting information can be downloaded at: https://www.mdpi.com/article/10.3390/microplastics3010005/s1, Figure S1: The folded envelope of filter used in the conducted experiment; Figure S2: Images taken from sample alpha_a1_cluster: (a) microscopic photo, (b) 2D map, (c) 3D map; Figure S3: Images taken from sample alpha_a1_sc: (a) microscopic photo, (b) 2D map, (c) 3D map; Figure S4: Images taken from sample alpha_b1: (a) microscopic photo, (b) 2D map, (c) 3D map; Figure S5: Images taken from sample alpha_a3: (a) microscopic photo, (b) 2D map, (c) 3D map; Figure S6: Images taken from sample gamma_a3: (a) microscopic photo, (b) 2D map, (c) 3D map; Figure S7: ATR spectra for (a) material 2, treatment beta, (b) material 3, treatment beta; Table S1: Vibration band assignment for collected and analyzed samples.

Author Contributions

Conceptualization, A.D.; methodology, A.D.; software, A.D.; validation, A.D.; formal analysis, A.D.; investigations O.Ś.; resources, A.D.; data curation, O.Ś. and A.D.; writing—original draft preparation, O.Ś. and A.D.; writing—review and editing, O.Ś. and A.D.; visualization, O.Ś.; supervision, A.D.; funding acquisition, A.D. All authors have read and agreed to the published version of the manuscript.

Funding

This research received no external funding.

Institutional Review Board Statement

Not applicable.

Informed Consent Statement

Not applicable.

Data Availability Statement

Data information is available from the corresponding author. The University of Warsaw will provide resources for data management, traceability, access, interoperability and re-use for 10 years after the end of the project.

Acknowledgments

Authors would like to thank the following persons for their support and contribution: Barbara Pałys (for the access to Raman spectroscopy equipment), Piotr Machowski (for all his time dedicated to my ideas on Python programming). The University of Warsaw partially supported this work within the IDUB POB I grant (BOB-IDUB-622-168/2021/PSP: 501-D112-20-1004310).

Conflicts of Interest

The authors declare no conflicts of interest.

References

  1. Dimassi, S.N.; Hahladakis, J.N.; Yahia, M.N.D.; Ahmad, M.I.; Sayadi, S.; Al-Ghouti, M.A. Degradation-fragmentation of marine plastic waste and their environmental implications: A critical review. Arab. J. Chem. 2022, 15, 104262. [Google Scholar] [CrossRef]
  2. Hahladakis, J.N.; Velis, C.A.; Weber, R.; Iacovidou, E.; Purnell, P. An overview of chemical additives present in plastics: Migration, release, fate and environmental impact during their use, disposal and recycling. J. Hazard. Mater. 2018, 334, 179–199. [Google Scholar] [CrossRef] [PubMed]
  3. Ali, S.S.; Elsamahy, T.; Koutra, E.; Kornaros, M.; El-Sheekh, M.; Abdelkarim, E.A.; Zhu, D.; Sun, J. Degradation of conventional plastic wastes in the environment: A review on current status of knowledge and future perspectives of disposal. Sci. Total Environ. 2021, 771, 144719. [Google Scholar] [CrossRef] [PubMed]
  4. Geyer, R.; Gavigan, J.; Jackson, A.M.; Saccomanno, V.R.; Suh, S.; Gleason, M.G. Quantity and fate of synthetic microfiber emissions from apparel washing in California and strategies for their reduction. Environ. Pollut. 2022, 298, 118835. [Google Scholar] [CrossRef] [PubMed]
  5. Available online: https://plasticseurope.org/wp-content/uploads/2021/12/AF-Plastics-the-facts-2021_250122.pdf (accessed on 16 March 2023).
  6. Balasaraswathi, S.R.; Rathinamoorthy, R. Synthethic Textile and Microplastic Pollution: An analysis on Environmental and Health impact. In Sustainable Approaches in Textiles and Fashion; Springer: Berlin/Heidelberg, Germany, 2022; pp. 1–20. ISBN 978-981-19-0529-2. [Google Scholar]
  7. Barrows, A.P.W.; Cathey, S.E.; Petersen, C.W. Marine environment microfiber contamination: Global patterns and the diversity of microparticle origins. Environ. Pollut. 2018, 237, 275–284. [Google Scholar] [CrossRef] [PubMed]
  8. Available online: https://www.europarl.europa.eu/RegData/etudes/BRIE/2019/633143/EPRS_BRI(2019)633143_EN.pdf (accessed on 16 March 2023).
  9. Sekudewicz, I.; Dąbrowska, A.M.; Syczewski, M.D. Microplastic pollution in surface water and sediments in the urban section of the Vistula River (Poland). Sci. Total Environ. 2021, 762, 143111. [Google Scholar] [CrossRef] [PubMed]
  10. Asensio-Montesinos, F.; Blaya-Valencia, G.; Corbí, H.; Beltrán-Sanahuja, A.; Sanz-Lázaro, C. Microplastic accumulation dynamics in two Mediterranean beaches with contrasting inputs. J. Sea Res. 2022, 188, 102269. [Google Scholar] [CrossRef]
  11. Weis, J.S.; De Falco, F. Microfibers: Environmental Problems and solutions. Microplastics 2022, 1, 626–639. [Google Scholar] [CrossRef]
  12. Carreras-Colom, E.; Cartes, J.E.; Constenla, M.; Welden, N.A.; Soler-Membrives, A.; Carrassón, M. An affordable method for monitoring plastic fibre ingestion in Nephrops norvegicus (Linnaeus, 1758) and implementation on wide temporal and geographical scale comparisons. Sci. Total Environ. 2022, 810, 152264. [Google Scholar] [CrossRef]
  13. Leslie, H.A.; Van Velzen, M.J.; Brandsma, S.H.; Vethaak, A.D.; Garcia-Vallejo, J.J.; Lamoree, M.H. Discovery and quantification of plastic particle pollution in human blood. Environ. Int. 2022, 163, 107199. [Google Scholar] [CrossRef]
  14. Rebelein, A.; Int-Veen, I.; Kammann, U.; Scharsack, J.P. Microplastic fibers—Underestimated threat to aquatic organisms? Sci. Total Environ. 2021, 777, 146045. [Google Scholar] [CrossRef]
  15. Wu, P.; Li, J.; Lu, X.; Tang, Y.; Cai, Z. Release of tens of thousands of microfibers from discarded face masks under simulated environmental conditions. Sci. Total Environ. 2022, 806, 150458. [Google Scholar] [CrossRef] [PubMed]
  16. Vasiljević, S.; Vujić, M.; Agbaba, J.; Federici, S.; Ducoli, S.; Tomić, R.; Tubić, A. Efficiency of Coagulation/Flocculation for the Removal of Complex Mixture of Textile Fibers from Water. Processes 2023, 11, 820. [Google Scholar] [CrossRef]
  17. Kelly, M.R.; Lant, N.J.; Kurr, M.; Burgess, J.G. Importance of Water-Volume on the Release of Microplastic Fibers from Laundry. Environ. Sci. Technol. 2019, 53, 11735–11744. [Google Scholar] [CrossRef]
  18. Napper, I.E.; Thompson, R.C. Release of synthetic microplastic plastic fibres from domestic washing machines: Effects of fabric type and washing conditions. Mar. Pollut. Bull. 2016, 112, 39–45. [Google Scholar] [CrossRef]
  19. Volgare, M.; De Falco, F.; Avolio, R.; Castaldo, R.; Errico, M.E.; Gentile, G.; Ambrogi, V.; Cocca, M. Washing load influences the microplastic release from polyester fabrics by affecting wettability and mechanical stress. Sci. Rep. 2021, 11, 19479. [Google Scholar] [CrossRef] [PubMed]
  20. De Falco, F.; Cocca, M.; Avella, M.; Thompson, R.C. Microfiber Release to Water, Via Laundering, and to Air, via Everyday Use: A Comparison between Polyester Clothing with Differing Textile Parameters. Environ. Sci. Technol. 2020, 54, 3288–3296. [Google Scholar] [CrossRef] [PubMed]
  21. Hartline, N.L.; Bruce, N.J.; Karba, S.N.; Ruff, E.O.; Sonar, S.U.; Holden, P. Microfiber Masses Recovered from Conventional Machine Washing of New or Aged Garments. Environ. Sci. Technol. 2016, 50, 11532–11538. [Google Scholar] [CrossRef]
  22. Yadav, S.; Kataria, N.; Khyalia, P.; Rose, P.K.; Mukherjee, S.; Sabherwal, H.; Chai, W.S.; Rajendran, S.; Jiang, J.J.; Khoo, K.S. Recent analytical techniques, and potential eco-toxicological impacts of textile fibrous microplastics (FMPs) and associated contaminates: A review. Chemosphere 2023, 326, 138495. [Google Scholar] [CrossRef]
  23. Wu, M.; Yang, C.; Du, C.; Liu, H. Microplastics in waters and soils: Occurrence, analytical methods and ecotoxicological effects. Ecotoxicol. Environ. Saf. 2020, 202, 110910. [Google Scholar] [CrossRef]
  24. Käppler, A.; Fischer, D.; Oberbeckmann, S.; Schernewski, G.; Labrenz, M.; Eichhorn, K.J.; Voit, B. Analysis of environmental microplastics by vibrational microspectroscopy: FTIR, Raman or both? Anal. Bioanal. Chem. 2016, 408, 8377–8391. [Google Scholar] [CrossRef]
  25. Zarfl, C. Promising techniques and open challenges for microplastic identification and quantification in environmental matrices. Anal. Bioanal. Chem. 2019, 411, 3743–3756. [Google Scholar] [CrossRef] [PubMed]
  26. Periyasamy, A.P.; Tehrani-Bagha, A. A review on microplastic emmision from textile materials and its reduction techniques. Polym. Degrad. Stab. 2022, 199, 109901. [Google Scholar] [CrossRef]
  27. De Falco, F.; Cocca, M.; Guarino, V.; Gentile, G.; Ambrogi, V.; Ambrosio, L.; Avella, M. Novel finishing treatments of polyamide fabrics by electrofluidodynamic process to reduce microplastic release during washings. Polym. Degrad. Stab. 2019, 165, 110–116. [Google Scholar] [CrossRef]
  28. De Falco, F.; Gentile, G.; Avolio, R.; Errico, M.E.; Di Pace, E.; Ambrogi, V.; Avella, M.; Cocca, M. Pectin based finishing to mitigate the impact of microplastics released by polyamide fabrics. Carbohydr. Polym. 2018, 198, 175–180. [Google Scholar] [CrossRef] [PubMed]
  29. De Falco, F.; Gullo, M.P.; Gentile, G.; Di Pace, E.; Cocca, M.; Gelabert, L.; Brouta-Agnésa, M.; Rovira, A.; Escudero, R.; Villalba, R.; et al. Evaluation of microplastic release caused by textile washing processes of synthetic fabrics. Environ. Pollut. 2018, 236, 916–925. [Google Scholar] [CrossRef] [PubMed]
  30. Smith, B. Infrared Spectroscopy of Polymers, VIII: Polyesters and Rule of Three. Spectroscopy 2022, 37, 25–28. [Google Scholar] [CrossRef]
  31. Bhattacharya, S.S.; Chaudhari, S.B. Study on Structural, Mechanical and Functional Proprieties of Poltester Silica Nanocomposite Fabric. Int. J. Pure Appl. Sci. Technol. 2014, 21, 43–52. [Google Scholar]
  32. Bland, E.; Sheridan, K. Technical Research Report: Recycled Polyester within the Context of Fibre Fragmentation. The Microfiber Consortium: Bristol, UK, 2023. [Google Scholar]
  33. Dąbrowska, A. Raman Spectroscopy of Marine Microplastics—A short comprehensive compendium for the environmental scientists. Mar. Environ. Res. 2021, 168, 105313. [Google Scholar] [CrossRef]
  34. Kalogerakis, N.; Karkanorachaki, K.; Kalogerakis, G.C.; Triantafyllidi, E.I.; Gotsis, A.D.; Partsinevelos, P.; Fava, F. Microplastics Generation: Onset of Fragmentation of Polyethylene Films in Marine Environment Mesocosms. Front. Mar. Sci. 2017, 4, 84. [Google Scholar] [CrossRef]
  35. Peets, P.; Kaupmees, K.; Vahur, S.; Leito, I. Reflectance FT-IR spectroscopy as a viable option for textile fiber identification. Herit. Sci. 2019, 7, 93. [Google Scholar] [CrossRef]
  36. Zhang, Y.Q.; Lykaki, M.; Markiewicz, M.; Alrajoula, M.T.; Kraas, C.; Stolte, S. Environmental contamination by microplastics originating from textiles: Emission, transport, fate and toxicity. J. Hazard. Mater. 2022, 430, 128453. [Google Scholar] [CrossRef]
Figure 1. Amount analysis of microfibers (right column) and length analysis (left column) of microfibers from (a,b) material 1 (new polyester), (c,d) material 2 (aged polyester), (e,f) material 3 (polyester-cotton blend).
Microplastics 03 00005 g001
Figure 6. Obtained spectral data for material 2 (aged polyester) for treatment: (a) alpha, (b) beta, (c) gamma.
Microplastics 03 00005 g006
Figure 7. Obtained spectral data for material 3 (polyester-cotton blend) for treatment: (a) alpha, (b) gamma.
Microplastics 03 00005 g007
Figure 8. Obtained spectral data for material 4 (pure cotton) for the following treatment: (a) alpha, (b) beta, (c) gamma.
Microplastics 03 00005 g008
Table 1. Parameters of selected treatments.
Duration [min.]Water-Volume [L]rpmTemperature [°C]
plain~59405940
with raised temperature~74505960
with the addition of the detergent~59405940
Table 2. Names assigned to each sample.
New Material Bag [100% Cotton, Woven]Aged Shirt [70% Polyester, 30% Cotton, Woven]Aged Fleece [Polyester, Knitted]New Leggings [Polyester, Knitted]
plainalphaD4alphaC3alphaB2alphaA1
high-temperaturebetaD4betaC3betaB2betaA1
detergentgammaD4gammaC3gammaB2gammaA1
Table 3. FTIR band assignment for polyesters.
Vibrational Band AssignmentWavenumber [cm−1]Reference
C=O stretching (saturated esters)1750–1735[30]
C=O stretching (aromatic esters)1730–1715[31]
Aromatic ring vibration1409[31]
Cα-C-O asymmetric stretching (aromatic esters)1310–1250[30]
O-C′-C″ aromatic ester stretching1100[30]
O=C-O-C′ stretching1021[31]
C=C stretching967[31]
C-H vibration in the aromatic ring869[32]
Table 4. Emission extrapolation for analyzed samples. The area of the used piece of material can be approximated to 0.0006 m2.
Treatment NameFilter Size [µm]Material 1Material 2Material 3
MeanMFs/m2MeanMFs/m2MeanMFs/m2
alpha2556.3393,883.3356.3393,883.334.337216.67
10033.3355,550
beta2553.3388,883.3359.6799,4501118,333.33
1003.676116.67 35000
Disclaimer/Publisher’s Note: The statements, opinions and data contained in all publications are solely those of the individual author(s) and contributor(s) and not of MDPI and/or the editor(s). MDPI and/or the editor(s) disclaim responsibility for any injury to people or property resulting from any ideas, methods, instructions or products referred to in the content.

