Article

Nanoplastic Generation from Secondary PE Microplastics: Microorganism-Induced Fragmentation

by
Katerina Karkanorachaki
1,
Panagiota Tsiota
1,
Giorgos Dasenakis
1,
Evdokia Syranidou
1,* and
Nicolas Kalogerakis
1,2
1
School of Chemical and Environmental Engineering, Technical University of Crete, 73100 Chania, Greece
2
Institute of GeoEnergy, Foundation for Research and Technology—Hellas, 73100 Chania, Greece
*
Author to whom correspondence should be addressed.
Microplastics 2022, 1(1), 85-101; https://doi.org/10.3390/microplastics1010006
Submission received: 17 December 2021 / Revised: 19 January 2022 / Accepted: 19 January 2022 / Published: 21 January 2022

Abstract

:
Concern regarding the pollution of the marine environment with plastics has been rising in recent years. Plastic waste residing in and interacting with the environment fragments into secondary particles in the micro- and nanoscale, whose negative impacts on the environment are even greater than those of the parent items. In this work, secondary high density polyethylene (HDPE) and low density polyethylene (LDPE) microplastics were produced by irradiation of virgin films following mechanical fragmentation. The fragments with size ranging from 250 μm to 2 mm were selected for subsequent microcosm experiments. Incubation for 120 days in seawater inoculated with two marine communities, Agios, acclimatized to utilizing plastics as a carbon source, and Souda, as was collected at the Souda bay (Crete, Greece), resulted in biofilm formation by polyethylene (PE) degraders. Monthly FTIR (Fourier-transform infrared spectroscopy) examination of the samples revealed changes in the chemical structure of the surface of the polymers. Dynamic light scattering (DLS) was employed and nano- and microparticles with sizes in the range between 56 nm and 4.5 μm were detected in the seawater of inoculated microcosms. It was thus demonstrated that weathered plastics particles can biodeteriorate and biofragment as a result of biofilm attachment, resulting in the production of nanoplastics due to microbial activity.

Graphical Abstract

1. Introduction

Plastics are high molecular weight polymers with excellent chemical and physical properties. Due to improper waste management schemes, accumulation of plastics in marine, freshwater, and terrestrial environments keeps on increasing [1]. A large quantity of plastic particles ends up in the marine environment; 270,000 t of plastics have been estimated to float in the world’s oceans, with current convergence areas being most heavily affected such as the ocean gyres, and enclosed water bodies, like the Mediterranean Sea [2,3].
Plastics contribute to about 80 to 85% of marine litter [4] while fragments constitute the majority of marine plastic litter in terms of abundance in the ocean [5]. Particle size distributions follow a power law for fragments while the maximum is frequently observed at ~1 mm [6]. Based on the production process, microplastics (MPs) can be divided into primary when they are fabricated as such and secondary MPs as a result of fragmentation [7]. When plastics are immersed in the marine environment, they undergo ageing and size transformations due to abiotic and biotic processes. Exposure to ultraviolet (UV) radiation at simulated coastal conditions, followed by mechanical abrasion resulted in the production of thousands of secondary plastic [8].
In turn, fragmentation favors biodegradation since it increases the surface to volume ratio [9]. Moreover, the fragmented plastics have also reduced molecular weight and therefore biodegradation can more readily occur [10]. In general, plastic degradation is accomplished by the synergy of abiotic factors and microorganisms [11]. Microbial degradation of plastic particles involves steps such as colonization, biodeterioration, biofragmentation, assimilation, and mineralization [12]. Biofilm formation through the microbial adhesion and production of various proteins and polysaccharides results in significant physicochemical alterations on the surface. Biofragmentation of plastics as a result of primarily enzymatic activity follows. Until now, the generation of NPs referred to as particles with the largest dimension below 1 μm, has been demonstrated as part of the degradation of plastic particles mainly due to UV irradiation [13,14] while no studies have demonstrated the presence of NPs due to microbial activity.
Few studies have demonstrated the ability of marine as well as terrestrial microorganisms to degrade plastics [15,16], while the information concerning the degradation of weathered plastics is scarce [17,18]. The aim of this study was to investigate the effect of one acclimated (Agios) and one indigenous (Souda) marine community on the physicochemical properties of PE (HDPE and LDPE) secondary MPs in marine microcosms. The colonization process was investigated in conjunction with the monitoring of the impact on the chemical properties of the surface of secondary MPs, toward understanding the generation of and NPs.

2. Materials and Methods

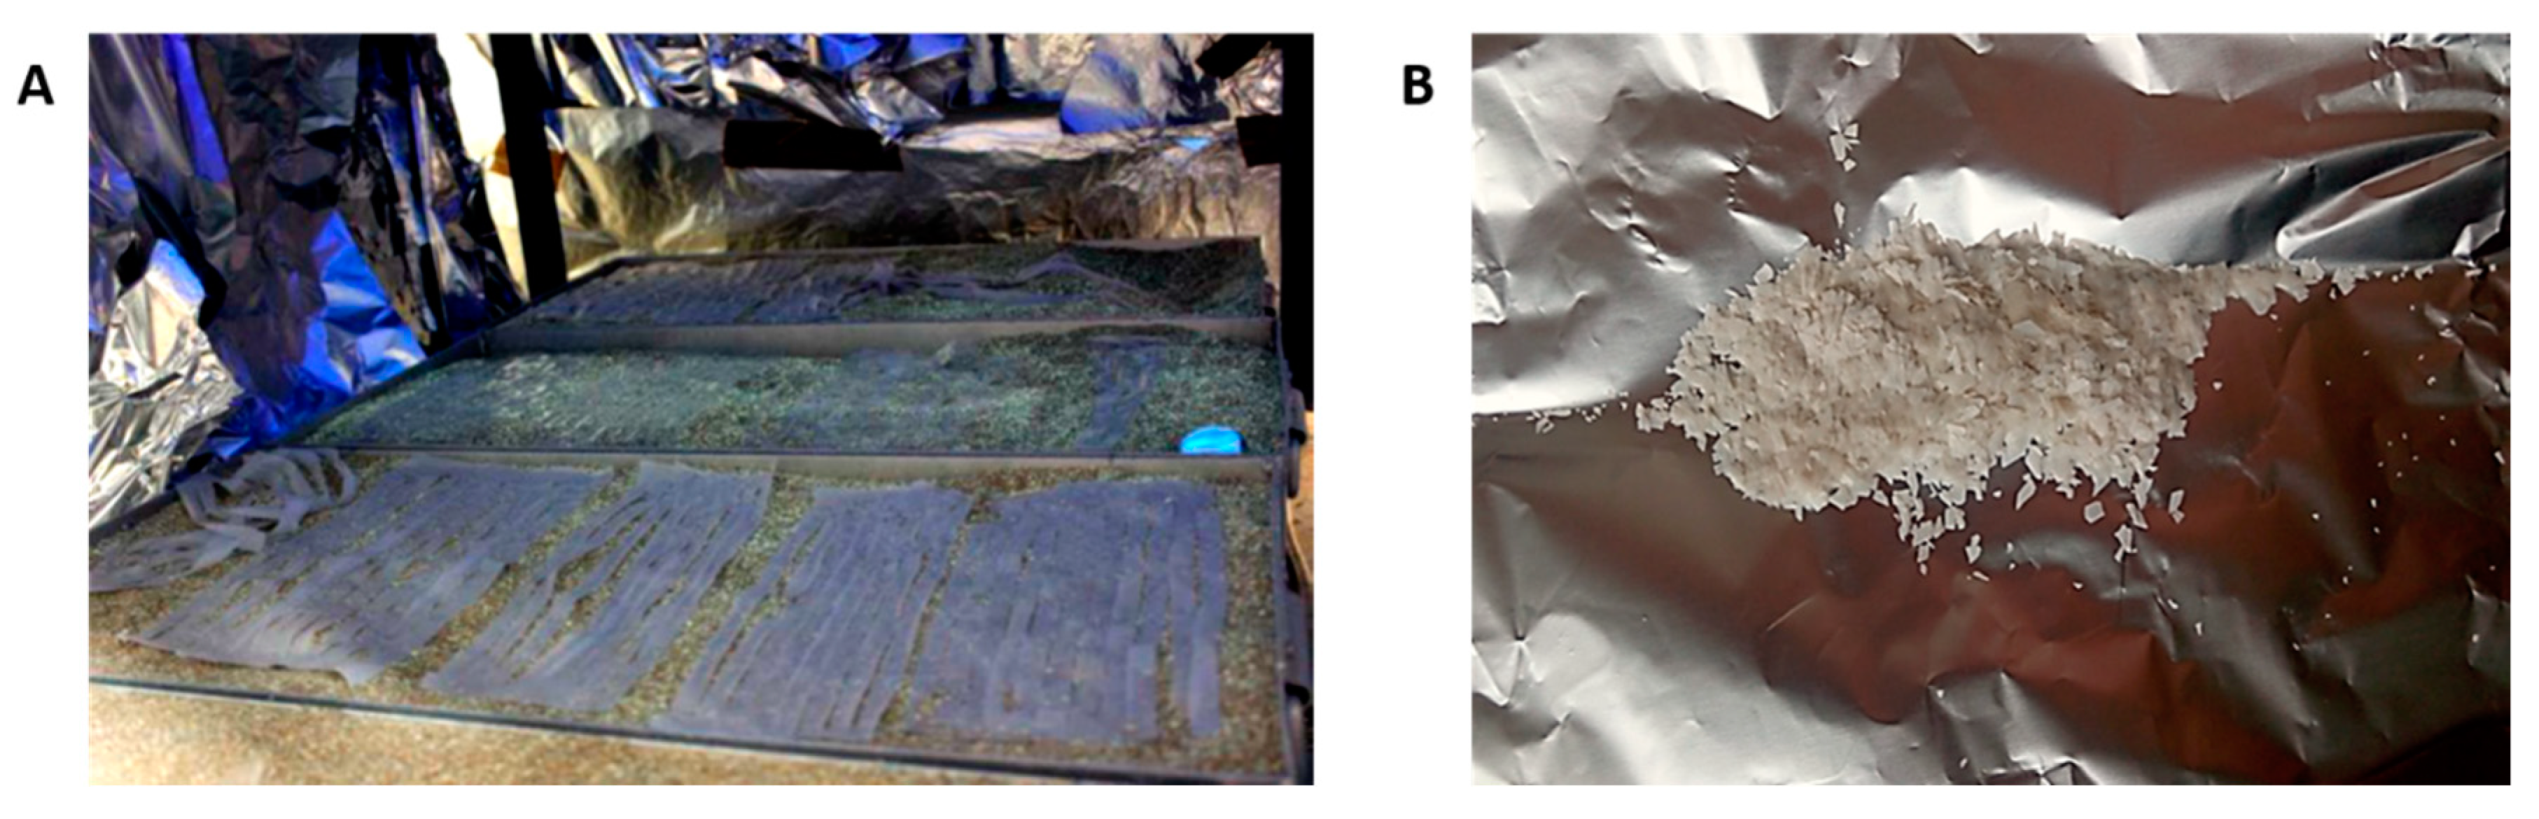
2.1. Materials/ Generation of Secondary MPs

High-density polyethylene (HDPE) and low-density polyethylene (LDPE) films with a thickness of 0.1 mm were obtained from Plastika Kritis S.A. (Heraklion, Greece). They were cut in strips with dimensions 10 cm × 1 cm and exposed to artificial UV-A radiation using 6 Sylvania F36 T8 BLB lamps (emission spectral peak at 365 nm). Irradiation was performed in a closed sand system (Figure 1) for a period of time until application of mild mechanical stress would cause fragmentation. The temperature of the system and the amount of radiation were monitored constantly using two Onset HOBO Temperature Light 3500 DP Loggers.
Sufficient fragmentation was observed in HDPE and LDPE films after 5 and 7 months of irradiation, respectively. Complete fragmentation was achieved by the application of mild mechanical stress in rotating borosilicate glass bottles containing sieved sand [19]. The plastic fragments went through a size exclusion process, employing two sieves with pore sizes of 2 mm and 250 μm. Fragments of the desired size (250 μm–2 mm) were weighed and separated in 50 ± 2 mg groups. The samples were sprayed with a 70% water~ethanol (completely denatured with 1% ethyl methyl ketone, 1% isopropyl alcohol, 1 g/100 L denatonium benzoate, Merck, Kenilworth, NJ, USA) solution for sterilization and left to dry in an incubator at 37 °C for 3 days prior to placing them in the seawater microcosms.

2.2. Biodegradation Assays

2.2.1. Marine Communities

Two different marine consortia were used in this study to assess their degradation ability. The community “Agios” is an acclimated consortium, previously developed in previous studies, capable of degrading PE films. The community consists predominantly of the phyla of Proteobacteria (Alphaproteobacteria and Gammaproteobacteria), Bacteroidetes, and Actinobacteria. Additionally, the expression of the alkB gene, which has been linked to both hydrocarbon and plastic polymer biodegradation, has been observed [20]. An indigenous community collected from Souda bay (Crete, Greece) was also exploited. For the isolation of the indigenous community, seawater was collected from Souda bay and was cultured in Erlenmeyer flasks containing 200 mL of DSMZ 453 medium for 7 days at 25 °C in the presence of PE films. The biofilm attached on the films was harvested by gently scraping the surface of the films and cultured anew in DSMZ 453 medium. The community was removed from the culture medium by centrifugation, diluted in sterile seawater, and used for inoculation of the biodegradation experiments (“Souda”).

2.2.2. Experimental Design

A microcosm experiment was conducted in sterilized flasks in triplicate using HDPE and LDPE secondary MPs as the sole carbon source. A total of twelve flasks per treatment were employed. In each microcosm, 50 mL sterile enriched filtered seawater, 50 mg sterile PE fragments along with the consortia (starting concentration: 105 cells mL−1) were added. Sampling occurred at the end of each month by permanently removing 3 flasks per treatment. The experiment was conducted in 25 °C in darkness, under continuous shaking at 120 rpm and lasted for 4 months. Abiotic controls, containing sterile enriched filtered seawater and sterile PE fragments, were incubated for the same period of time in the dark, so as to avoid photodegradation.

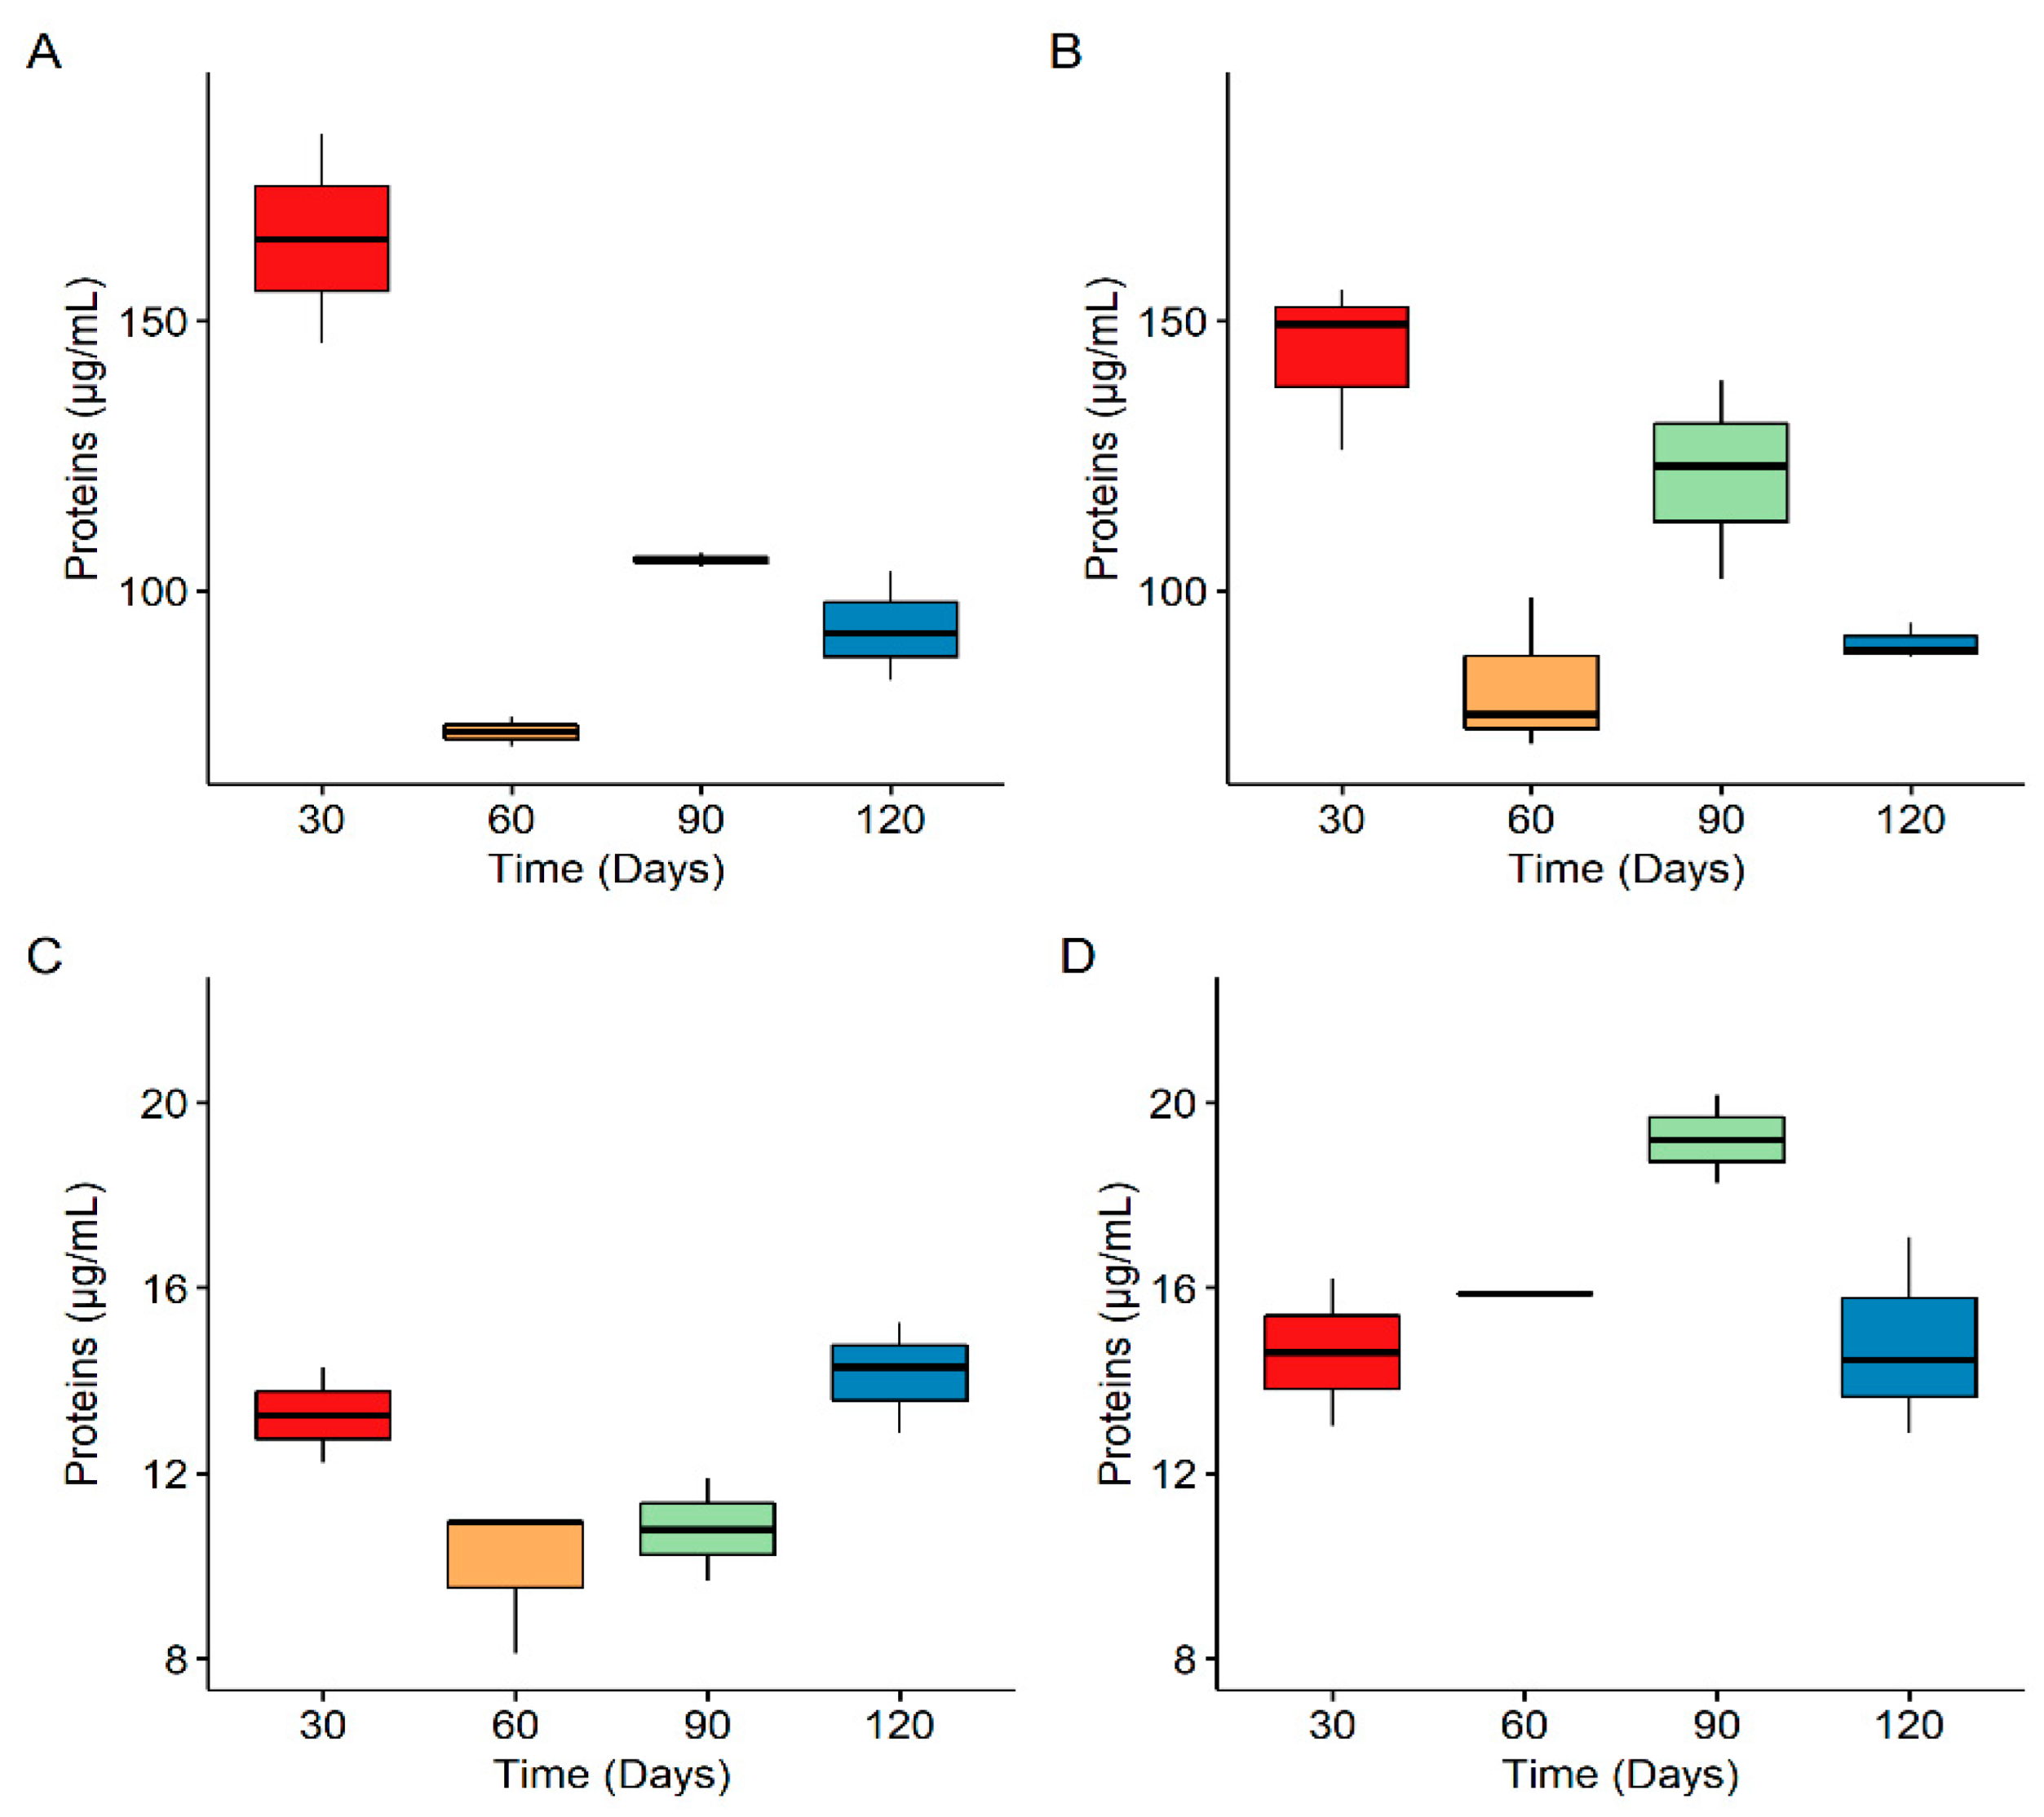
2.2.3. Viable Cell Concentration and Extracellular Polymeric Substances

Pieces of 250 μm plankton mesh were used for the capture of the PE secondary MPs from the flasks. All the particles retained within the mesh were subsequently washed with 2% w/v sodium dodecyl sulfate (SDS) in order to remove the biofilm from the surface. The biofilm cells were serially diluted and spread on rich medium plates (DSMZ 453) in order to estimate the cell concentration, along with protein measurements. The concentration of proteins was determined according to the modified Lowry Protein Assay Kit protocol [21].

2.3. FTIR

The chemical structure alterations of the samples were examined using Fourier-transform infrared spectroscopy (FTIR). A small quantity of each sample (3–5 mg) was incorporated in KBr pellets in a 1:10 ratio. The spectra were obtained using a Frontier FTIR spectrometer (PerkinElmer, Waltham, MA, USA) and analyzed using Spectrum software (PerkinElmer, Waltham, MA, USA). For each sample 64 scans were performed, with a scan resolution of 4 cm−1 in the 4000–450 cm−1 absorbance range. Chemical changes on the surface of the microplastics were monitored monthly, by calculating the following indices using the absorbance values from the respective spectra [22]:
K e t o   C a r b o n y l   B o n d   I n d e x   ( K C B I ) = A 1715 A 1465
E s t e r   C a r b o n y l   B o n d   I n d e x   ( E C B I ) = A 1740 A 1465
V i n y l   B o n d   I n d e x   ( V B I ) = A 1650 A 1465
I n t e r n a l   D o u b l e   B o n d   I n d e x   ( I D B I ) = A 908 A 1465

2.4. Nanoparticle Detection–Light Scattering

The presence of plastic particles of micro or nano scale in the microcosms was investigated monthly using dynamic light scattering (DLS), with a SALD-7500nano particle analyzer (Shimadzu, Japan). Following the measurement of a blank sample of fresh seawater, a volume of 5 mL of seawater from the mesocosms was analyzed using WingSALD II version 3.1.1 in terms of both volume and number of particles every month. DLS results are reported as particle diameter in μm versus number of particles or volume of particles. While the former allows for maximum concentration sensitivity, the latter provides information on larger particles that are not well represented in the samples in terms of number.

2.5. Data Analysis

Statistical analysis of the data was implemented using R version 4.0.0 (R Core Team, Vienna, Austria) in the environment RStudio version 1.3.959. Data normality was conducted using the Shapiro–Wilk test. Depending on data normality, the Kruskal–Wallis non-parametric test and one-way ANOVA were used to detect statistically significant differences between samples. The package ggplot2 was used for data visualization.

3. Results

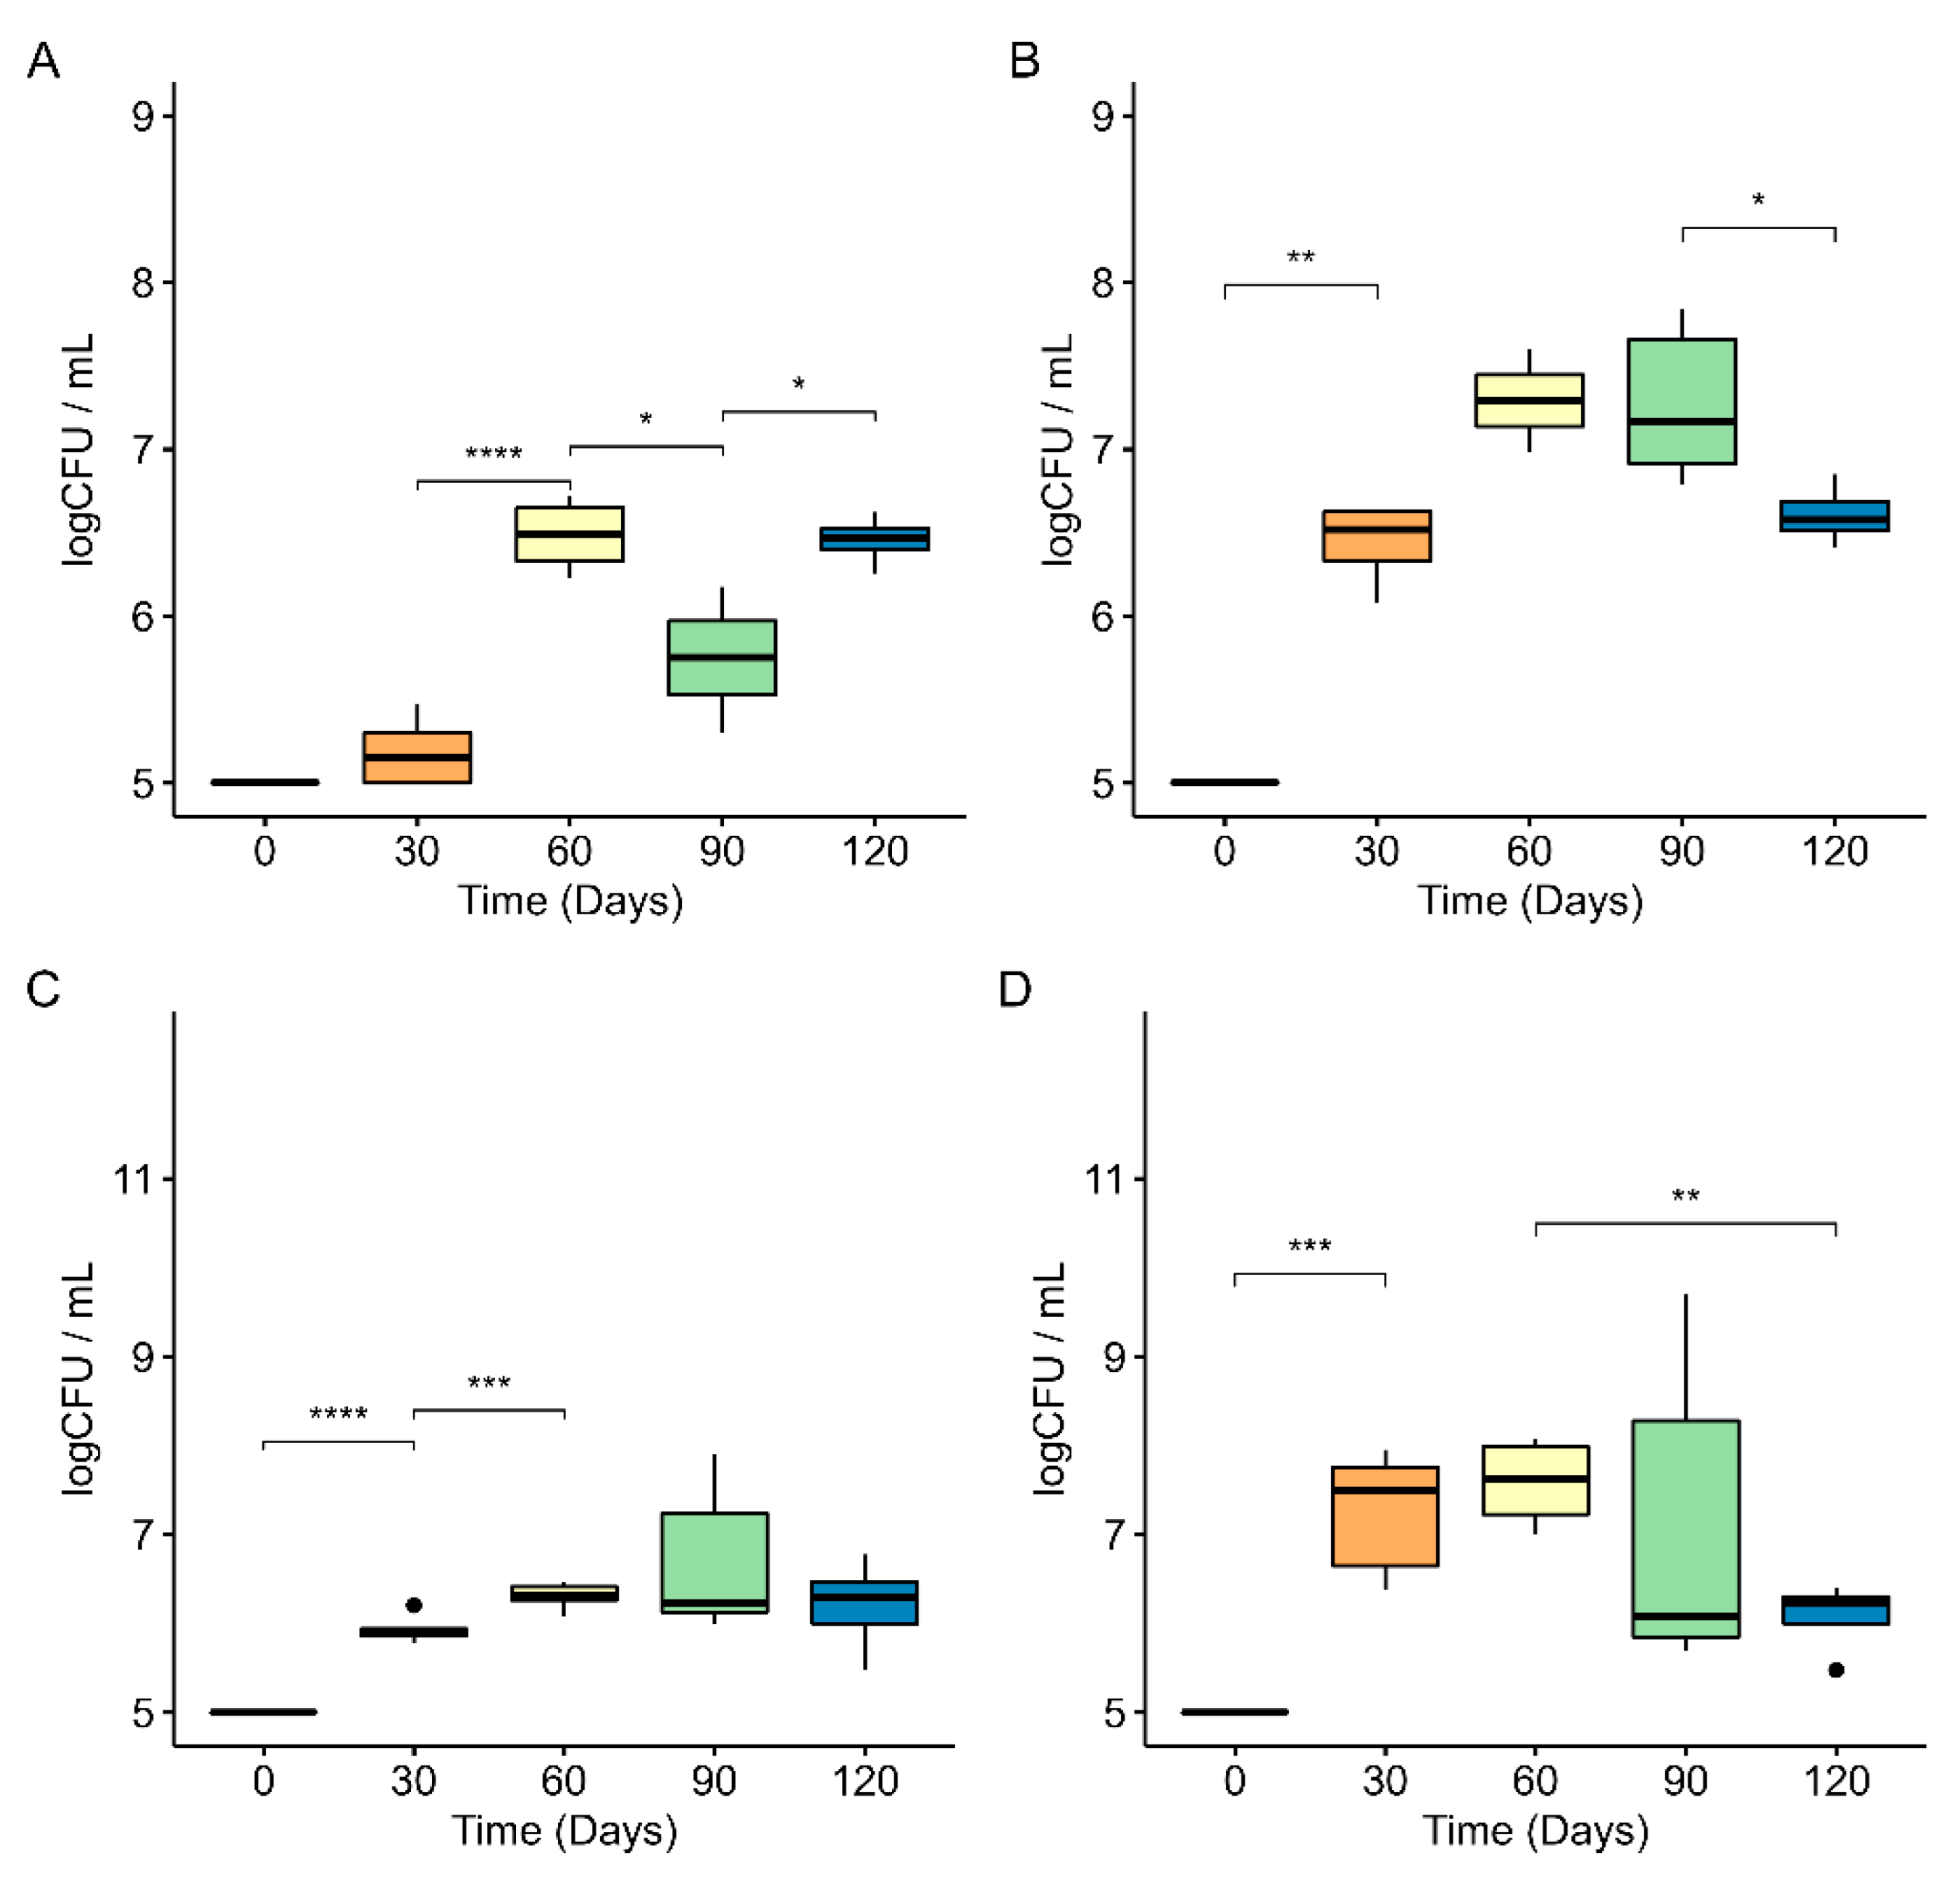
3.1. Biofilm Populations on PE Secondary Microplastics
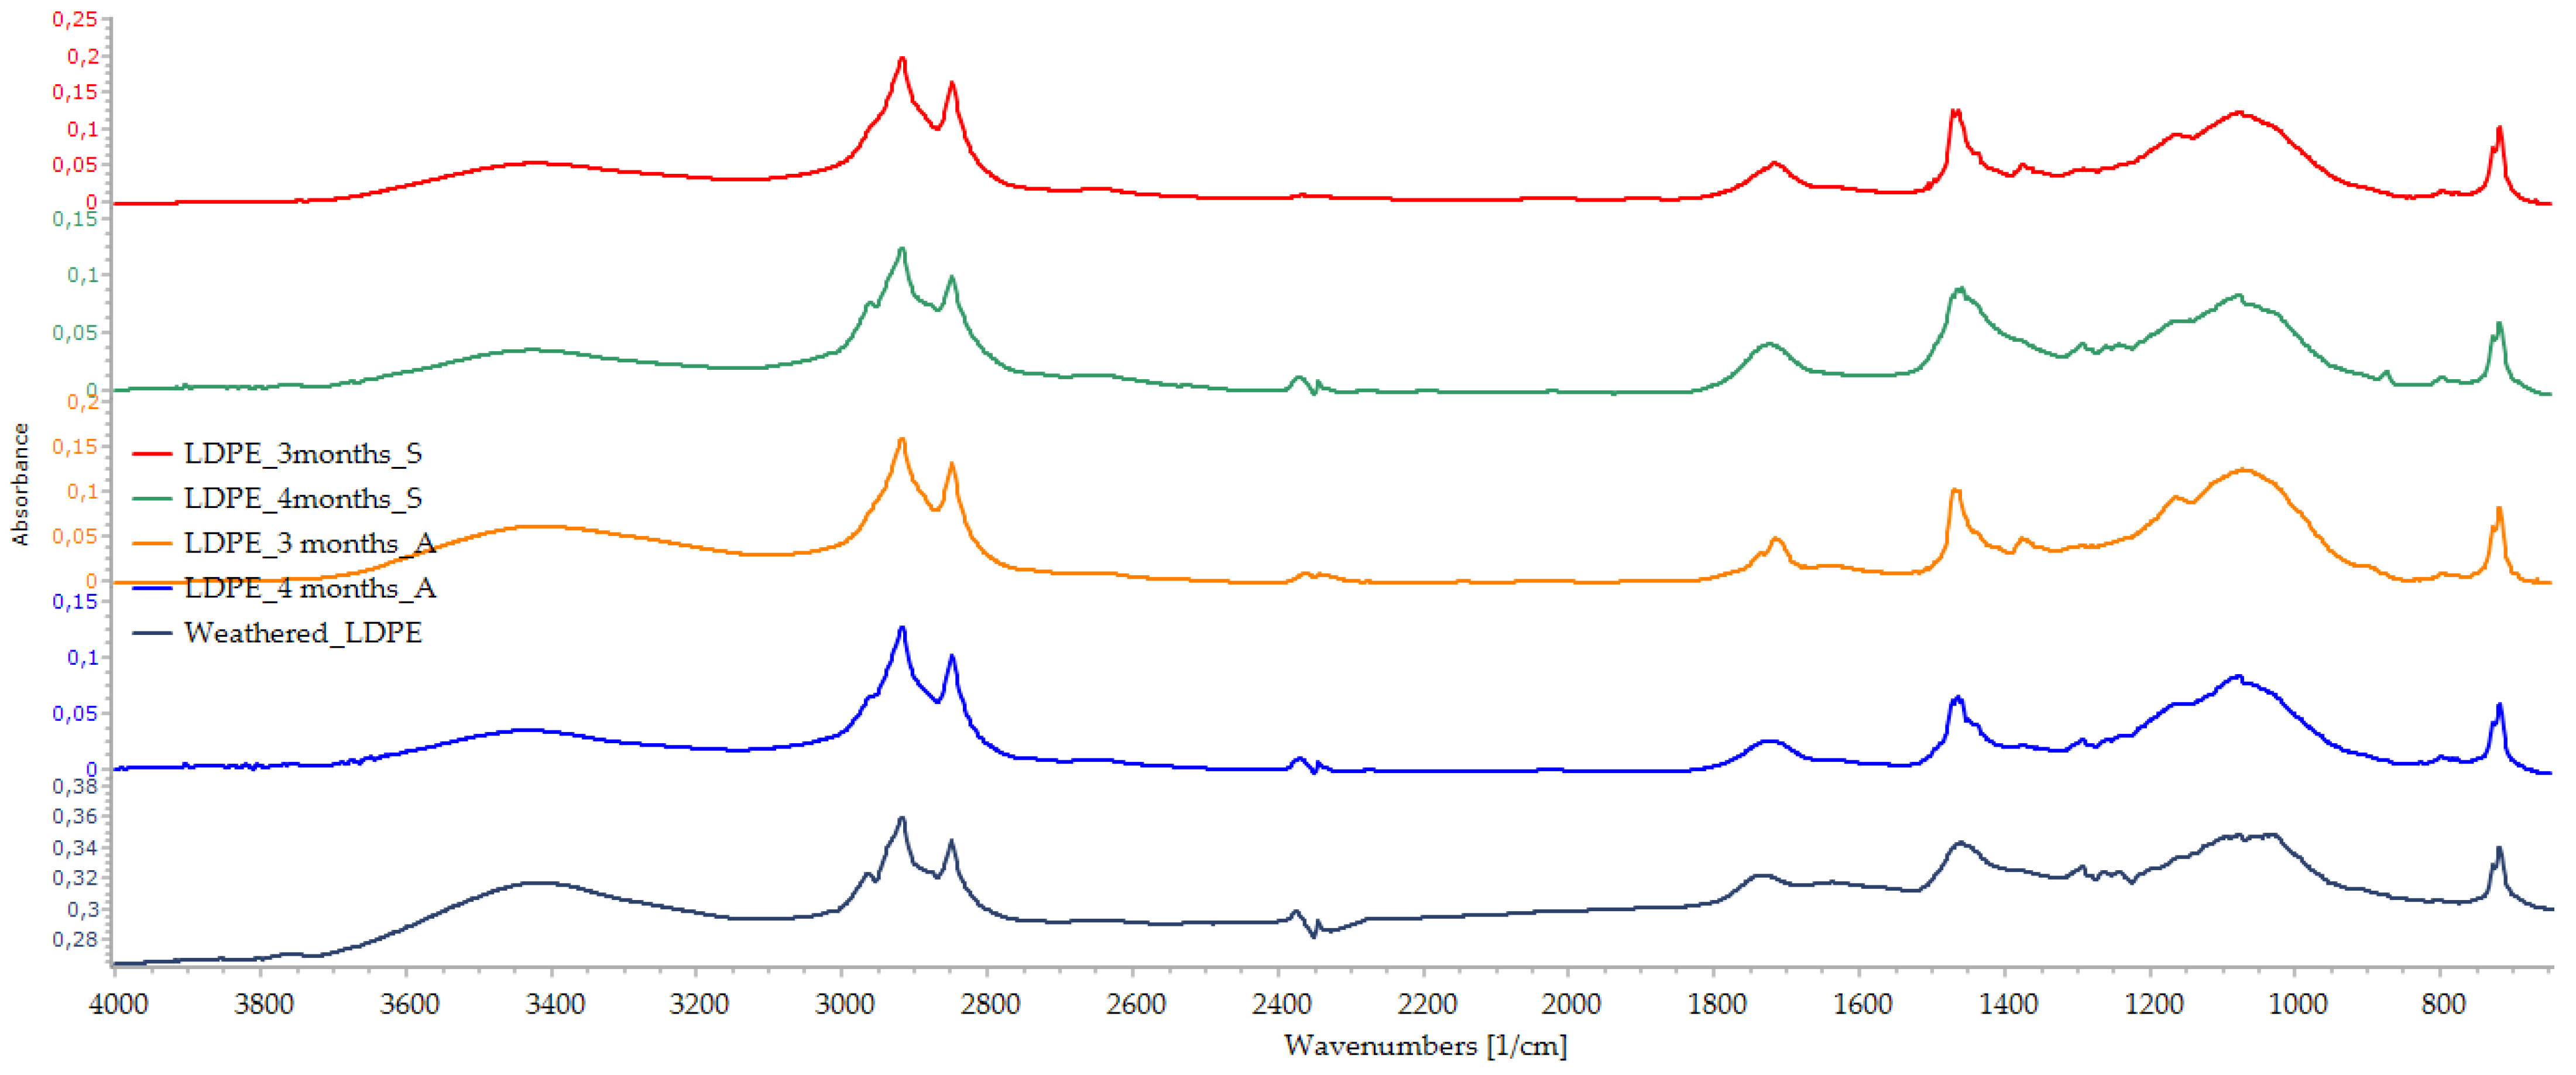
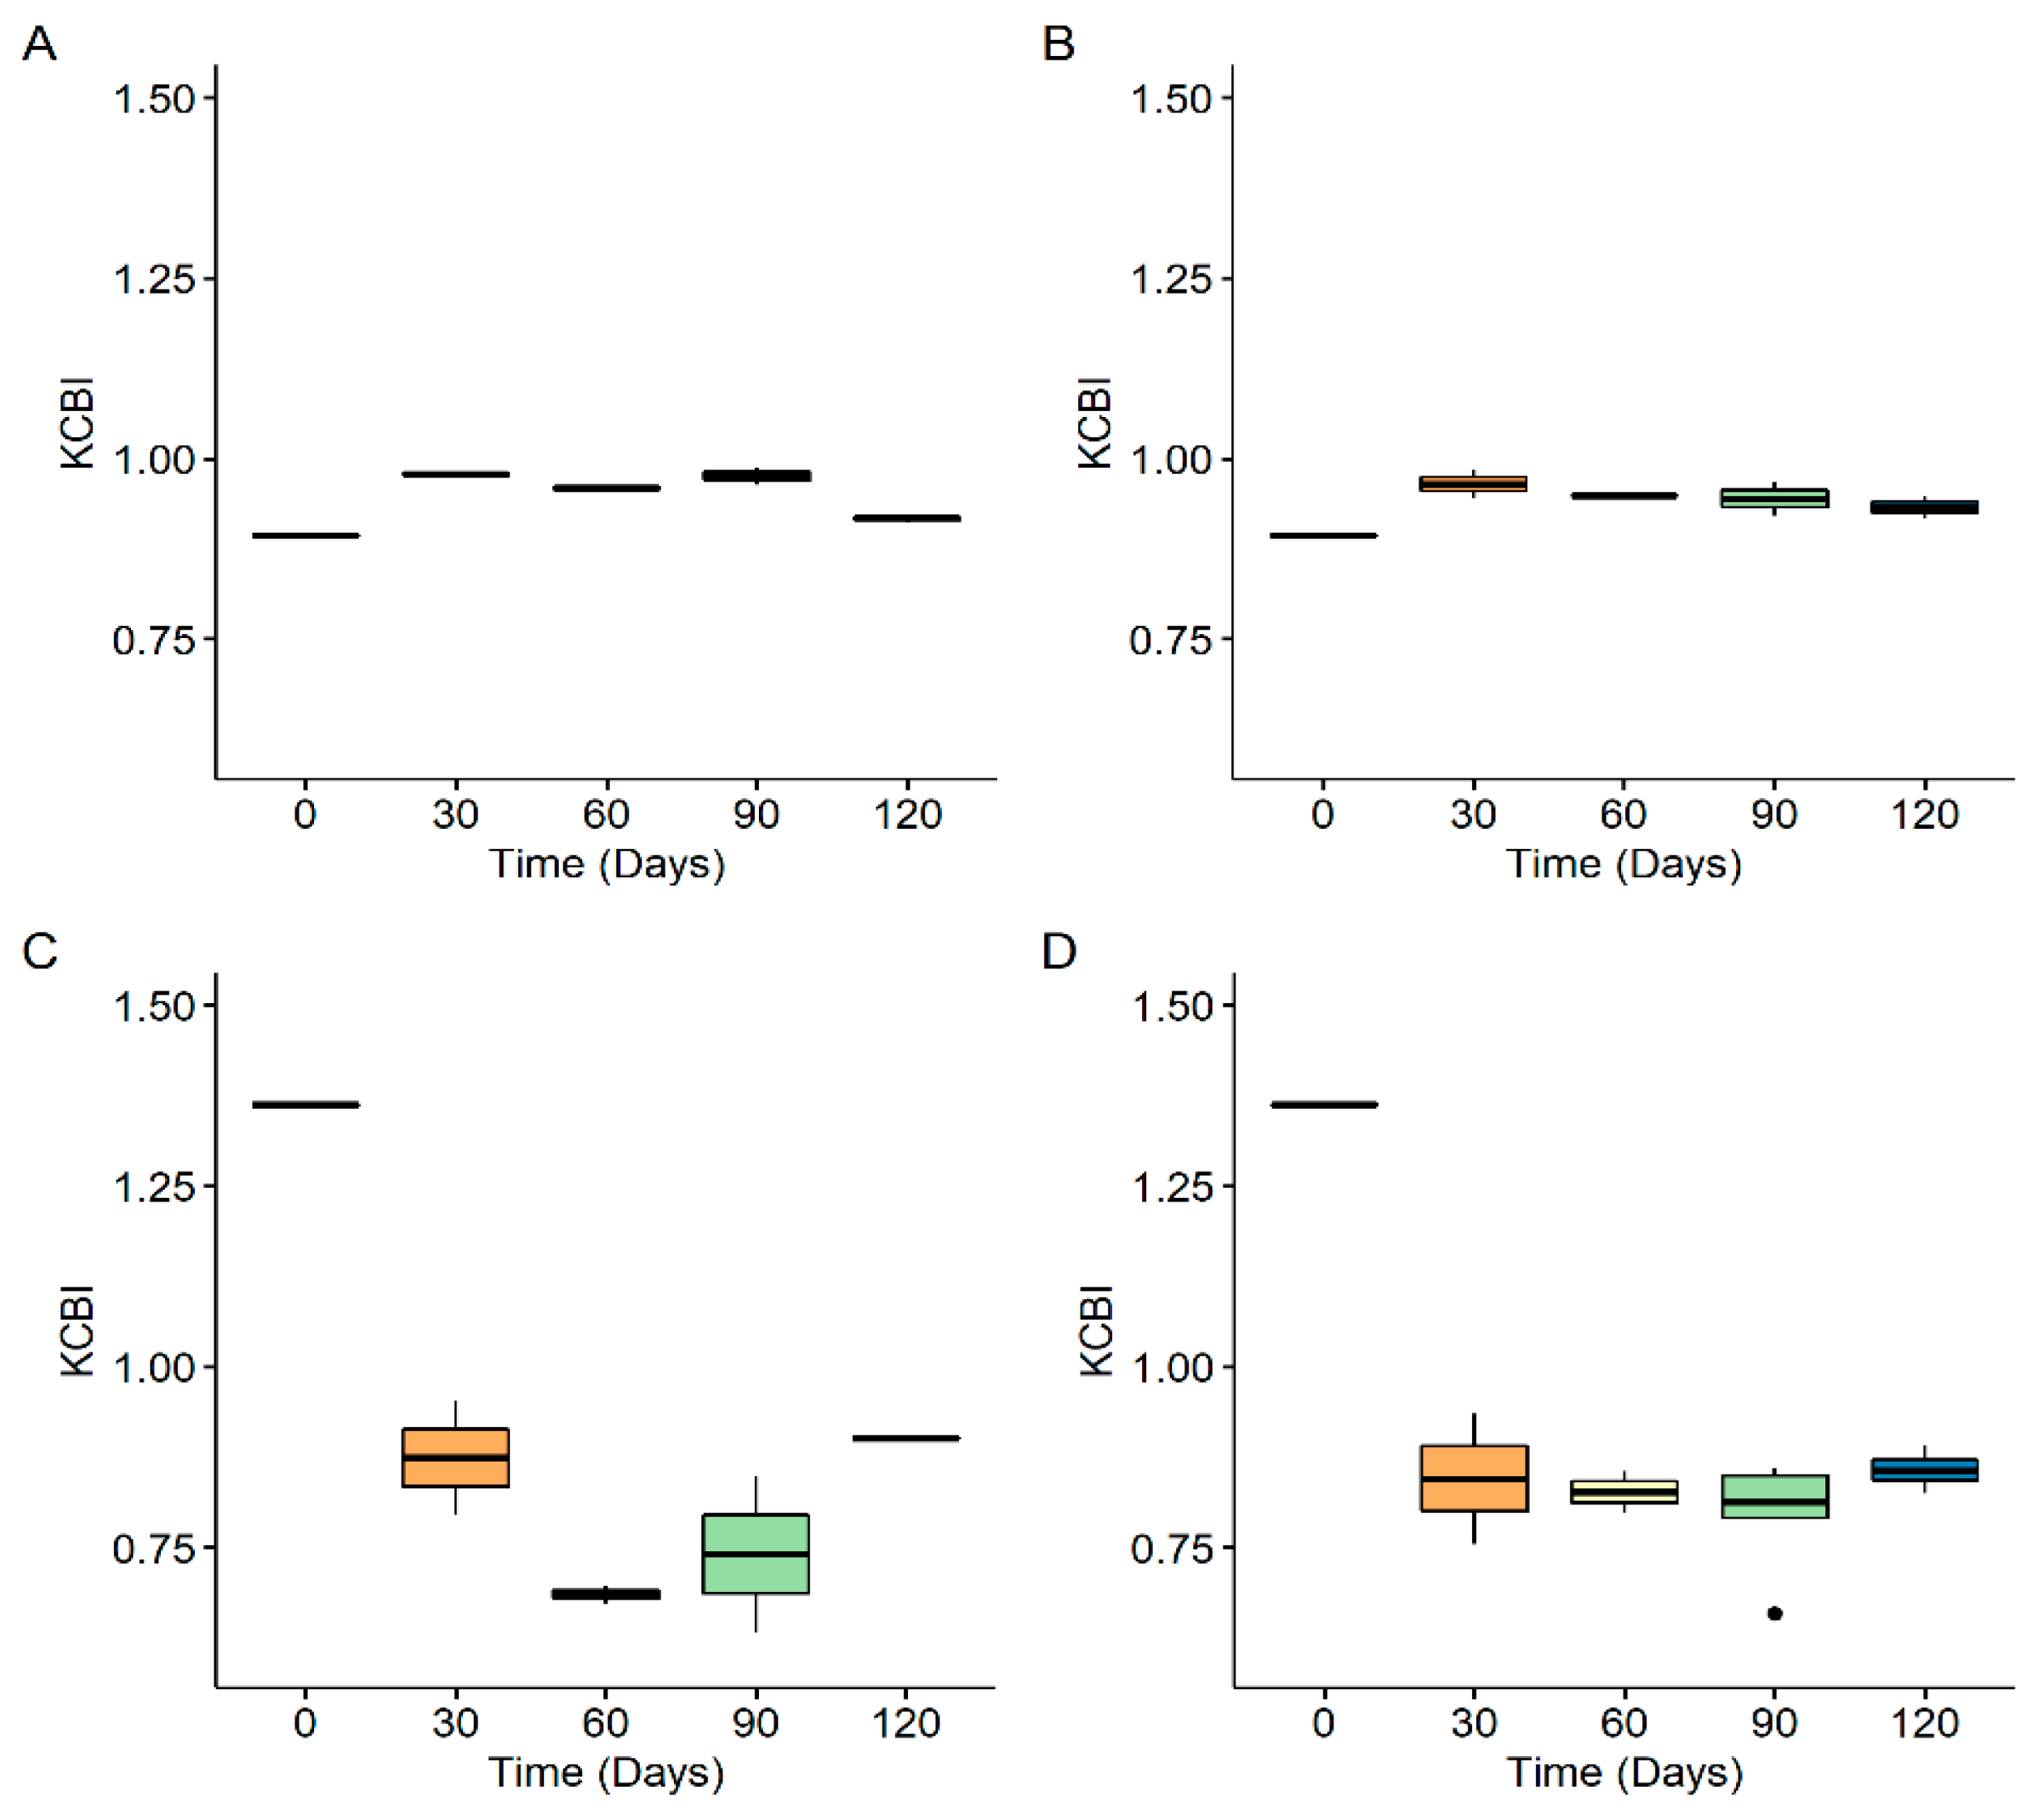
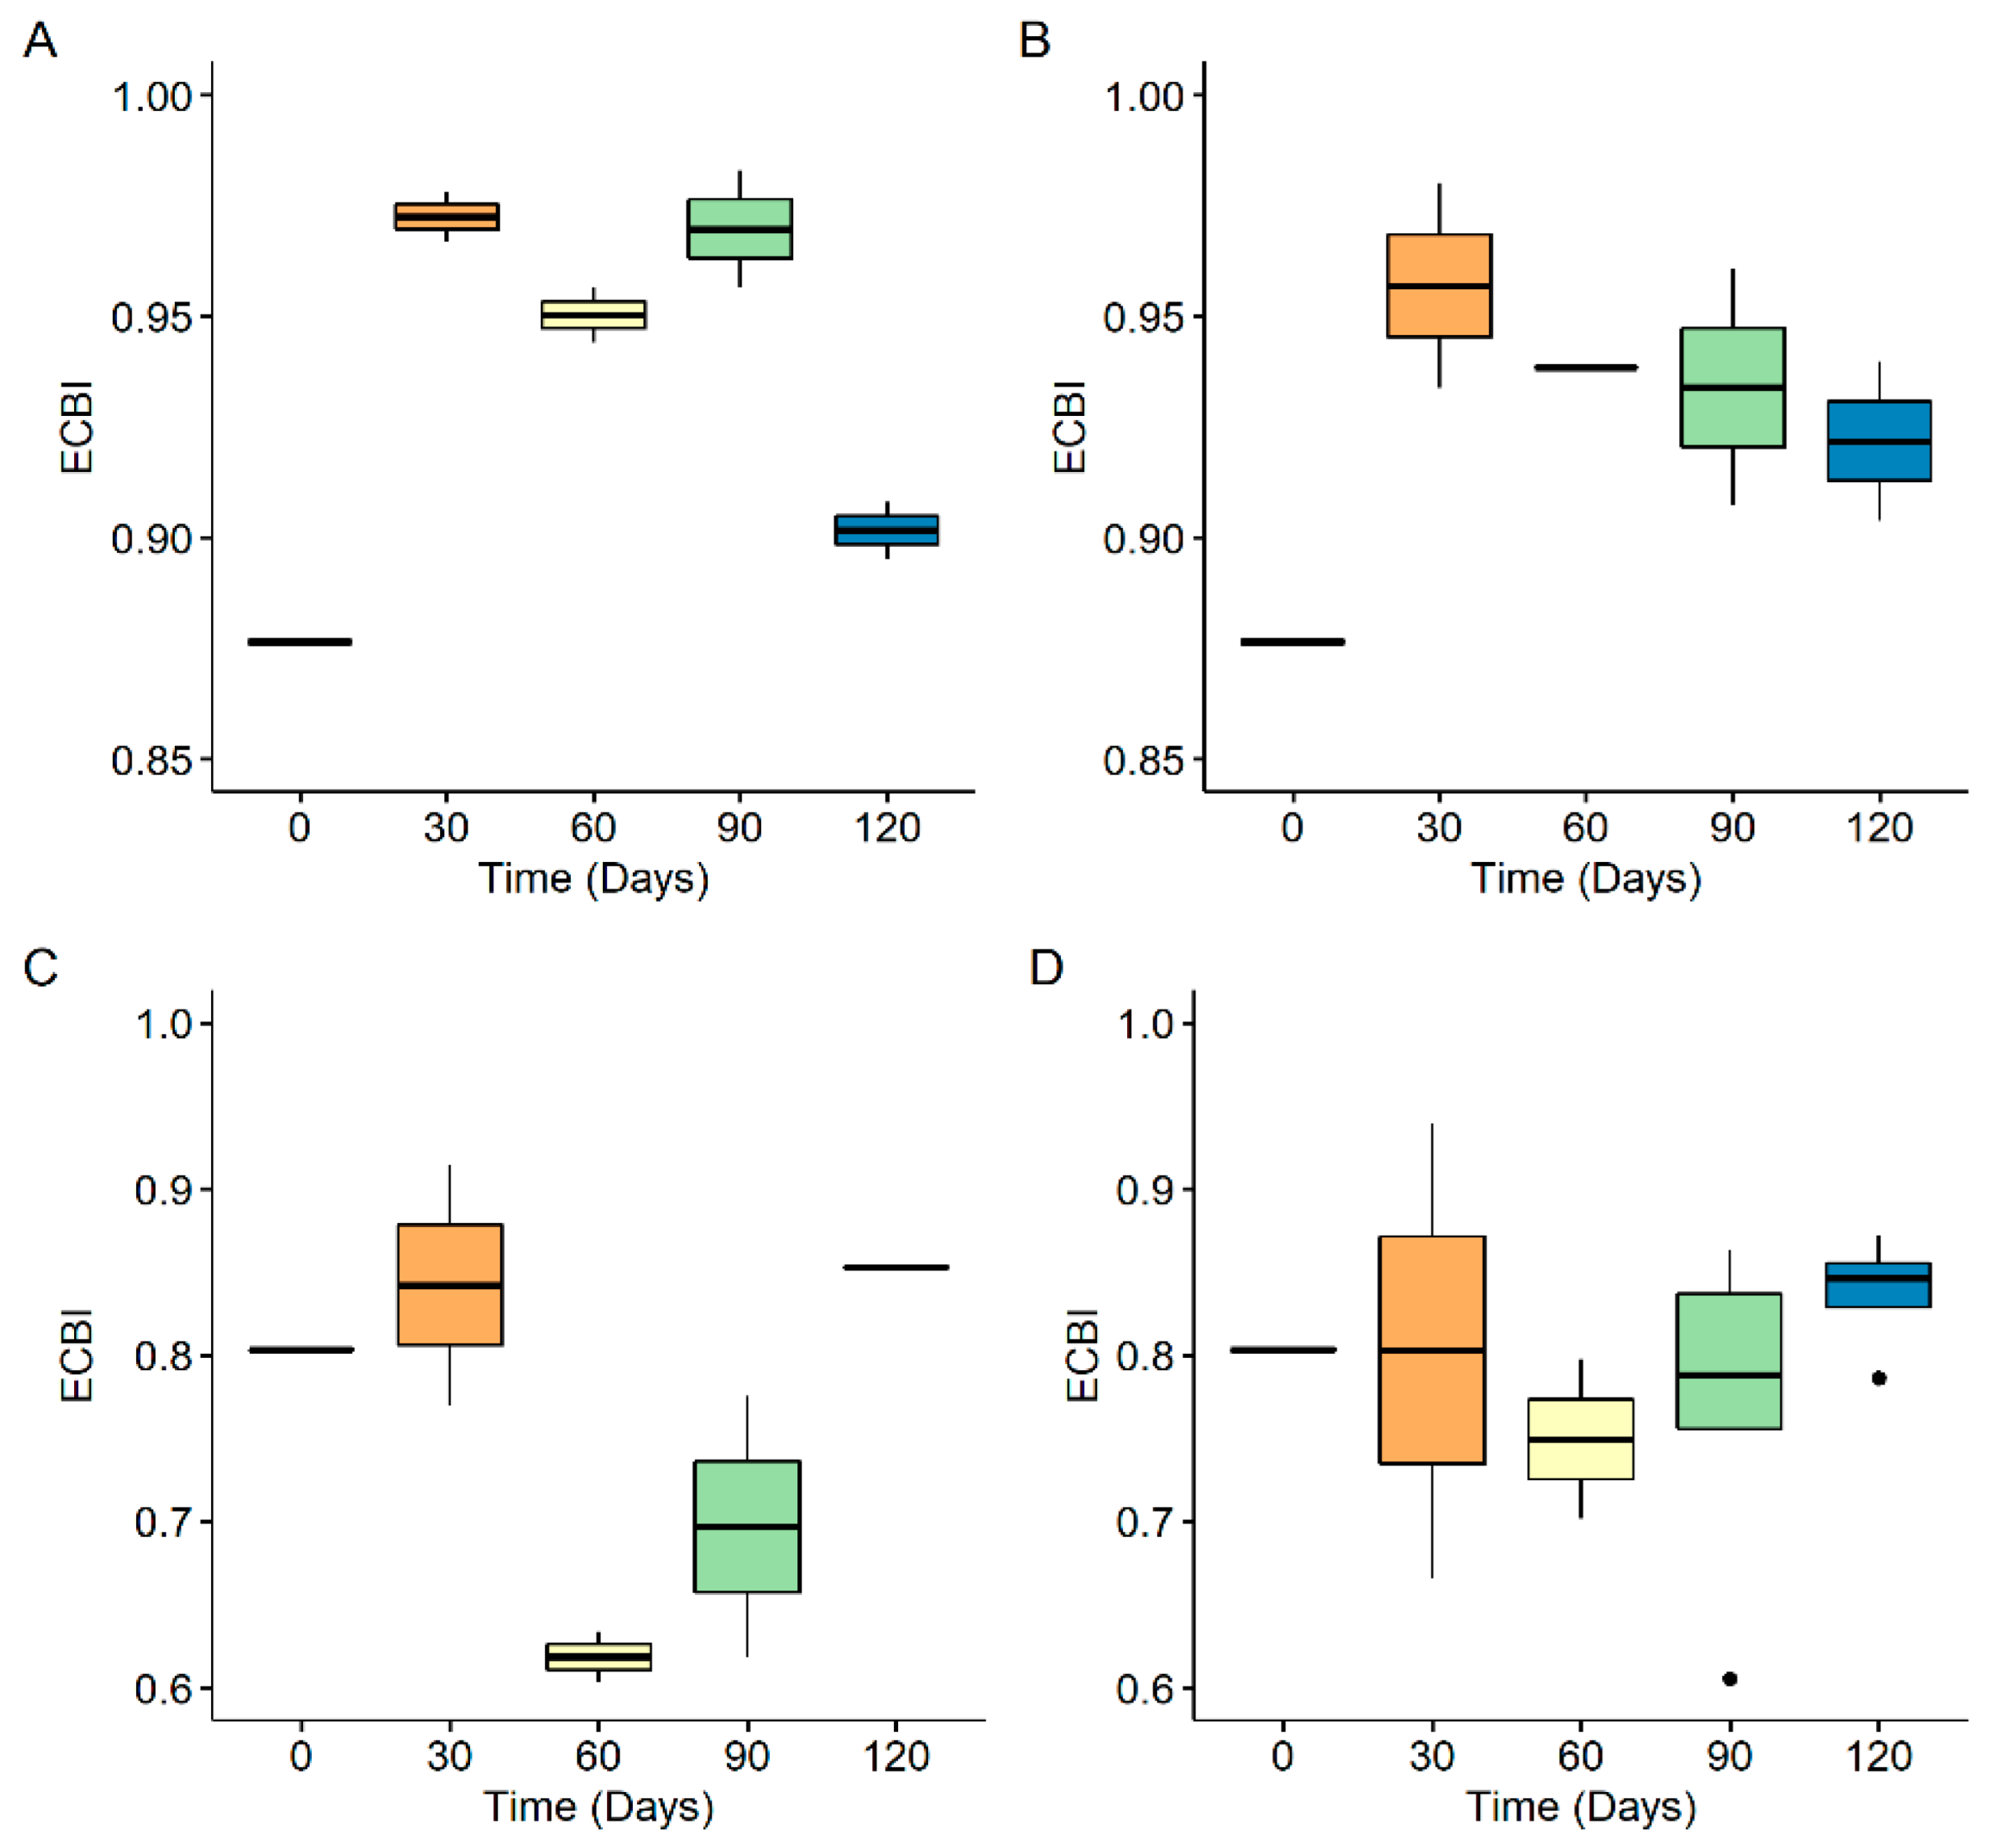
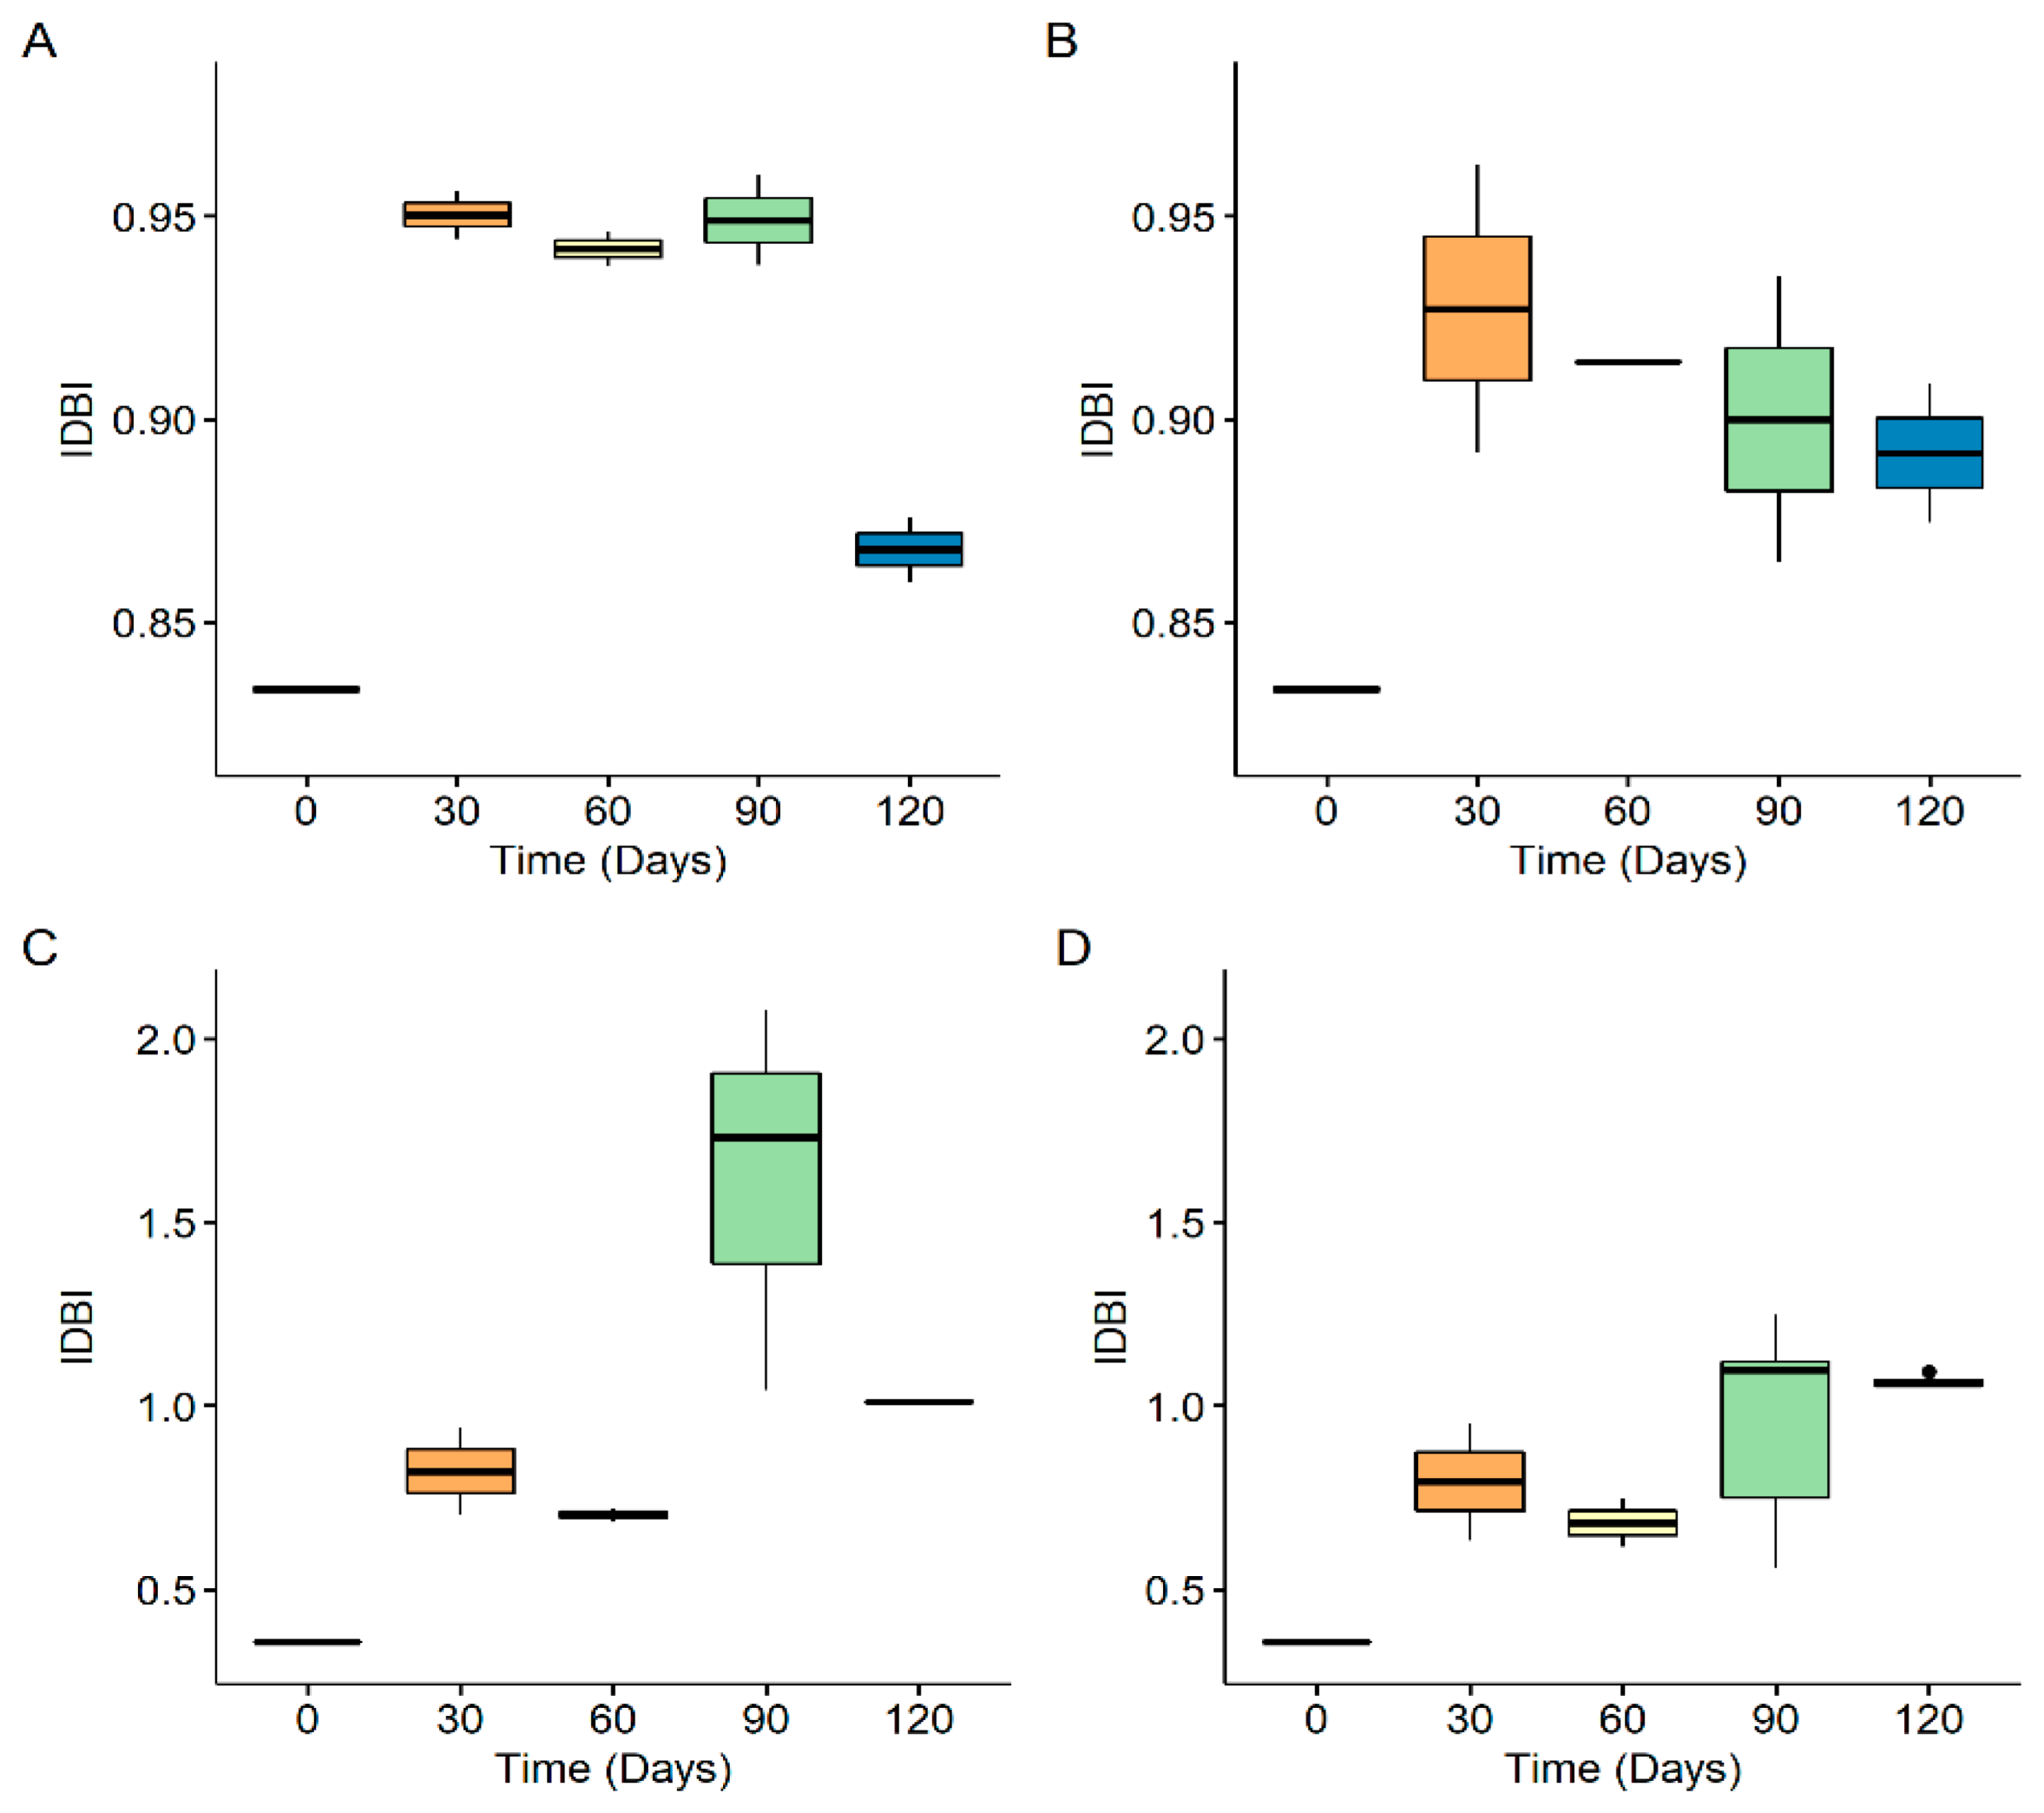
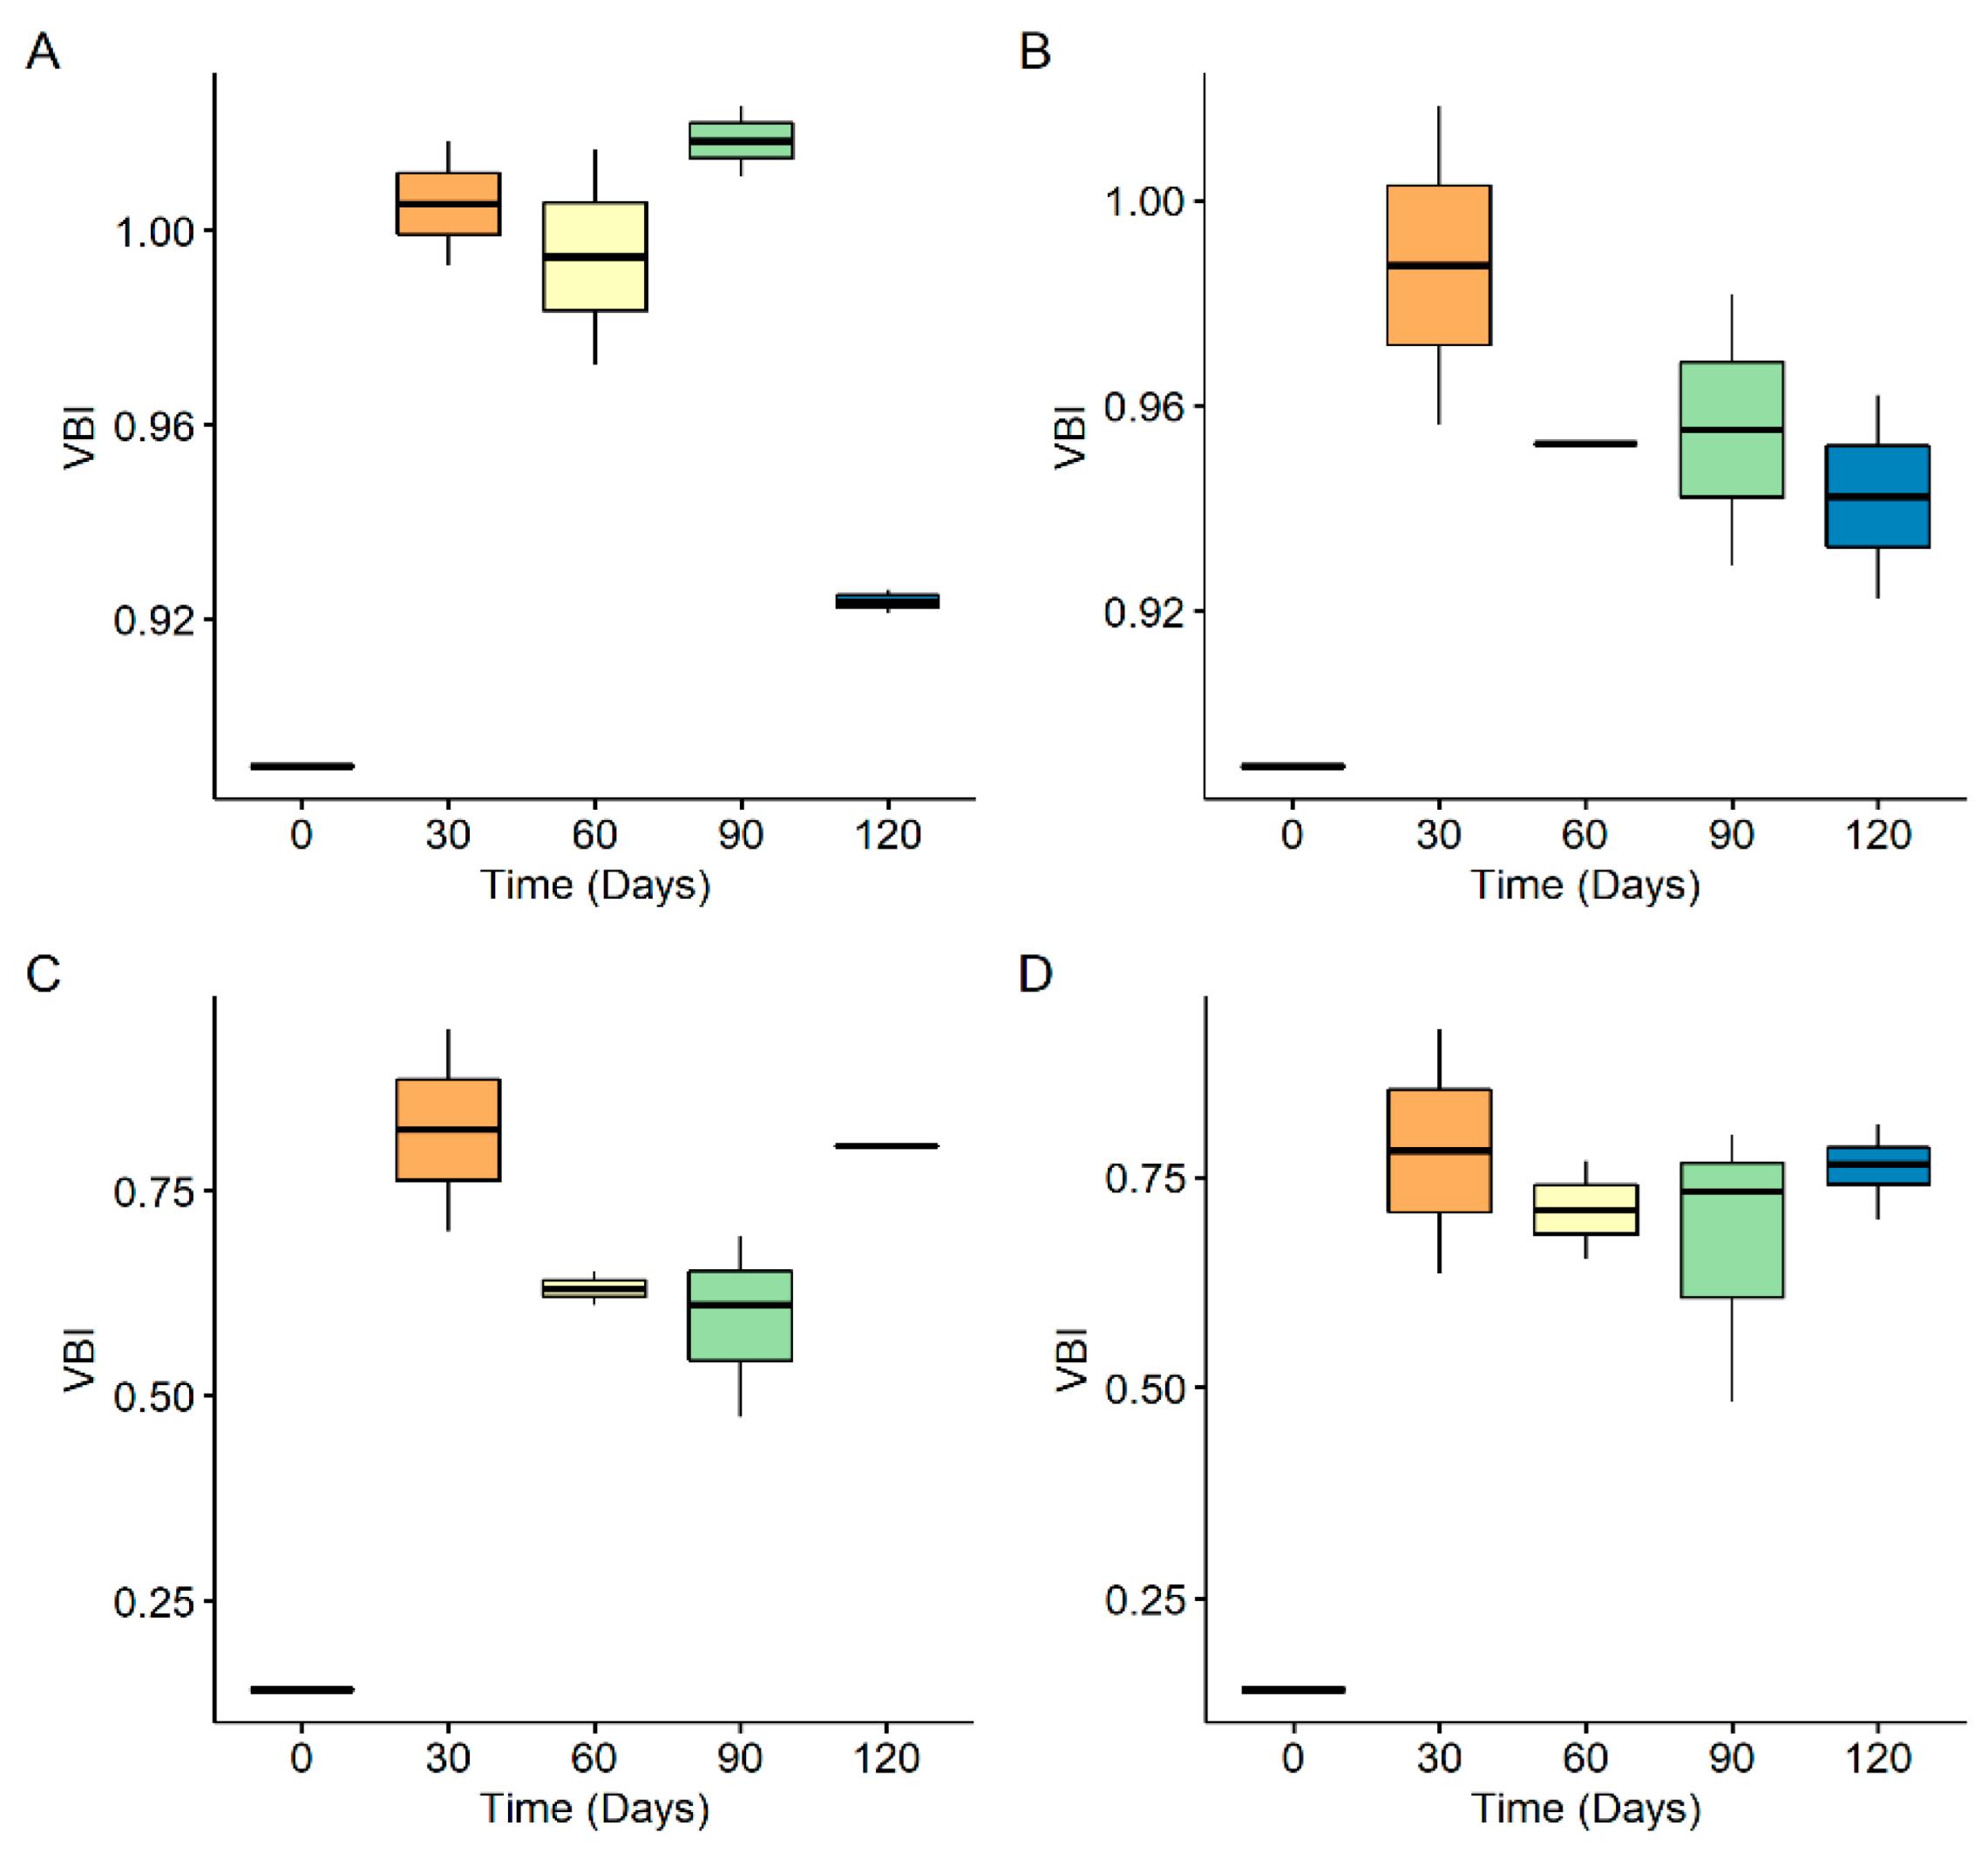
Biofilm populations on the surface of the secondary microplastics increased from the 105 cells mL−1 initially added to the microcosms. Cell abundances in the microcosms inoculated with the acclimated Agios community were consistently higher than those inoculated with the Souda community (Figure 2). The growth observed after 30 days of incubation was statistically significant; the Agios community achieved an average of 1.44 logCFU mL−1 increase (Figure 2B) when utilizing HDPE microplastics as sole carbon source. For LDPE, average increases of 0.93 logCFU mL−1 (Souda community) and 2.26 logCFU mL−1 (Agios community) could be observed in 30 days (Figure 2C,D). The only exception to that pattern was exhibited by the Souda community in microcosms containing HDPE microplastics. While in the first 30 days the cell growth was minimal, statistically significant growth was noted between the 30th and 60th day, reaching an average increase of 1.3 logCFU mL−1. A decrease of 0.74 logCFU mL−1 was followed by an almost equal increase of 0.71 logCFU mL−1 to a final average viable cell concentration of 6.45 ± 0.15 logCFU mL−1 at the end of the incubation period (Figure 2A). The acclimated Agios community behaved similarly, regardless of the type of MPs provided as carbon source. Viable cell concentrations increased for 60 days, reaching maximum average values of 7.29 ± 0.44 logCFU mL−1 and 7.58 ± 0.52 logCFU mL−1 when incubated with HDPE and LDPE respectively. For the remainder of the experiment a decrease of cell concentrations led to final values of 6.61 ± 0.16 logCFU mL−1 for LDPE microcosms and 6.11 ± 0.29 logCFU mL−1 for LDPE microcosms (Figure 2B,D). Souda community cell populations increased until the 90th day up to 6.70 ± 0.76 logCFU mL−1, when a decrease to a final concentration of 6.24 ± 0.38 logCFU mL−1 was observed (Figure 2C). Viable cell concentration evolution over time was statistically significant among all treatments.
Exopolymeric protein concentrations on secondary MPs shown in Figure 3 do not exhibit similar patterns as the biofilm cells. They fluctuate in a similar manner on HDPE microplastics and by the end of the incubation period a definite decrease can be observed. On the other hand, protein concentrations on LDPE microplastics behave not only differently than those on HDPE, but also between the two treatments, reaching marginally higher values than those initially measured at the end of the cultivation period. More specifically, average protein concentrations on the surface of the HDPE secondary microplastics (73.8 ± 3.8–165.2 ± 27.5 μg mL−1) were consistently almost one order of magnitude higher than those on LDPE (10.0 ± 1.6–20.7 ± 6.8 μg mL−1). The high average protein concentrations observed for the Souda community (165.2 ± 27.5 μg mL−1; Figure 3A) and for the Agios community (143.7 ± 15.6 μg mL−1; Figure 3B) on HDPE microplastics after 30 days of incubation were followed by a steep decrease on the 60th day (73.8 ± 3.8 μg mL−1 for the Souda community and 82.4 ± 14.3 μg mL−1 for the Agios community). The increase in protein concentration that can be noted on the 90th day (105.7 ± 1.7 μg mL−1 for the Souda community and 82.5 ± 14.3 μg mL−1 for the Agios community) does not restore the concentrations to the initially measured maximum values. The average values decreased further in the time resulting in final protein concentrations of 93.0 ± 10.1 μg mL−1 for the Souda community and 90.3 ± 3.3 μg mL−1 for the Agios community. The proteins on the surface of LDPE samples incubated with the Souda community decreased, as previously seen on HDPE, however more gradually from 13.2 ± 1.5 μg mL−1 on the 30th day to 10.0 ± 1.6 μg mL−1 on the 60th day (Figure 3C). From that point on, average concentrations increased marginally to 10.8 ± 1.6 μg mL−1 on the 90th day and finally reached 14.1 μg mL−1 at the end of the experiment. The average protein concentrations measured on LDPE microplastics, following incubation with the Agios community exhibited a gradual increase from 14.6 ± 2.2 μg mL−1 on the 30th day to 19.2 ± 1.3 μg mL−1 on the 90th day and finally decreased to 14.8 ± 2.1 μg mL−1 at the end of the experiment (Figure 3D). It should be noted that the differentiation of protein concentration values was not statistically significant between samplings. The differences observed between the two LDPE treatments were statistically significant (p = 0.002), but this was not the case for HDPE (p = 0.808). Finally, the different PE types affected the protein concentration on the surface in a statistically significant manner; comparison between HDPE and LDPE samples for the Souda community revealed statistically significant differences (p = 0.0003 and p = 6.8 × 10⁻⁶).

3.2. FTIR

The FTIR spectra of secondary LDPE microplastic samples at the beginning of the incubation period (Weathered_LDPE) and after 90 and 120 days of incubation with each community (LDPE_3months_S, LDPE_4months_S, LDPE_3months_A, LDPE_4months_A) are shown in Figure 4. As seen the broad stretching hydroxyl (O-H) peak visible in the range 3200–3600 cm−1 of the LDPE microplastics was smoothed as incubation progressed, regardless of the community. The carbonyl (C=O) peak at 1708 cm−1 was sharpened and higher absorbance values were observed as incubation progressed. Finally, the carbon oxygen (C-O) peak at 1163 cm−1, which cannot be detected on the initial LDPE microplastics, was most visible after 90 days of incubation with both the Souda and Agios community, and was smoothed out on the 120th day.
HDPE microplastics initially used for the microcosms had an average keto carbonyl bond index (KCBI) value of 0.89 ± 0.00 (Figure 5A,B). A maximum increase was observed after 30 days for samples incubated with the Souda community (KCBI = 0.98 ± 0.006; Figure 5A) as well as for samples incubated with the Agios community (KCBI = 0.96 ± 0.02; Figure 5B). Further incubation resulted in a marginal drop to final average values of 0.92 ± 0.008 for the Souda community (Figure 5A) and 0.93 ± 0.02 for the Agios community (Figure 5B). LDPE microplastics, with an average initial KCBI value of 1.36 ± 0.00 (Figure 5C,D), exhibited notable decrease after 30 days of incubation with both communities; 0.87 ± 0.11 for Souda (Figure 5C) and 0.84 ± 0.13 for Agios (Figure 5D). The average KCBI values of LDPE microplastics incubated with the Souda community fluctuated before attaining the final average value of 0.90 ± 0.00 (Figure 5C). On the other hand, incubation with the Agios community did not alter the LDPE microplastics significantly, from a keto carbonyl bond index point of view, since the average values were almost stable. After 120 days KCBI was 0.85 ± 0.03 (Figure 5D). The differences observed between the HDPE and LDPE microplastic samples after the incubation with the two communities were statistically significant (p = 0.014 for Souda community and p = 0.0008 for Agios community, respectively).
A 30-day incubation with any of the two communities employed was proven sufficient for the chemical alteration of the surface of the HDPE microplastics, from an ester carbonyl bond index (ECBI) point of view (Figure 6A,B). The initial average ECBI value of 0.88 ± 0.00 of the microplastics at the time of incubation was succeeded by 0.97 ± 0.008 for samples incubated with the Souda community (Figure 6A) and 0.96 ± 0.03 for samples incubated with the Agios community (Figure 6B). The average ECBI values for Souda community-incubated HDPE microplastics fluctuated until the final value of 0.90 ± 0.009, while for the Agios community incubated samples, a clear pattern of decrease until a value of 0.92 ± 0.02 was observed. As far as the LDPE microplastics were concerned, almost no change can be observed from the initial average value of 0.80 ± 0.00 in the first 30 days (Figure 6C,D). The minimum average ECBI values were observed on the 60th day of incubation; 0.62 ± 0.02 for the LDPE microplastics incubated with the Souda (Figure 6C) community and 0.72 ± 0.07 for LDPE microplastics incubated with the Agios community (Figure 6D). Increase in the average ECBI values over the following 60 days resulted in final values which were slightly higher than the original ones; 0.85 ± 0.00 for the samples from the Souda community microcosms (Figure 6C) and 0.84 ± 0.04 for the samples from the Agios community microcosms (Figure 6D). The p-values from the Mann–Whitney U test revealed that the differences observed between the two polymers were statistically significant for both communities (p = 0.0003 for Souda and p = 7.75 × 10⁻⁵ for Agios).
Incubation of both secondary microplastic types contributed to the development of internal double bonds on the polymers’ surfaces. During the first 30 days in the microcosms, all average internal double bond index (IDBI) values increased from an initial value of 0.83 ± 0.00 for HDPE and 0.36 ± 0.0 for LDPE. More specifically, incubation with the Souda community resulted in an average IDBI value of 0.95 ± 0.008 for HDPE samples (Figure 7A) and 0.82 ± 0.17 for LDPE samples (Figure 7C), while incubation with the Agios community yielded average values of 0.93 ± 0.05 for HDPE (Figure 7B) and 0.79 ± 0.22 for LDPE (Figure 7D). From that point on, however, each polymer exhibited different behavior. The average IDBI of HDPE microplastics incubated with the Souda community was stabilized until the 90th day and on the 120th day, a decrease to a value of 0.87 ± 0.01 was observed (Figure 7A). Incubation with the Agios community resulted in a gradual decrease of the average IDBI value to a final 0.89 ± 0.02 (Figure 7B). After incubation with the Souda community, LDPE microplastic samples’ IDBI values exhibited an increasing pattern, until the final value of 1.01 ± 0.00 (Figure 7C). In the treatment of the Agios community, LDPE microplastics gradually reached a final average value of 1.07 ± 0.02 (Figure 7D). It is notable that both LDPE treatments resulted in their maximum average values on the 90th day, with very high standard deviations (1.62 ± 0.53 for Souda-incubated samples and 0.96 ± 0.29 for Agios- incubated samples). No statistically significant differences could be discerned between polymer types or communities.
Artificial UV irradiation affected the two types of PE in a similar manner, but to a dissimilar extent. The average vinyl bond index (VBI) value of HDPE upon initiation of the experiment was 0.89 ± 0.00, while that of LDPE was 0.14 ± 0.00. Incubation with the two marine communities led to increased detection of vinyl bonds for all treatments (Figure 8). Incubation with the Souda community resulted in average VBI values of nearly 1.00 from the 30th to the 90th day of the experiment, which finally decreased to 0.92 ± 0.003 at the end of the incubation period (Figure 8A). The average value of 0.99 ± 0.04 was achieved after 30 days of LDPE incubation with the Agios community. It decreased gradually to a final average value of 0.94 ± 0.03 on the 120th day (Figure 8B). The initial increase in average VBI values was more distinct, reaching 0.82 ± 0.17 after a 30-day incubation with the Souda community (Figure 8C) and 0.78 ± 0.20 with the Agios community (Figure 8D). For the remainder of the experiment, average VBI values of LDPE microplastics incubated with the Souda community fluctuated until the final value of 0.80 ± 0.00 was attained (Figure 8C). The fluctuations for Agios community-incubated samples were less pronounced, with a final average value of 0.76 ± 0.05 (Figure 8D). Statistically significant differences could be observed between the two polymers for each community (p = 0.0003 for the Souda community and p = 1.63 × 10⁻⁵ for the Agios community).
Generally, in the first 30 days the FTIR indices of all treatments increased, from 4.8% (ECBI of LDPE incubated with the Souda community) to 483.1% (VBI of LDPE incubated with the Souda community). Following the initial abrupt increase, the ECBI of HDPE MPs incubated with the Souda community fluctuated until a 7% decrease took place between the 90th and 120th day. On the other hand, MPs after incubation with the Agios community steadily declined throughout the experiment. ECBI values of LDPE MPs followed a similar pattern of increase on the 30th day, which was followed by decrease on the 60th day. For the remainder of the experiment, the value of the ECBI index increased, until both treatments reached approximately the same value. The IDBI refers to C=C bonds in the polymeric chain while the VBI refers to terminal C=C bonds. Interestingly, examination of IDBI and VBI of HDPE MPs showed that regardless of incubation community, the values of the two bond indices followed the same pattern of increase in the first 30 days, stabilization between the 30th and 90th day and decrease in the last 30 days. The total percentile differentiation of the two indices was equal in both treatments (13.5% for Souda incubated samples and 11.0% for Agios incubated samples), indicating that double bonds were created in the polymeric chains in an identical manner, despite the incubation with different communities. That was not the case with LDPE MPs. While the two indices followed the same pattern until the 60th day of incubation with the Souda community, they followed opposite directions until the termination of the experiment. The VBI of Agios community incubated samples did not change after the initial increase of the first 30 days. The IDBI however, progressively increased, despite minute fluctuations. The only exception to that pattern of increase was the KCBI of both LDPE treatments. After 30 days of incubation, a decrease of more than 30% was noted, accompanied by simultaneous slight increase in ECBI. Carbonyl index decrease resulted from the incubation of HDPE and LDPE with fungi, with the change being more definite for LDPE samples after 30 days [23]. The KCBI value of weathered LDPE microplastics prior to inoculation was 34% higher than that of HDPE.

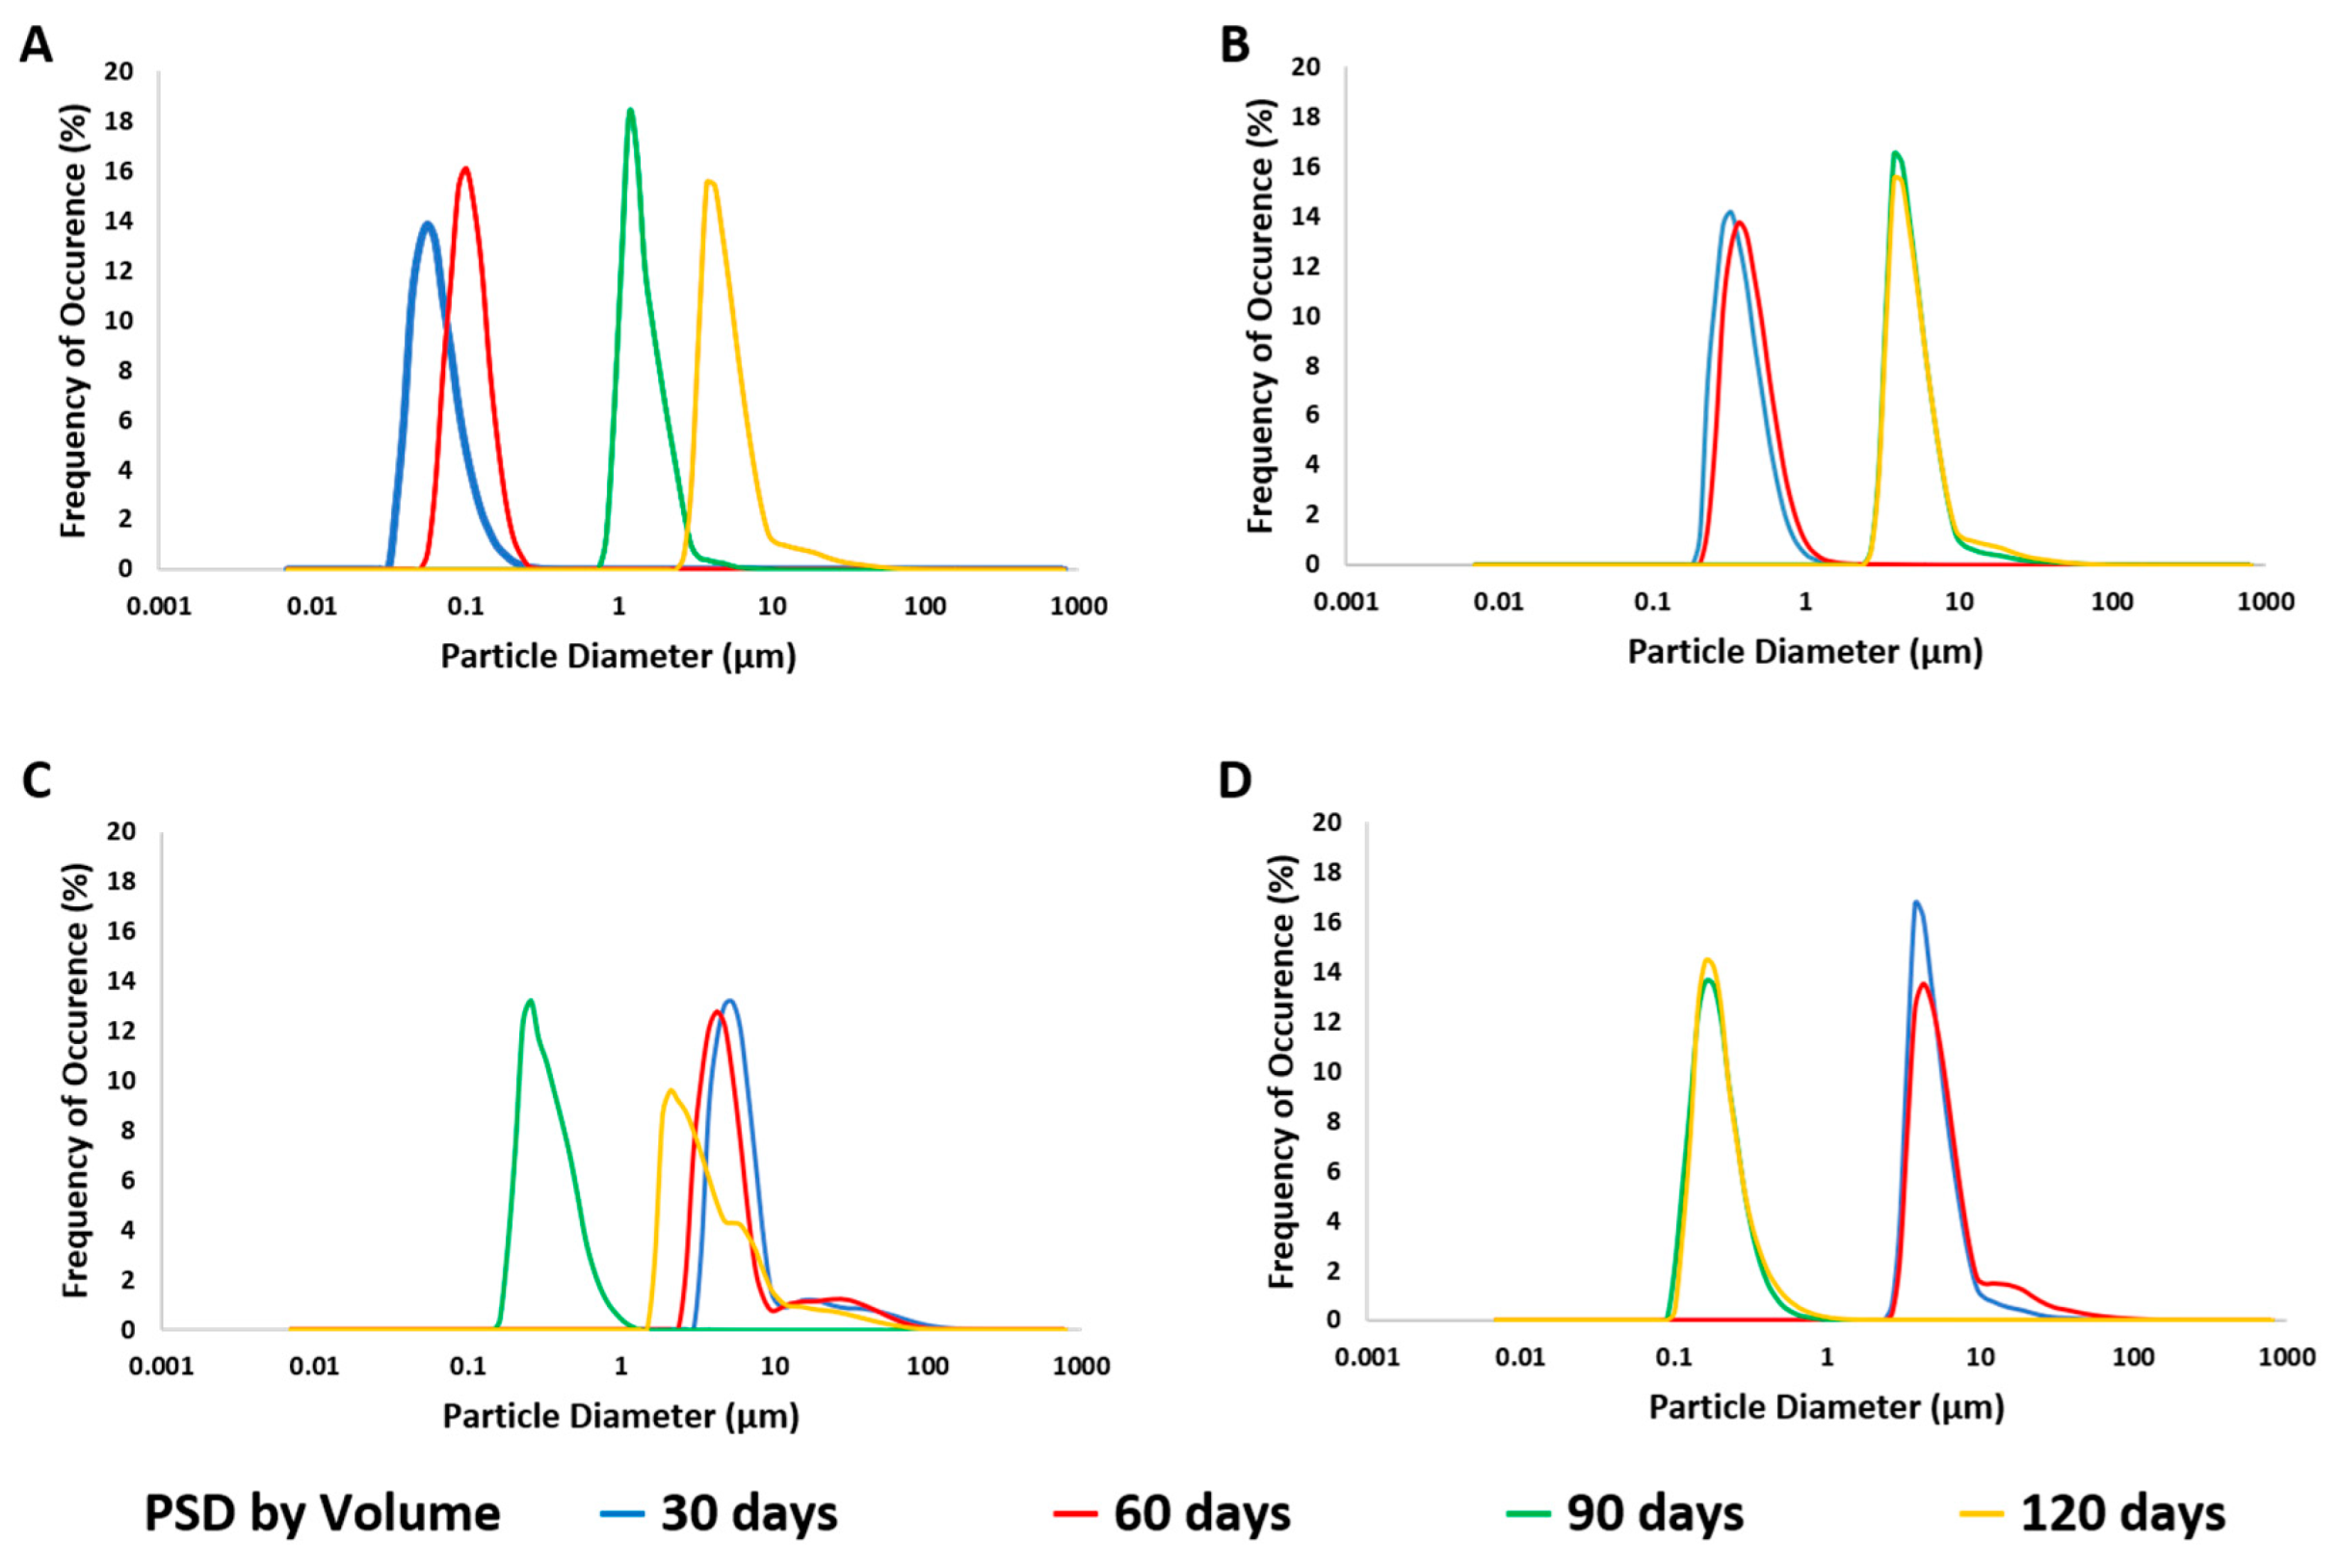
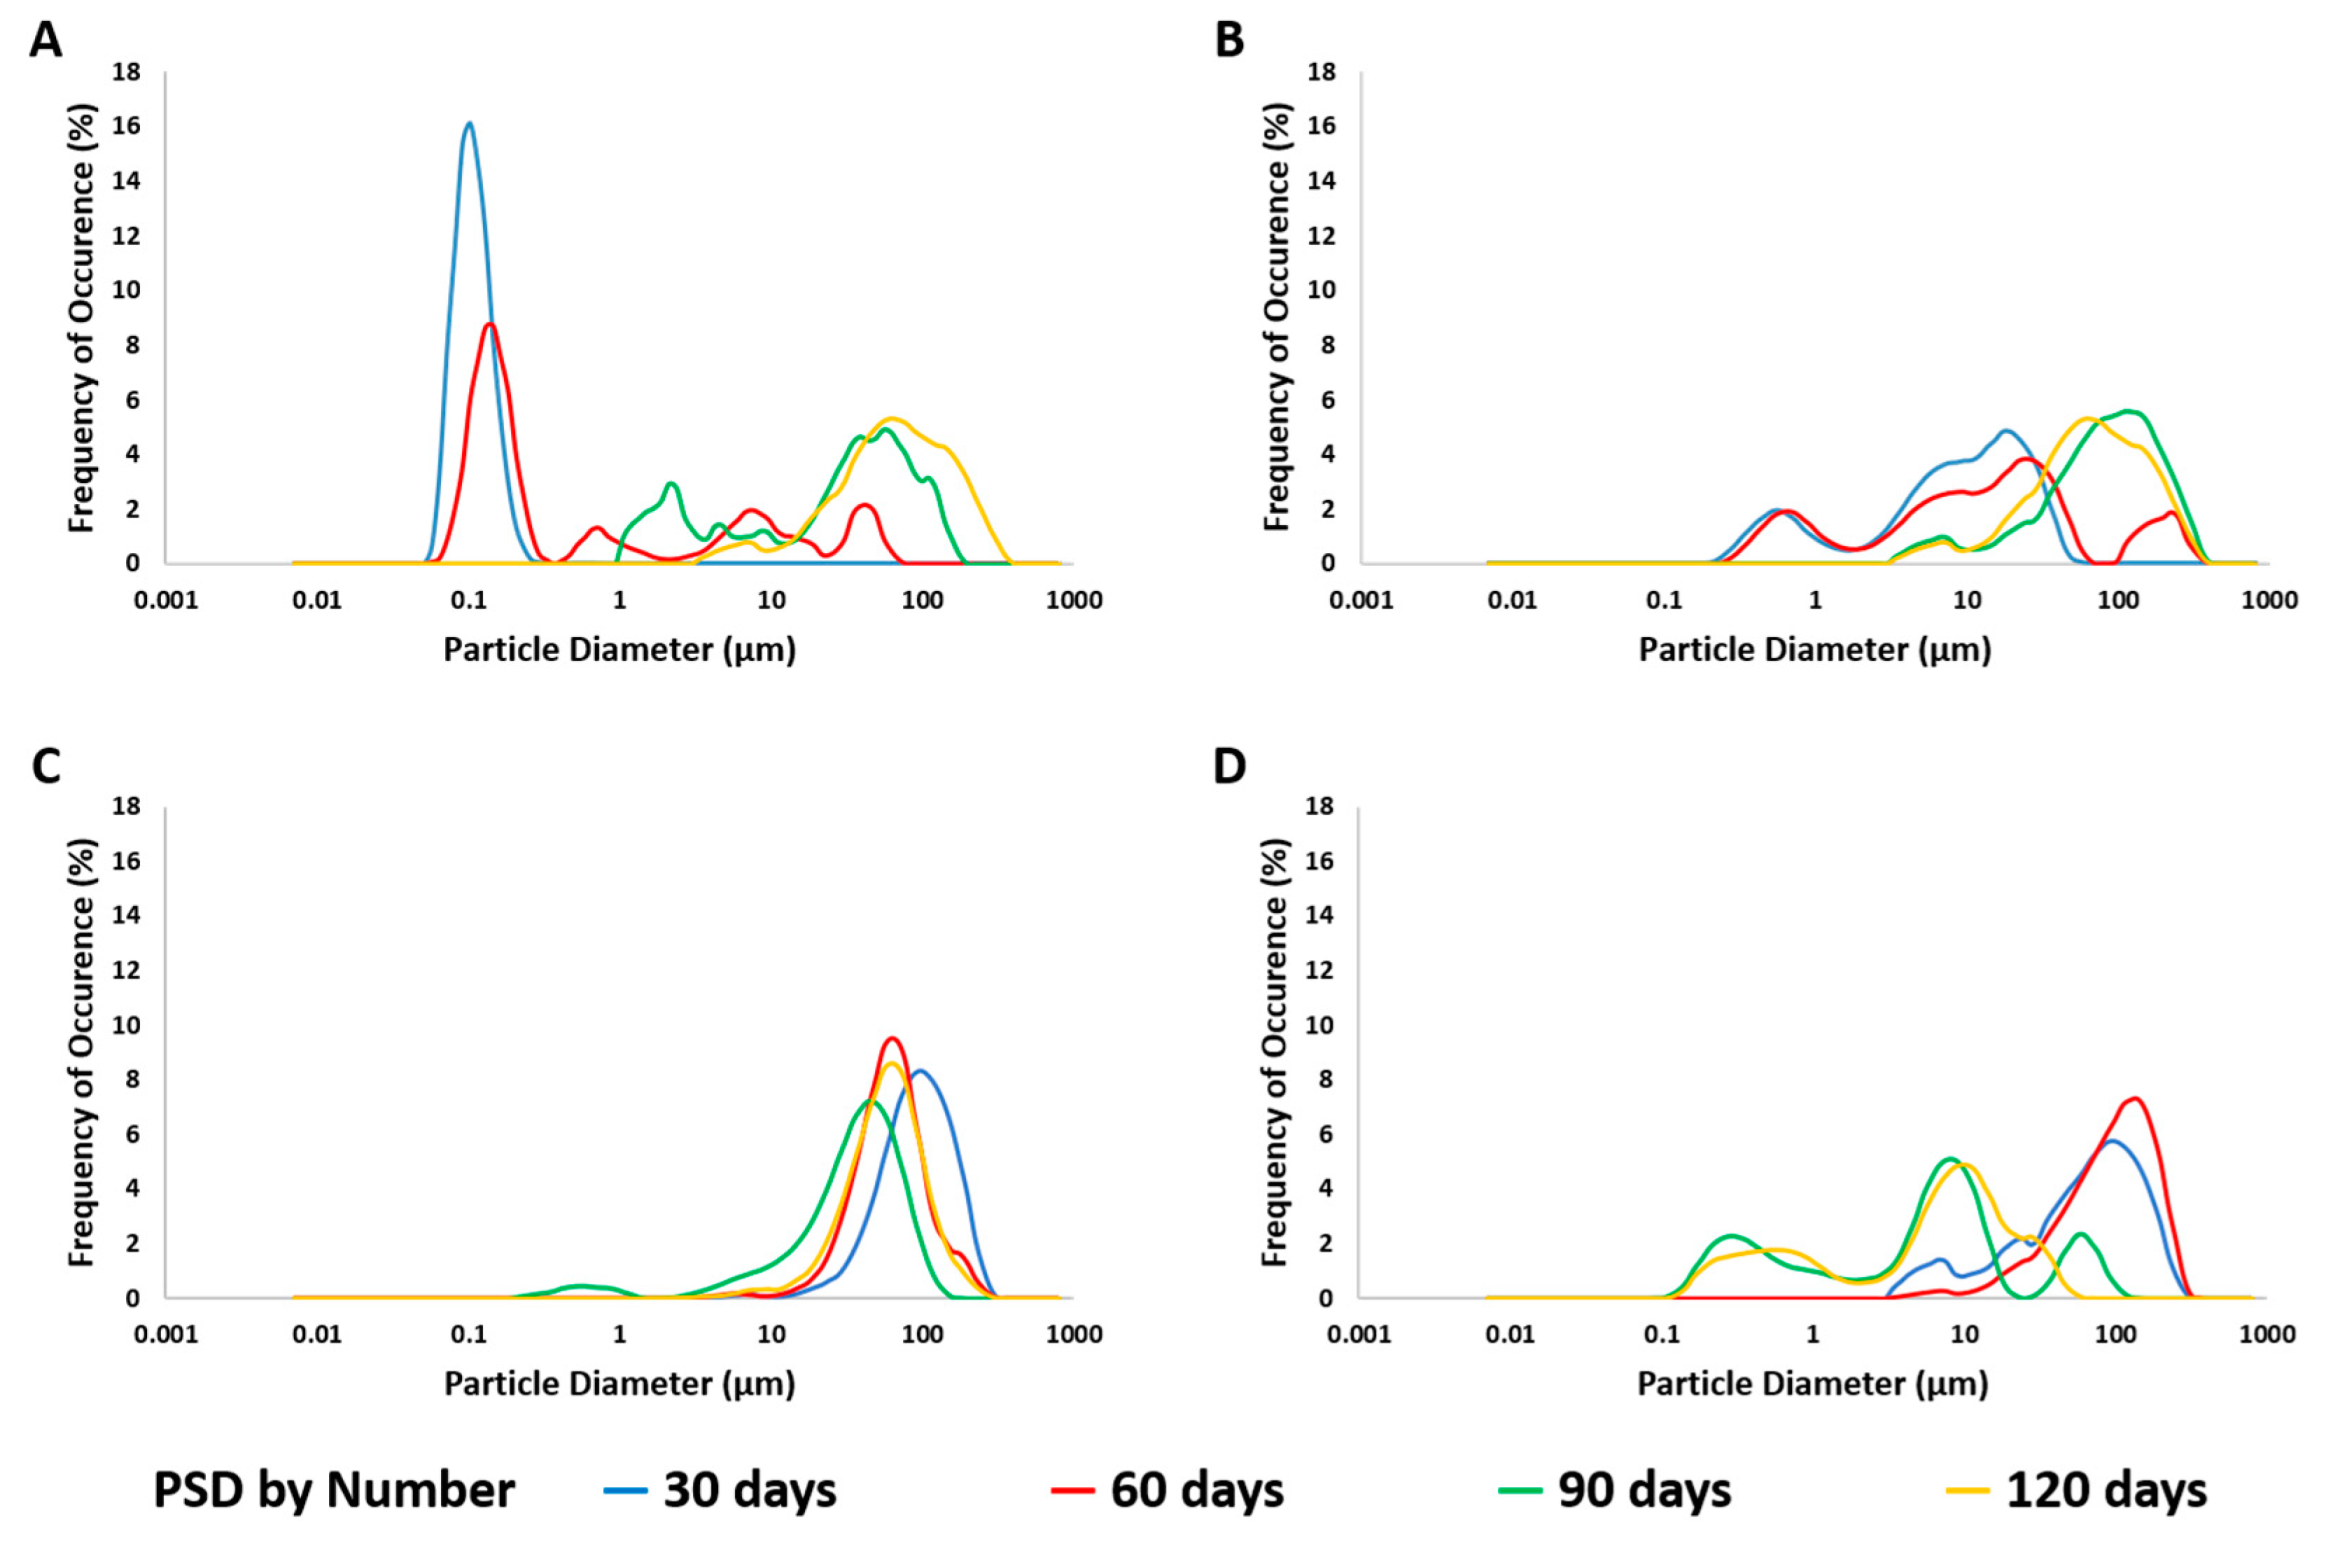
3.3. Size Distribution of Generated Nanoplastics

In this section, the size distribution of the micro- and nanoparticles generated from the microplastics used are presented. Generally, the particle size distribution of HDPE particles by volume shifted to the right as incubation progressed with either community. The temporal diameter differentiation of secondary HDPE particles as a function of their volume is shown in Figure 9A,B. Examination of samples from the abiotic control showed average diameters of 5.357 ± 0.209 μm, with a modal value of 3.548 μm. After 30 days of incubation with the Souda community the mean diameter of the LDPE particles contained in the liquid was 0.814 ± 1.128 μm, with a modal value of 0.102 μm. On the 60th day, the mean diameter diminished to 0.654 ± 0.945 μm, with a higher modal value of 0.129, while on the 90th day, both mean and modal diameters increased with respective values of 3.172 ± 0.906 μm and 0.412 μm. At the end of the experiment, further increase was observed, with a final mean diameter of 28.937 ± 0.533 μm and a modal diameter of 54.923 μm (Figure 9A). Incubation with the Agios community resulted in gradual increase in the mean diameter of the plastic particles, from 6.144 ± 0.584 μm on the 30th day to 56.976 ± 0.402 μm on the 120th day. Interestingly, the highest modal value was observed on the 90th day, with a value of 110.467 μm (Figure 9B). The diameter by volume of LDPE particles was generally higher than that of HDPE. The particle size distribution of LDPE secondary MPs incubated with the Souda community did not shift significantly over time. An initial mean diameter of 56.390 ± 0.255 μm was initially measured, close to the modal diameter (54.923 μm). On the 60th day, the mean diameter increased to 82.604 ± 0.259 μm, with a modal value of 87.513. On the 90th day the diameter started to decrease (mean = 51.621 ± 0.279 μm, modal = 54.923 μm), to finally attain the minimum mean value of 26.564 ± 0.488 μm and a modal diameter of 43.510 μm (Figure 9C). Incubation of LDPE microplastics with the Agios community shifted the particle size distribution to the left. After 30 days nanoparticles of a mean diameter of 6.144 ± 0.584 μm (modal = 17.138 μm) were produced. The mean diameter increased until 66.639 ± 0.426 μm until the 90th day (modal = 110.467 μm) and finally decreased to 56.976 ± 0.402 μm, with a close modal of 54.923 (Figure 9D).
The distribution of HDPE particle size by number shifted decisively to the right, regardless of incubation community. The mean diameter by number after Souda community incubation for 30 days was 0.062 ± 0.157 μm, with a modal value of 0.056 μm. The diameter increased progressively until the end of the experiment, when maximum mean and modal values of 1.345 ± 0.142 μm and 1.122 μm were measured (Figure 10A). Increase in particle diameter by number was observed after the incubation of HDPE microplastics with the Agios community, as well. Distinctively, the mean particle diameter was 0.353 ± 0.154 μm (modal = 0.282 μm) after 30 days and reached 4.945 ± 0.203 μm on the 120th day. Notably, the modal diameter value did not change between the 90th and 120th day and was stable with a value of 3.548 μm (Figure 10B). The diameter of LDPE particles fluctuates throughout the experiment, but a shift of the distribution to the left can be observed, more distinctly in the case of Agios community-incubated samples (Figure 10B,D). LDPE particles of a mean diameter of 6.531 ± 0.297 μm and a modal diameter of 4.467 μm were detected in samples from the 30th day of incubation with the Souda community. On the 60th day, the mean particle diameter was 5.579 ± 0.313 μm with an equal modal diameter of 4.467 μm. A steep increase of diameter was observed on the 90th day (mean = 0.314 ± 0.168 μm, modal = 0.224 μm), followed by an increase to a mean diameter of 3.836 ± 0.321 μm, with a modal value of 2.239 μm (Figure 10C). The diameter of LDPE particles incubated with the Agios community fluctuated, however in a dissimilar manner. The mean particle diameter was 4.670 ± 0.171 μm (modal = 3.548 μm) on the 30th day. One month later, a higher mean diameter equal to 5.594 ± 0.250 μm, with a modal diameter of 4.467 was observed, only to decrease steeply in the next sampling, to a minimum mean diameter of 0.182 ± 0.161 μm (modal = 0.178 μm). Samples from the end of the experiment exhibited slightly higher diameters, with a mean value of 0.192 ± 0.168 μm and a modal diameter of 0.178 μm (Figure 10D).

4. Discussion

4.1. Changes of Incubated Secondary Microplastics

It has been shown that among a variety of plastics polymers, PE was the material less facilitating to biofilm development and fragmentation [24]. Biofilm development on the surface of PE particles, however, has been associated with biodegradation [11,25,26,27]. Microorganisms recruit the extracellular enzyme reservoir to enable the biodeterioration and biofragmentation of solid substrates [28]. In this experiment, viable cells and protein concentrations were examined as a measure of biofilm formation and microbial activity, while FTIR and DLS were employed to detect polymer-related changes.
Our results highlight the significance of the time factor in the process of PE biodegradation. The first 30 days of incubation were crucial to the evolution of the system parameters. Between inoculation and the first sampling, viable cell concentrations increased in all treatments. With the exception of microcosms containing HDPE incubated with the Souda community, that increase was intense and statistically significant. As expected, the highest cell concentrations were recorded for the acclimated Agios community, regardless of polymer type used as a substrate [20]. Cell abundances which initially increased and decreased over time were estimated indirectly via the measurement of increased protein concentrations during the biodegradation of LDPE by bacterial strains [25]. The elevated cell abundances were consistent with the high protein concentrations noted at the same sampling. In microcosms containing HDPE secondary MPs, the highest protein concentrations were also achieved after 30 days of incubation.
Between the first and the 30th day, the most severe changes in FTIR indices were also observed. Increases of FTIR indices similar to those shown here have been reported previously during biodegradation experiments [25,29,30,31]. It appears that the branched molecular structure of LDPE, which facilitated the incorporation of oxygen atoms in the polymeric chain during the irradiation period [32,33], also made it easier for the keto carbonyl bonds to dissolve. The increase in VBI can also be connected to the creation of oligomers with terminal C=C bonds via the Norrish II mechanism [34]. The decrease of the majority of the indices over time can be an indication of weathered polymer consumption by the marine communities. This idea is reinforced by the FTIR spectra (Figure 3), where the hydroxyl peak of the material used for incubation is less prominent after 90 and 120 days. Changes of FTIR indices during the biodegradation of LDPE have been reported before [35], while increase of vinyl bonds was related to the biodegradation of a mixture of plastics by marine communities [18].
Comparison of all index values for the Souda and Agios communities reveals that changes occurring as a result of incubation with the Agios community were gradual and more stable, while those from the Souda community tended to be more dynamic. This result indicates that the biofilm produced from the already acclimated Agios community was more stable, and therefore more predictable and suitable for long-term incubation of samples, with the purpose of polymer mineralization [30]. The Agios community, previously developed and successfully employed by the authors for the biodegradation of naturally weathered polyethylene and polystyrene samples, has been found to contain elevated abundances of the alkB gene [20,36]. The presence of hydrocarbon-degrading microorganisms containing the alkB gene has been linked to the potential biodegradation of plastics [37].

4.2. Nanoplastics Generation and Fate

Incubation of secondary MPs with the two marine communities also resulted in the generation of NPs in the seawater. Τhe size of the detected nanoparticles was consistently lower than the cutoff of the filter used to separate the secondary MPs to be included in the experiment (250 μm). In detail, NPs with size ranging from 56 nm to 355 nm were detected after 30 days of incubation in the seawater of the three out of the four microcosms, supporting the scenario of biofragmentation of PE secondary MPs. It is important to mention that no NPs were detected in the seawater from the abiotic controls at the beginning of the experiment or after 120 days of incubation in the dark. It is, therefore, not possible to attribute the generation of NPs to photodegradation or mechanical stress. Biofragmentation is a depolymerization step which includes the catalytic cleavage of already degraded MPs into smaller units [38]. These intermediate materials are low molecular weight fragments such as monomers and short-chain oligomers. For example, linear alkane hydrolysis products due to PE biodegradation have been detected while the carbon chain length differed depending on the species of bacteria [39]. These compounds can be classified as NPs if their larger dimension is below 1 μm [14,40]. Moreover, surface corrosion of the MPs takes place following microbial adhesion on the surface [39].
The presence of NPs was more prolonged and the fragments were smaller in microcosms containing HDPE secondary MPs as carbon source. Given the chemical structures of LDPE and HDPE, that was unexpected. This result is linked to the fact that after incubation both the KCBI and the ECBI of HDPE MPs were consistently higher than those of LDPE microplastics [41]. The dissolution of carbonyl bonds within the polymeric structure could be the mechanism behind chain scission and the subsequent production of NPs [12,42]. Depolymerization occurring during chain scission is considered to initiate assimilation of the short-chain oligomers to complete mineralization [43]. That implies that NP particles could have been produced in the LDPE microcosms, as a result of the removal of branches of the polymer chain. However, they could not be detected during DLS analysis, as they had been consumed by the bacteria in the seawater. This observation is similar to the fate of byproducts from the biodegradation of petroleum hydrocarbons in the marine environment.
The occurrence of NPs in the natural environment has been extensively highlighted, including the potential toxic effects on biota [12,44,45,46,47,48]. Despite the ever-increasing number of studies on NPs, research of their generation is completely novel. That can be attributed to the fact that this phenomenon has been mostly ignored until now. Moreover, the development of standardized protocols is of utmost importance. The effect of organisms on their production and fate has not been elucidated yet. Understanding of the sources and production of NPs through studies like this, would provide further insight on the impacts that might occur from their presence in the environment. Thus, a wide spectrum of studies should be completed, in order to identify the processes and mechanisms that govern the generation of secondary nanoparticles under various environmental conditions.

5. Conclusions

The presence of plastics of all scales in the environment has been linked to a number of processes and interactions, which have not been fully studied despite the ever-increasing volume of relevant publications. This work presents the potential for secondary MPs colonization and subsequent biodegradation by marine communities, by demonstrating their proliferation in microcosms with HDPE and LDPE as the sole carbon source. Structural changes on the surface of the polymers were consistent with biodeterioration, while the products of biofragmentation were for the first time identified as nanoplastics due to microbial activity. Always keeping in mind, the implications that might arise from the increased toxicity of nanoplastics, this work aspires to constitute a stepping stone toward the biological mitigation of the plastic pollution problem. Finally, it is crucial that efforts be made to understand and include the microbially produced NPs in the plastic mass balance models.

Author Contributions

Conceptualization, E.S. and N.K.; methodology, E.S. and K.K.; software, K.K.; formal analysis, K.K. and E.S.; investigation, K.K., P.T. and G.D.; data curation, K.K.; writing—original draft preparation, K.K.; writing—review and editing, E.S. and N.K.; supervision, E.S. and N.K.; project administration, N.K.; funding acquisition, K.K. and N.K. All authors have read and agreed to the published version of the manuscript.

Funding

This research was co-financed by Greece and the European Union (European Social Fund-ESF) through the Operational Program «Human Resources Development, Education and Lifelong Learning» in the context of the project “Strengthening Human Resources Research Potential via Doctorate Research” (MIS-5000432), implemented by the State Scholarships Foundation (IKY). In addition, funding by the European Union H2020 project INMARE (grant agreement No. 634486) is highly appreciated.

Institutional Review Board Statement

Not applicable.

Informed Consent Statement

Not applicable.

Data Availability Statement

Data is contained within the article.

Acknowledgments

The authors would like to thank Seridou Petroula for performing DLS analysis with the SALD-7500nano particle analyzer.

Conflicts of Interest

The authors declare no conflict of interest.

References

  1. Gong, J.; Xie, P. Research progress in sources, analytical methods, eco-environmental effects, and control measures of microplastics. Chemosphere 2020, 254, 126790. [Google Scholar] [CrossRef] [PubMed]
  2. da Costa, J.P.; Santos, P.S.M.; Duarte, A.C.; Rocha-Santos, T. (Nano)plastics in the environment—Sources, fates and effects. Sci. Total Environ. 2016, 566–567, 15–26. [Google Scholar] [CrossRef] [PubMed]
  3. Eriksen, M.; Lebreton, L.C.M.; Carson, H.S.; Thiel, M.; Moore, C.J.; Borerro, J.C.; Galgani, F.; Ryan, P.G.; Reisser, J. Plastic Pollution in the World’s Oceans: More than 5 Trillion Plastic Pieces Weighing over 250,000 Tons Afloat at Sea. PLoS ONE 2014, 9, e111913. [Google Scholar] [CrossRef] [PubMed] [Green Version]
  4. Auta, H.S.; Emenike, C.U.; Fauziah, S.H. Distribution and importance of microplastics in the marine environmentA review of the sources, fate, effects, and potential solutions. Environ. Int. 2017, 102, 165–176. [Google Scholar] [CrossRef] [PubMed]
  5. Cózar, A.; Echevarría, F.; González-gordillo, J.I.; Irigoien, X.; Úbeda, B. Plastic debris in the open ocean. Proc. Natl. Acad. Sci. USA 2014, 111, 10239–10244. [Google Scholar] [CrossRef] [Green Version]
  6. Kaandorp, M.L.A.; Dijkstra, H.A.; van Sebille, E. Modelling size distributions of marine plastics under the influence of continuous cascading fragmentation. Environ. Res. Lett. 2021, 16, 054075. [Google Scholar] [CrossRef]
  7. Malankowska, M.; Echaide-Gorriz, C.; Coronas, J. Microplastics in marine environment: A review on sources, classification, and potential remediation by membrane technology. Environ. Sci. Water Res. Technol. 2021, 7, 243–258. [Google Scholar] [CrossRef]
  8. Song, Y.K.; Hong, S.H.; Jang, M.; Han, G.M.; Jung, S.W.; Shim, W.J. Combined Effects of UV Exposure Duration and Mechanical Abrasion on Microplastic Fragmentation by Polymer Type. Environ. Sci. Technol. 2017, 51, 4368–4376. [Google Scholar] [CrossRef] [PubMed]
  9. Rummel, C.D.; Jahnke, A.; Gorokhova, E.; Kühnel, D.; Schmitt-Jansen, M. The Impacts of Biofilm Formation on the Fate and Potential Effects of Microplastic in the Aquatic Environment. Environ. Sci. Technol. Lett. 2017, 4, 258–267. [Google Scholar] [CrossRef] [Green Version]
  10. Singh, B.; Sharma, N. Mechanistic implications of plastic degradation. Polym. Degrad. Stab. 2008, 93, 561–584. [Google Scholar] [CrossRef]
  11. Kumar, A.G.; Anjana, K.; Hinduja, M.; Sujitha, K.; Dharani, G. Review on plastic wastes in marine environment—Biodegradation and biotechnological solutions. Mar. Pollut. Bull. 2020, 150, 110733. [Google Scholar] [CrossRef]
  12. Ali, I.; Cheng, Q.; Ding, T.; Yiguang, Q.; Yuechao, Z.; Sun, H.; Peng, C.; Naz, I.; Li, J.; Liu, J. Micro- and nanoplastics in the environment: Occurrence, detection, characterization and toxicity—A critical review. J. Clean. Prod. 2021, 313, 127863. [Google Scholar] [CrossRef]
  13. Gigault, J.; Pedrono, B.; Maxit, B.; Ter Halle, A. Marine plastic litter: The unanalyzed nano-fraction. Environ. Sci. Nano 2016, 3, 346–350. [Google Scholar] [CrossRef]
  14. Sorasan, C.; Edo, C.; González-Pleiter, M.; Fernández-Piñas, F.; Leganés, F.; Rodríguez, A.; Rosal, R. Generation of nanoplastics during the photoageing of low-density polyethylene. Environ. Pollut. 2021, 289, 117919. [Google Scholar] [CrossRef] [PubMed]
  15. Liu, L.; Xu, M.; Ye, Y.; Zhang, B. On the degradation of (micro)plastics: Degradation methods, influencing factors, environmental impacts. Sci. Total Environ. 2021, 806, 151312. [Google Scholar] [CrossRef]
  16. Raddadi, N.; Fava, F. Biodegradation of oil-based plastics in the environment: Existing knowledge and needs of research and innovation. Sci. Total Environ. 2019, 679, 148–158. [Google Scholar] [CrossRef]
  17. Auta, H.S.; Emenike, C.U.; Jayanthi, B.; Fauziah, S.H. Growth kinetics and biodeterioration of polypropylene microplastics by Bacillus sp. and Rhodococcus sp. isolated from mangrove sediment. Mar. Pollut. Bull. 2018, 127, 15–21. [Google Scholar] [CrossRef]
  18. Syranidou, E.; Karkanorachaki, K.; Amorotti, F.; Avgeropoulos, A.; Kolvenbach, B.; Zhou, N.Y.; Fava, F.; Corvini, P.F.X.; Kalogerakis, N. Biodegradation of mixture of plastic films by tailored marine consortia. J. Hazard. Mater. 2019, 375, 33–42. [Google Scholar] [CrossRef] [PubMed]
  19. Kalogerakis, N.; Karkanorachaki, K.; Kalogerakis, G.C.; Triantafyllidi, E.I.; Gotsis, A.D.; Partsinevelos, P.; Fava, F. Microplastics Generation: Onset of Fragmentation of Polyethylene Films in Marine Environment Mesocosms. Front. Mar. Sci. 2017, 4, 84. [Google Scholar] [CrossRef]
  20. Syranidou, E.; Karkanorachaki, K.; Amorotti, F.; Repouskou, E.; Kroll, K.; Kolvenbach, B.; Corvini, P.F.X.; Fava, F.; Kalogerakis, N. Development of tailored indigenous marine consortia for the degradation of naturally weathered polyethylene films. PLoS ONE 2017, 12, e183984. [Google Scholar] [CrossRef] [Green Version]
  21. Lowry, O.H.; Rosebrough, N.J.; Farr, A.L.; Randall, R.J. Protein measurement with the Folin phenol reagent. J. Biol. Chem. 1951, 193, 265–275. [Google Scholar] [CrossRef]
  22. Andrady, A.L. The plastic in microplastics: A review. Mar. Pollut. Bull. 2017, 119, 12–22. [Google Scholar] [CrossRef]
  23. Ojha, N.; Pradhan, N.; Singh, S.; Barla, A.; Shrivastava, A.; Khatua, P.; Rai, V.; Bose, S. Evaluation of HDPE and LDPE degradation by fungus, implemented by statistical optimization. Sci. Rep. 2017, 7, 39515. [Google Scholar] [CrossRef] [PubMed]
  24. Gerritse, J.; Leslie, H.A.; de Tender, C.A.; Devriese, L.I.; Vethaak, A.D. Fragmentation of plastic objects in a laboratory seawater microcosm. Sci. Rep. 2020, 10, 10945. [Google Scholar] [CrossRef]
  25. Torre, D.Y.Z.D.; Santos, L.A.D.; Reyes, M.L.C.; Baculi, R.Q. Biodegradation of low-density polyethylene by bacteria isolated from serpentinization-driven alkaline spring. Philipp. Sci. Lett. 2018, 11, 1–12. [Google Scholar]
  26. Balasubramanian, V.; Natarajan, K.; Hemambika, B.; Ramesh, N.; Sumathi, C.S.; Kottaimuthu, R.; Rajesh Kannan, V. High-density polyethylene (HDPE)-degrading potential bacteria from marine ecosystem of Gulf of Mannar, India. Lett. Appl. Microbiol. 2010, 51, 205–211. [Google Scholar] [CrossRef] [PubMed]
  27. Gilan (Orr), I.; Hadar, Y.; Sivan, A. Colonization, biofilm formation and biodegradation of polyethylene by a strain of Rhodococcus ruber. Appl. Microbiol. Biotechnol. 2004, 65, 97–104. [Google Scholar] [CrossRef]
  28. García-Depraect, O.; Lebrero, R.; Rodriguez-Vega, S.; Bordel, S.; Santos-Beneit, F.; Martínez-Mendoza, L.J.; Aragão Börner, R.; Börner, T.; Muñoz, R. Biodegradation of bioplastics under aerobic and anaerobic aqueous conditions: Kinetics, carbon fate and particle size effect. Bioresour. Technol. 2021, 344, 126265. [Google Scholar] [CrossRef]
  29. Sangeetha Devi, R.; Rajesh Kannan, V.; Nivas, D.; Kannan, K.; Chandru, S.; Robert Antony, A. Biodegradation of HDPE by Aspergillus spp. from marine ecosystem of Gulf of Mannar, India. Mar. Pollut. Bull. 2015, 96, 32–40. [Google Scholar] [CrossRef] [PubMed]
  30. Sudhakar, M.; Doble, M.; Murthy, P.S.; Venkatesan, R. Marine microbe-mediated biodegradation of low- and high-density polyethylenes. Int. Biodeterior. Biodegrad. 2008, 61, 203–213. [Google Scholar] [CrossRef]
  31. Manzur, A.; Limón-González, M.; Favela-Torres, E. Biodegradation of Physicochemically Treated LDPE by a Consortium of Filamentous Fungi. J. Appl. Polym. Sci. 2004, 92, 265–271. [Google Scholar] [CrossRef]
  32. Chamas, A.; Moon, H.; Zheng, J.; Qiu, Y.; Tabassum, T.; Jang, J.H.; Abu-Omar, M.M.; Scott, S.L.; Suh, S. Degradation Rates of Plastics in the Environment. ACS Sustain. Chem. Eng. 2020, 8, 3494–3511. [Google Scholar] [CrossRef] [Green Version]
  33. Martínez-Romo, A.; González-Mota, R.; Soto-Bernal, J.J.; Rosales-Candelas, I. Investigating the Degradability of HDPE, LDPE, PE-BIO, and PE-OXO Films under UV-B Radiation. J. Spectrosc. 2015, 2015, 586514. [Google Scholar] [CrossRef] [Green Version]
  34. Eyheraguibel, B.; Traikia, M.; Fontanella, S.; Sancelme, M.; Bonhomme, S.; Fromageot, D.; Lemaire, J.; Lauranson, G.; Lacoste, J.; Delort, A.M. Characterization of oxidized oligomers from polyethylene films by mass spectrometry and NMR spectroscopy before and after biodegradation by a Rhodococcus rhodochrous strain. Chemosphere 2017, 184, 366–374. [Google Scholar] [CrossRef]
  35. Harshvardhan, K.; Jha, B. Biodegradation of low-density polyethylene by marine bacteria from pelagic waters, Arabian Sea, India. Mar. Pollut. Bull. 2013, 77, 100–106. [Google Scholar] [CrossRef]
  36. Syranidou, E.; Karkanorachaki, K.; Amorotti, F.; Franchini, M.; Repouskou, E.; Kaliva, M.; Vamvakaki, M.; Kolvenbach, B.; Fava, F.; Corvini, P.F.-X.; et al. Biodegradation of weathered polystyrene films in seawater microcosms. Sci. Rep. 2017, 7, 17991. [Google Scholar] [CrossRef] [Green Version]
  37. Delacuvellerie, A.; Cyriaque, V.; Gobert, S.; Benali, S.; Wattiez, R. The plastisphere in marine ecosystem hosts potential specific microbial degraders including Alcanivorax borkumensis as a key player for the low-density polyethylene degradation. J. Hazard. Mater. 2019, 380, 120899. [Google Scholar] [CrossRef]
  38. Amobonye, A.; Bhagwat, P.; Singh, S.; Pillai, S. Plastic biodegradation: Frontline microbes and their enzymes. Sci. Total Environ. 2021, 759, 143536. [Google Scholar] [CrossRef] [PubMed]
  39. Montazer, Z.; Habibi-Najafi, M.B.; Mohebbi, M.; Oromiehei, A. Microbial Degradation of UV-Pretreated Low-Density Polyethylene Films by Novel Polyethylene-Degrading Bacteria Isolated from Plastic-Dump Soil. J. Polym. Environ. 2018, 26, 3613–3625. [Google Scholar] [CrossRef]
  40. Gewert, B.; Plassmann, M.M.; MacLeod, M. Pathways for degradation of plastic polymers floating in the marine environment. Environ. Sci. Process. Impacts 2015, 17, 1513–1521. [Google Scholar] [CrossRef] [Green Version]
  41. Bardají, D.K.R.; Moretto, J.A.S.; Furlan, J.P.R.; Stehling, E.G. A mini-review: Current advances in polyethylene biodegradation. World J. Microbiol. Biotechnol. 2020, 36, 32. [Google Scholar] [CrossRef] [PubMed]
  42. Zeenat; Elahi, A.; Bukhari, D.A.; Shamim, S.; Rehman, A. Plastics degradation by microbes: A sustainable approach. J. King Saud Univ.—Sci. 2021, 33, 101538. [Google Scholar] [CrossRef]
  43. Choe, S.; Kim, Y.; Won, Y.; Myung, J. Bridging Three Gaps in Biodegradable Plastics: Misconceptions and Truths about Biodegradation. Front. Chem. 2021, 9, 671750. [Google Scholar] [CrossRef]
  44. Cole, M.; Galloway, T.S. Ingestion of Nanoplastics and Microplastics by Pacific Oyster Larvae. Environ. Sci. Technol. 2015, 49, 14625–14632. [Google Scholar] [CrossRef] [Green Version]
  45. Alimi, O.S.; Farner Budarz, J.; Hernandez, L.M.; Tufenkji, N. Microplastics and Nanoplastics in Aquatic Environments: Aggregation, Deposition, and Enhanced Contaminant Transport. Environ. Sci. Technol. 2018, 52, 1704–1724. [Google Scholar] [CrossRef] [PubMed]
  46. Chae, Y.; An, Y.J. Effects of micro- and nanoplastics on aquatic ecosystems: Current research trends and perspectives. Mar. Pollut. Bull. 2016, 124, 624–632. [Google Scholar] [CrossRef] [PubMed]
  47. Mattsson, K.; Jocic, S.; Doverbratt, I.; Hansson, L.A. Nanoplastics in the Aquatic Environment. Microplastic Contamination in Aquatic Environments: An Emerging Matter of Environmental Urgency; Elsevier Inc.: Amsterdam, The Netherlands, 2018; Chapter 13; pp. 379–399. ISBN 9780128137475. [Google Scholar]
  48. Alprol, A.E.; Gaballah, M.S.; Hassaan, M.A. Micro and Nanoplastics analysis: Focus on their classification, sources, and impacts in marine environment. Reg. Stud. Mar. Sci. 2021, 42, 101625. [Google Scholar] [CrossRef]
Figure 1. (A) HDPE and LDPE films and (B) HDPE secondary microplastics with size 250 μm–2 mm.
Microplastics 01 00006 g001
Figure 2. The abundances of Souda biofilm community on (A) HDPE and (C) LDPE secondary MPs and the abundances of Agios biofilm community on (B) HDPE and (D) LDPE secondary MPs over time. Stars indicate significance levels: * for p < 0.05, ** for p < 0.01, *** for p < 0.001, **** for p < 0.0001.
Microplastics 01 00006 g002
Figure 3. The concentration of proteins within the Souda biofilm community on (A) HDPE and (C) LDPE secondary MPs and the concentration of proteins within the Agios biofilm community on (B) HDPE and (D) LDPE secondary MPs over time.
Microplastics 01 00006 g003
Figure 4. The FTIR profiles of LDPE secondary MPs prior and after exposure to Souda and Agios communities.
Microplastics 01 00006 g004
Figure 5. The KCBI of (A) HDPE and (C) LDPE secondary MPs inoculated with the Souda community and the KCBI of (B) HDPE and (D) LDPE secondary MPs inoculated with the Agios community.
Microplastics 01 00006 g005
Figure 6. The ECBI of (A) HDPE and (C) LDPE secondary MPs inoculated with the Souda community and the ECBI of (B) HDPE and (D) LDPE secondary MPs inoculatwed ith the Agios community.
Microplastics 01 00006 g006
Figure 7. The IDBI of (A) HDPE and (C) LDPE secondary MPs inoculated with the Souda community and the IDBI of (B) HDPE and (D) LDPE secondary MPs inoculated with the Agios community.
Microplastics 01 00006 g007
Figure 8. The VBI of (A) HDPE and (C) LDPE secondary MPs inoculated with the Souda community and the VBI of (B) HDPE and (D) LDPE secondary MPs inoculated with the Agios community.
Microplastics 01 00006 g008
Figure 9. The particle size distribution of (A) HDPE and (C) LDPE secondary MPs inoculated with the Souda community and of (B) HDPE and (D) LDPE secondary MPs inoculated with the Agios community by volume of particles as measured by dynamic light scattering.
Microplastics 01 00006 g009
Figure 10. The particle size distribution of (A) HDPE and (C) LDPE secondary MPs inoculated with the Souda community and of (B) HDPE and (D) LDPE secondary MPs inoculated with the Agios community by number of particles.
Microplastics 01 00006 g010
Publisher’s Note: MDPI stays neutral with regard to jurisdictional claims in published maps and institutional affiliations.

