1. Introduction
High-throughput sequencing has reshaped microbial and metagenomic research over the past two decades, enabling characterization of disease mechanisms, microbiome composition, infectious-disease surveillance, and personalized medicine at unprecedented scale [
1,
2]. Within this landscape, Oxford Nanopore long-read platforms have emerged as a complementary technology to short-read Illumina sequencing, producing reads tens of kilobases in length that enable accurate reconstruction of complex or repetitive genomic regions [
3,
4].
Functional profiling—the quantification of genes and pathways encoded in a microbial community—complements taxonomic profiling by linking composition to metabolic capacity, virulence factors, and antimicrobial resistance determinants [
5]. Most established functional profiling tools, however, were developed for short-read Illumina data [
5] and do not directly accommodate the characteristics of nanopore reads, which combine kilobase-scale lengths with per-base error rates that exceed those of short-read platforms. Established long-read functional profiling frameworks, such as MEGAN-LR [
6], typically rely on comprehensive translated protein searches against vast reference databases (e.g., NCBI-nr), which present substantial computational and memory demands when scaling to high-throughput long-read metagenomes.
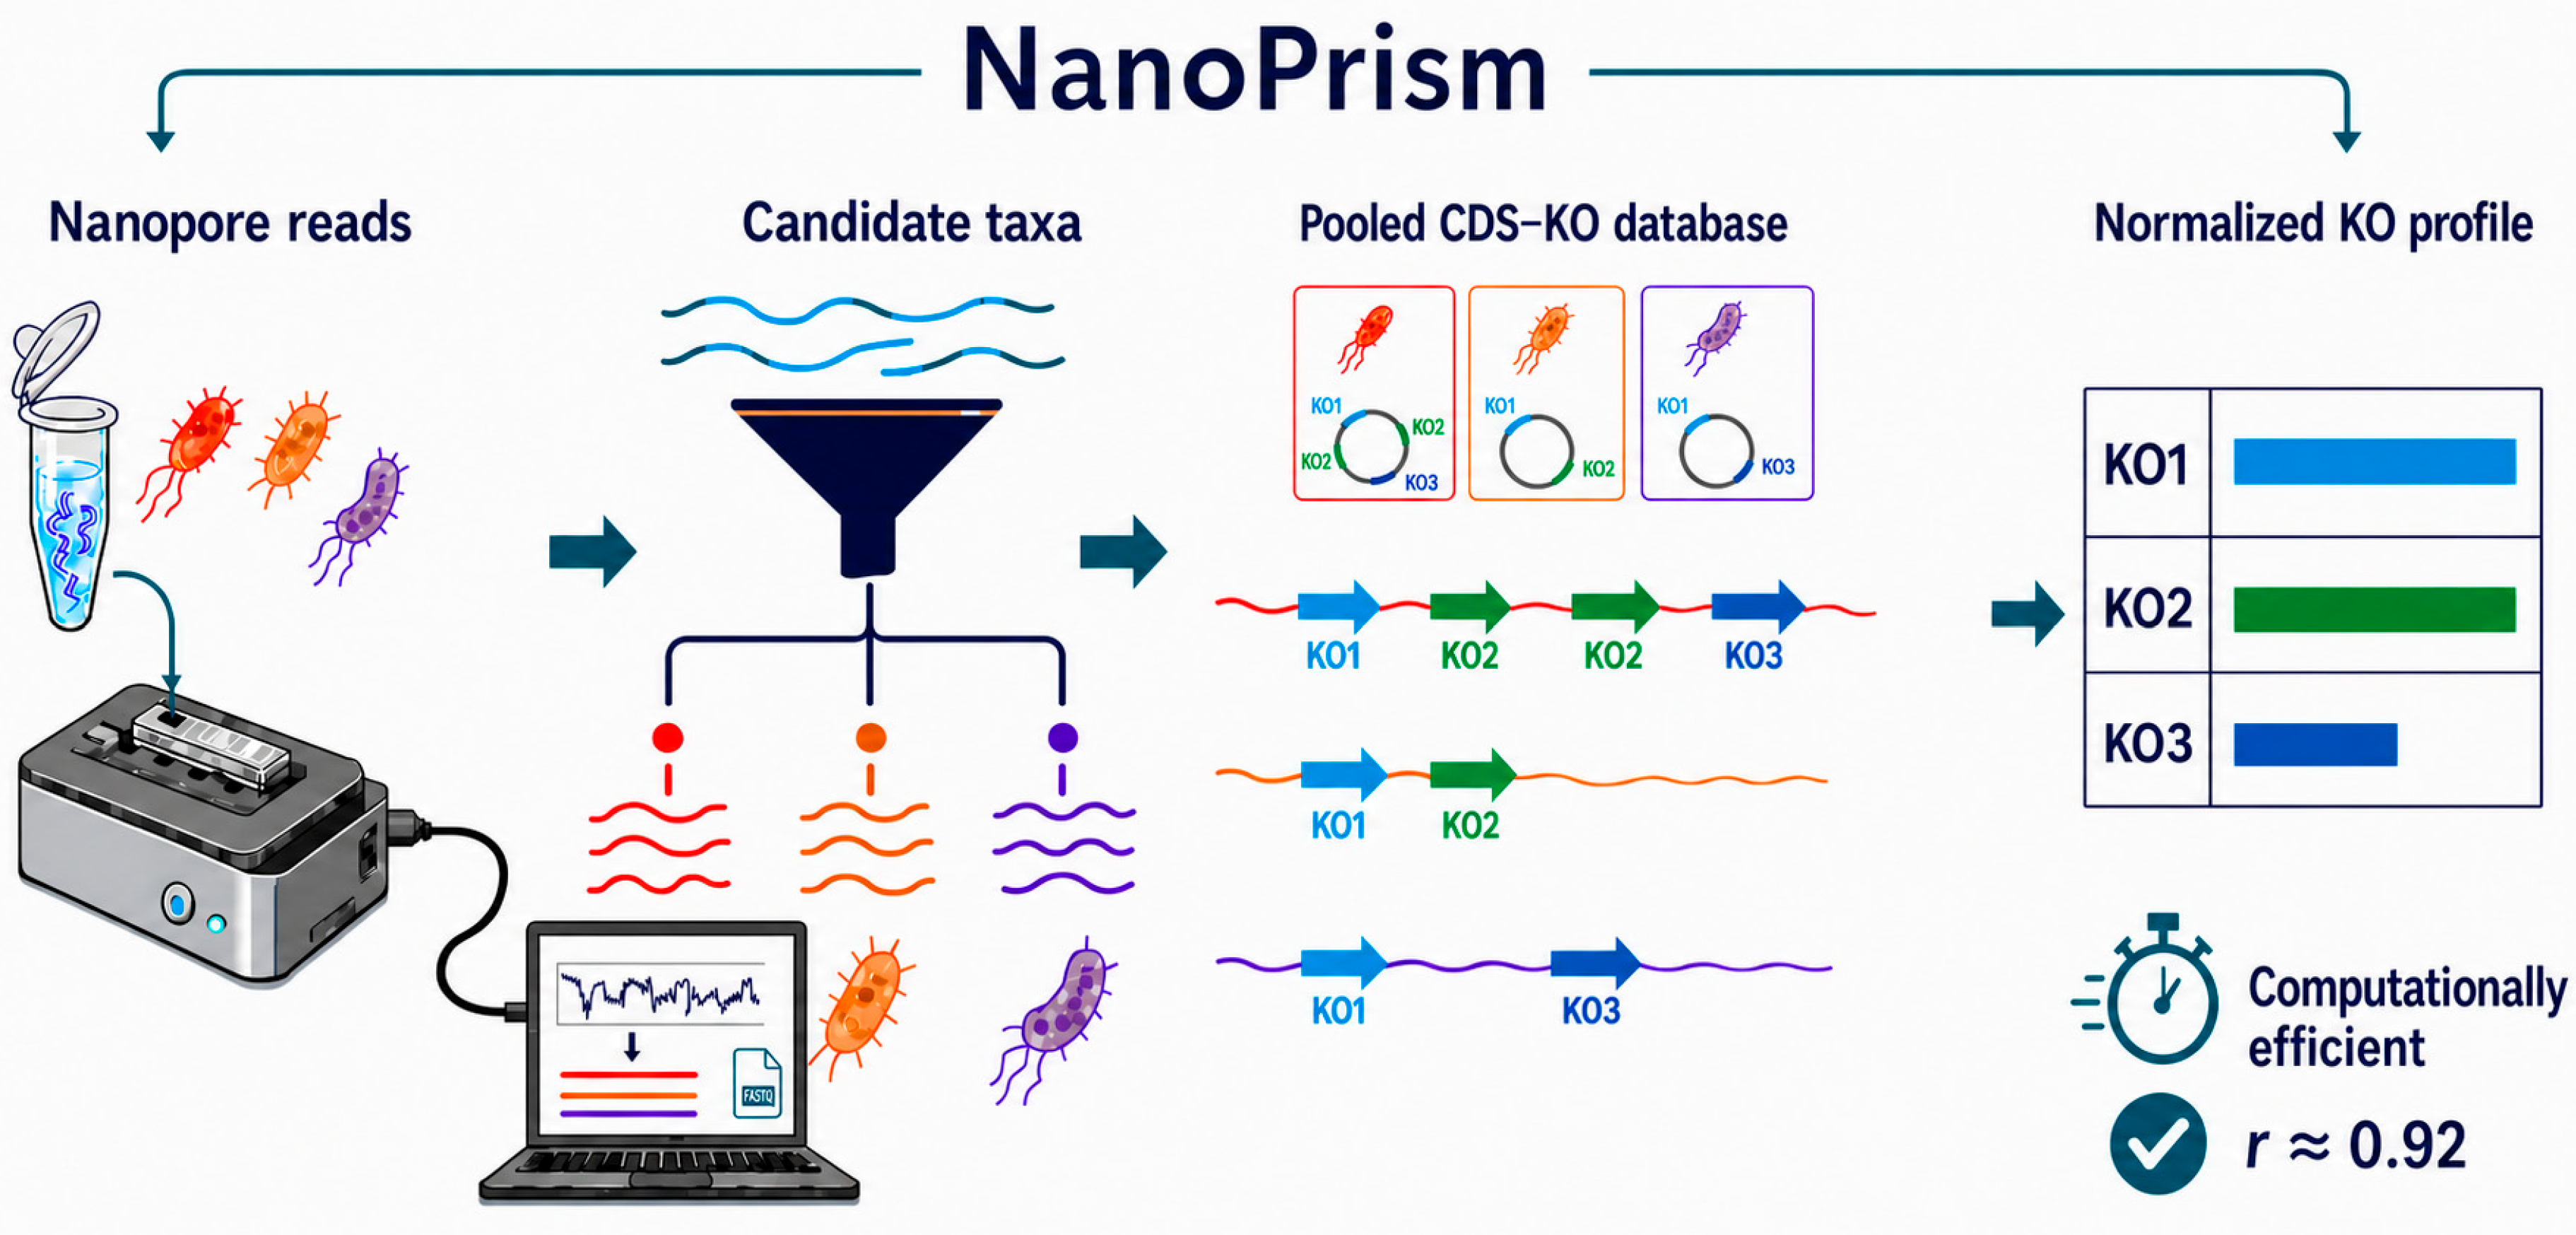
To address these challenges, we developed NanoPrism, a taxonomy-guided functional profiling pipeline tailored for Oxford Nanopore data. Rather than performing an exhaustive translated alignment against a universal protein database, NanoPrism dynamically reduces the functional search space by first constructing a compact, nonredundant, species-specific coding sequence (CDS)–KEGG ortholog database based on candidate taxa detected in the sample. Nanopore reads are then aligned to this targeted database with minimap2, a long-read-specific aligner optimized for sequences with up to 75% identity [
7], and ortholog abundances are normalized using single-copy ribosomal marker genes. This design reduces the computational overhead of translated search while keeping the reference targeted directly to the taxa present in the community.
The NanoPrism software is released as an open-source package at
https://github.com/jiwoongbio/NanoPrism/ (accessed on 29 July 2026), with source code, installation guides, and example workflows to facilitate reproducibility and community use. In this study we benchmark NanoPrism against assembly-based and translated-alignment alternatives on simulated bacterial isolates and the ZymoBIOMICS mock community, and we characterize how functional profiling accuracy evolves as a function of sequencing yield to motivate future evaluation in real-time nanopore workflows.
2. Materials and Methods
2.1. Analysis Workflow
NanoPrism comprises a database-construction stage and a read-analysis stage. In the database-construction stage, the user can either supply a target species list or let NanoPrism infer sample composition with Kraken2 [
8] (version 2.1.6, k2_pluspf_16gb_20240605 database: Standard plus RefSeq protozoa and fungi, capped at 16 GB). Importantly, Kraken2 is used strictly to select candidate species for target reference database construction; it does not filter or discard individual sequencing reads. Candidate taxa are selected using species rank (
rank code = S) with a clade abundance threshold of ≥1% in the Kraken2 report, excluding human taxon ID 9606 from candidate-taxon selection. For each selected taxon, NanoPrism retrieves up to 100 genome assemblies and corresponding coding sequence (CDS) annotations from NCBI Genome Assembly, prioritizing RefSeq category and assembly level. Complete-genome, chromosome, scaffold, and contig assemblies are eligible. Candidate CDS sequences are added incrementally to a nonredundant reference. A candidate is considered redundant when a same-strand minimap2 alignment has a query-length-normalized matched-base fraction of at least 0.9, calculated as the number of matched bases (
m) divided by the full length of the candidate CDS used as the query (
):
. In other words, matched bases must account for at least 90% of the query CDS. This measure is not a conventional nucleotide percent-identity threshold. When both sequences have KO annotations, candidates with different KO assignments are retained separately. For multi-exon eukaryotic genes, target CDS sequences are reconstructed by concatenating CDS coordinate intervals associated with the same protein/transcript identifier in strand-aware genomic order, yielding exon-only CDS reference sequences. Kyoto Encyclopedia of Genes and Genomes (KEGG) ortholog assignments are generated by MetaPrism [
9]. In MetaPrism, translated CDS mapping uses DIAMOND v2.1.24 with an initial candidate-reporting threshold of E-value
, returning up to 100 candidate targets per query. Candidate alignments are subsequently filtered requiring a reference-length-normalized exact-match fraction
by default (where
M is the number of exact matching amino-acid positions derived from numeric runs in the MD tag, and
is the complete reference-protein length from the DIAMOND ZL tag), as well as any reference-specific minimum percent-identity threshold (DIAMOND ZI) when specified. Passing candidates are ranked sequentially by lower E-value (ZE), higher bit score (AS), and higher exact-match fraction (
C). MetaPrism retains only the top-ranked hit by default, retaining multiple hits only when tied across all three ranking criteria.
In the read-analysis stage, all raw input nanopore reads—including reads unclassified by Kraken2—are aligned directly against the pooled species-specific CDS–ortholog database with the long-read aligner minimap2 (version v2.30-r1287) [
7] using standard DNA mapping settings (
minimap2 -t <threads> -x map-ont <CDS_database.fasta> <reads.fastq.gz>). Alignments are filtered directly from PAF alignment records to retain primary alignments (
tp:A:P) meeting a matching-base fraction threshold of
, defined as the number of matching bases (PAF column 10) divided by the alignment-block length (PAF column 11). Secondary alignments marked
tp:A:S are excluded, and no additional mapping-quality threshold is applied.
For a retained primary alignment
a mapping to a target CDS
, NanoPrism calculates its fractional depth contribution
:
where
is the number of matching bases (PAF column 10) and
is the full sequence length (in bp) of the target CDS
. For a KEGG Orthology (KO) term
k, the KO depth score
is the sum of these contributions:
where
is the set of retained primary alignments (
tp:A:P) assigned to any target CDS annotated with KO
k. A single long read may contribute to multiple KO scores when minimap2 reports separate retained primary alignment segments to different CDS targets. Each segment is scored independently. Mismatching and inserted bases do not contribute to
. The marker-normalized KO abundance
is calculated as:
where
is the subset of detected single-copy ribosomal marker KOs from the set of ten markers
(K02950, K02874, K02946, K02948, K02867, K02952, K02886, K02988, K02992, K02965). Marker KOs with
are excluded from the denominator. If none of the ten marker KOs is detected, NanoPrism uses the median of all detected KO depth scores as a fallback:
This fallback does not have the same biological interpretation as normalization against the predefined single-copy marker set. Definitions and derivation details for the ten marker KOs are provided in
Supplementary Table S3.
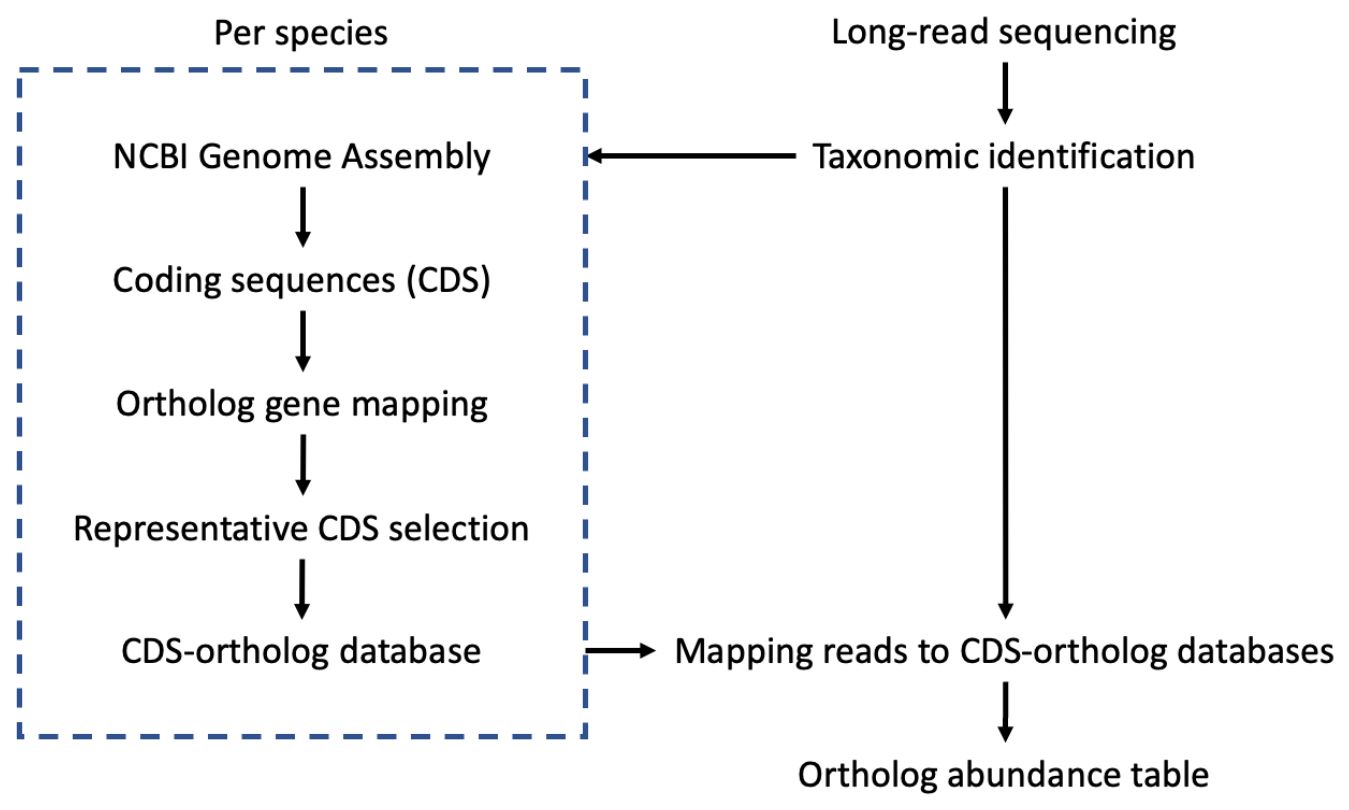
NanoPrism outputs a normalized ortholog abundance table suitable for downstream differential-abundance and functional-enrichment analysis. The overall workflow is illustrated in
Figure 1.
2.2. Single-Isolate Simulation: Pseudomonas aeruginosa
We first benchmarked NanoPrism on simulated reads from a single bacterial species,
Pseudomonas aeruginosa. We obtained the complete genome sequences of
P. aeruginosa PAO1 (NC_002516.2) and PA14 (NC_009774.1) from NCBI and used Badread [
10] to simulate Nanopore reads from both the R9.4.1 and R10.4.1 chemistries at four sequencing depths: 15×, 30×, 60×, and 120×. Badread reproduces error profiles representative of real Nanopore data.
Simulated reads were processed with the NanoPrism analysis workflow described above. Ground-truth ortholog abundances for each reference strain were derived directly from RefSeq CDS annotations (
P. aeruginosa PAO1: NC_002516.2; PA14: NC_009774.1) by mapping each CDS to its best-hit KEGG ortholog using DIAMOND v2.1.24 [
11] (E-value
) and minimum identity
. For orthologs with multiple CDS copies in a genome, the ground-truth abundance was the integer copy number. These copy-number profiles served as the baseline against which estimates from simulated reads were evaluated. This ground-truth construction used the same DIAMOND-based protein similarity approach implemented in MetaPrism. This approach is conceptually comparable to eggNOG-mapper and KofamScan, although the tools differ in their reference databases, scoring procedures, and KO-assignment criteria.
We compared NanoPrism against two alternative workflows. The assembly-based workflow first assembles the simulated reads into contigs using Flye [
12], then polishes the assembly with Racon [
13] and Medaka [
14]; genes are detected on the polished contigs as described in MetaPrism [
9], after which the original reads are aligned back to these gene regions to quantify ortholog abundance. This approach requires substantial compute and depends on the quality of de novo assembly and gene annotation, so it is most informative at higher sequencing depths. The reference-genome workflow aligns reads directly to the exact RefSeq genome of the simulated strain. This workflow is generally infeasible in practice—the exact strain genome is rarely available prospectively—but is included here only as an upper bound on attainable performance.
2.3. Mock-Community Evaluation: ZymoBIOMICS
We next evaluated NanoPrism on the ZymoBIOMICS Microbial Community Standard [
15], a defined mock community comprising ten microbial species with reference genome sizes spanning an order of magnitude:
Listeria monocytogenes (2.99 Mb),
Pseudomonas aeruginosa (6.79 Mb),
Bacillus subtilis (4.05 Mb),
Escherichia coli (4.88 Mb),
Salmonella enterica (4.76 Mb),
Lactobacillus fermentum (1.90 Mb),
Enterococcus faecalis (2.85 Mb),
Staphylococcus aureus (2.73 Mb),
Saccharomyces cerevisiae (12.1 Mb), and
Cryptococcus neoformans (18.9 Mb), totalling roughly 61.7 Mb of reference sequence. Two community variants were analyzed: the
Even community, in which the ten species range from 2% to 12% by genomic DNA, and the
Log community, in which the same ten species span six orders of magnitude (0.000089% to 89.1%). For each community we used the matched Illumina, Nanopore GridION, and Nanopore PromethION datasets published by Nicholls et al. [
16].
To eliminate annotation circularity and establish an independent benchmark baseline, the expected KO reference was constructed independently of MetaPrism using a multi-tool annotation pipeline. RefSeq/GenBank assemblies were retrieved for all ten member strains (
GCF_028743795.1,
GCA_028975465.1,
GCF_028743535.1,
GCF_028743555.1,
GCF_030770375.1,
GCF_028743575.1,
GCF_028743595.1,
GCA_028975445.1,
GCF_028743635.1, and
GCF_028743615.1). Protein sequences were predicted with Tiberius (v2.0.6;
–model_cfg fungi;
–batch_size 16) where CDS files were absent, and annotated independently using KofamScan (v1.3.0) and eggNOG-mapper (v2.1.13, eggNOG DB 5.0.2). Annotations were integrated by assigning equal support weight (
) per tool per protein, fractional weights for multi-KO assignments, and retaining highest-supported KO assignments. Manufacturer genomic-DNA mass percentages (
) were converted to genome-copy weights (
) by dividing by assembly length (
):
Expected KO abundances were calculated as , where is the integrated KO copy count in assembly s. We refer to this profile throughout the manuscript as the expected KO reference.
We compared three long-read analytical strategies on the Zymo datasets. First, we applied NanoPrism as described above. Second, we evaluated an assembly-based workflow (Flye+MetaPrism): metagenomic long reads were assembled into contigs with metaFlye [
17], genes were annotated on the assembled contigs, and the original reads were aligned back to these annotated genes to estimate abundance. Third, we ran MEGAN-LR [
6], a widely adopted long-read taxonomic and functional profiling pipeline. In our evaluation, the MEGAN-LR workflow was executed by aligning reads against the NCBI-nr protein database using DIAMOND
blastx (v2.1.24) with default long-read alignment settings to generate DAA alignment files, followed by functional annotation assignment using MEGAN6 Ultimate Edition (v6.25.10; 2024 release)
daa-meganizer with the
–longReads flag. MEGAN-LR maps aligned reads to KEGG Orthology (KO) terms using MEGAN’s mapping files. All benchmarking runs were executed under standard environment conditions using 64 threads on a server equipped with an Intel Xeon Gold 6430 CPU and 256 GB RAM. MEGAN-LR produced KO read counts. Before comparative metrics were calculated, each MEGAN-LR profile was represented over the same set of KOs for each community and independently normalized to unit sum, with undetected KOs assigned zero abundance.
For comparison with short-read sequencing, we also profiled the same Zymo communities using the matched Illumina datasets ERR2984773 and ERR2935805 from ENA [
16]. We analyzed these datasets with HUMAnN (v3.9) [
5] and MetaPrism [
9]. HUMAnN classifies reads with MetaPhlAn v4.0.6 using the
mpa_vJun23_CHOCOPhlAnSGB_202403 database index, constructs taxon-specific gene sequence references, and aligns reads to those references to estimate gene abundances. MetaPrism instead performs metagenomic de novo assembly with MEGAHIT [
18], annotates genes on the assembled contigs, and maps reads back to annotated genes. These short-read results provide a reference point for interpreting the nanopore functional profiles.
2.4. Benchmark Normalization and Performance Metrics
For the input-matched long-read comparison, the first one million reads in each nanopore FASTQ file were retained in their original file order. NanoPrism and MEGAN-LR were evaluated on these same sample.1M.fastq.gz subsets. For each subset, NanoPrism used a sample-specific CDS–KO database constructed from the Kraken2 report generated from that subset. Full-data NanoPrism results were reported separately.
Every expected and predicted KO profile was independently normalized to unit sum. Profiles within a community were evaluated over the same community-specific union of KO identifiers, with absent values represented as zero. Pearson correlation, Jensen–Shannon distance, and mean absolute error (MAE) were calculated over all KOs and were treated as primary whole-profile metrics without a detection cutoff. These comparisons evaluate relative KO-profile composition rather than the absolute scale of NanoPrism’s marker-normalized output.
2.5. Detection-Oriented Sensitivity Analysis
Detection-oriented sensitivity analyses were performed at normalized-abundance thresholds of , , and . Let denote the normalized expected abundance of KO k. At each threshold t, expected KOs were classified as above-threshold targets (), subthreshold expected KOs (; the gray zone), or reference-absent KOs (). Above-threshold KO recall was the proportion of above-threshold targets predicted at or above the same threshold. Reference-relative KO false-discovery proportion was calculated as the number of predicted reference-absent KOs divided by the sum of recovered above-threshold targets and predicted reference-absent KOs. Subthreshold expected KOs were excluded from this denominator. Because these detection metrics depend on the operational threshold, they were treated as secondary sensitivity analyses.
2.6. Evaluation with One Species Omitted from the Reference Database
To quantify the sensitivity of taxonomy-guided reference construction to omission of a community member, we performed experiments in which one species at a time was omitted from the reference database for the Even and Log ZymoBIOMICS communities. This controlled design isolates the effect of a single missing taxon while holding the sequencing reads, expected KO reference, mapping parameters, and quantification procedure constant. For each community, an all-ten-species database served as the baseline. Ten additional databases were constructed, each omitting one member species before CDS collection and database reduction. This all-species baseline is an oracle reference used specifically for the controlled omission experiment and differs from the database used in the primary NanoPrism benchmark, which is constructed from taxa passing the Kraken2 selection criteria. The larger all-species database contains a different set of competing CDS targets and can therefore yield slightly different correlations from the primary benchmark. All raw Oxford Nanopore reads (GridION ERR3152364/ERR3152366 and PromethION ERR3152365/ERR3152367) were mapped to every database, and the resulting KO profiles were compared with the independent genome-copy-weighted expected KO reference using Pearson correlation (r).
2.7. Yield-Conditioned Performance Modeling
A practical advantage of nanopore sequencing is that data accumulate continuously during a run, which raises the question of how functional profiling accuracy scales with elapsed sequencing time. To translate the depth-resolved benchmarks (15–120×) into time-resolved estimates, we used a simple empirical model of cumulative yield rather than performing real-time, streaming analysis. The downstream performance metrics in
Section 3.4 are therefore obtained by offline subsampling at the depths predicted by the model, and should be interpreted as
yield-conditioned rather than truly real-time results.
Treating each active nanopore as contributing bases at an approximately constant rate, and modeling the number of productive pores as decaying with first-order kinetics, the cumulative yield
at time
t takes a two-parameter saturating-exponential form:
where
is the asymptotic yield and
is the characteristic time constant. The full derivation is provided in
Supplementary Section S1. Empirical observations of high-quality MinION runs suggest
Gb and
h [
16]; we adopt these literature-derived values here without re-fitting to the present data (see Discussion).
GridION uses MinION-format flow cells (FLO-MIN106/MIN114) and can run up to five in parallel, so its per-flow-cell parameters are essentially identical ( Gb, h). PromethION flow cells (FLO-PRO114M) contain substantially more active nanopores (5000 guaranteed pores versus 800 in MinION/GridION flow cells), supporting ultra-deep sequencing; while is similar (≈25 h) because pore-inactivation kinetics are comparable, scales proportionally to ∼150–200 Gb under optimal conditions.
For illustration, assuming a 10 Mb target genome, Equation
6 predicts that 15× to 120× coverage on a MinION is reached in roughly 7.5 min to 1 h after run start, given the linear early-yield regime (
Supplementary Section S1). We then estimate yield-conditioned functional-profiling performance by piecewise-linear interpolation between the depth-resolved benchmark points.
3. Results
3.1. Performance Evaluation on Bacterial Isolates
We first benchmarked NanoPrism on simulated long-read datasets from two
Pseudomonas aeruginosa reference strains, PAO1 and PA14 (
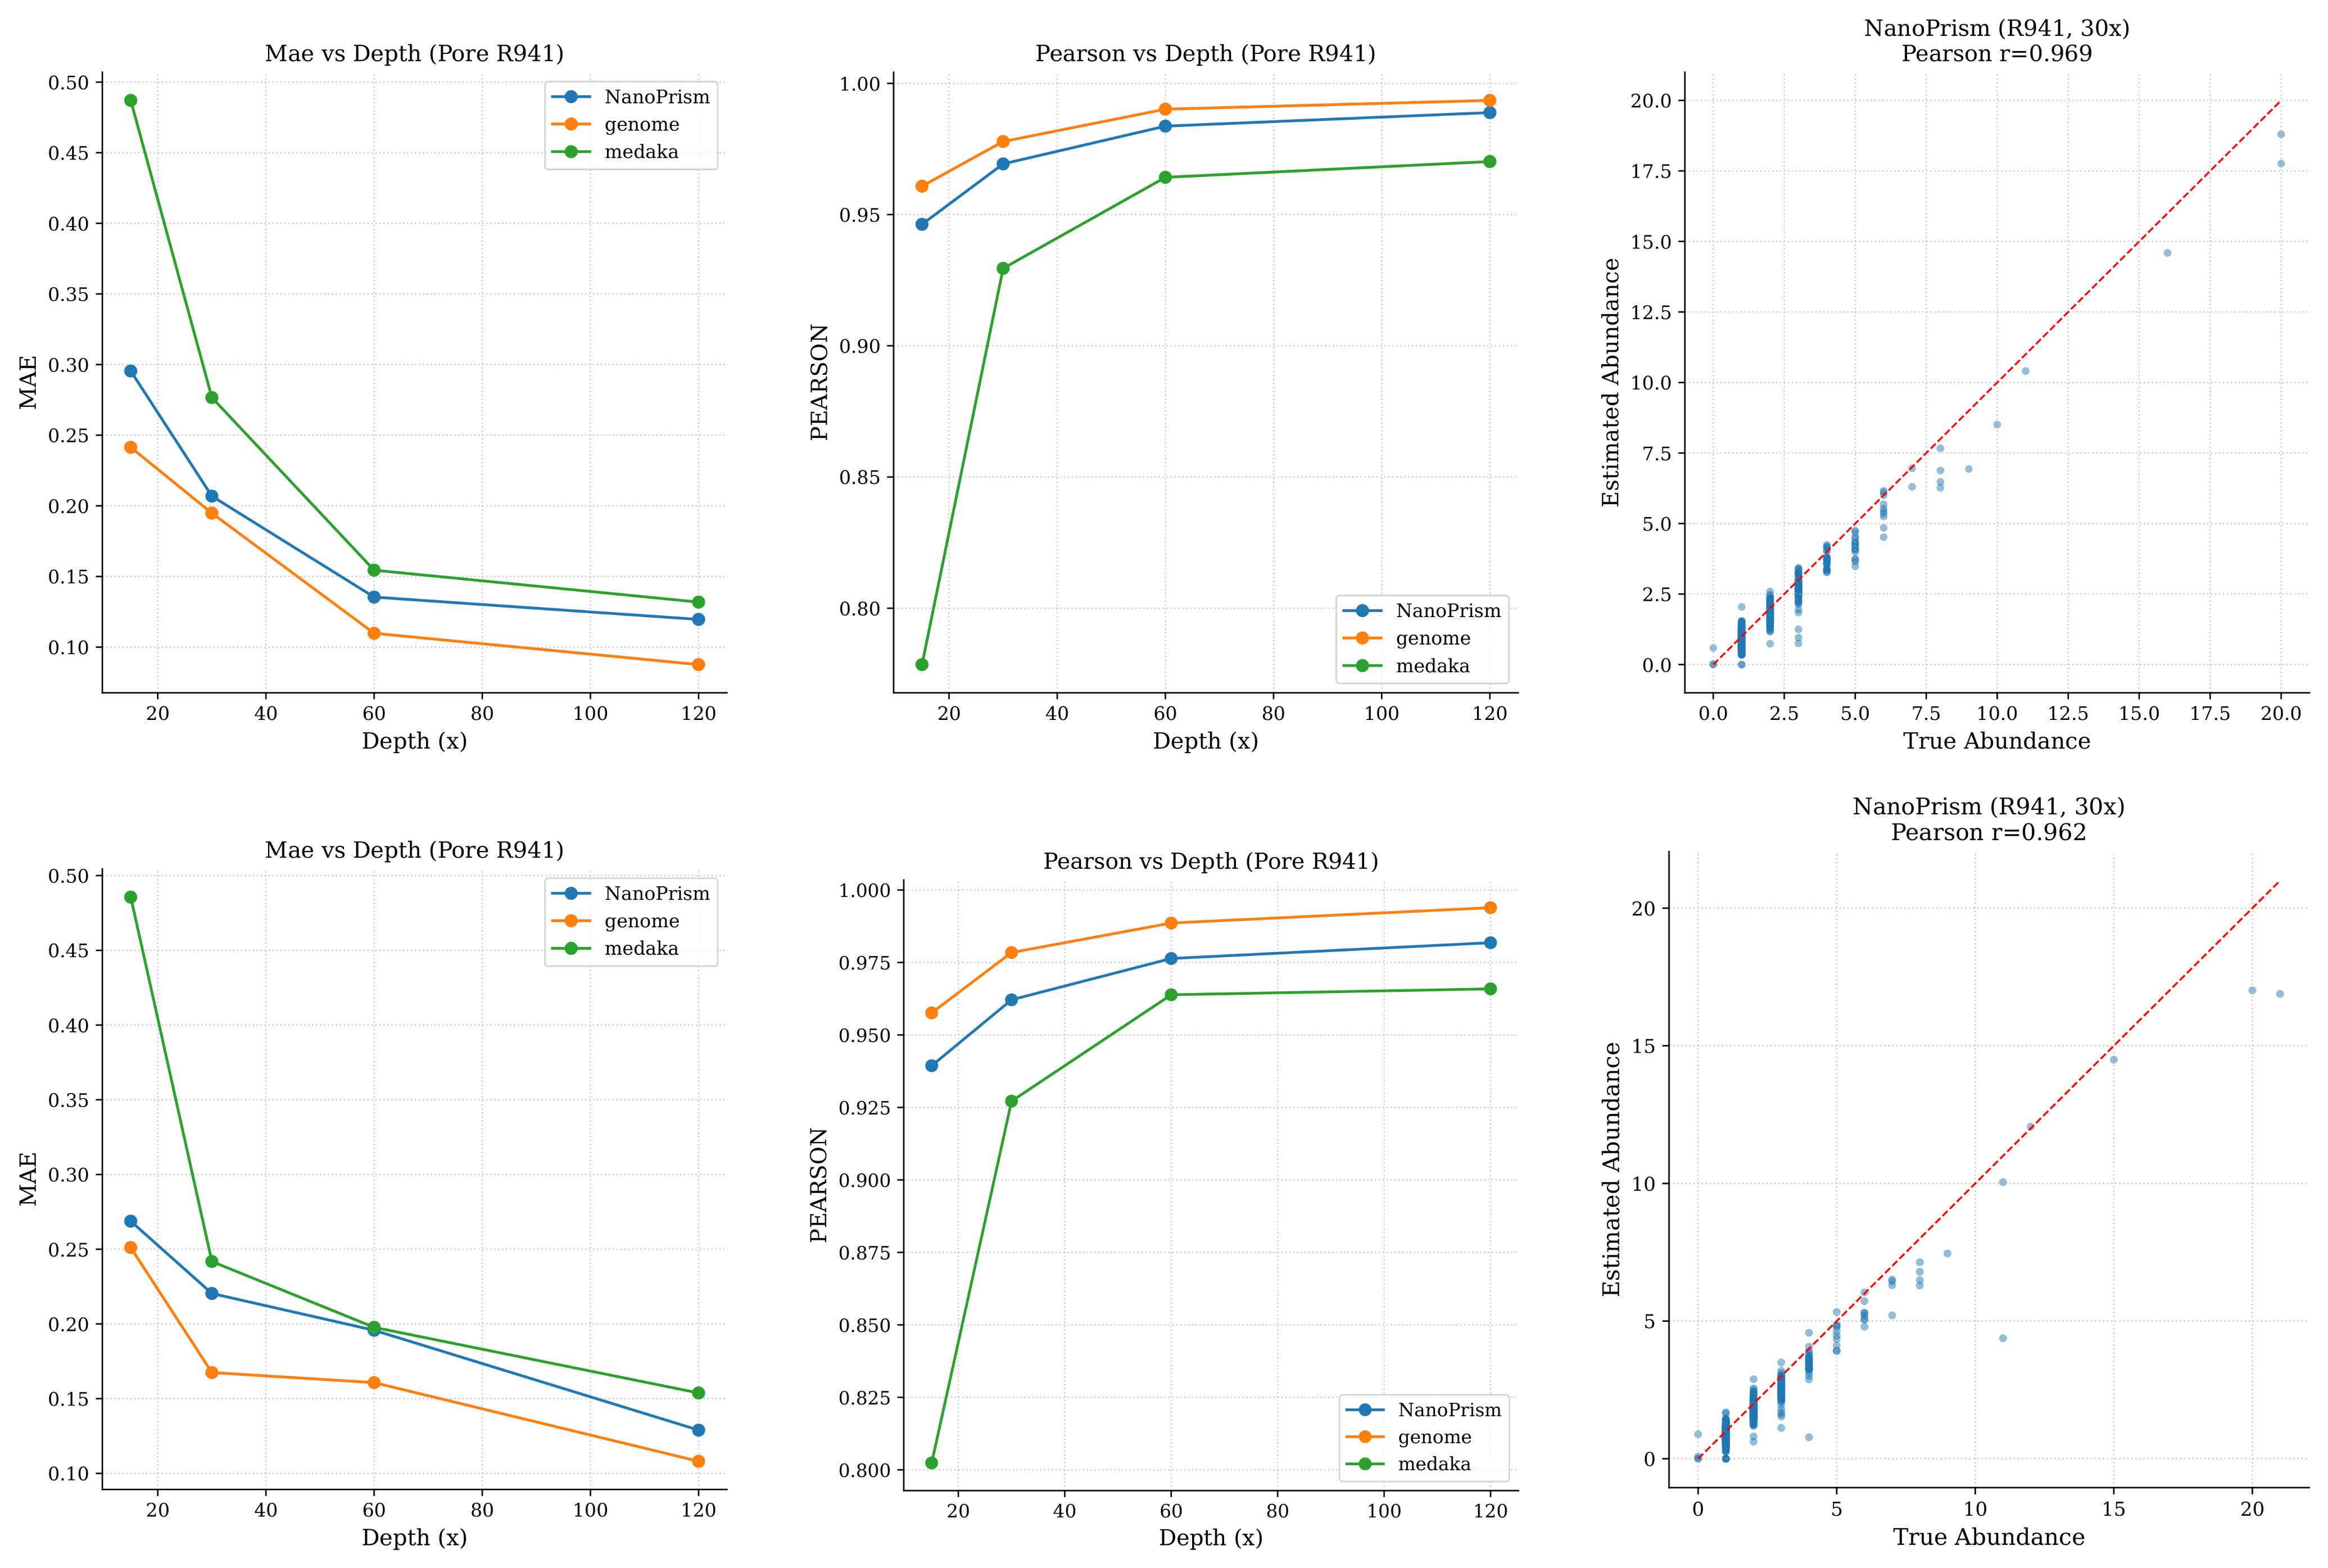
Figure 2 and
Supplementary Figure S1). Across all sequencing depths, NanoPrism approached the accuracy of the reference-genome upper bound, which by construction benefits from access to the exact reference genome. NanoPrism outperformed the Medaka-polished assembly workflow, particularly at low coverage where de novo assembly is fragmented; the assembly approach gains ground at higher depth but still trails NanoPrism on these single-isolate benchmarks. The mean absolute error (MAE) of NanoPrism’s ortholog-abundance estimates was generally below 1 across sequencing depths, indicating that direct read mapping to a curated CDS reference recovers gene-copy-number profiles accurately even from error-prone long reads.
3.2. Performance Evaluation on Microbiome Samples
Sequencing depth varied substantially across platforms. The GridION runs (ERR3152364 and ERR3152366) produced roughly 14–16 Gb from ∼3.5–3.7 million reads, while the PromethION runs (ERR3152365 and ERR3152367) yielded ∼150–153 Gb from ∼35.7 million reads. Read-length N50 averaged 5.3–5.4 kbp. Relative to the ∼61.7 Mb total reference size of the Zymo community, these yields correspond to several hundred-fold coverage for the GridION datasets and several thousand-fold coverage for the PromethION datasets. The matched Illumina datasets, ERR2984773 (Even community, ∼8.78 million reads, 2.65 Gb, >50× coverage) and ERR2935805 (Log community, ∼47.8 million reads, 9.66 Gb, >200× coverage), provide a short-read reference point. We report quantitative HUMAnN and short-read MetaPrism results below.
We compared NanoPrism with the assembly-based Flye+MetaPrism workflow and with MEGAN-LR (MEGAN6 Ultimate Edition v6.25.10, 2024 release; DIAMOND v2.1.24) on each long-read dataset.
Across both Even and Log communities, NanoPrism achieved lower MAE and higher correlations than the assembly-based workflow and MEGAN-LR under the common unit-sum normalization. The NanoPrism–MEGAN-LR comparison used matched one-million-read inputs; the assembly-based results used the full datasets and are therefore contextual rather than input-matched. These metrics compare the shape of relative KO-abundance profiles and do not validate absolute abundance scale.
On the Zymo mock communities (Even and Log) sequenced on both GridION and PromethION, NanoPrism recovered the expected ortholog profiles more closely than the assembly-based Flye+MetaPrism workflow under the normalization used here. As summarized in
Table 1, NanoPrism achieved the highest Pearson and Spearman correlations on all four datasets and lower MAE than Flye+MetaPrism under the common unit-sum normalization. Because the input sizes differed, this assembly-based comparison should be interpreted as contextual.
For the input-matched comparison, NanoPrism and MEGAN-LR were evaluated on the same first one million reads (sample.1M.fastq.gz) for each dataset. For NanoPrism, sample-specific databases were constructed from the corresponding one-million-read Kraken2 report. Additionally, every predicted and expected KO profile was independently normalized to unit sum over the community-specific set of KOs (9866 KOs for the Even community; 9739 KOs for the Log community), assigning zero abundance to undetected KOs. Under this unit-sum normalized framework, NanoPrism achieved Pearson correlations of 0.9172–0.9213 on matched one-million-read inputs (0.9167–0.9219 on full datasets), compared with 0.6361–0.6509 for matched one-million-read MEGAN-LR and 0.4303–0.7302 for Flye+MetaPrism. Jensen–Shannon distance () was 0.2127–0.2588 for one-million-read NanoPrism versus 0.4615–0.4817 for MEGAN-LR, and Mean Absolute Error () was 0.2880–0.3193 for one-million-read NanoPrism versus 0.8656–0.9036 for MEGAN-LR.
We also benchmarked computational efficiency. For the matched one-million-read GridION subsets evaluated on a 64-thread server (Intel Xeon Gold 6430 CPU, 256 GB RAM), the sum of recorded NanoPrism steps—Kraken2 classification, CDS database construction, and minimap2 alignment—was 1 h 18 m 14 s for ERR3152364 and 15 m 23 s for ERR3152366. The corresponding recorded MEGAN-LR steps—DIAMOND
blastx and
daa-meganizer—required 15 h 24 m 44 s for ERR3152364 (14 h 12 m 58 s and 1 h 11 m 46 s, respectively) and 14 h 30 m 40 s for ERR3152366 (13 h 45 m 51 s and 44 m 49 s, respectively). These values provide an input-matched comparison of the listed workflow components; they do not include unrecorded setup, reference downloading, queue time, or output extraction. Full-data NanoPrism and assembly-based timings are presented separately in
Supplementary Figure S2. Because these full-data measurements used more reads than the one-million-read MEGAN-LR runs, they are contextual workflow measurements rather than input-matched runtime comparisons.
NanoPrism’s accuracy was stable across nanopore platforms (GridION and PromethION;
Table 1). Although the PromethION delivered ∼10× the per-run yield of GridION (150 versus 14–16 Gb), correlation and MAE values were essentially identical, indicating that NanoPrism saturates well below PromethION-scale coverage on these mock communities.
Detection-oriented performance depended on both community composition and the operational abundance threshold (
Supplementary Figure S3). NanoPrism had higher above-threshold KO recall than MEGAN-LR in both communities at all three thresholds. Across the evaluated communities and thresholds, full-data NanoPrism had reference-relative KO false-discovery proportions of approximately 0.0051–0.0191, compared with approximately 0.0246–0.0459 for MEGAN-LR. Because recall varied materially with the threshold, these detection results were treated as secondary sensitivity analyses, and the principal comparison used whole-profile metrics without a detection cutoff.
For a short-read reference point, we processed the matched Illumina datasets with HUMAnN and MEGAHIT+MetaPrism under the same unit-sum profile normalization scheme. HUMAnN produced Pearson r values of 0.359 (Even) and 0.713 (Log), with of 0.730 (Even) and 0.887 (Log). MEGAHIT+MetaPrism, by contrast, achieved Pearson r of 0.897 (Even) and 0.920 (Log) with of 0.300 (Even) and 0.299 (Log), performance closely mirroring NanoPrism on long reads (correlations > 0.91, ). Taken together, these results indicate that within the mock-community benchmark used here, NanoPrism recovers expected ortholog profiles more closely than direct read-mapping approaches like HUMAnN, while assembly-based profiling with MetaPrism performs comparably on both short and long reads. Matched-depth, matched-normalization, and matched-orthology comparisons on more diverse samples will be needed before drawing broader conclusions about platform-level performance.
3.3. Effects of Omitting Species from the Reference Database
The effect of reference omission depended strongly on the abundance and functional contribution of the omitted organism (
Supplementary Table S4). In the Even community, the all-species databases produced Pearson correlations of 0.9099 and 0.9112 for GridION and PromethION, respectively. These values differ slightly from those in the primary NanoPrism benchmark using Kraken2-selected taxa because the omission experiment starts from an oracle database containing all ten known community members; the resulting CDS search spaces and competing alignment targets are therefore not identical. Omitting
Lactobacillus fermentum, which had the largest genome-copy weight in this community, reduced the correlations to 0.8610 and 0.8632. In the Log community, the all-species correlations were 0.9211 and 0.9217. Omitting the dominant
Listeria monocytogenes reference reduced them sharply to 0.2870 and 0.2944, whereas omission of low-abundance members produced substantially smaller changes. These results demonstrate that taxonomy-guided reference reduction is most vulnerable when a dominant or functionally distinctive organism is absent from the selected reference.
3.4. Yield-Conditioned Profiling Performance
We used the yield model of
Section 2.7 together with the depth-resolved benchmarks from
Section 3.1 to estimate how NanoPrism accuracy would scale with elapsed sequencing time on a MinION (
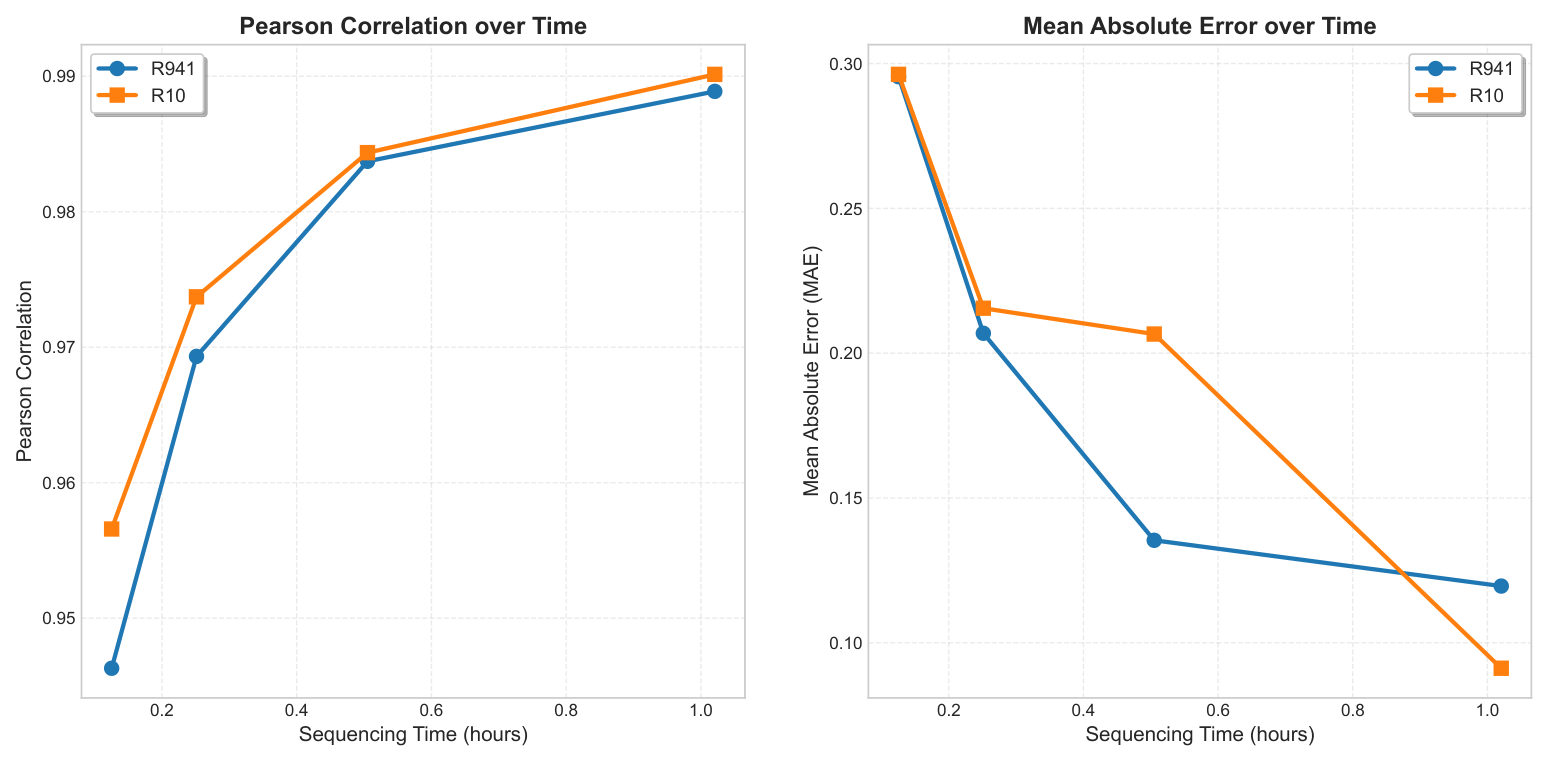
Figure 3). At the earliest interpolated time point (7.5 min, ∼15× depth on a 10 Mb genome), NanoPrism already reached Pearson correlations of 0.946 on R9.4.1 and 0.956 on R10.4.1, with MAE below 0.3. Accuracy improved steadily and plateaued by roughly 30 min (∼60× depth), where Pearson correlation exceeded 0.98 for both chemistries and MAE fell below 0.15 on R9.4.1. By 1 h of simulated sequencing (∼120× depth), correlation approached 0.99 with MAE as low as 0.091 on R10.4.1. These yield-conditioned results suggest that in the simulated single-isolate setting NanoPrism can deliver accurate ortholog estimates within minutes of sequencing start, and motivate direct validation against true streaming/real-time MinKNOW outputs as a follow-up.
4. Discussion
Long-read functional profiling sits between three imperfect strategies. Assembly-based pipelines depend on assembly quality and so degrade with low coverage, high error rates, or fragmented contigs. Direct read-to-protein approaches avoid assembly but rely on translated alignment, which is computationally expensive at metagenomic scale. Reference-genome approaches require knowing the exact strain present, and a single representative genome can miss strain-level gene-content diversity. NanoPrism is designed to occupy the gap between these alternatives by constructing a nonredundant species-specific CDS reference from multiple prioritized RefSeq/GenBank assemblies and aligning nanopore reads directly to that reference with minimap2. This sidesteps assembly-quality sensitivity, avoids translated-alignment cost, and partially mitigates single-reference bias by representing each taxon with a broader CDS repertoire.
Across the four Zymo long-read datasets, full-data NanoPrism achieved Pearson correlations of 0.9167–0.9219, Jensen–Shannon distances of 0.2109–0.2582, and values of 0.2809–0.3177 against the independent expected KO reference. On the matched one-million-read subsets, NanoPrism achieved values of 0.2880–0.3193, compared with 0.8656–0.9036 for MEGAN-LR under the same unit-sum normalization. These values evaluate relative KO-profile composition rather than absolute abundance. Together with the simulated P. aeruginosa results, these benchmarks support NanoPrism as a computationally efficient option for taxonomy-guided functional profiling of bacterial isolates and small defined communities.
Our evaluation did not include complex clinical metagenomes because few suitable, high-quality long-read benchmark datasets are available. Independent validation, replicate simulations, and empirical parameter fitting therefore remain priorities for future work.
We also note specific methodological boundaries regarding eukaryotic metagenomic members, such as the fungal species S. cerevisiae and C. neoformans in the Zymo mock community. In NanoPrism, target CDS sequences are parsed from GFF/FASTA files by concatenating CDS intervals in strand-aware order, producing exon-only CDS reference sequences. However, metagenomic long reads are derived from unspliced genomic DNA rather than RNA transcripts, so reads covering multi-exon eukaryotic genes may contain intervening introns and may not align continuously to these exon-only reference sequences. The standard minimap2 genomic-read preset (minimap2 -x map-ont) is not splice-aware and may soft-clip, split, or fail these alignments if their matching-base fraction is below 0.5, potentially leading to undercounting of multi-exon eukaryotic genes. NanoPrism does not explicitly model fungal ploidy, aneuploidy, chromosome copy-number variation, or eukaryotic marker copy variation. NanoPrism has not yet been validated as a general fungal functional-profiling method. Its use of exon-only CDS reference sequences, non-splice-aware genomic-read alignment, and bacterial-derived ribosomal marker normalization may undercount or distort fungal KO abundance. Dedicated fungal mock communities and explicit evaluation of ploidy, chromosome copy number, and marker behavior will be required before extending the present conclusions to eukaryotic metagenomes.
The experiments in which one species was omitted at a time model false-negative taxon selection by removing one known community member at a time. They do not model all forms of taxonomic-classification error, including addition of false-positive taxa, substitution by a closely related species, simultaneous errors involving several taxa, or uncertainty in communities with unknown composition. Nevertheless, the controlled design directly measures the principal consequence of taxonomy-guided reference reduction: loss of functions when a relevant organism is absent from the target database. Evaluation on complex clinical and environmental communities remains necessary.
Furthermore, we highlight methodological considerations regarding mobile genetic elements (MGEs), antimicrobial resistance (AMR) determinants, plasmids, transposons, bacteriophages, and horizontal gene transfer (HGT). Because Kraken2 selects reference species based on clade abundance rather than filtering individual reads, an unclassified read originating from a plasmid or mobile element can still align to a target CDS if a homologous, KO-annotated gene is present in the pooled reference database. To broaden coverage of the accessory genome—that is, genes present in some but not all strains of a species—NanoPrism incorporates up to 100 reference assemblies per selected taxon (prioritized by RefSeq category and assembly level), including chromosomal, plasmid, scaffold, and contig CDS records. However, this reference-dependent strategy provides only partial representation of the mobile component of the accessory genome, including genes carried on plasmids, transposons, and bacteriophages. A mobile element, plasmid, or AMR gene will be omitted if: (1) its host organism falls below the 1% taxonomic clade selection threshold; (2) the mobile gene is absent from downloaded reference assemblies; (3) the gene lacks functional KO annotation; or (4) sequence divergence exceeds the 0.5 matching-base fraction alignment threshold. Crucially, NanoPrism estimates aggregate functional abundance at the KO level. It does not resolve copy numbers for individual loci or determine whether paralogs are carried on plasmids. Analyses of physical gene linkage, mobile-element context, or novel AMR variants should therefore use NanoPrism alongside de novo assembly or specialized plasmid and AMR databases.
Despite these limitations, our analyses show that taxonomy-guided long-read mapping can recover expected KO-profile composition efficiently in bacterial isolates and the defined ZymoBIOMICS mock community. NanoPrism is therefore best viewed as a rapid, reference-dependent option for communities with well-represented reference genomes, particularly at sequencing depths where de novo assembly remains fragmented.




 ,
,