Article

Zygosity Genotyping by Pyrosequencing of SNPs rs601338 and rs1047781 of the FUT2 Gene in Children Living in the Amazon Region

by
Mauro França Silva
1,2,†,
Diego Archanjo Oliveira Rodrigues
3,†,
Letícia Bomfim Campos
1,4,
Yan Cardoso Pimenta
1,3,
Silas de Souza Oliveira
3,
Bruno Loreto de Aragão Pedroso
3,
Emanuelle Ramalho
3,
Alberto Ignacio Olivares Olivares
5,6,
José Paulo Gagliardi Leite
1,
José Júnior França de Barros
4 and
Marcia Terezinha Baroni de Moraes
1,3,*
1
Program in Tropical Medicine, Oswaldo Cruz Institute, Oswaldo Cruz Foundation, Fiocruz, Avenida Brasil, 4365-Manguinhos, Rio de Janeiro 21040-360, Brazil
2
Technological Coordination, Tetraviral Vaccine, Immunobiological Technology Institute (Biomanguinhos), Oswaldo Cruz Foundation, Fiocruz, Avenida Brasil, 4365-Manguinhos, Rio de Janeiro 21040-360, Brazil
3
Laboratory of Comparative and Environmental Virology, Oswaldo Cruz Institute, Oswaldo Cruz Foundation, Fiocruz, Avenida Brasil, 4365, Manguinhos, Rio de Janeiro 21040-360, Brazil
4
Laboratory of Molecular Virology and Parasitology, Oswaldo Cruz Institute, Oswaldo Cruz Foundation, Fiocruz, Avenida Brasil, 4365-Manguinhos, Rio de Janeiro 21040-360, Brazil
5
Secretaria Estadual de Saúde de Roraima, SESAU/RR, Rua Madrid, 180-Aeroporto, Boa Vista 69310-043, Brazil
6
College of Medicine, State University of Roraima, Avenida Helio Campo, s/n—Centro, Caracaraí, Boa Vista 69360-000, Brazil
*
Author to whom correspondence should be addressed.
These authors contributed equally to this work.
Submission received: 8 August 2025 / Revised: 22 October 2025 / Accepted: 12 November 2025 / Published: 17 November 2025

Abstract

Human populations are classified as secretors or non-secretors by, respectively, the ability to produce or not produce FUT2 enzyme (alpha-1,2-fucosyltransferase; FUT2 gene). Non-secretors have some protection against diseases and viral infections. Two single-nucleotide polymorphisms (SNPs), rs601338 (non-secretor; sese), and rs1047781 (weak secretor; Sew), are known population markers. In this study, 68 saliva samples collected from children living in the Brazilian Amazon region were evaluated for zygosity—genotyping (homozygous or heterozygous) of the rs601338 and rs1047781 SNPs by pyrosequencing. Nine children were heterozygous (Sese) for the rs601338 SNP (13.2%; 9/68) and one homozygous (sese) (1.5%; 1/68). One child that was heterozygous for the rs601338 SNP was also heterozygous for the rs1047781 SNP (Sew) (1.5%; 1/68). By using Sanger nucleotide sequencing of the FUT2 coding region, strongly linked SNPs (171A>G, 216C>T, 357T>C, 428G>A, 739G>A, 960A>G), including the FUT2*01N.02 allele (428G>A; 739A>G), were detected and have been associated with non-secretor children. A novel SNP (315C>T) and others (40A>G; 480C>T; 863C>T) detected in worldwide populations were also detected. The sensitivity of the pyrosequencing method provided an unprecedented discovery of the zygosity of the SNP rs1047781 only previously detected in East and Southeast Asians. The identification of novel SNPs in this population expands our knowledge of genetic susceptibility to viral infections.

1. Introduction

Certain viral infections are known to modify the glycosylation profile of infected cells through the overexpression of specific host cell fucosyltransferases (FUTs). Aberrant glycosylation patterns of glycoproteins and glycolipids have long been recognized as one of the major hallmarks of cancer cells [1,2]. The presence or absence of α-L-fucose on intestinal epithelial surfaces mediates genotype-dependent susceptibility to rotavirus and norovirus [3,4]. Of note, the progression to hepatocellular carcinoma (HCC), caused by infection from hepatitis B and C viruses, is associated with the glycosylation profile and the FUT2 gene [5,6].
The FUT2 gene is located on human chromosome 19 and has two exons. Two coding sequences (CDS) of 1032 bp and 999 bp (consider the latter for the FUT2 gene positions described in this article) are in exon 2 (2980 bp), which expresses the enzyme alpha-1,2-L-fucosyltransferase (α2FucT2 enzyme). The α2FucT2 adds α-L-fucose to a type 1 precursor chain in human secretions [1,7,8], containing the H antigen found in bodily fluids (secretors; Se). The FUT2 gene has significant variation with ethnic specificity, and several single-nucleotide polymorphisms (SNPs) have been reported [9]. The main rs601338 (se; 428G>A) was described by Kelly et al. (1995) [10] conferring a non-secretory phenotype for the individuals carrying the nonsense mutation. Population-specific SNPs in the “se” allele have been identified. SNPs strongly linked to se428 (171A>G, 216C>T, 357T>C, 428G>A, 739G>A, 960A>G) in the CDS are prevalent in Europeans and Africans, with a frequency of approximately 50% [11,12,13]. The rs1047781 SNP corresponds to a missense mutation commonly found in Asian populations [14]. Homozygous carriers of this mutation are considered weak secretors (Sew; 385A>T), leading to low levels of alpha-1, 2-L-fucosyltransferase enzymes and the Lea+b+ phenotype. Alpha-1,3/4-fucosyltransferase enzyme (FUT3 gene) utilizes the type 1 precursor for the conversion of Lea-, producing Leb+ [14]. The SNP rs1047781 is associated with the Lea+b+ phenotype because less type 1 H results in less Leb+, and the FUT3 enzyme converts the type 1 precursor to Lea+ more efficiently [14]. A multiplicity of research approaches, including genetic analyses, have been used to study the ancient settlement of individuals in the American continent [15]. The major question is the route of entry of the initial settlers. This central question has been approached with variable degrees of success using various types of genetic markers examined in native populations. The first studies used information from blood groups and proteins [16], after Chang et al. [17] proposed that the mutations or polymorphisms of the FUT2 gene would be important markers and could be useful for investigating population genetics.
Several molecular methods can be used to study FUT2 gene polymorphisms. Polymerase chain reaction (PCR) followed by direct Sanger nucleotide sequencing can detect single-nucleotide polymorphisms (SNPs) and copy number variations (CNVs: refer to a segment of DNA that is duplicated or deleted) [8]. Sanger nucleotide sequencing defines secretory/non-secretory status but is not suitable for determining zygosity, which is the condition of having identical (homozygous) or different (heterozygous) alleles at a given locus in the genome [18,19]. Genotyping software such as PHASE version 2.1 can be used to analyze Sanger sequencing data but can only estimate haplotypes (DNA variations such as SNPs that are inherited together because they are located close to each other on the same chromosome) [20]. The high-resolution melting (HRM) technique can define zygosity through high-resolution melting analysis, as well as restriction fragment length polymorphism (PCR-RFLP) [20]. Zygosity detection by pyrosequencing is a method that uses the principle of “sequencing by synthesis” to identify the order of DNA nucleotides, determining genetic variants and, consequently, zygosity. It works by detecting the release of pyrophosphate during nucleotide incorporation in DNA synthesis, generating a light signal proportional to the number of nucleotides incorporated [21,22]. HBGA phenotyping is often used, using ELISA with UEA-1 lectin [13], to define secretory/non-secretory status directly through saliva and identify SNPs; however, it is subject to several interpretation difficulties. Generally, phenotyping results of non-secretors/weak secretors can be considered inconclusive and should be confirmed by molecular methods [2,13]. Indeed, when Chen et al. (2017) [23] were comparing wild-type individuals homozygous for the SNP rs1047781 (AA), they found that at least one polymorphic T allele (AT or TT) showed a significant association with the clinical stage and grade associated with the development of HCC, demonstrating the importance of characterizing the zygosity profile of FUT2 gene SNPs.
The Amazon region of northwestern Brazil is home to the largest indigenous population in the country. Many young children are hospitalized mainly with viral acute gastroenteritis (AGE) [24]. This region is also endemic for hepatitis B and C virus infections, and the progression of these infections is the main cause of Hepatocellular carcinoma (HCC) [25]. The FUT2 secretor profile is predominant in children living in Amazon region [18,24,26,27]. The aim of this study was to genotype the zygosity (homozygous or heterozygous) of the single-nucleotide polymorphisms (SNPs) rs601338 (non-secretor; sese) and rs1047781 (weak secretor; Sew) of the FUT2 gene, for which we standardized a pyrosequencing method. Sixty-eight saliva samples collected from children of different indigenous ethnicities, under five years of age, living in the Amazon region, were analyzed. These samples were also subjected to Sanger nucleotide sequencing of the entire CDS of the FUT2 gene.

2. Materials and Methods

2.1. Sampling

Saliva swabs containing mucosa cells were collected from children of different indigenous ethnicities, under 5 years of age, living in the Amazon region, treated at the emergency room of the “Hospital da Criança de Santo Antônio (HCSA)”, Boa Vista city, Roraima state, northwestern Brazil. The samples for this study were collected from a total of 936 children in the years 2016 (n = 96), 2017 (n = 638), and 2021 (n = 202) during a large project to identify viruses [18,24,26,27]. In the present study, a total of 68 saliva samples were selected from these samples/children.
DNA from all samples was obtained from previously processed saliva swabs using the Loccus® automated extractor (Loccus®, São Paulo, SP, Brazil) and the Extract® DNA and RNA of Pathogens MDx kit (Loccus®), according to the manufacturer’s instructions. Immediately after being extracted, the DNAs were quantified using the Qubit Fluorometric Quantifier (Thermo Fisher Scientific, Waltham, MA, USA) according to the manufacturer’s instructions and then stored in an ultra-freezer at −80 °C until use.

2.2. Synthetic Controls of FUT2 Gene Fragments

GBlocks® synthetic controls (Integrated DNA Technologies, Newark, NJ, USA) were used to validate the pyrosequencing method for detecting SNPs rs601338 and rs1047781. The controls were as follows: FUT2_360>484_WT 5′CTGGATGGAGGAGGAATACCGCCACATCCCGGGGGAGTACGTCCGCTTCACCGGCTACCCCTGCTCCTGGACCTTCTACCACCACCTCCGCCAGGAGATCCTCCAGGAGTTCACCCTGCACGACC 3′ (wild-type, without any SNP); FUT2_360>484_MUT428 5′CTGGATGGAGGAGGAATACCGCCACATCCCGGGGGAGTACGTCCGCTTCACCGGCTACCCCTACTCCTAGACCTTCTACCACCACCTCCGCCAGGAGATCCTCCAGGAGTTCACCCTGCACGACC 3′ (rs601338); and FUT2_360>484_MUT385 5′CTGGATGGAGGAGGAATACCGCCACTTCCCGGGGGAGTACGTCCGCTTCACCGGCTACCCCTGCTCCTGGACCTTCTACCACCACCTCCGCCAGGAGATCCTCCAGGAGTTCACCCTGCACGACC 3′ (rs1047781). The gBlocks® fragments are identical except for the substitution of nucleotide G (wild) by A (SNP rs601338) and A (wild) by T (SNP rs1047781) indicated by the bold and underlined letters.

2.3. Histo Blood Group Antigen Phenotyping

Saliva samples (n = 55) collected in 2016 and 2017 showed inconclusive results when HBGA phenotyping the secretor (FUT2 gene) and Lewis profile (FUT3 gene) [18]. In this study, these 55 saliva samples were re-phenotyped (secretory and Lewis profile) along with 13 new saliva samples collected in 2021. All 68 saliva samples followed the HBGA phenotyping methodology previously described [12,13,18] using enzyme-linked immunosorbent assay (EIA) for detection of Lea, Leb, and Fucα1-2Gal-R.

2.4. PCR Amplification of FUT2 Gene

The PCR products used for pyrosequencing and Sanger nucleotide sequencing were generated using two methods, and the specificity of the two methods was compared. The chosen method was a 2-step PCR approach using first-round primers FUT_CDS_1F—5′ACTTGAGATACATGCCTGTGC 3′ (Forward) and FUT_CDS_3R—5′CCAGGCCACTGTTCACTGAG 3′ [18] which amplified a 999 bp fragment comprising the entire CDS of the FUT2 gene, according to the previously described touchdown PCR method [18]. Following a new PCR, using second-round primers FUT2_1F—5′CTGGATGGAGGAGGAATACCG 3′ (Forward) and FUT2_1R—5′ GTCGTGCAGGGTGAACTCC 3′ and 1 µL of first-round primer, PCR was performed, yielding an amplicon size 124 bp. Therefore, the following parameters were applied: annealing temperature of 60 °C and 35 cycles. The iTaq™ DNA Polymerase enzyme (Bio-Rad Laboratories, Hercules, CA, USA) was used for all PCRs according to the manufacturer’s instructions and the second-round primers were designed using the PyroMarkAssay Design Software 2.0® (QIAGEN, Hilden, Germany). All 68 samples were submitted two rounds and one round (second) of PCR amplification. Synthetic gBlocks® controls were subjected to only one round (second) of PCR amplification. For the first round with the samples and synthetic controls, 0.01 ng/µL was used. All PCR amplicons were visualized with electrophoresis on SYBR™ green I stained (Invitrogen, Carlsbad, CA, USA) agarose, Low Melting Point (LMP), and preparative grade for small fragments (Promega, Madison, WI, USA).

2.5. Validation of the Pyrosequencing Method for SNPs rs601338 and rs1047781

Validation of pyrosequencing reactions to define the zygosity of SNPs rs601338 and rs1047781 of the FUT2 gene were performed using the PyroMark Q96 ID Systems® equipment (QIAGEN), as previously described [28]. The FUT2_1F biotylated primer 5′/Biosg/CTGGATGGAGGAGGAATACCG 3′ was used with PCR amplicons from synthetic gBlocks® controls (rs601338 and rs1047781) (Section 2.4). For validation/calibration of the reaction and definition of the zygosity pattern, different mixture proportions of the gBlocks® control amplicons obtained by PCR were prepared and used in the pyrosequencing reactions; for each variant of the SNPs rs601338 and rs1047781 the following proportion of PCR amplicons was used: 100% WT (FUT2_360>484_WT) + 0% variant (FUT2_360>484_MUT428 rs601338 or FUT2_360>484_MUT385; rs1047781); 75% WT + 25% of one of the two variants; 50% WT + 50% of one of the two variants; 25% WT + 75% of one of the two variants; and 0% WT + 75% of one of the two variants. The substitutions at positions 428G>A (non-secretor; rs601338) and 385A>T (weak secretor; rs1047781) in the FUT2 gene were evaluated and genotyped as homozygous or heterozygous. The order of nucleotide dispensing was (C/T) AGGAGC (SNP rs601338) and GGA (A/T) GTGGC (SNP rs1047781). Relative nucleotide percentages were obtained from the signal intensities generated during the reaction, allowing the calculation of the variant allele proportion at each position. This proportion was determined by dividing the percentage of the variant allele by the sum of the percentages of the variant and wild-type alleles.

2.6. Pyrosequencing for SNPs rs601338 and rs1047781 of Sixty-Eight Saliva Samples from Children of Different Indigenous Ethnicities

After calibration all 68 samples were genotyped in duplicate using the previously obtained PCR amplicons from the first and second rounds as described above (Section 2.4). The results obtained were analyzed to define the zygosity by comparing them with the results obtained from the validation/calibration described in Section 2.5. The analysis performed is described as follows (Section 2.7).

2.7. Statistical Analysis

Pyrosequencing results were evaluated using PyroMarkAssay Design Software 2.0® (QIAGEN). Statistical analysis of allelic inference (genotyping) was performed using predefined variant proportion (including duplicates) thresholds: samples below 0.15 were classified as wild-type homozygotes, those between 0.15 and 0.85 as heterozygotes, and those above 0.85 as variant homozygotes. These thresholds were defined based on synthetic gBlocks® control data and are consistent with previously described quantitative strategies for pyrosequencing-based allelic expression analysis [21,22]. Data visualization was performed using scatter plots generated in R software (version 4.5.1) within the RStudio environment version 2025.09.2-418. The ggplot2 (visualization), dplyr (data manipulation), readxl (spreadsheet import), and writexl (results export) packages were employed. Samples were displayed in distinct colors according to the inferred allelic profile, and a linear regression model without intercept was fitted to the experimental points. For calibration, a proportional linear regression model without intercept was fitted exclusively to synthetic gBlocks® controls. To avoid bias from deviating controls, we included only controls with absolute error <0.10 (difference between the control’s known proportion and the model-predicted proportion). The calculated R2 value represents a measure of the goodness of fit of the proportional model. The analyses were performed using the R software (version 4.5.1) in the RStudio environment [29,30].
For Sanger nucleotide sequencing analysis, the electropherograms of the FUT2 gene nucleotide sequences were analyzed using the free tracer viewer Chromas 2.4 (Technelysium Pty Ltd., South Brisbane, Australia). Polymorphisms were verified using the Mega Molecular Evolutionary Genetic Analysis Version X software and compared with reference nucleotide sequences accession number U17894 (FUT2 gene), NR_004401.2, and U17895.1 (Secretory blood group 1, pseudogene; SEC1P) of the National Center for Biotechnology Information.

2.8. Sanger Nucleotide Sequencing of the FUT2 Gene

The PCR amplicons from all 68 samples obtained by one or two rounds (Section 2.4) were submitted to the Sanger nucleotide sequencing. Besides the same primers used to obtain the PCR amplicons (Section 2.4) internal primers FUT2_CDS_2F and FUT2_CDS_2R for first round PCR nucleotide sequencing were used. The Sanger Nucleotide sequencing was performed by the company “ACT Gene—Análises Moleculares” (Porto Alegre, RS, Brazil).

3. Results

3.1. Specificity of Pyrosequencing for Detection of SNPs rs601338 and rs1047781

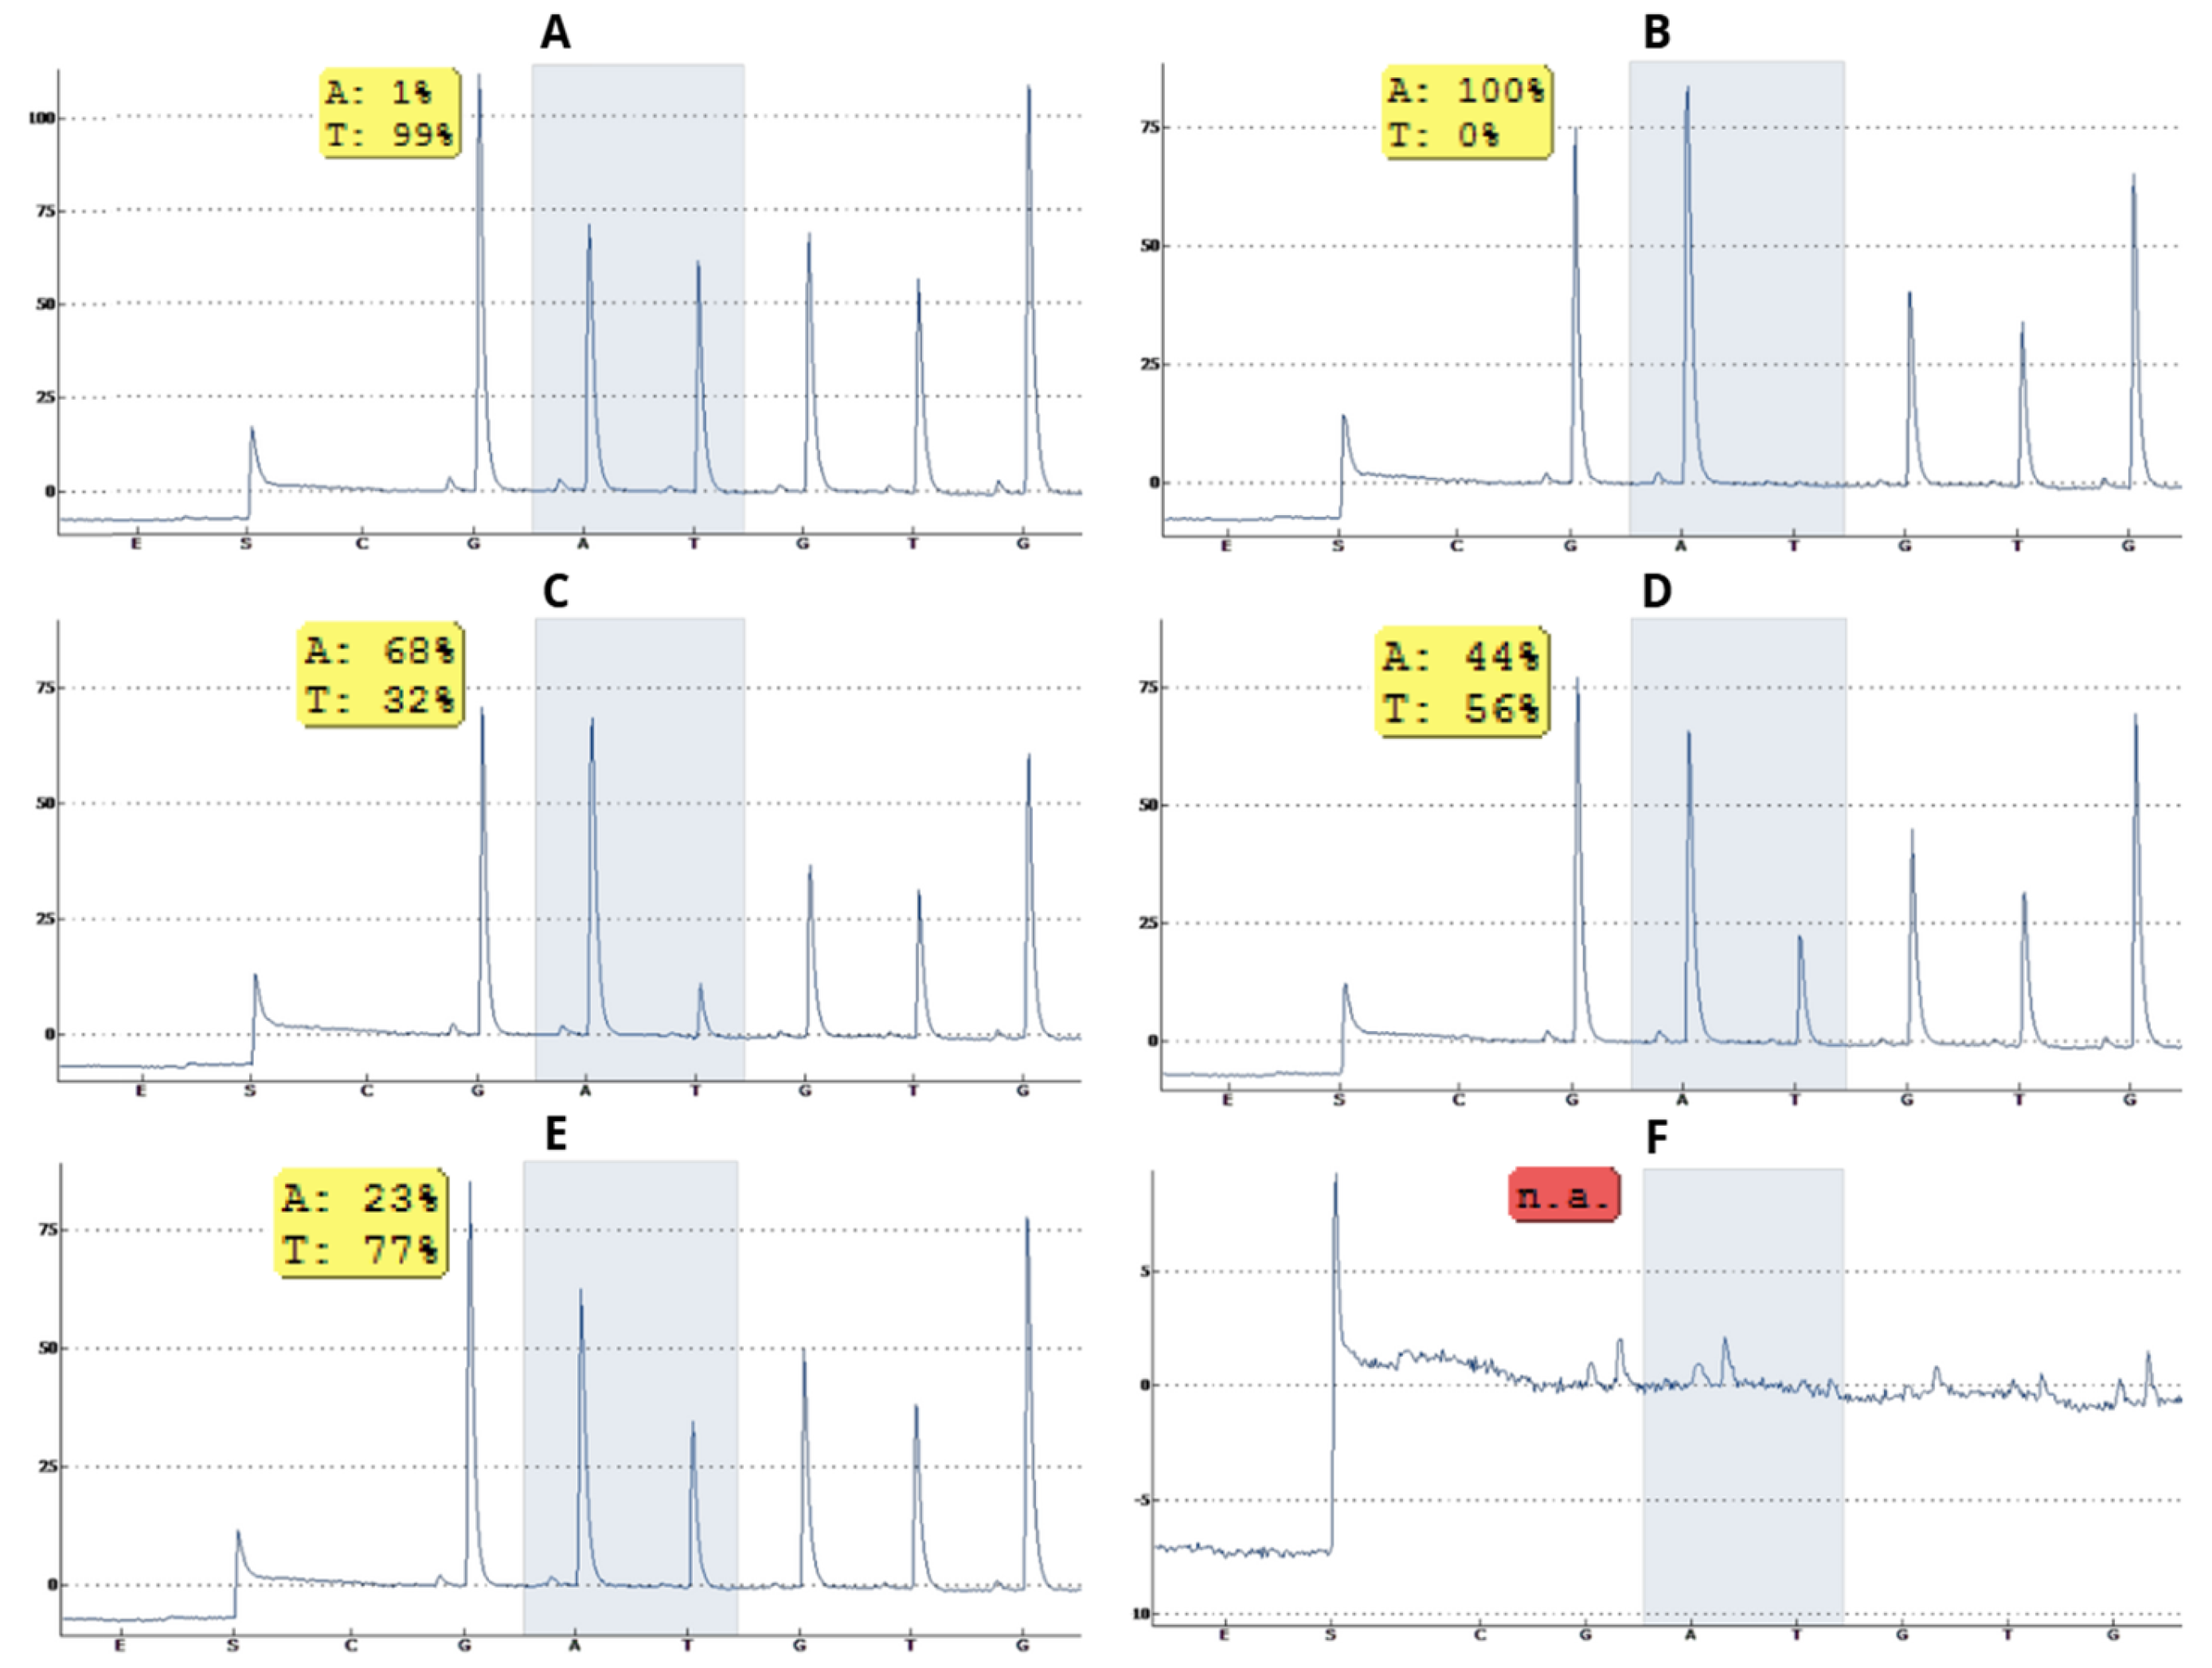
Validation/calibration consisted of using the synthetic sequence containing or not one of the SNPs to be investigated (rs601338 or rs1047781), as described in Section 2.5. These SNPs are located in close proximity in the FUT2 gene region (respectively, at positions 428 and 385). Therefore, a single synthetic gBlock was used as a wild-type (WT) synthetic control for both reactions, one for each different SNP (Section 2.2). On the other hand, to enable the calibration and statistical calculation described previously, different proportions (mixtures) of the PCR amplicons were used. It was observed that the percentage values corresponded with a minimum margin of error to the proportions described in Section 2.5. The PCR amplicons of the gBlocks® synthetic controls used in pyrosequencing generated detection results for the SNPs rs601338 and rs1047781, with validation/calibration pyrograms meeting the acceptance criteria of the PyroMark Q96 ID Systems® (QIAGEN). This criterion validates the method (Figure 1 and Figure 2).
The amplicons obtained by PCR using primers FUT2_1F and FUT2_2F (first and second round), subjected to Sanger nucleotide sequencing, confirmed specificity to the FUT2 gene and not the SEC1P (a FUT2 pseudogene) by BLAST (Version 2.17.0) analysis of the nucleotide sequences against the National Center for Biotechnology Information (NCBI) database. Although seven samples showed some degree of similarity to the SEC1 gene, all exhibited greater similarity to the FUT2 gene in terms of percent identity, query coverage, and E-value.

3.2. Zygosity Profile of SNPs rs601338 and rs1047781 of the FUT2 Gene of Children Living in the Amazon Region Is Predominantly Homozygous Secretor

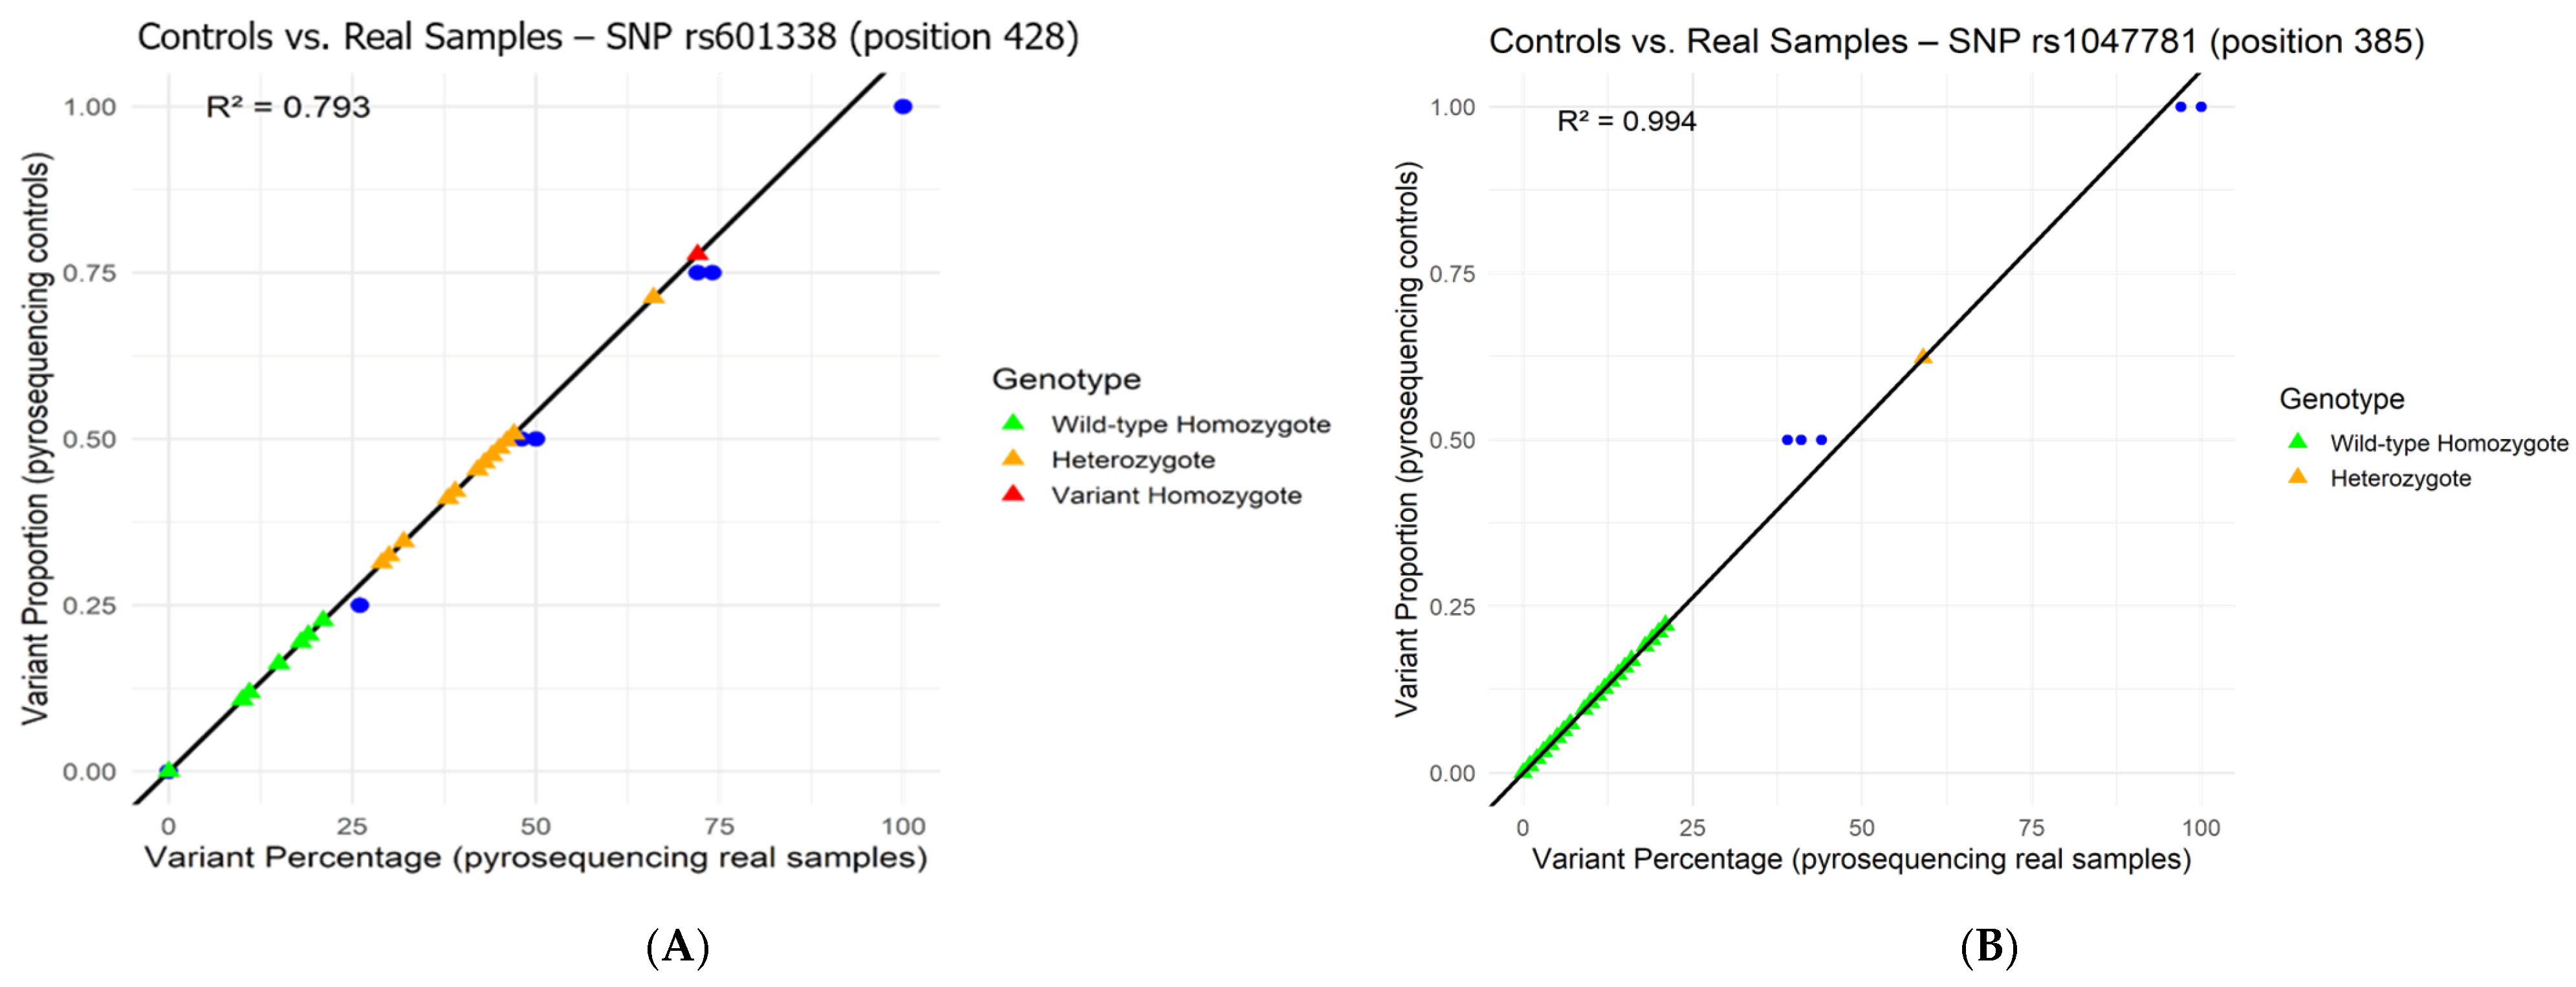
All 68 samples collected from children living in the northwest of the Amazon were verified for the presence and genotype of the SNPs selected in this study by pyrosequencing. Nine children were genotyped as heterozygous (Sese) for the rs601338 SNP (13.2%; 9/68) and one as homozygous (sese) (1.5%; 1/68). One child that was heterozygous for the rs601338 SNP was also compound heterozygous, presenting the rs1047781 SNP (Sew) (1.5%; 1/68). In 85.3% (58/68) of the samples neither of the two SNPs were detected. The following graphs represent the relationship between the percentage of alleles detected by pyrosequencing and the measured proportion of these alleles in the real samples, compared with the linear regression model adjusted using synthetic gBlocks® controls for the SNPs rs601338 (Figure 3A) and rs1047781 (Figure 3B) of the FUT2 gene. The coefficients of determination R2 were 0.793 (rs601338; position 428) and 0.994 (rs1047781; position 385).

3.3. Correlation Between the Results Obtained by HBGA Phenotyping, Pyrosequencing, and Sanger Nucleotide Sequencing and Methods Applied to Samples in This Study

Sixty-eight saliva samples collected in 2016, 2017, and 2021 from children living in northwestern Amazonia were phenotyped by HBGA in this study. The results are presented in Table S1, (Supplementary Material). Of the 55 samples phenotyped in this study, collected in 2021, 40 were collected from children HBGA phenotyped as secretors and Lea-Leb+. The HBGA profile (Secretor and Lewis), verified through phenotyping of saliva collected from 15 children, was considered inconclusive since the absorbance values of Fucα1-2Gal-R detection were very low with Lea-leb- [18]. Of the 13 samples phenotyped in this study, collected in 2021, 2 were considered weak secretor (Sew) candidates, since the absorbance values to Lea and Leb were very high (overflow), 5 were secretors (Lea-Leb+), 5 were inconclusive (Lea-Leb-), and 1 was considered non-secretor.
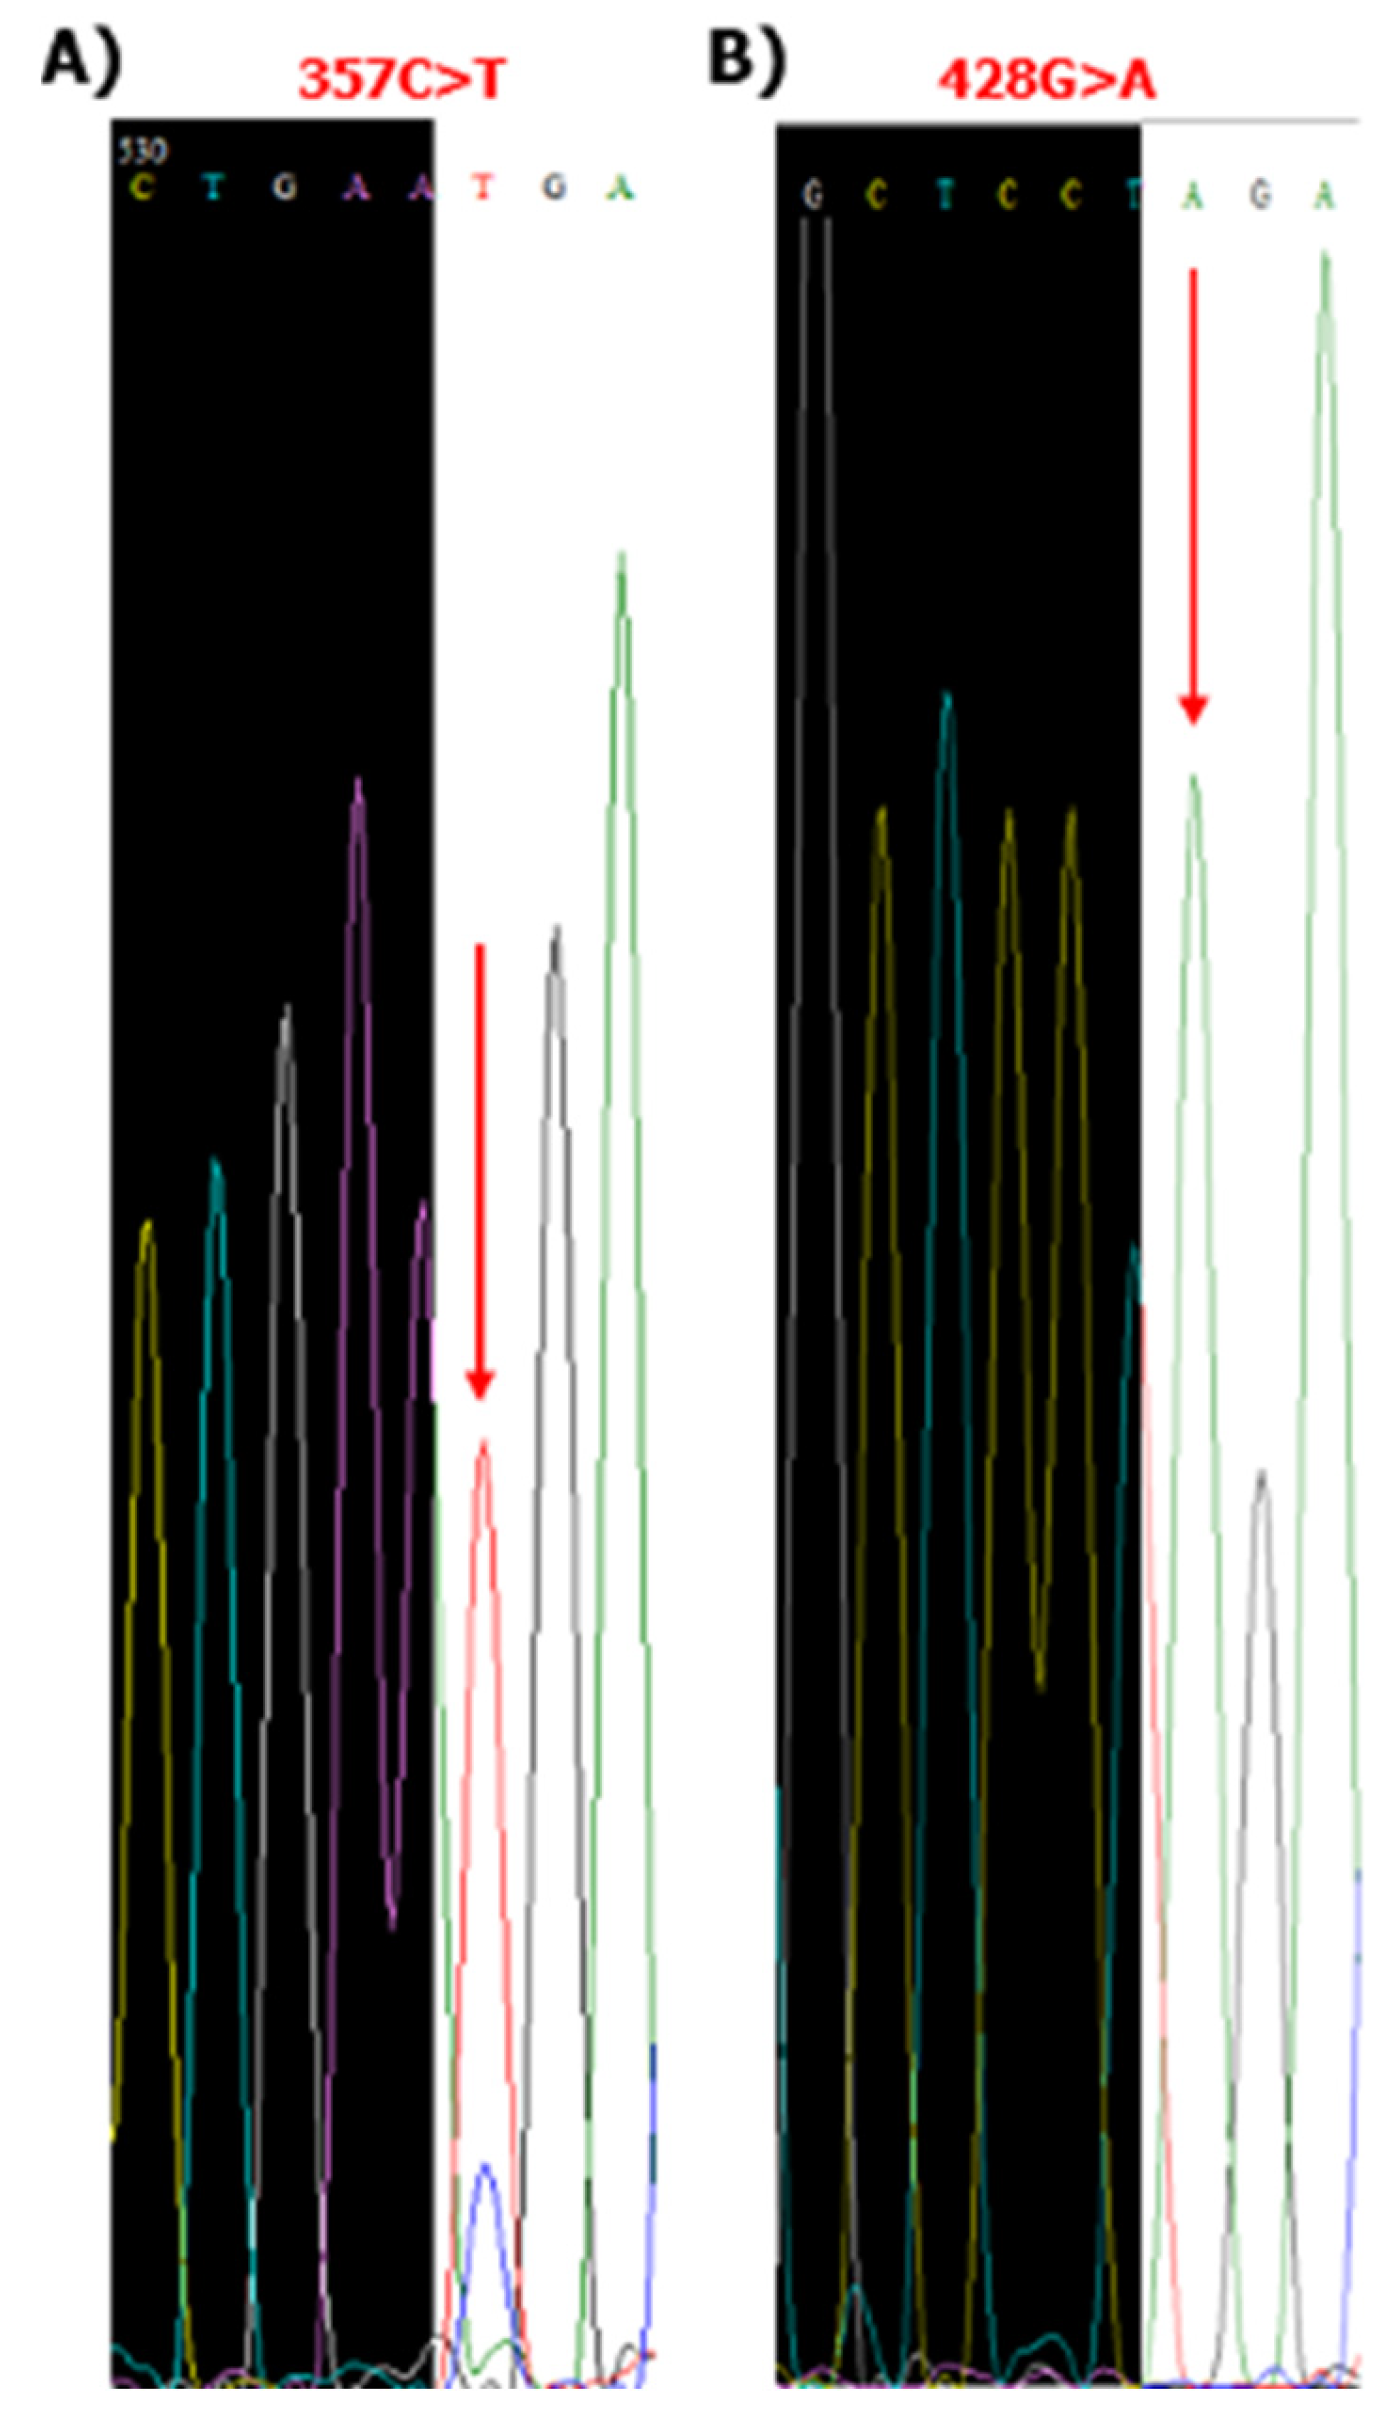
The nucleotide sequence of the CDS fragment of the FUT2 gene (999 bp) of all 68 samples collected from children living in northwestern Amazonia was also obtained by the Sanger nucleotide sequencing. SNPs detected in the small population of this study were classified here according to their high (>50% of samples) and low frequency (<15% of samples), as follows: high frequency: 357T>C (83.8%); and low frequency: 171A>G (25%), 216C>T (25%), 428G>A (14.7%), 739G>A (25%), and 960A>G (27.9%). SNPs 40A>G, 315C>T, and 863C>T were also detected in one single sample separately (1.4%) and 480C>T in two samples (2.9%) (Table S1, Supplementary Material). Figure 4 shows the electropherogram obtained by nucleotide sequencing using the Sanger nucleotide sequencing of the sample genotyped by pyrosequencing as a homozygous non-secretor. SNP rs601338 (428G>A) was apparently homozygous when analyzed using the Sanger method. Confirmation was obtained through pyrosequencing, which quantified the molecules with this mutation and confirmed homozygosity. For SNP rs281377 (357C>T) the presence of an overlapping peak suggests that this SNP is heterozygous; however, the Sanger method was unable to confirm this visual information.
Comparing the results obtained through the methodologies of HBGA phenotyping, pyrosequencing, and Sanger nucleotide sequencing applied to saliva samples collected from children living in the northwest of the Brazilian Amazon region, it was possible to observe a correlation between all the results obtained. There was no detection of SNPs rs601338 and rs1047781 for all saliva samples HBGA phenotyped as secretors (Lea-Leb+ n = 44; Lea-Leb- n = 1) collected from the children in this study. By Sanger nucleotide sequencing of the FUT2 gene, the rs601338 and rs1047781 SNPs were also not detected. SNP rs281377 (357 C>T) was detected in forty children (88.8%; 40/45); SNP 40A>G in one; and three children did not present any SNP in the CDS of the FUT2 gene when compared to the reference nucleotide sequences accession number U17894 of FUT2 (Table S1, Supplementary Material). Through phenotyping, it was not possible to define the HBGA profile of 20 children; the results were inconclusive. Through the combined methodologies of pyrosequencing and Sanger nucleotide sequencing, it was possible to define the HBGA profile (Table S1, Supplementary Material).

3.4. Sese428 Tightly Linked SNPs (171A>G, 216C>T, 357T>C, 428G>A>A, 739G, 960A>G) Were Detected in the Children Living in the Northwest of the Brazilian Amazon Region by Sanger Nucleotide Sequencing

The IDs 32343 and 32371 samples (Table 1), phenotyped as weak secretors and genotyped by pyrosequencing as heterozygous, presented the tightly linked SNPs 171A>G, 216C>T, 357T>C, 428G>A, 739G>A, 960A>G [20]. A schematic Figure 5 shows the detected SNPs and their proximity within the coding region of the FUT2 gene. These samples also showed the SNPs 385A>T and 863C>T, respectively. All 10 samples genotyped as heterozygous (9) or homozygous (1) for the SNP rs601338 presented the allele FUT2*01N.02 [31].

4. Discussion

The identification of the secretory/non-secretory status of the FUT2 gene in the population is performed through HBGA phenotyping, followed by confirmation/investigation of the rs601338 SNP through Sanger nucleotide sequencing [2,8]. However, Sanger nucleotide sequencing is not capable of genotyping zygosity (homozygous or heterozygous). The molecular pyrosequencing methodology was used in this study due to its versatility and accuracy. It can be applied to characterize the allelic composition (genotype) of different regions of the genome, both in homozygous and heterozygous individuals, that define zygosity. Given the high degree of homology between the nucleotide sequence of the FUT2 gene and the SEC1P pseudogene [10], Sanger sequencing of the PCR amplicons submitted to pyrosequencing and analysis of nucleotide sequences using BLAST parameters (NCBI) provided confidence in specificity for the FUT2 gene. The coefficient of determination (R2) for the SNP rs601338 was 0.793, which is considered good and indicates that the model (pyrosequencing) explains approximately 79.3% of the variability in the data. Only one sample of the 51 samples phenotyped as non-secretors was genotyped homozygous for the rs601338 SNP of the FUT2 gene. HBGA phenotyping was inaccurate for the samples in this study, which may be due to the complexity of the genetic variations existing in children from the Amazon region, as well as due to the limitations for rare phenotypes [32,33,34,35]. The use of the Sanger nucleotide sequencing method would not be sufficient since the SNP rs601338 would be detected, but since this is associated with the non-secretor status in individuals with a homozygous genotype, the result would be incorrect. In fact, only one child was homozygous for the SNP rs601338. The coefficient of determination (R2) for SNP rs1047781 was higher with a value of 0.994, which is considered excellent. The detection of the SNP rs1047781 heterozygous in a child living in the northwest of the Amazon region was an unprecedented finding, demonstrating the particularity of the Amazon region. The rs1047781 has been detected exclusively in the East and Southeast Asian population, with a frequency of around 46.2% in the Chinese population [13]. However, this finding only becomes significant if it is possible to perform a more in-depth analysis that represents the circulation of this SNP in the Amazonian population. Homozygosity or compound heterozygosity for null alleles of the FUT2 gene are associated with a non-secretor status (Se), with identification of the rs601338 SNP being the most common cause. All other null alleles and deletions of the FUT2 gene are rare variants [31,36,37].
Ferrer-Admetlla et al. 2009 [9] presented the frequency of SNPs rs601338 and rs1047781, resequencing the CDS of the FUT2 gene of 732 individuals from 39 human populations worldwide using the Sanger nucleotide sequencing method. The frequencies (%) were, respectively: Europe 42.9 and 0.4; Middle East 56 and 0; Central South Asia 32.9 and 4.1; East Asia 0.7 and 43.8; Oceania 0 and 6.5; America 2.6 and 0; Sub-Saharan Africa 22 and 0. The authors reported that although frequencies of these SNPs are similar in different populations, the point mutations at the base of the phenotypes are different, with some variants showing a long history of balancing selection among Eurasian and African populations, and one recent variant showing a fast spread in East Asia, likely due to positive selection. Soejima and Koda, 2020 [20] and 2019 [38] investigated the SNPs of the FUT2 gene in the Central American population (Mexicans, Puerto Ricans, Caribbeans, and Colombians) and South American population (Peru). The presence of SNPs rs281377 (357T>C) and rs601338 in the Brazilian population has also been detected [18,39] and confirmed in this study. The high frequency of the SNP rs281377 (357T>C) reported in populations from Central and South America of 46.7% [20,38] and Africa of 80.7% [40,41] is like that detected in our study.
We verified SNPs identified in different populations which were detected in a single sample of the population of this study, namely 40A>G (Africans, Puerto Ricans), 480C>T (Africans, South and East Asians, Europeans) and 863C>T (Telugu Indians in the United Kingdom). All these SNPs were associated with secretor status; however, the frequency of these SNPs in these different populations has not been reported [40].
In the study presented here, the SNP 315C>T (missense mutation) was identified, which had not been previously reported in other populations. The value of this SNP in affecting FUT2 secretion requires further studies. The heterozygosity data for the SNP rs601338 is new and the few non-secretor/weak secretor individuals could not be explained by this SNP but rather by the presence of linked SNPs, as shown previously [37], especially the null allele FUT2*01N.02 [31] of the FUT2 gene conferring the non-secretor status. Furthermore, the presence of Sese428 tightly linked SNPs [20] in children living in the Amazon region, also identified in the central American and east and southeast Asian populations, together with the first reported presence of the SNP rs1047781, raises questions about the origin of populations in the Americas that have not yet been answered.
The major limitation of our study concerning the association of SNPs in the FUT2 gene with non-secretory status was the small number of non-secretor children for statistical significance. Indeed, few samples from non-secretor children were identified by the phenotyping method, such as in the samples collected in 2016/2017 (8.2%) [18]. Therefore, studies will be needed to verify and associate SNPs with the activity of the enzyme α (1,2) fucosyltransferase (FUT2, gene), as previously presented by Soejima and Koda, 2021 [40]. Additionally, the use of the validated pyrosequencing method could be applied to allow the precise identification of non-secretor individuals and their association with SNPs identified in the Brazilian population.

5. Conclusions

The pyrosequencing method can be used in larger population samples. The knowledge of the polymorphism pattern of FUT2 enzyme expression is crucial to clarify its role in various pathologies and to identify potential new diagnostic targets for these diseases.

Supplementary Materials

The following supporting information can be downloaded at: https://www.mdpi.com/article/10.3390/dna5040054/s1, Table S1: HBGA Phenotyping, pyrosequencing, and Sanger nucleotide sequencing results.

Author Contributions

Conceptualization, M.T.B.d.M. and J.P.G.L.; methodology, M.F.S., D.A.O.R., L.B.C., Y.C.P., S.d.S.O., B.L.d.A.P., E.R. and M.T.B.d.M.; software, M.F.S., D.A.O.R., Y.C.P., J.J.F.d.B. and M.T.B.d.M.; validation, M.F.S., D.A.O.R., L.B.C., Y.C.P., S.d.S.O., B.L.d.A.P., E.R. and M.T.B.d.M.; formal analysis, M.F.S., D.A.O.R., L.B.C., Y.C.P., J.J.F.d.B., A.I.O.O. and M.T.B.d.M.; investigation, M.F.S., D.A.O.R., L.B.C., Y.C.P., S.d.S.O., B.L.d.A.P. and M.T.B.d.M.; resources, M.F.S., D.A.O.R., L.B.C., Y.C.P. and M.T.B.d.M.; data curation, A.I.O.O., J.P.G.L. and M.T.B.d.M.; writing—original draft preparation, M.F.S., D.A.O.R., Y.C.P. and M.T.B.d.M.; writing—review and editing, M.T.B.d.M. and J.P.G.L.; visualization, M.F.S., D.A.O.R., L.B.C., Y.C.P., J.P.G.L. and M.T.B.d.M.; project administration, M.T.B.d.M.; funding acquisition, M.T.B.d.M. and J.P.G.L. All authors have read and agreed to the published version of the manuscript.

Funding

This study was funded by The National Council for Scientific and Technological Development (CNPq, 408463/2022-8); the Foundation for Research Support of the State of Rio de Janeiro (FAPERJ, E26/210.701/2024); and the Oswaldo Cruz Institute (IOC/CNPq/PROEP 441653/2024-3). José Paulo Gagliardi Leite is CNPq, 310908/2020-5 fellow.

Institutional Review Board Statement

This study is currently approved by the Ethics Committee of the “Universidade Federal de Roraima” (UFRR), Brazil (Approval number: CAAE 45542515.1.0000.5302, on 23 November 2015), and was conducted according to the guidelines of the Declaration of Helsinki. Samples were manipulated anonymously, and patients’ data were maintained securely.

Informed Consent Statement

Patient-informed consent was waived by the Fiocruz Ethical Committee, and patients’ data were maintained anonymously and securely.

Data Availability Statement

The original contributions presented in this study are included in the article. Further inquiries can be directed to the corresponding author.

Acknowledgments

The authors acknowledge all children and their parents for making this study possible. Thanks to Isabelle Baroni de Moraes e Souza for the English revision.

Conflicts of Interest

The authors declare no conflicts of interest.

References

  1. Roy, R. Cancer cells and viruses share common glycoepitopes: Exciting opportunities toward combined treatments. Front. Immunol. 2024, 15, 1292588. [Google Scholar] [CrossRef]
  2. Cooling, L. Blood Groups in Infection and Host Susceptibility. Clin. Microbiol. Rev. 2015, 28, 801–870. [Google Scholar] [CrossRef]
  3. Nordgren, J.; Svensson, L. Genetic Susceptibility to Human Norovirus Infection: An Update. Viruses 2019, 11, 226. [Google Scholar] [CrossRef] [PubMed]
  4. Sharma, S.; Hagbom, M.; Svensson, L.; Nordgren, J. The Impact of Human Genetic Polymorphisms on Rotavirus Susceptibility, Epidemiology, and Vaccine Take. Viruses 2020, 12, 324. [Google Scholar] [CrossRef] [PubMed]
  5. Mehta, A.; Herrera, H.; Block, T. Glycosylation and liver cancer. Adv. Cancer Res. 2015, 126, 257–279. [Google Scholar] [PubMed]
  6. Maroni, L.; Hohenester, S.D.; van de Graaf, S.F.J.; Tolenaars, D.; van Lienden, K.; Verheij, J.; Marzioni, M.; Karlsen, T.H.; Oude Elferink, R.P.J.; Beuers, U. Knockout of the primary sclerosing cholangitis-risk gene Fut2 causes liver disease in mice. Hepatology 2017, 66, 542–554. [Google Scholar] [CrossRef] [PubMed]
  7. Kelly, R.J.; Ernst, L.K.; Larsen, R.D.; Bryant, J.G.; Robinson, J.S.; Lowe, J.B. Molecular basis for H blood group deficiency in Bombay (Oh) and para-Bombay individuals. Proc. Natl. Acad. Sci. USA 1994, 91, 5843–5847. [Google Scholar] [CrossRef]
  8. Daniels, G. ABO, H, and Lewis systems. In Human Blood Groups; Wiley-Blackwell: West Sussex, UK, 2013; pp. 11–95. [Google Scholar]
  9. Ferrer-Admetlla, A.; Sikora, M.; Laayouni, H.; Esteve, A.; Roubinet, F.; Blancher, A.; Calafell, F.; Bertranpetit, J.; Casals, F. A natural history of FUT2 polymorphism in humans. Mol. Biol. Evol. 2009, 26, 1993–2003. [Google Scholar] [CrossRef]
  10. Kelly, R.J.; Rouquier, S.; Giorgi, D.; Lennon, G.G.; Lowe, J.B. Sequence and expression of a candidate for the human Secretor blood group alpha (1,2) fucosyltransferase gene (FUT2). Homozygosity for an enzyme-inactivating nonsense mutation commonly correlates with the non-secretor phenotype. J. Biol. Chem. 1995, 270, 4640–4649. [Google Scholar] [CrossRef]
  11. Soejima, M.; Koda, Y. Molecular mechanisms of Lewis antigen expression. Leg. Med. 2005, 7, 266–269. [Google Scholar] [CrossRef]
  12. Soejima, M.; Fujimoto, R.; Agusa, T.; Iwata, H.; Fujihara, J.; Takeshita, H.; Minh, T.B.; Trang, P.T.; Viet, P.H.; Nakajima, T.; et al. Genetic variation of FUT2 in a Vietnamese population: Identification of two novel Se enzyme-inactivating mutations. Transfusion 2012, 52, 1268–1275. [Google Scholar] [CrossRef]
  13. Koda, Y.; Tachida, H.; Pang, H.; Liu, Y.; Soejima, M.; Ghaderi, A.A.; Takenaka, O.; Kimura, H. Contrasting patterns of polymorphisms at the ABO-secretor gene (FUT2) and plasma alpha (1,3) fucosyltransferase gene (FUT6) in human populations. Genetics 2001, 158, 747–756. [Google Scholar] [CrossRef]
  14. Henry, S.; Mollicone, R.; Fernandez, P.; Samuelsson, B.; Oriol, R.; Larson, G. Molecular basis for erythrocyte Le (a+ b+) and salivary ABH partial-secretor phenotypes: Expression of a FUT2 secretor allele with an A-->T mutation at nucleotide 385 correlates with reduced alpha (1,2) fucosyltransferase activity. Glycoconj. J. 1996, 13, 985–993. [Google Scholar] [CrossRef]
  15. Ruiz-Linares, A. How genes have illuminated the history of early Americans and Latino Americans. Cold Spring Harb. Perspect. Biol. 2014, 7, a008557. [Google Scholar] [CrossRef] [PubMed]
  16. Cavalli-Sforza, L.L.; Menozzi, P.; Piazza, A. The History and Geography of Human Genes, Abridged Paperback ed.; Princeton University Press: Princeton, NJ, USA, 1994. [Google Scholar]
  17. Chang, J.G.; Ko, Y.C.; Lee, J.C.; Chang, S.J.; Liu, T.C.; Shih, M.C.; Peng, C.T. Molecular analysis of mutations and polymorphisms of the Lewis secretor type alpha (1,2)-fucosyltransferase gene reveals that Taiwan aborigines are of Austronesian derivation. J. Hum. Genet. 2002, 47, 60–65. [Google Scholar] [CrossRef] [PubMed]
  18. Moraes, M.T.B.; Olivares, A.I.O.; Fialho, A.M.; Malta, F.C.; da Silva, S.M.J.; Bispo, R.S.; Velloso, A.J.; Leitão, G.A.A.; Cantelli, C.P.; Nordgren, J.; et al. Phenotyping of Lewis and secretor HBGA from saliva and detection of new FUT2 gene SNPs from young children from the Amazon presenting acute gastroenteritis and respiratory infection. Infect. Genet. Evol. 2019, 70, 61–66. [Google Scholar] [CrossRef] [PubMed]
  19. Liu, Z.; Huang, C.J.; Huang, Y.H.; Pan, M.H.; Lee, M.H.; Yu, K.J.; Pfeiffer, R.M.; Viard, M.; Yuki, Y.; Gao, X.; et al. HLA Zygosity Increases Risk of Hepatitis B Virus-Associated Hepatocellular Carcinoma. J. Infect. Dis. 2021, 224, 1796–1805. [Google Scholar] [CrossRef]
  20. Soejima, M.; Koda, Y. FUT2 polymorphism in Latin American populations. Clin. Chim. Acta 2020, 505, 1–5. [Google Scholar] [CrossRef]
  21. Yang, B.; Wagner, J.; Yao, T.; Damaschke, N.; Jarrard, D.F. Pyrosequencing for the rapid and efficient quantification of allele-specific expression. Epigenetics 2013, 8, 1039–1042. [Google Scholar] [CrossRef]
  22. Yang, B.; Damaschke, N.; Yao, T.; McCormick, J.; Wagner, J.; Jarrard, D. Pyrosequencing for accurate imprinted allele expression analysis. J. Cell Biochem. 2015, 116, 1165–1170. [Google Scholar] [CrossRef]
  23. Chen, C.T.; Liao, W.Y.; Hsu, C.C.; Hsueh, K.C.; Yang, S.F.; Teng, Y.H.; Yu, Y.L. FUT2 genetic variants as predictors of tumor development with hepatocellular carcinoma. Int. J. Med. Sci. 2017, 14, 885–890. [Google Scholar] [CrossRef]
  24. Olivares, A.I.O.; Leitão, G.A.A.; Pimenta, Y.C.; Cantelli, C.P.; Fumian, T.M.; Fialho, A.M.; da Silva, S.M.J.; Delgado, I.F.; Nordgren, J.; Svensson, L.; et al. Epidemiology of enteric virus infections in children living in the Amazon region. Int. J. Infect. Dis. 2021, 108, 494–502. [Google Scholar] [CrossRef] [PubMed]
  25. Silva, J.R.; Sampaio, R.M.A.; Nunes, P.F.; Guimarães, V.S.; Costa, C.C.D.S.; Coelho, E.D.C.; Souza, M.V.; Almeida, L.W.C.; Fuzii, H.T.; Filho, A.B.O.; et al. Immunological and Virological Responses in Patients with Monoinfection and Coinfection with Hepatitis B and C Viruses in the Brazilian Amazon. Trop. Med. Infect. Dis. 2025, 10, 166. [Google Scholar] [CrossRef] [PubMed]
  26. Moraes, M.T.B.; Leitão, G.A.A.; Olivares, A.I.O.; Xavier, M.D.P.T.P.; Bispo, R.S.; Sharma, S.; Leite, J.P.G.; Svensson, L.; Nordgren, J. Molecular Epidemiology of Sapovirus in Children Living in the Northwest Amazon Region. Pathogens 2021, 10, 965. [Google Scholar] [CrossRef] [PubMed]
  27. Pimenta, Y.C.; Moreira, G.M.S.; da Silva Souza, W.; Olivares, A.I.O.; Svensson, L.; Leite, J.P.G.; Nordgren, J.; de Moraes, M.T.B. Epidemiological profiles of norovirus genotypes in children with and without acute gastroenteritis from the northwestern Amazon region. Infect. Genet. Evol. 2025, 134, 105804. [Google Scholar] [CrossRef]
  28. Barros, J.J.; Peres, L.R.; Sousa, P.S.; Mello, F.C.A.; Araujo, N.M.; Gomes, S.A.; Niel, C.; Lewis-Ximenez, L.L. Occult infection with HBV intergenotypic A2/G recombinant following acute hepatitis B caused by an HBV/A2 isolate. J. Clin. Virol. 2015, 67, 31–35. [Google Scholar] [CrossRef]
  29. RCore Team. R: A Language and Environment for Statistical Computing; R Foundation for Statistical Computing: Vienna, Austria, 2024; Available online: https://www.r-project.org/ (accessed on 6 August 2025).
  30. RStudio Team. RStudio: Integrated Development Environment for R; Posit Software, PBC: Boston, MA, USA, 2024; Available online: https://posit.co/ (accessed on 6 August 2025).
  31. ISBT 018 H (FUT1FUT2) Blood Group Alleles v6.1 31-MAR-2023. Available online: https://www.isbtweb.org/asset/376793E9-EBB1-47D1-9A00E079476910FD/ (accessed on 6 August 2025).
  32. Fernandez-Mateos, P.; Cailleau, A.; Henry, S.; Costache, M.; Elmgren, A.; Svensson, L.; Larson, G.; Samuelsson, B.E.; Oriol, R.; Mollicone, R. Point mutations and deletion responsible for the Bombay H null and the Reunion H weak blood groups. Vox Sang. 1998, 75, 37–46. [Google Scholar] [CrossRef]
  33. Matzhold, E.M.; Helmberg, W.; Wagner, T.; Drexler, C.; Ulrich, S.; Winkler, A.; Lanzer, G. Identification of 14 new alleles at the fucosyltransferase 1, 2, and 3 loci in Styrian blood donors, Austria. Transfusion 2009, 49, 2097–2108. [Google Scholar] [CrossRef]
  34. Soejima, M.; Nakajima, T.; Fujihara, J.; Takeshita, H.; Koda, Y. Genetic variation of FUT2 in Ovambos, Turks, and Mongolians. Transfusion 2008, 48, 1423–1431. [Google Scholar] [CrossRef]
  35. Song, M.; Zhao, S.; Jiang, T.; Lu, H. A Very Rare Case with Particular H-deficient Phenotypes. Indian J. Hematol. Blood Transfus. 2018, 34, 788–791. [Google Scholar] [CrossRef]
  36. Scharberg, E.A.; Olsen, C.; Bugert, P. An update on the H blood group system. Immunohematology 2019, 35, 67–68. [Google Scholar] [CrossRef]
  37. Scharberg, E.A.; Olsen, C.; Bugert, P. The H blood group system. Immunohematology 2016, 32, 112–118. [Google Scholar] [CrossRef]
  38. Soejima, M.; Koda, Y. Genetic variation of FUT2 in a Peruvian population: Identification of a novel LTR-mediated deletion and characterization of 4 nonsynonymous single-nucleotide polymorphisms. Transfusion 2019, 59, 2415–2421. [Google Scholar] [CrossRef]
  39. Cantelli, C.P.; Velloso, A.J.; Assis, R.M.S.; Barros, J.J.; Mello, F.C.D.A.; Cunha, D.C.D.; Brasil, P.; Nordgren, J.; Svensson, L.; Miagostovich, M.P.; et al. Rotavirus A shedding and HBGA host genetic susceptibility in a birth community-cohort, Rio de Janeiro, Brazil, 2014–2018. Sci. Rep. 2020, 10, 6965. [Google Scholar] [CrossRef]
  40. Soejima, M.; Koda, Y. Survey and characterization of nonfunctional alleles of FUT2 in a database. Sci. Rep. 2021, 11, 3186. [Google Scholar] [CrossRef]
  41. Soejima, M.; Koda, Y. Distinct single nucleotide polymorphism pattern at the FUT2 promoter among human populations. Ann. Hematol. 2008, 87, 19–25. [Google Scholar] [CrossRef]
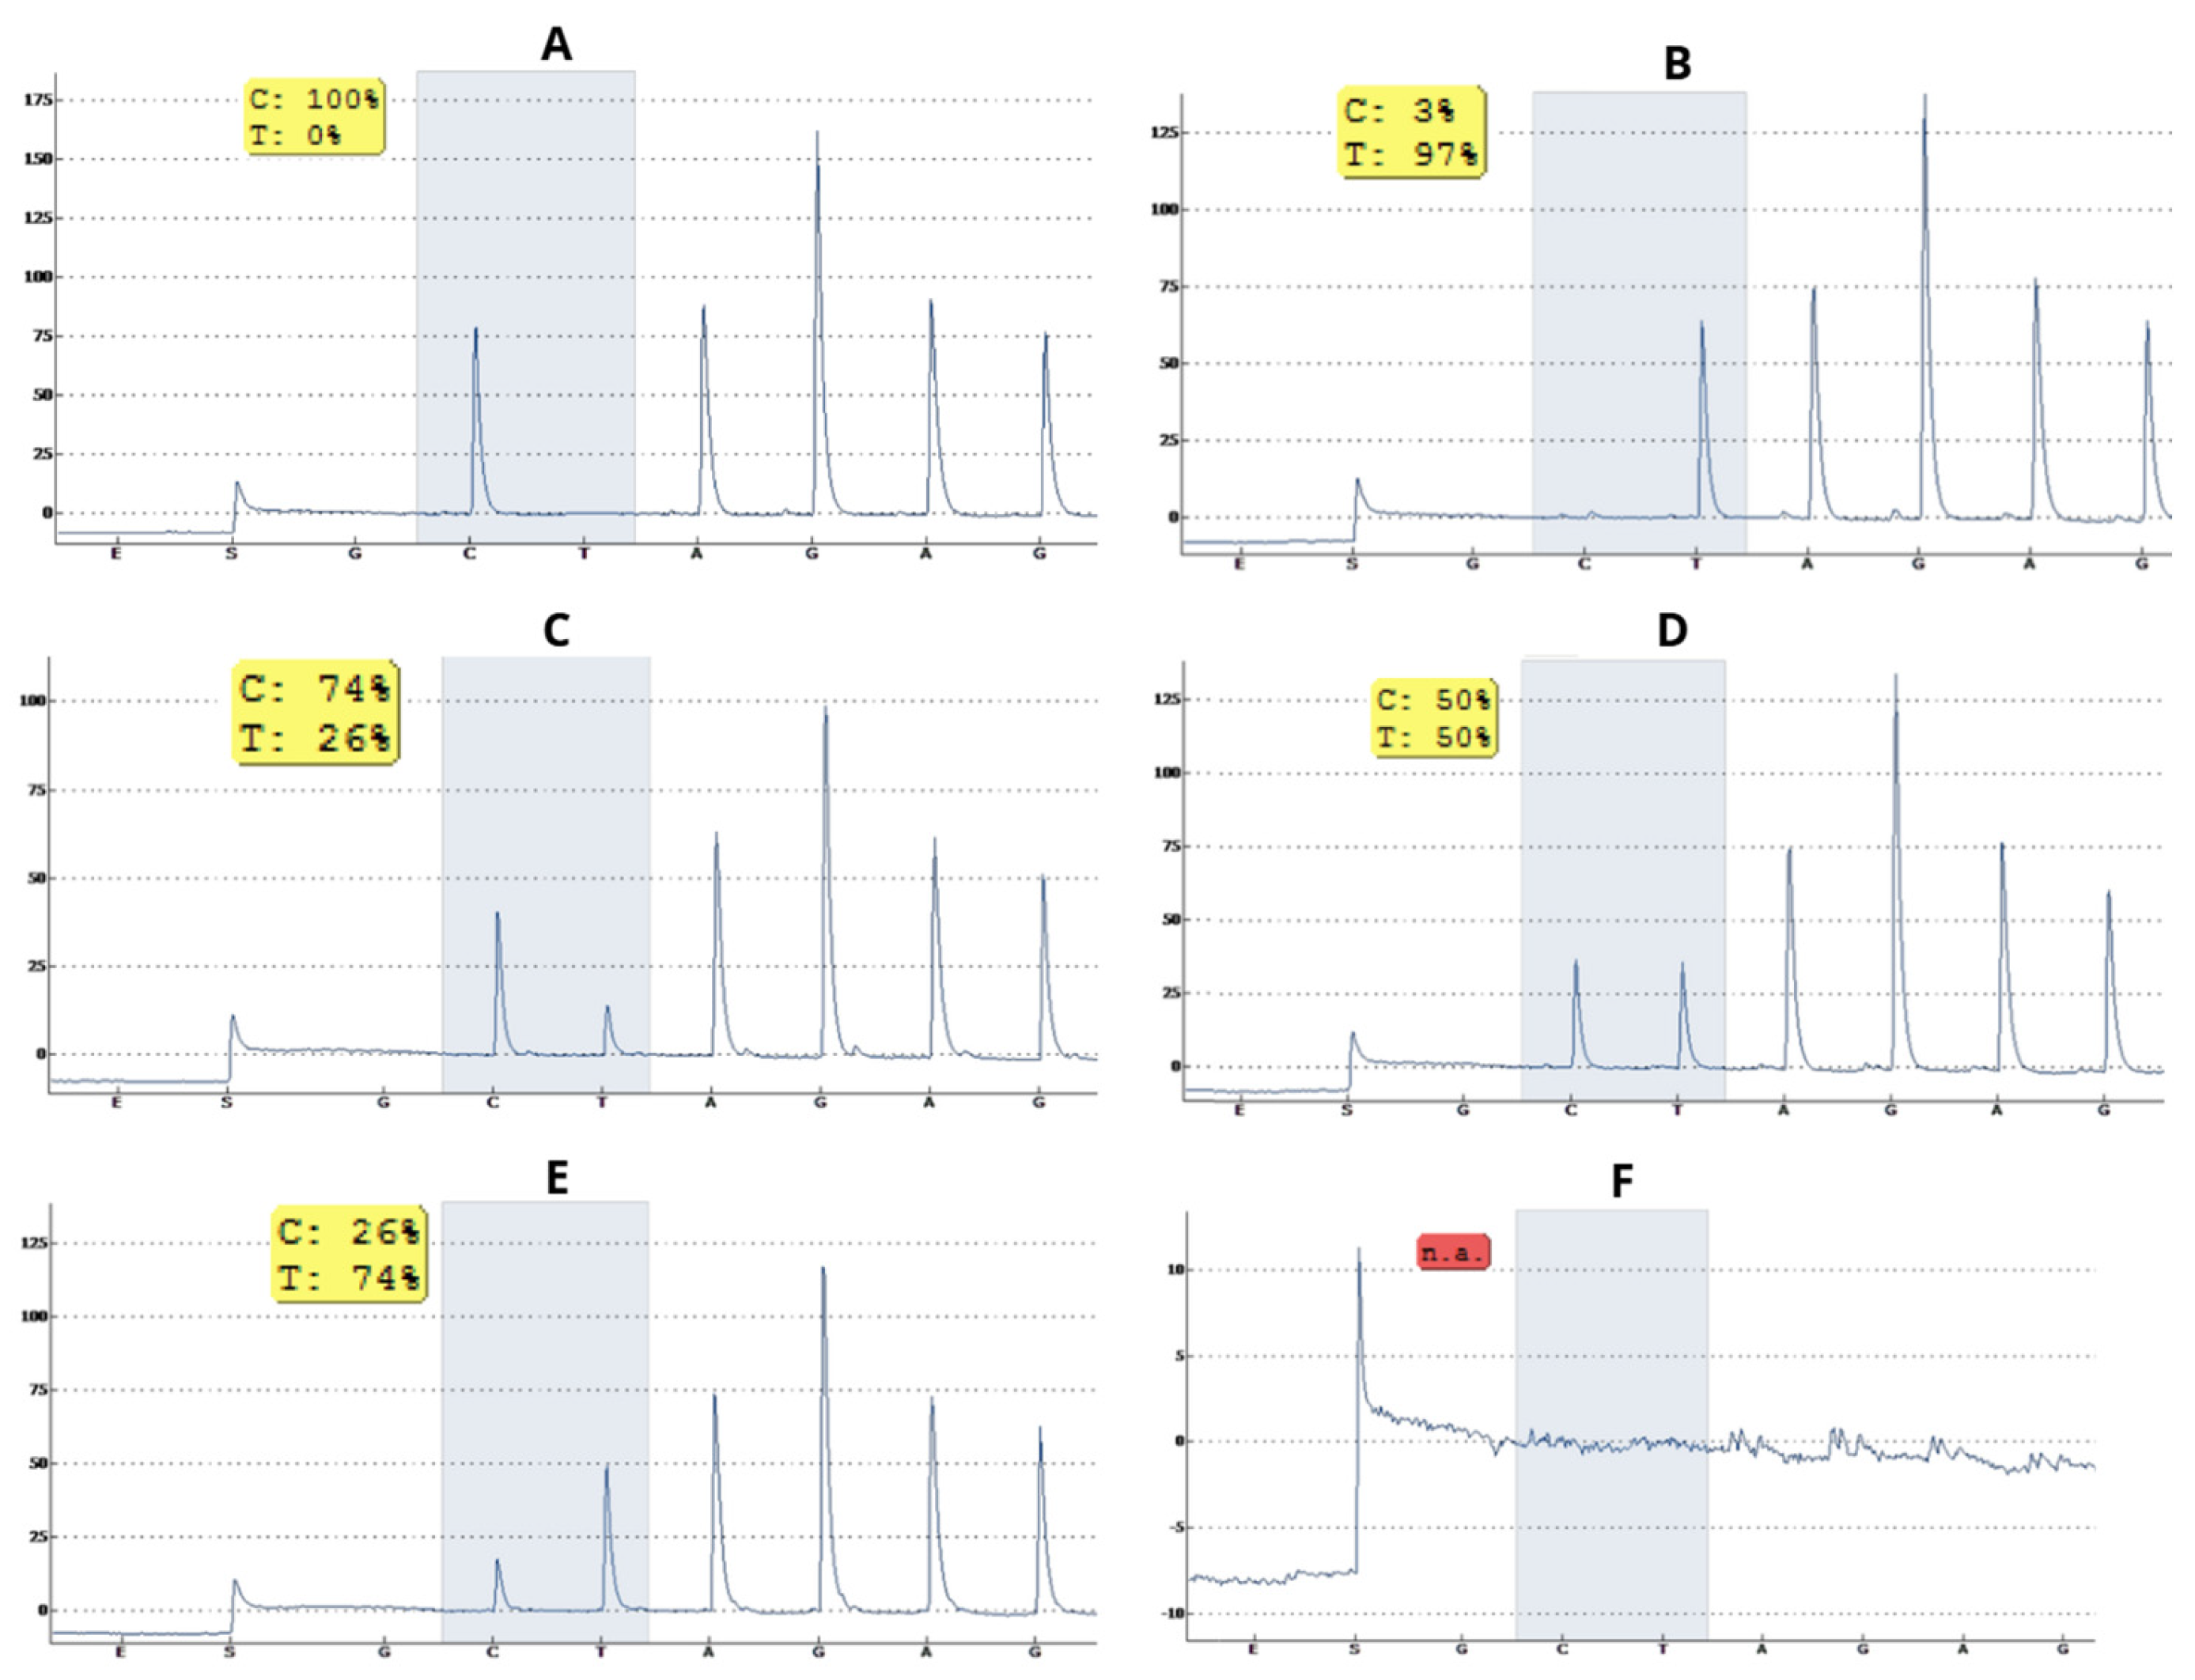
Figure 1. Pyrograms of the output of pyrosequencing reactions using synthetic gBlocks® control Wild Type (WT; FUT2_360>484_WT) and variant rs601338 (FUT2_360>484_MUT428 rs601338) with primer SEQPYROFUT2_428R1. The proportions of WT and variant were (A) = 100% WT + 0% variant; (B) = 0% WT + 100% Variant; (C) = 75% WT + 25% Variant; (D) = 50% WT + 50% Variant; and (E) = 75% WT + 25% Variant. (F) = Negative control (water added to the pyrosequencing reaction instead of one of the gBlocks®). Consider that the pyrogram shows the indicated nucleotide (percentage) that corresponds to the nucleotide homologous to the PCR amplicon used in the reaction. Percentage values shown in yellow indicate that the analysis was efficient for the equipment, generating picograms acceptable according to the equipment’s criteria. Values in red indicate that there were no detectable chromatographic peaks, with no analysis (n.a.) as it is a negative control, according to the PyroMark Q96 ID Systems® equipment (QIAGEN).
Dna 05 00054 g001
Figure 2. Pyrograms of the output of pyrosequencing reactions using synthetic gBlocks® control Wild Type (WT; FUT2_360>484_WT) and variant rs1047781 (FUT2_360>484_MUT385 rs1047781) with primer SEQPYROFUT2_385R1. The proportions of WT and variant were (A) = 100% WT + 0% variant; (B) = 0% WT + 100% Variant; (C) = 75% WT + 25% Variant; (D) = 50% WT + 50% Variant; and (E) = 75% WT + 25% Variant. (F) = Negative control (water added to the pyrosequencing reaction instead of one of the gBlocks®). Consider that the pyrogram shows the indicated nucleotide (percentage) that corresponds to the nucleotide homologous to the PCR amplicon used in the reaction. Percentage values shown in yellow indicate that the analysis was efficient for the equipment, generating picograms acceptable according to the equipment’s criteria. Values in red indicate that there were no detectable chromatographic peaks, with no analysis (n.a.) as it is a negative control, according to the PyroMark Q96 ID Systems® equipment (QIAGEN).
Dna 05 00054 g002
Figure 3. Representation of the relationship between the percentage of variant allele detected by pyrosequencing and the measured proportion of the variant allele in real samples, compared to the linear regression model fitted using synthetic gBlocks® controls for: (A): SNP rs601338 (position 428; FUT2 gene); and (B): SNP rs1047781 (position 385; FUT2 gene). The black line represents the proportional linear regression model without intercept, with a coefficient of determination R2 = 0.793 (rs601338) and 0.994 (rs1047781), indicating substantial correlation between the known allele proportions in the controls and the experimentally observed signals. Blue dots represent synthetic controls with predefined variant allele frequencies. Real samples are shown as colored points according to their inferred genotype: orange for heterozygotes, green for wild-type homozygotes, and red for variant homozygotes. The distribution of real samples around the regression line demonstrates the model’s applicability in estimating genotypes from pyrosequencing signal data.
Dna 05 00054 g003
Figure 4. Sanger nucleotide sequencing chromatograms of the FUT2 amplicon (primers FUT_CDS_1F—5′ACTTGAGATACATGCCTGTGC 3′ (Forward) and FUT_CDS_3R—5′CCAGGCCACTGTTCACTGAG 3′), sample ID 32525 (Table 1 below), highlighting the two tightly linked SNPs. Peak colors correspond to bases (green = A, adenine; blue = C, cytosine; black = G, guanine; red = T, thymine). (A) 357C>T (rs281377): a taller red peak (T) followed by a smaller blue peak (C) at position 357 (red arrow), indicating a likely C/T heterozygote; (B) 428G>A (rs601338): a single green peak (A) at position 428 (red arrow), consistent with an A/A homozygote identified by pyrosequencing (Table 1).
Dna 05 00054 g004
Figure 5. Schematic model of the genetic map of chromosome 19q13.3, from centromere (cen; left) to telomere (ter; right), including the SEC1P, FUT2, and FUT1 genes, and the reference nucleotide sequence U17894 (FUT2 gene); available in the NCBI genome database (October 2025). Single-nucleotide polymorphisms (SNPs) are indicated in the nucleotide sequence by arrows and bold letters. The indicated SNPs are in the coding region (CDS) of the FUT2 gene.
Dna 05 00054 g005
Table 1. Phenotyping, pyrosequencing, and Sanger nucleotide sequencing results of the samples containing the SNP rs602662 (position 428; FUT2 gene).
Sample IDPhenotypingPyrosequencingSanger Sequencing 1
26255Inconclusivers602662 Heterozygous171A>G, 216C>T, 357T>C, 428G>A, 739G>A, 960A>G
27682Inconclusivers602662 Heterozygous171A>G, 216C>T, 357T>C, 428G>A, 739G>A, 960A>G
27752Inconclusivers602662 Heterozygous171A>G, 216C>T, 357T>C, 428G>A, 739G>A, 960A>G
27824Inconclusivers602662 Heterozygous171A>G, 216C>T, 428G>A, 739G>A, 960A>G
27852Inconclusivers602662 Heterozygous171A>G, 216C>T, 428G>A, 739G>A, 960A>G
28265Inconclusivers602662 Heterozygous171A>G, 216C>T, 428G>A, 739G>A, 960A>G
32213Inconclusive rs602662 Heterozygous171A>G, 216C>T, 357T>C, 428G>A, 739G>A, 960A>G
32343Weak secretor; Lea+Leb+rs602662/rs1047781 Heterozygous171A>G, 216C>T, 357T>C, 385A>T, 428G>A, 739G>A, 960A>G
32371Weak secretor; Lea+Leb+rs602662 Heterozygous171A>G, 216C>T, 357T>C, 428G>A, 739G>A, 863C>T, 960A>G
32525Non-secretor; Lea+Leb-rs602662 Homozygous171A>G, 216C>T, 357T>C, 428G>A, 739G>A, 960A>G
Subtitle: 1 Sese428 tightly linked SNPs 171A>G, 216C>T, 357T>C, 385A>T, 428G>A, and 960A>G, according to Soejima and Koda, 2020 [20]. The SNPs 428G>A and 739G>A together correspond to allele FUT2*01N.02 [31].
Disclaimer/Publisher’s Note: The statements, opinions and data contained in all publications are solely those of the individual author(s) and contributor(s) and not of MDPI and/or the editor(s). MDPI and/or the editor(s) disclaim responsibility for any injury to people or property resulting from any ideas, methods, instructions or products referred to in the content.