Article

Abyssal DNA: Eukaryotic Diversity in Atlantic Equatorial Deep-Sea Sediments Assessed Through DNA Metabarcoding

by
Natana Rabelo Gontijo
1,
Vívian Nicolau Gonçalves
1,
Arthur Ayres Neto
2,
Rosemary Vieira
2,
Tainá Napoleão Caram
2,
Marina Martins Malheiros
2,
Fabyano A. C. Lopes
3,
Micheline C. Silva
4,
Allana Queiroz Azevedo
5,6,
Thauana Rodrigues Gonçalves
5,
Luigi Jovane
5,
Peter Convey
7,8,9,
Paulo E. A. S. Câmara
4 and
Luiz Henrique Rosa
1,*
1
Laboratório de Microbiologia Polar e Conexões Tropicais, Departamento de Microbiologia, Instituto de Ciências Biológicas, Universidade Federal de Minas Gerais, Belo Horizonte 31270-901, Brazil
2
Instituto de Geociências, Universidade Federal Fluminense, Rio de Janeiro 24220-900, Brazil
3
Laboratório de Microbiologia, Universidade Federal do Tocantins, Porto Nacional 77001-090, Brazil
4
Departamento de Botânica, Universidade de Brasília, Brasília 70910-900, Brazil
5
Instituto Oceanográfico, Universidade de São Paulo, São Paulo 05508-120, Brazil
6
School of Earth Sciences, University of Bristol, Bristol BS8 1QU, UK
7
British Antarctic Survey, NERC, High Cross, Madingley Road, Cambridge CB3 0ET, UK
8
Department of Zoology, University of Johannesburg, Auckland Park 2006, South Africa
9
School of Biosciences, University of Birmingham, Edgbaston, Birmingham B15 2TT, UK
*
Author to whom correspondence should be addressed.
Submission received: 13 June 2025 / Revised: 28 August 2025 / Accepted: 3 September 2025 / Published: 15 September 2025

Abstract

Background/Objectives: We evaluated eukaryotic diversity in two cores obtained from abyssal sediments collected at depths of 4280 m and 4444 m in the equatorial Atlantic, between the Fernando de Noronha and São Pedro and São Paulo archipelagos, using a DNA metabarcoding approach applied to environmental DNA (eDNA) samples. Results: In total, we detected 248,905 DNA reads that were assigned to 65 amplicon sequence variants (ASVs) in the two core sediments (176,073 DNA reads and 59 ASVs were detected in sediment obtained at 4280 m depth, and 72,832 DNA reads and 14 ASVs were detected in the core at 4444 m). These represented three Kingdoms and five phyla: Fungi (Ascomycota and Basidiomycota), Viridiplantae (Chlorophyta and Streptophyta) and Chromista (Ciliophora), in rank abundance order. Ascomycota was the dominant phylum, followed by Basidiomycota. Didymella sp., Cladosporium sp., Scopulariopsis sp., Alternaria eichhorniae, Curvularia sp., Hortaea werneckii, Penicillium sp. (Ascomycota) and Malassezia globosa (Basidiomycota) were the most abundant taxa. Pseudochlorella pyrenoidosa (Chlorophyta) was the most abundant representative of Viridiplantae detected, and Spirotrachelostyla tani (Ciliophora) was the only Chromista detected, both present as minor components of the assigned eukaryotic diversity and only in the 4280 m core. The eukaryotic assemblages displayed moderate diversity indices, and those from the deeper core (4444 m depth) displayed the highest diversity values. Few assigned taxa were present in both samples. The two cores differed in their geological characteristics, consistent with their location in different depositional basins. The core obtained at 4280 m depth, located further north and more isolated from the adjacent continent by two fracture zones, appears to receive less terrigenous sediment input. In contrast, the core obtained at 4444 m depth is under greater continental influence and receives more terrigenous input from the continent. These geological and geographic differences may contribute to the varying eukaryotic eDNA diversities found. Results: Our metabarcoding study revealed the presence of a sediment eukaryotic community dominated by fungi. This included assigned ASVs representing groups with different ecological roles, such as cosmopolitan and phytopathogenic members and extremophiles, some of which may be able to survive and function in the polyextreme deep-sea abyssal conditions. Abyssal sediments present a potential habitat for studying organisms at the edge of viable conditions for life on Earth. eDNA metabarcoding provides a promising technique for detecting cryptic and uncultured biodiversity compared to traditional approaches, opening avenues for further ecological, evolutionary and biotechnological studies.

Graphical Abstract

1. Introduction

The abyssal seafloor is defined as being between 3501 and 6500 m in depth and covers 65–75% of the global ocean floor [1,2]. Despite its scale, the abyssal regions suffer from major knowledge gaps in terms of their diversity, ecology, biogeography and the evolution of resident extremophile life forms [3]. The abyssal regions are generally characterized by low and constant sedimentation rates over large areas [4], providing good potential for studies addressing the presence of extremophilic life forms.
Sedimentary deposits in deep ocean basins are characteristically hemipelagic—a combination of clay and silt-sized particles originating at the continental margin. Within the ocean these particles are moved by turbidity currents and biogenic processes (mainly planktonic organisms). Wind-driven material input settles through the water column [5]. These deposits, in the longer term, interact with bottom currents, which act to rework and further disperse the sediments—all processes that are, in turn, influenced by climatic changes and sea level variations [5]. The separation between South America and Africa as the supercontinent Gondwana broke up started around 130 million years ago [6], and the structural features generated by this tectonic event are the main factor controlling deep-sea depositional patterns and water mass circulation in the equatorial Atlantic region [7].
Biodiversity studies in abyssal sediments of the Atlantic Ocean are very limited. Marine ecosystems, especially those of the abyssal zone, are amongst the most poorly known in terms of their eukaryotic diversity. The application of traditional morphophysiological techniques is likely to severely underestimate the true biodiversity present. In this study, we consider that abyssal biodiversity may be better characterized by using advanced methodologies such as environmental DNA (eDNA) approaches, which have demonstrated the capability to recover DNA from different organisms to assess the potential complexity of diversity present, ecological roles and biotechnological potential. Here, we documented eukaryotic diversity as indicated by the sequence assignment of eDNA in abyssal Atlantic Ocean sediment sampled between the Brazilian Fernando de Noronha and São Pedro and São Paulo archipelagos using DNA metabarcoding through high-throughput sequencing (HTS).

2. Materials and Methods

2.1. Core Sampling

This study took place between the archipelagos of Fernando de Noronha and São Pedro and São Paulo in the equatorial Atlantic Ocean (Figure 1). Two deep-sea sediment cores were collected in October 2022 using a gravity-corer system operated from the Brazilian oceanographic vessel NPqHo Vital de Oliveira, at depths of 4280 m (00°11.357′ S; 29°47.033′ W) and 4444 m (02°26.185′ S; 31°27.774′ W). The samples were collected using a 6 m long gravity corer. After the core was retrieved to the vessel, the PVC liner was extracted from the corer barrel, separated into 1 m length sections and moved to the ship’s laboratory. The collections and studies performed around Fernando de Noronha and São Pedro and São Paulo Archipelagos were authorized by the ICMBio, MMA.

2.2. Sedimentology and Chronological Analysis of the Cores

Sedimentology and chronology core analyses were conducted to provide a general geological characteristic panorama from which the eukaryotic eDNA was obtained. After sampling with the gravity corer, 3.4 m of sediment was recovered from the core obtained at 4280 m, and 3.73 m of sediment was recovered from the core sampled at 4444 m. The core sections were split in half along their length to expose the sediment section for physicochemical analyses. First, sedimentological description involved assessing color based on Munsell’s color chart [8], as well as sediment type and structure [9]. Then, gamma spectrometry analyses were performed using a Portable Spectrometer RS-125/230 (GeoRESULTS Pty Ltd., Helena Valley, Australia), measuring U (ppm), Th (ppm), K (%) and total gamma radiation (nGy/h). The total radiation count was obtained by measuring all gamma radiation within the energy window of 0.41–2.81 MeV [10]. Spectral analysis was conducted by measuring counts at a 1.46 MeV energy peak for 40K, a 1.76 MeV energy peak for 238U and a 2.61 MeV energy peak for 232Th. The sensor was positioned in contact with the sediment, protected by an inert cover, and measurements were made every 30 s for 5 min. All measurements were averaged to give a final value. Next, the sediment core underwent X-ray Fluorescence (XRF) analysis to determine its chemical composition. This analysis was conducted using a portable Thermo Fisher XRF spectrograph (Bannockburn, Chicago, IL, USA), which measures the secondary X-rays emitted from a sample being irradiated from a primary X-ray source, as each chemical element present produces a distinct fluorescent X-ray spectrum [11]. Gamma and XRF measurements were made at 10 cm intervals along the whole core.
The chronology of the studied cores was defined using six radiocarbon dates based on planktonic foraminifera (Trilobatus sacculifer). The construction of the complete age–depth model [12] was performed using the package Bacon v. 2.2, which applies Bayesian statistics to reconstruct accumulation histories for sedimentary deposits within the R software version 4.5.1 [13]. The 14C contents were analyzed using Accelerator Mass Spectrometry (AMS) at the Laboratory of Tree-Ring Research and AMS at the University of Arizona (USA). All samples were normalized to a δ 13C value of −25‰ VPDB and calibrated using the Marine20 calibration curve on CALIB 8.2 software [14]. All results were displayed as calibrated years before present (cal. year B.P.).

2.3. Selection of Sediment Core Material for Environmental DNA Analysis

From the two sediment cores, specific sections were selected for environmental DNA (eDNA) extraction based on their observed characteristics. In the core sampled at a depth of 4280 m, the section between 73 and 75 cm was chosen based on its compact, slightly silty clay (Figure 2). For the core collected at a depth of 4444 m, the section between 106 and 108 cm was selected due to the presence of clay with very fine to fine sand, with sand decreasing towards the top. Both sections of 2 cm length (approximately 20 g sediment) were obtained using a sterilized scoop from the core center, placed in sterile Whirl-pack (Nasco, Ft. Atkinson, WI, USA) bags and frozen at −20 °C until processing in the laboratory at the Federal University of Minas Gerais, Brazil. There, the samples were gradually thawed in sterile conditions at 4 °C for 24 h before carrying out eDNA extraction.

2.4. DNA Sampling, Extraction and Sequencing

Three subsamples of 500 mg of each selected sediment core were obtained under strict contamination control conditions (in a laminar flow hood) and processed, to increase the DNA yield. The total DNA of each subsample was extracted using the FastDNA Spin Kit for Soil (MPBIO, Solon, OH, USA), following the manufacturer’s instructions. DNA quality was analyzed using agarose gel electrophoresis (1% agarose in 1 × Trisborate-EDTA) and then quantified using the Quanti-iT ™ Pico Green dsDNA Assay (Invitrogen, Carlsbad, CA, USA). Negative controls (only the reagents of the FastDNA Spin kit for soil) did not indicate any detectable DNA. We used the internal transcribed spacer 2 (ITS2) region of the nuclear ribosomal DNA as a barcode, which was amplified with the ITS3F and ITS4R primer set (fragments were ~400 bp long). This molecular marker is widely applied to identify a diverse range of eukaryote organisms, particularly fungi and plants [15,16]; however, ITS2 can also detect a proportion of animal, protozoan and chromist groups [17] and has proved effective in recent studies of marine sediment diversity using environmental samples [18]. Library construction and DNA amplification were performed using the library kit Herculase II Fusion DNA Polymerase Nextera XT Index Kit V2 (Illumina, San Diego, CA, USA), following the Illumina 16S Metagenomic Sequencing Library Preparation Part #15,044,223 Rev. B protocol. Paired-end sequencing (2 × 300 bp) was performed on a MiSeq System (Illumina) by Macrogen Inc. (Seoul, Republic of Korea). The libraries obtained from the three subsamples of each sequenced sediment core were merged for bioinformatic analysis.

2.5. Data Analyses and Taxonomic Assignment

Quality analysis was carried out using BBDuk v. 38.87 in BBmap software (Berkeley, CA, USA) [19] with the following parameters: Illumina adapters were removed (Illumina artefacts and the PhiX Control v3 Library); ktrim = l; k = 23; mink = 11; hdist = 1; minlen = 50; tpe; tbo; qtrim = rl; trimq = 20; ftm = 5; maq = 20. The remaining sequences were imported to QIIME2-amplicon version 2023.9 (https://qiime2.org, accessed on 22 January 2025) for bioinformatics analyses [20]. The qiime2-dada2 plugin was used for filtering, dereplication, turning paired-end fastq files into merged and removing chimeras, using default parameters [21]. Taxonomic assignments of ASVs (amplicon sequence variants) were determined using the qiime2-feature-classifier [22] classify-sklearn against different databases, using a sequence similarity threshold of 97%. First, ASVs were classified against the PLANiTS2 database [23]. After this step, ASVs that remained unclassified were filtered and classify-sklearn-classified against the UNITE Eukaryotes ITS database version 8.3 [24]. Finally, remaining unclassified ASVs were filtered and aligned against the filtered NCBI non-redundant nucleotide sequences (nt) database (May 2024) using BLASTn [25] with default parameters; the nt database was filtered using the following keywords: “ITS1”, “ITS2”, “Internal transcribed spacer” and “internal transcribed spacer”. Taxonomic assignments were performed using MEGAN6 [26]. For simplicity, we henceforth refer to the assigned ASVs as “taxa”. For comparative purposes, we consider DNA reads as a proxy for relative abundance [27]. Taxonomic profiles were plotted using the Krona (Salt Lake City, UT, USA) [28].

2.6. Eukaryotic Diversity

The number of DNA reads and relative abundances of the ASVs (taxon/species) were used to quantify the assigned eukaryotic taxa present in the samples. For comparative purposes, DNA reads were standardized according to library size and used as a proxy for relative abundance. ASVs with a relative abundance > 1% were considered dominant, and those with a relative abundance <1% were considered minor (rare) components of the fungal community [29]. The relative abundances were used to quantify taxon diversity, richness and dominance, using the following indices: (i) Fisher’s α, (ii) Margalef’s and (iii) Simpson’s, respectively. Species accumulation curves were obtained using the Mao Tao index. All results were obtained with 95% confidence, and bootstrap values were calculated from 1000 replicates using the PAST computer program 1.90 [30]. Venn diagrams were prepared following [31] to visualize the fungal assemblages present in the two sampling sites.

3. Results

3.1. Sedimentological and Chronological Analysis of the Cores

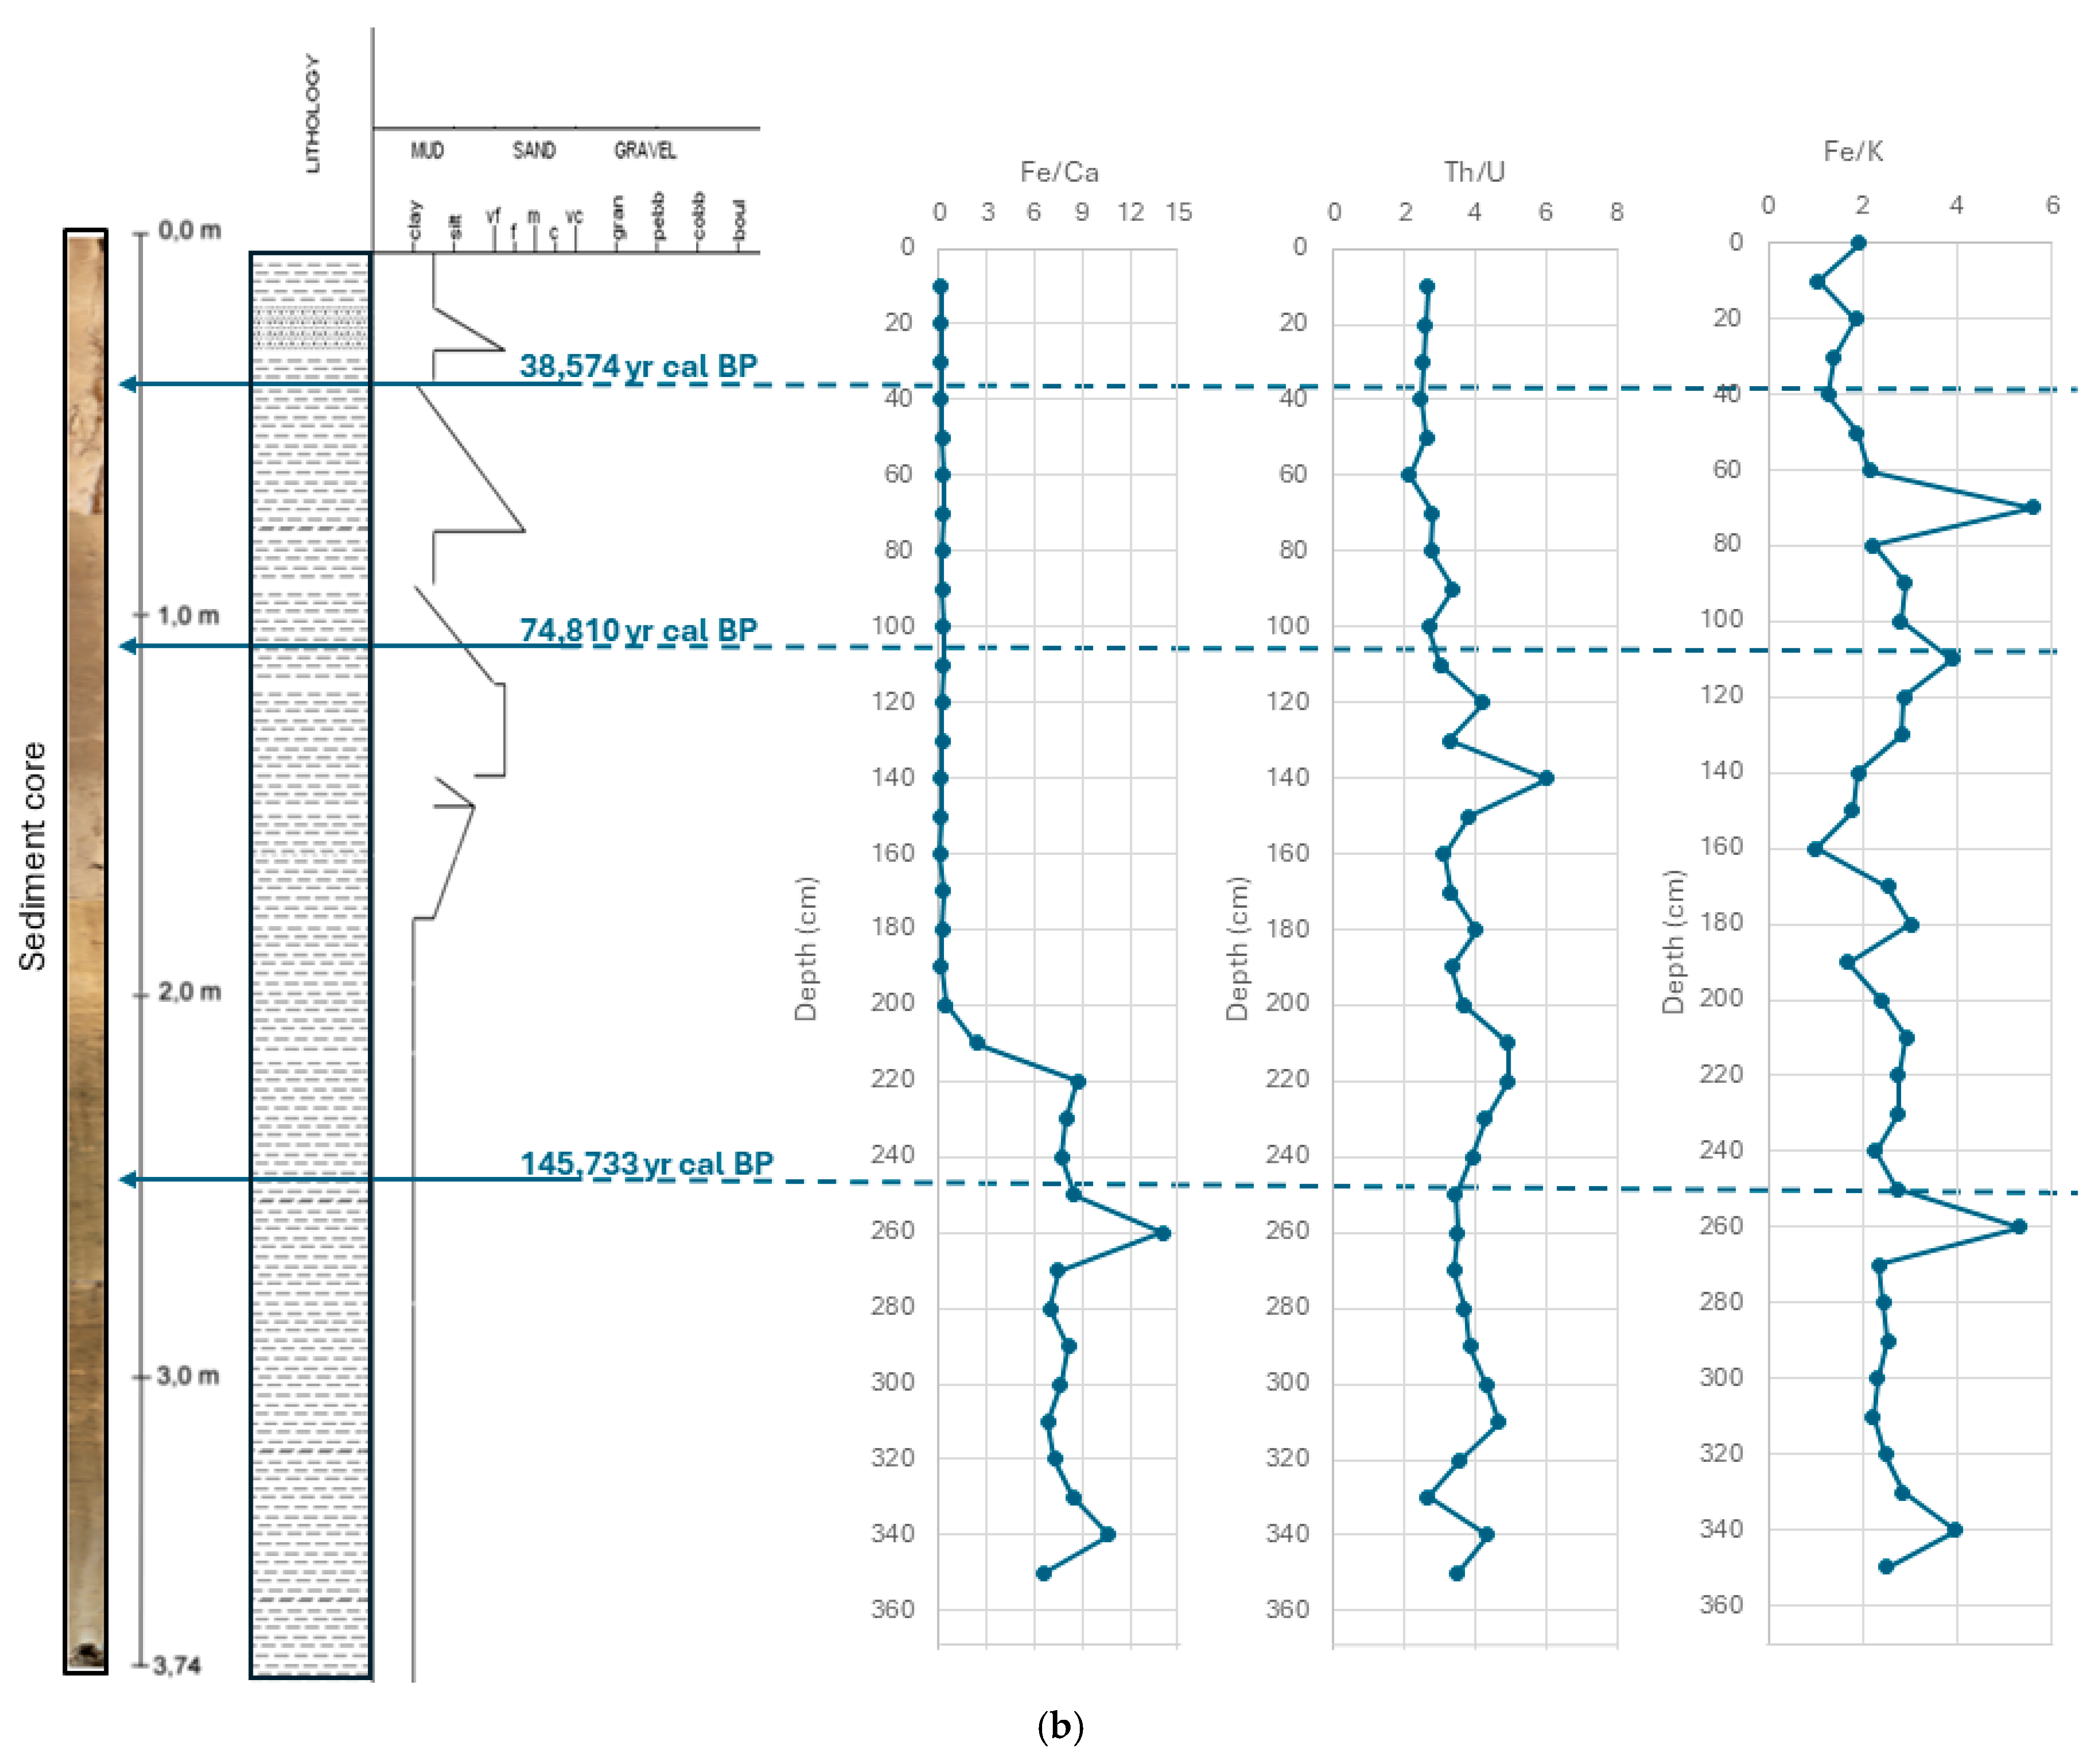
The northernmost core obtained at 4280 m depth, 3.4 m in length, was characterized by light grayish silty clay, with millimeter-scale layers of very fine to fine sand from the base of the core up to 135 cm [position relative to the top of the core (seafloor)]. The interval 135–138 cm showed the presence of a dark gray silty clay, suggesting a higher content of organic matter, intercalated by centimeter-scale layers of a brownish sandy mud. The low Fe/Ca ratio at this depth point indicates a time of high productivity (Figure 2), which is corroborated by the grayish shades of the sediment, usually related to high CaCO3 contents. The low Th/U ratio indicates a low input of terrigenous material. The sample obtained in this study at 73–75 cm depth for eDNA extraction generated a radiocarbon date of 23,691 ± 43.7 year BP, in the transition between MIS 1 and MIS 2, corresponding to the rapid warming phase after the end of the last glacial period, and to the Holocene/Pleistocene boundary. The peak in the Fe/Ca and Fe/K ratios at this point in the core indicates a warm and wet period, with intense weathering indicated by the peak in the Fe/K profile. There was also a small peak in the Th/U profile, consistent with a relatively higher input of sediment (related to the increase in the rainfall in this period). Thorium is associated with continental input, while uranium is associated with marine input. Therefore, a high Th/U ratio suggests more continental input, which occurs when river discharge is higher due to increased rainfall. The change in the color of the sediment corroborates the abrupt change in the sedimentation pattern.
The core obtained from 4444 m depth, 3.73 m in length, showed a sequence of essentially brownish silty clay, with marked shade transitions at 213 cm and 147 cm [position relative to the top of the core (seafloor)]. The characteristically different colors of the sediments of the two cores are consistent with them being located in separate sedimentary basins, with different sediment sources and oceanographic conditions. The sample obtained from this core at 106–108 cm for eDNA extraction) was dated to 74,810 ± 117.2 year BP, which corresponds to MIS 5 (most likely 5a) in a warmer period of the last Pleistocene interglacial with high stand sea levels [32].

3.2. Eukaryotic Taxonomy

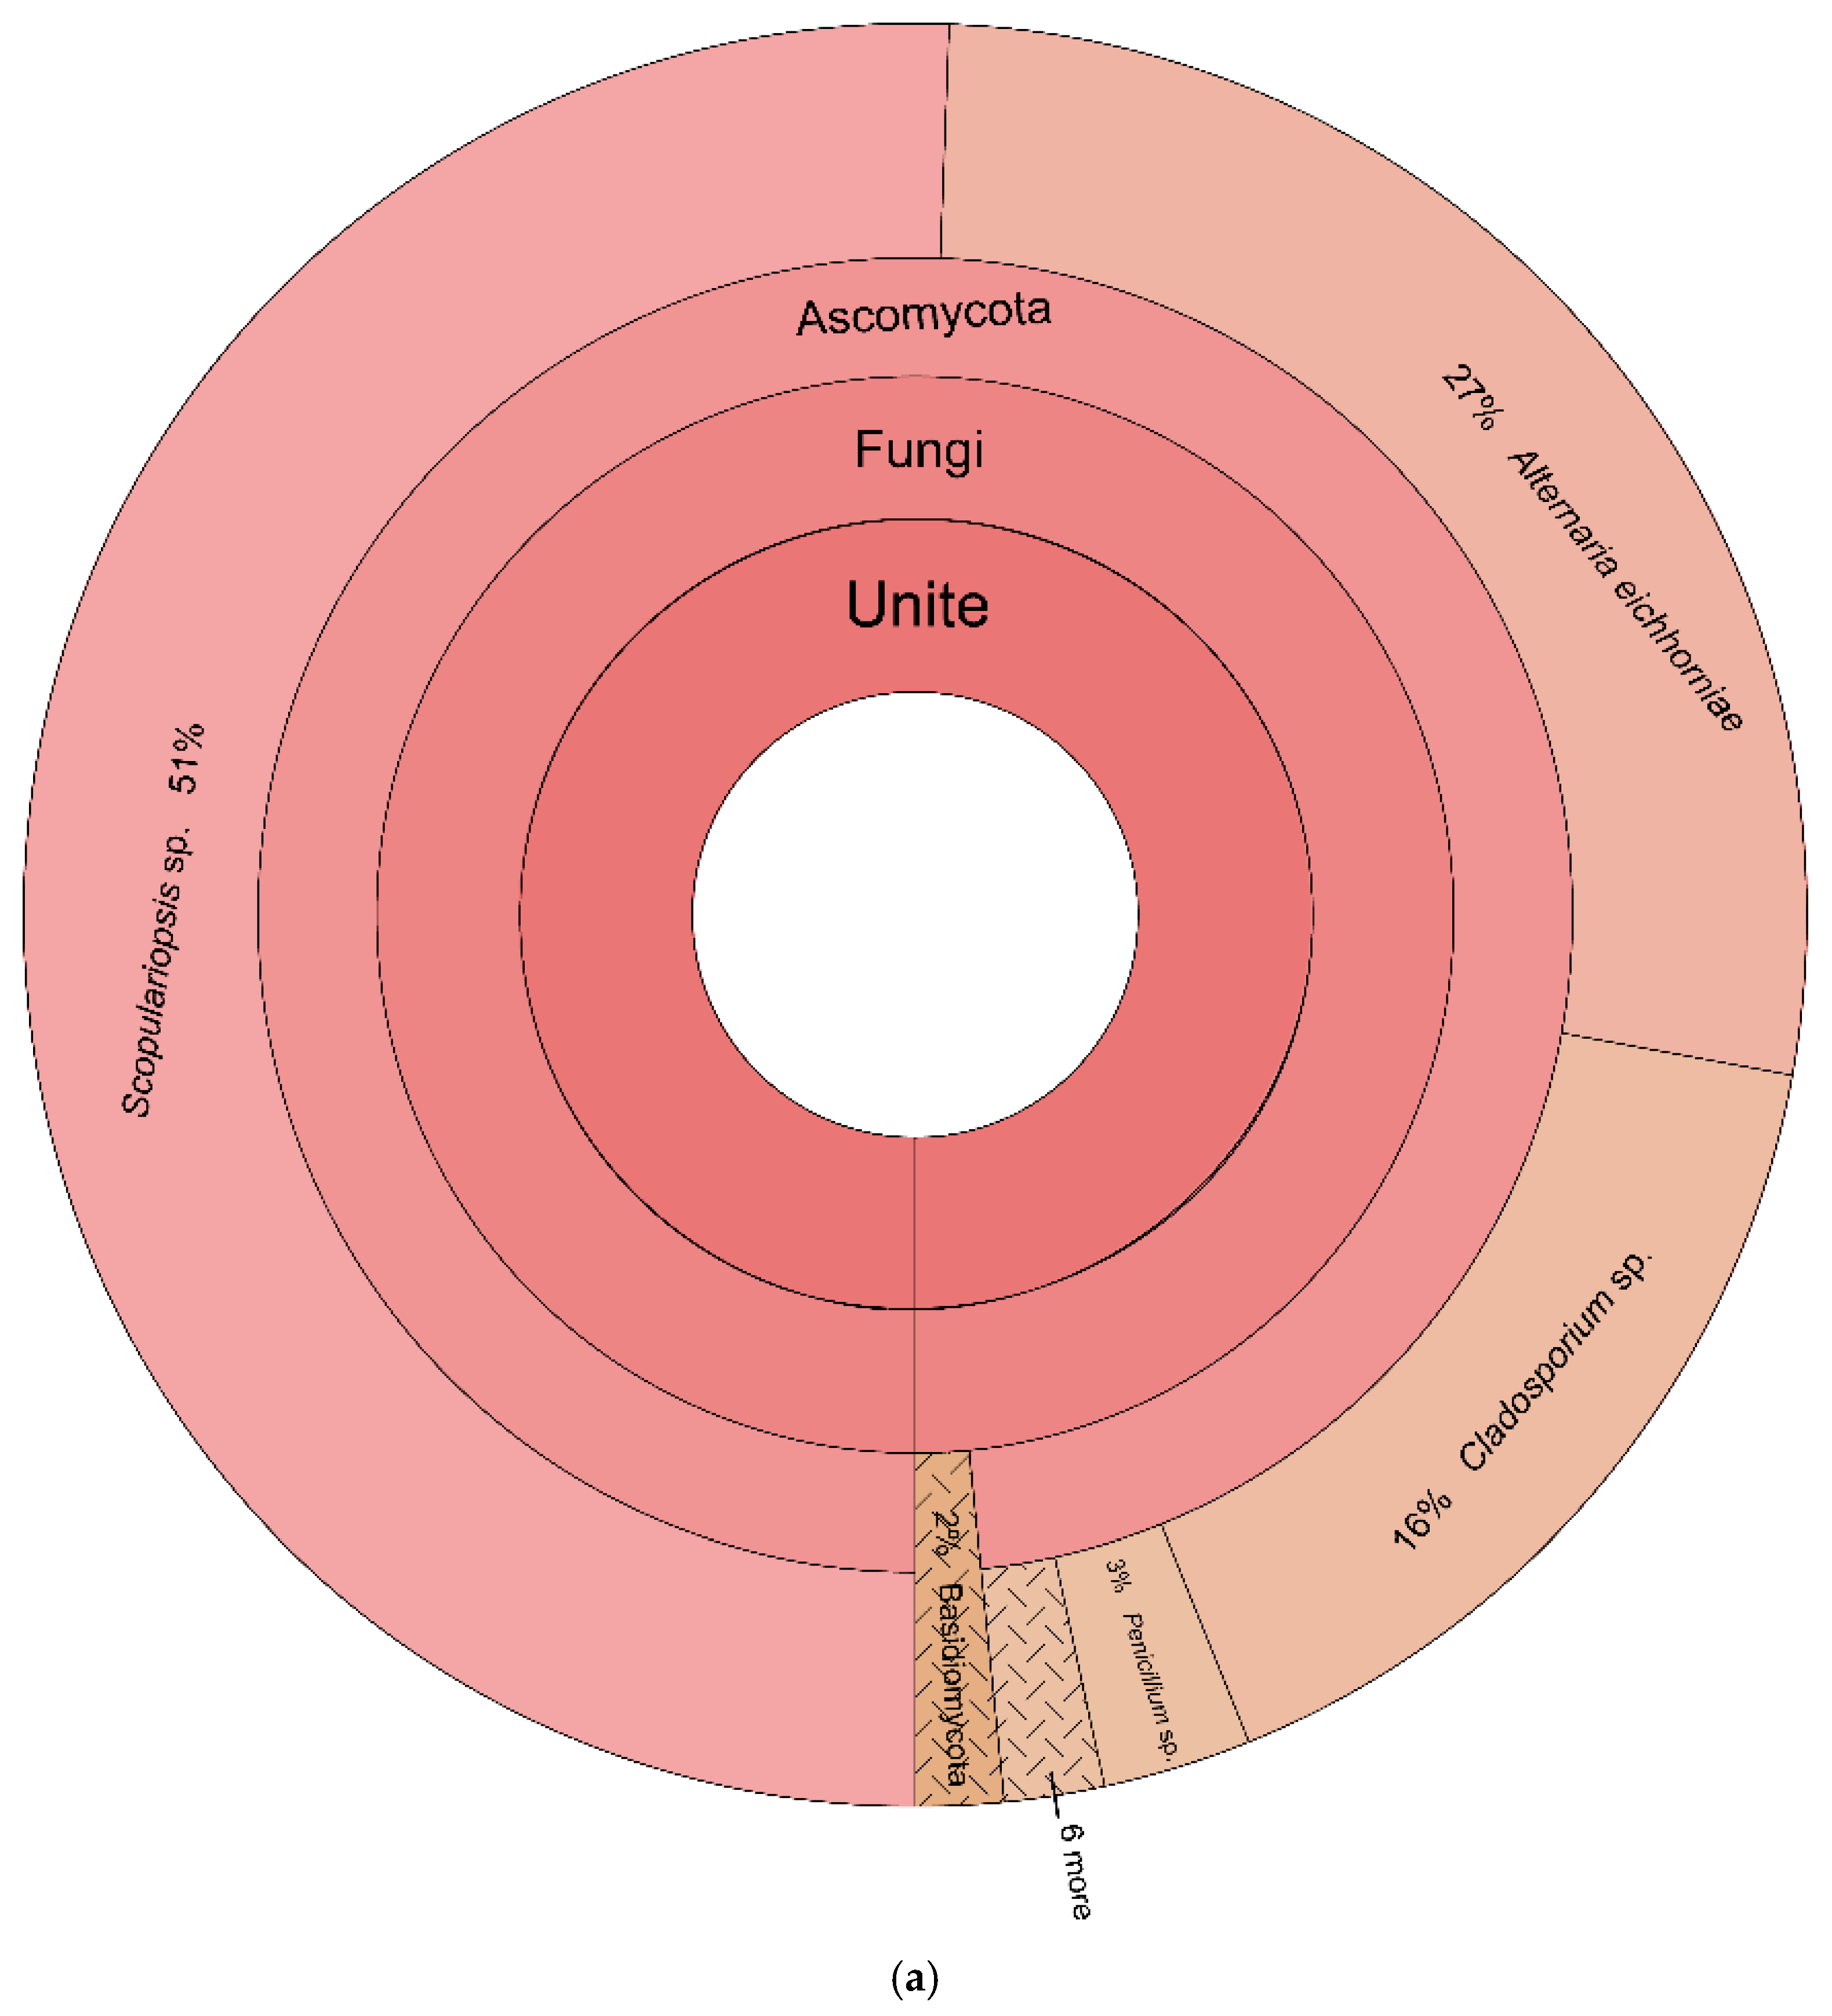
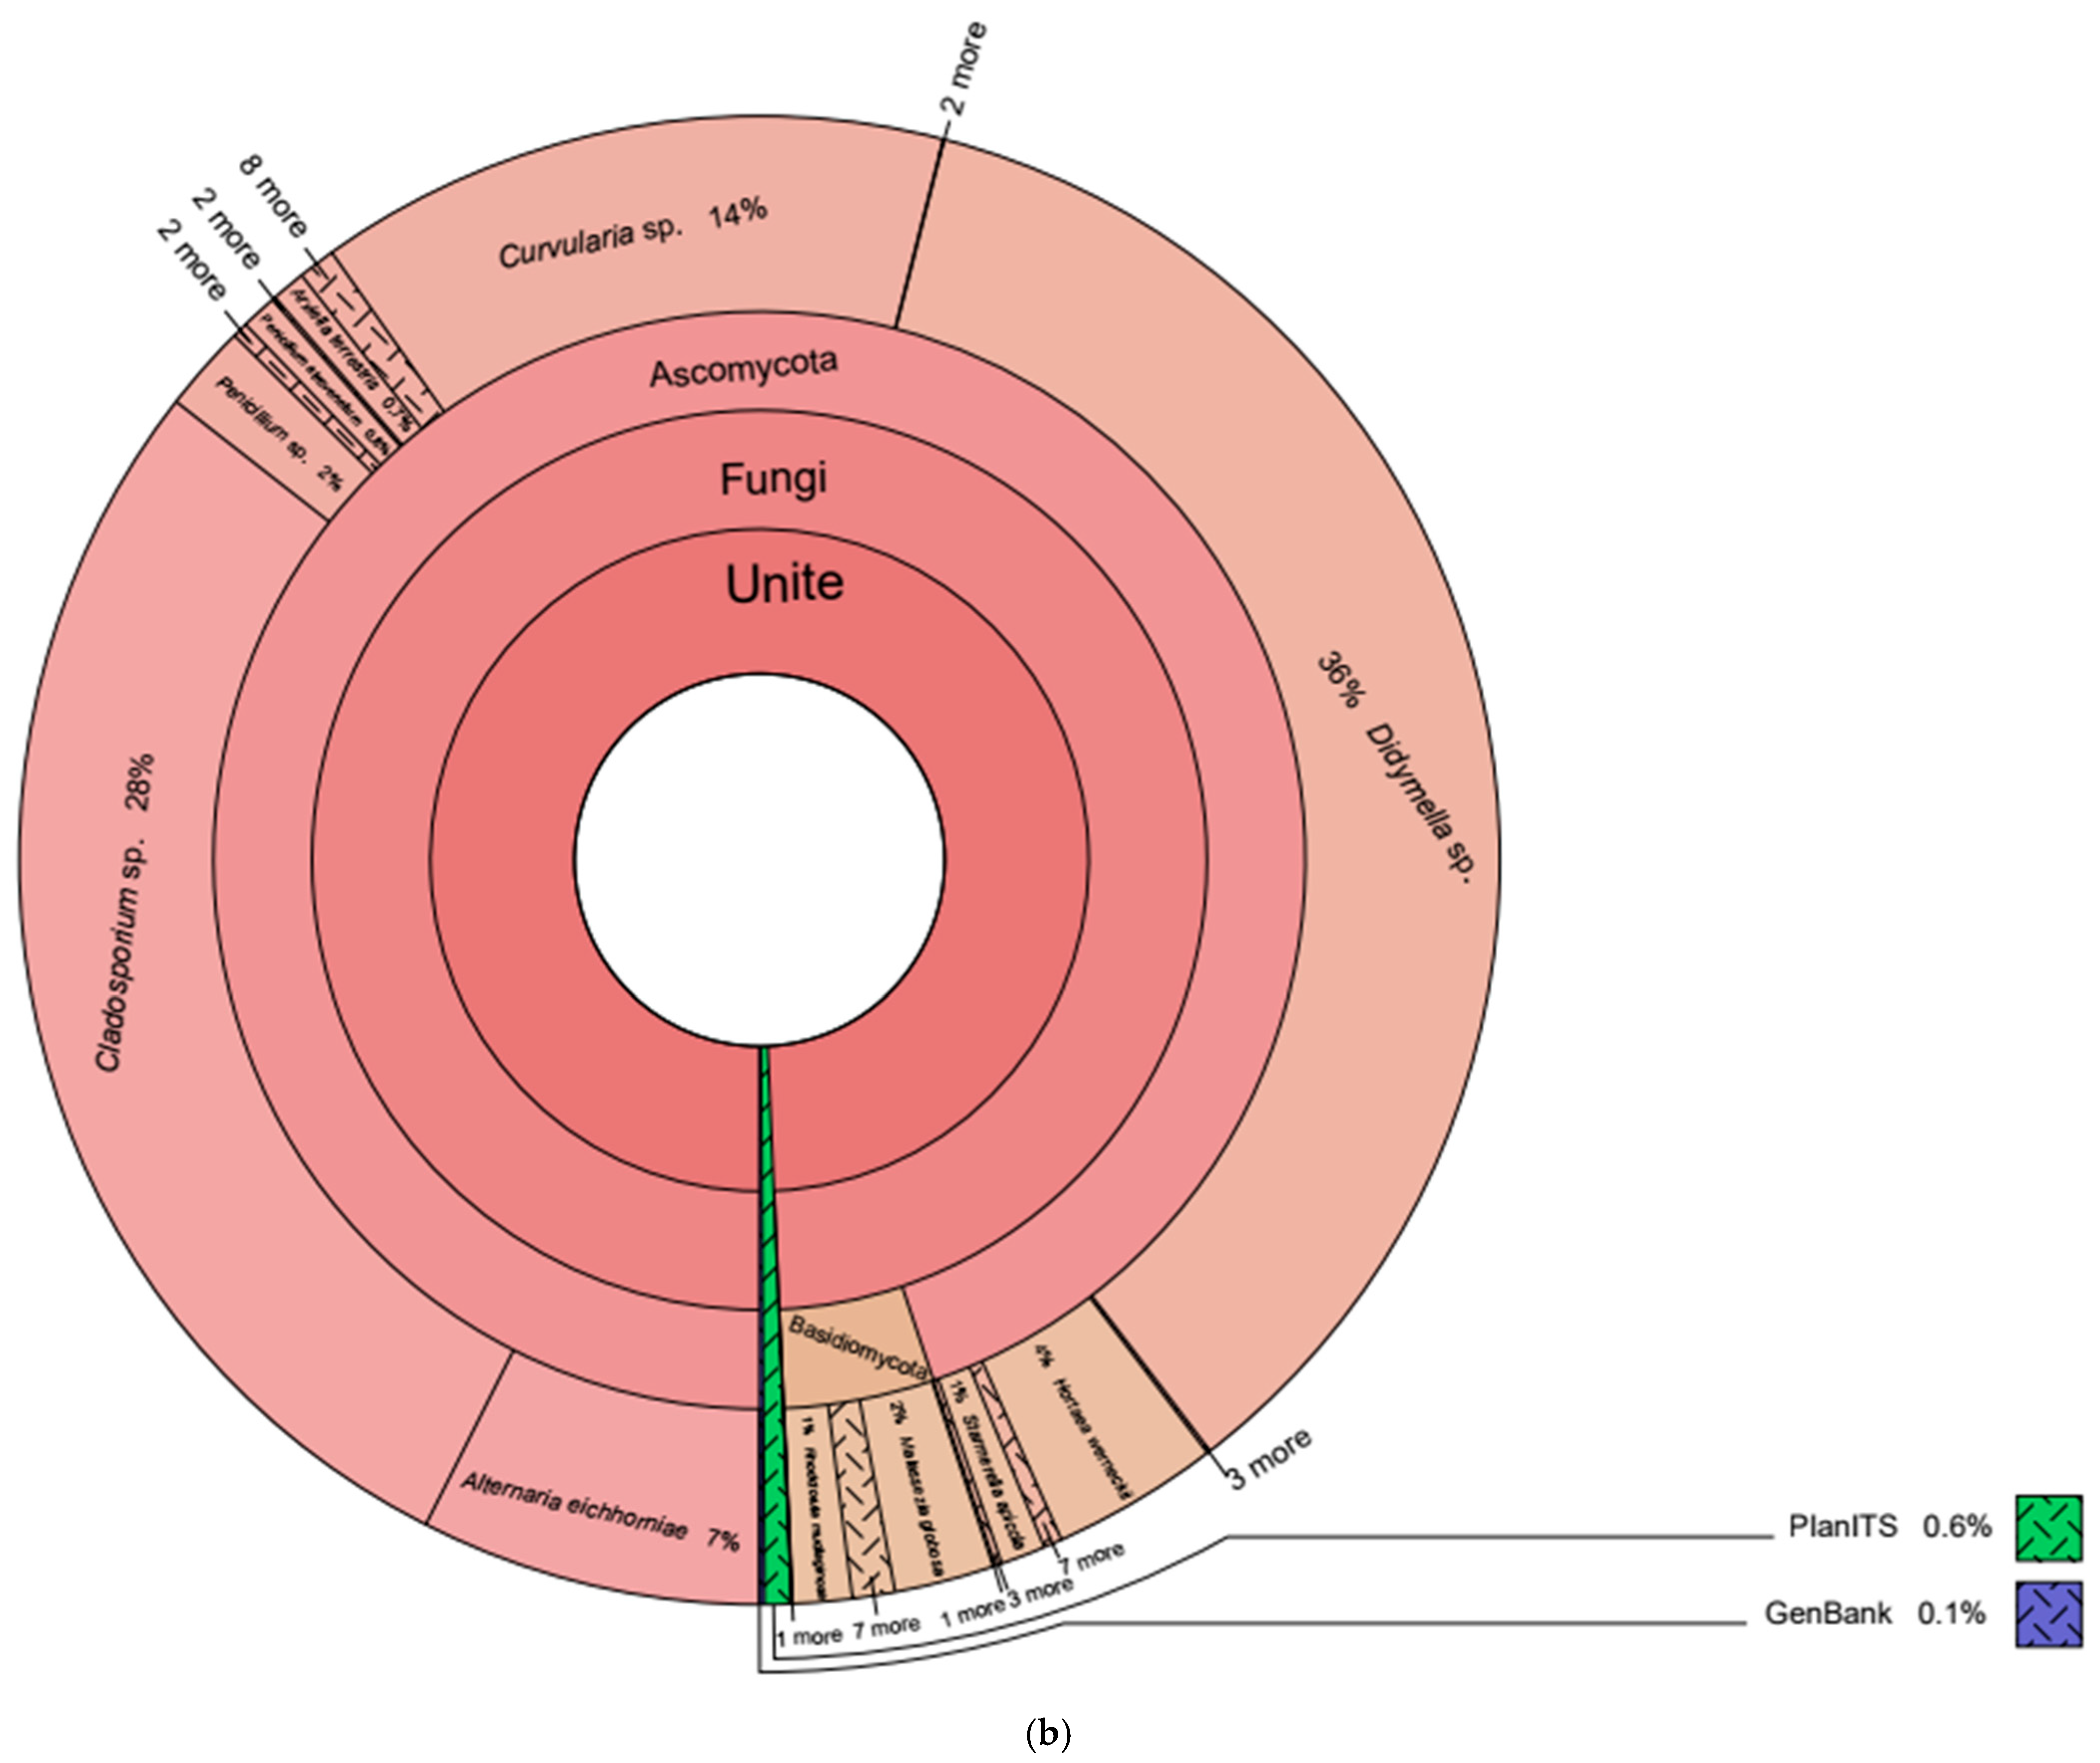
A total of 248,905 paired-end DNA reads were generated and assigned to 65 ASVs. Of these, 176,073 DNA reads and 59 ASVs were detected in sediment obtained at 4280 m depth, while 72,832 DNA reads and 14 ASVs were detected in the core at 4444 m. These were distributed among 34 species, 21 genera, 4 families, 1 class, 4 orders, 5 phyla and 3 kingdoms. These included representatives of three Kingdoms and five phyla: Fungi (Ascomycota and Basidiomycota), Viridiplantae (Chlorophyta and Streptophyta) and Chromista (Ciliophora) (Scheme 1; Table 1). Ascomycota was the dominant phylum assigned in both core sediments, followed by Basidiomycota. Didymella sp., Cladosporium sp., Scopulariopsis sp., Alternaria eichhorniae, Curvularia sp., Hortaea werneckii, Penicillium sp. (Ascomycota) and Malassezia globosa (Basidiomycota) were the most abundant taxa (relative abundance ≥ 1%, in total 12.31% of assigned ASVs); however, these taxa varied in abundance between the two sediment cores (Table 1). In addition, 57 (87.69%) eukaryotic ASVs were rare components of the assigned community. Pseudochlorella pyrenoidosa (Chlorophyta, Viridiplantae) and Spirotrachelostyla tani (Chromista, Ciliophora) were detected as minor components of the eukaryotic community in the sediment obtained at 4280 m depth. Some sequences could only be assigned at higher taxonomic levels (family, order or division).
The number of DNA reads of the two eukaryotic eDNA assemblages differed between the two core samples. In the 4280 m depth core, a total of 72,832 DNA reads were obtained, comprising exclusively fungi. Scopulariopsis sp., A. eichhorniae, Cladosporium sp. and Penicillium sp. were the dominant taxa. The 4444 m depth core generated a higher number of DNA reads (176,073) and was also dominated by fungi but with low quantities of Viridiplantae and Chromista taxa also present. In this core, the fungal taxa Didymella sp., Cladosporium sp., Curvularia sp., A. eichhorniae, H. werneckii, M. globosa and Penicillium sp. dominated the assemblage.

3.3. Eukaryotic Diversity and Distribution

The Mao Tao rarefaction curves reach asymptote for the eukaryotic assemblages from the two sites, indicating that the sequencing was deep enough to capture all amplicons in the eDNA library (Figure 3). The eukaryotic assemblages ranged in their diversity indices (Table 2). The sample obtained from the 4280 m depth core displayed lower numbers of ASVs and taxa assigned and the lowest values of diversity (Fisher’s α), richness (Margalef) and dominance (Simpson) indices; in contrast, the sample obtained from the 4444 m depth core displayed the highest number of ASVs, taxa assigned and indices. Among the 65 eukaryotic ASVs assigned, only A. eichhorniae, Cladosporium sp., Penicillium sp., M. globosa (dominant fungi) and A. versicolor, Colletotrichum sp., P. atrovenetum and M. restricta (rare taxa) were shared between the two cores (Figure 4).

4. Discussion

4.1. Eukaryotic Taxonomy and Diversity

Our study used metabarcoding to detect the eukaryotic community richness and diversity present, as indicated by eDNA sequence assignments, in two selected sections of deep-sea sediment cores sampled in the equatorial Atlantic Ocean between the Fernando de Noronha and São Pedro and São Paulo archipelagos. These assigned communities included 65 representatives of, primarily, Fungi, with a small number of Viridiplantae and Chromista obtained from one of the two cores. Fungal ASVs were assigned to the widespread and common phyla Ascomycota and Basidiomycota, which have previously been reported to be common in deep-sea extreme environments [17,18]. The majority of investigations into deep-sea benthic microbial microbiota focus on bacteria, archaea and protists; in contrast, only few reports of pelagic fungi are available [33]. Fungi have been reported in eDNA studies of deep-sea sediments from different oceans, including the China Sea and the Pacific, Southern and Atlantic Oceans [18]. Ref. [17] considered that fungi can act as important decomposers in deep-sea sediments, which can have a range of carbon availability and can play a crucial role in the regulation of micro- and macro-organism populations; this may explain their dominance amongst the assigned ASVs in the deep-sea sediments studied here. As a result, the detection of a wide range of fungal ASVs may be consistent with them having an active presence and important functional role in these deep-sea communities.
Amongst the dominant taxa assigned, representatives of Cladosporium sp., A. eichhorniae, Curvularia sp. and Penicillium sp. are known to be ubiquitous. The species H. werneckii, while known globally, is an extremophile yeast commonly present specifically in hypersaline habitats [34]. Didymella sp. was the most abundant eDNA assignment but was present only in the core obtained at 4280 m water depth. This genus includes cosmopolitan species present in various environments, with representatives being plant pathogens affecting a wide range of hosts [35]. The genera Cladosporium, Penicillium, Alternaria and Curvularia also include cosmopolitan taxa with worldwide distributions, including species present in and capable of surviving in extreme environments [36,37,38,39,40]. Cladosporium includes species present in different extreme environments around the world [38], including those characterized by high salinity stress [39]. Ref. [38] considered that Cladosporium is one of the largest genera of hyphomycetes distributed globally and reported representatives present at high densities in deep waters in the Southern Ocean. Penicillium species are also commonly isolated from different marine environments, including deep-sea sediments [18], and are considered to play important ecological roles as decomposers in marine ecosystems [38]. Penicillium species have been reported as dominant in fungal assemblages present in Antarctic marine sediments [37]. Ref. [41] recently reported Cladosporium sp. and Penicillium sp. as dominant ASVs present in ornithogenically-influenced soils of the São Pedro and São Paulo archipelago, consistent with their presence in the surrounding deep marine sediments.
The genus Alternaria genus includes a range of saprophytic, endophytic and pathogenic taxa, many with wide natural distributions [42]. As they typically produce very small airborne spores, some members of the genus can be dispersed across long distances globally [42]. An Alternaria sp. was isolated from deep-sea sediment samples from the South China Sea collected at 3927 m depth, displaying potential pharmaceutical value [43]. Alternaria eichhorniae was first reported to cause leaf blight in the water hyacinth, Eichhornia crassipes, an aquatic plant native to South America and widely invasive in warmer regions of the world [44]. Ref. [45] reported the compounds bostrycin and 4-deoxybostrycin as non-specific phytotoxins produced by A. eichhorniae responsible for the observed phytopathogenicity against E. crassipes.
The genus Curvularia includes approximately 213 species [46], with some reported from marine environments. Ref. [47] recovered Curvularia sp. from seawater and from sediment, the latter also displaying the ability to produce bioactive compounds. The genus Scopulariopsis (teleomorph Microascus) includes dematiaceous molds, which are saprophytes commonly present in soil, plant debris and air [48]. Some representatives of this genus are known to be opportunistic pathogens, mainly causing superficial tissue infections, and they represent some of the principal causes of nondermatophytic onychomycoses [49].
Hortaea werneckii (Capnodiales) is a melanized yeast able to grow in saturated NaCl solutions and considered an obligate extremophilic fungus present in some of the most extreme conditions on the planet [50,51]. Recently, ref. [41] reported the eDNA of H. werneckii as the one of the most abundant fungi present in the ornithogenically-influenced soils of the São Pedro and São Paulo archipelago. Malassezia is a diverse genus with 18 known species reported to inhabit human skin and guts, hospital environments and even deep-sea sponges [52]. Different Malassezia species have been reported in high relative abundance in Antarctic soils in metabarcoding studies, suggesting a potential to colonize extreme environments [53].
Although only detected in low abundance, our data revealed the presence of ASVs representing Chlorophyta (Viridiplantae; Pseudochlorella pyrenoidosa) and Ciliophora (Chromista; Spirotrachelostyla tani). Pseudochlorella pyrenoidosa (syn. Chlorellopsis pyrenoidosa) is a green alga, recognized as sensitive to pollutants in the aquatic environment and, for this reason, used as a model organism in ecotoxicity assays [54]. The only Chromista found was the ciliate, S. tani, noted as a commensal on Farres’s scallop (Chlamys farrei), a mollusc commonly found in Asia [55]. Additionally, the few ASV assignments to plants included two flowering plants, Oxyria digyna (Polygonaceae, known as mountain sorrel), which is a common circumboreal species, and Laportea aestuans (=Urtica aestuans), native to Africa but now a widespread introduced species [56]. The single bryophyte assigned, Tortula mucronifolia, is a common and widespread member of Pottiaceae distributed in North and Central America. The green algae assigned are mostly common freshwater species that can easily be transported in the air column (see [18]). While it is plausible that these taxa or close relatives, or their DNA, might be carried to the deep ocean floor by sedimentation, their DNA being assigned in this study does not confirm the presence of viable or active organisms, as it can have multiple sources (either contemporary or originally preserved since deposition) [57].

4.2. Possible Relationships Between the Eukaryotic Diversity Detected and Core Sedimentology and Chronology

The two sediment cores examined here were characterized by different sedimentation rates and geological features. These differences may reflect different paleoclimatic events, although this interpretation is limited by the small dataset: only two cores from relatively distant locations and a single small sample taken from one specific depth and estimated age in each core. Moreover, while the cores provided evidence about past climate processes, the communities identified here likely represent only the surface-associated diversity. These limitations result from the constraints of gravity coring and subsequent sample processing. The assigned eukaryotic assemblages from these two cores exhibited different diversity indices, with that obtained from the core at 4444 m depth displaying the highest indices. The core obtained at 4280 m depth was characterized by higher productivity, organic matter content and sediment input; however, its assigned eukaryotic diversity was considerably lower.
In the core sampled at 4444 m depth, the Fe/Ca ratio was much lower near the base of the core, indicating that the Antarctic Bottom Water had retreated at the end of the glacial period, allowing the CaCO3 to remain on the seafloor. The uppermost sample in this core, positioned at 36–38 cm, was dated from 38,574 year cal BP. This corresponds to the MIS 3 period [58], equivalent to the position of 176–180 cm from the core at 4280 m depth. These different positions from samples of approximately the same age also indicate that the sediment accumulation rate at the 4444 m depth site is much lower than the site at 4280 m depth.
The two cores differed in their color and geochemistry, supporting that they are located in different depositional basins, including different source areas for the sediments and differing deposition processes. The cores obtained at 4280 m depth are located to the north, further from the adjacent continent and more isolated by two fracture zones. Therefore, they appear to receive less terrigenous sediment input. In contrast, the core obtained at 4444 m depth is under greater continental influence and received more terrigenous input from the continent. These geological differences may contribute to the different eukaryotic eDNA diversities found.

5. Conclusions

The use of a metabarcoding approach here revealed the presence of notable eukaryotic communities in the two abyssal sediments sampled, dominated by fungi. The assigned communities included groups with different ecological roles, including cosmopolitan and phytopathogenic members (Cladosporium, Alternaria, Curvularia, Penicillium) and extremophiles (Hortaea and Malassezia). Despite metabarcoding not confirming the presence of viable and active organisms, the fungal diversity identified is plausibly associated with an active and important decomposer community being present in these abyssal habitats. Abyssal sediments present an intriguing opportunity for studying organisms living at the extremes of life on Earth. In addition to metabarcoding, future application of a metagenomic approach independent of PCR bias could further advance the assessment of biodiversity present in abyssal environments, opening avenues for further ecological, evolutionary and biotechnological studies.

Author Contributions

N.R.G., V.N.G., A.A.N., R.V., P.E.A.S.C., R.V., A.A.N. and L.H.R. conceived the study. A.A.N., R.V., T.N.C. and M.M.M. collected the samples. N.R.G. and L.H.R. performed DNA extraction from samples. F.A.C.L. performed the metabarcoding analysis. A.A.N., R.V., T.N.C. and M.M.M. performed the samples physicochemical analysis. A.Q.A., T.R.G., L.J., N.R.G., V.N.G., A.A.N., A.A.N., R.V., T.N.C., M.M.M., F.A.C.L., M.C.S., P.C., P.E.A.S.C., A.Q.A., T.R.G., L.J. and L.H.R. analyzed the results and wrote the manuscript. All authors have read and agreed to the published version of the manuscript.

Funding

This study received financial support from Conselho Nacional de Pesquisa (CNPq—Projects 443264/2019-8, 2024-4/441719). P. Convey is supported by NERC core funding to the British Antarctic Survey’s ‘Biodiversity, Evolution and Adaptation’ Team. F.A.C. Lopes was supported by FAPT. Luigi Jovane and the IO-USP personnel are supported by the Fundação de Amparo à Pesquisa do Estado de São Paulo (FAPESP) project 2016/24946-9.

Institutional Review Board Statement

Not applicable.

Data Availability Statement

All samples analyzed in this study are stored in the Laboratory of Microbiology at Universidade Federal de Minas Gerais. The datasets generated and/or analyzed during the current study are available in the NCBI repository under the codes SAMN46793492-SAMN46793494, which can be accessed in https://www.ncbi.nlm.nih.gov/ (accessed on 22 January 2025).

Conflicts of Interest

The authors declare no conflict of interest.

References

  1. Ramirez-Llodra, E.; Brandt, R.; Danovaro, R.; De Mol, B.; Escovar, E.; German, C.R.; Levin, L.A.; Arbizu, P.M.; Menot, L.; Buhl-Mortensen, P.; et al. Deep, diverse and definitely different: Unique attributes of the world’s largest ecosystem. Biogeosciences 2010, 7, 2851–2899. [Google Scholar] [CrossRef]
  2. Watling, L.; Guinotte, J.; Clark, M.R.; Smith, C.R. A proposed biogeography of the deep ocean floor. Prog. Oceanogr. 2013, 111, 91–112. [Google Scholar] [CrossRef]
  3. Riehl, T.; Wolf, A.-C.; Augustin, N.; Brandt, A. Discovery of widely available abyssal rock patches reveals overlooked habitat type and prompts rethinking deep-sea biodiversity. Proc. Natl. Acad. Sci. USA 2020, 117, 15450–15459. [Google Scholar] [CrossRef] [PubMed]
  4. Voelker, D. Abyssal Plains. In Encyclopedia of Marine Geosciences; Harff, J., Meschede, M., Petersen, S., Thiede, J., Eds.; Springer Reference: Berlin/Heidelberg, Germany, 2016. [Google Scholar]
  5. Lyle, M. Deep-Sea Sediments. In Encyclopedia of Marine Geosciences; Harff, J., Meschede, M., Petersen, S., Thiede, J., Eds.; Springer: Dordrecht, The Netherlands, 2015. [Google Scholar] [CrossRef]
  6. Hurtado, C.; Roddaz, M.; Santos, R.V.; Baby, P.; Antoine, P.-O.; Dantas, E.L. Cretaceous-early paleocene drainage shift of amazonian rivers driven by Equatorial Atlantic Ocean opening and andean uplift as deduced from the provenance of northern Peruvian sedimentary rocks (Huallaga basin). Gondwana Res. 2018, 63, 152–168. [Google Scholar] [CrossRef]
  7. Jones, E.J.; Cande, S.C.; Spathopoulos, F. Evolution of a major oceanographic pathways: The equatorial atlantic, the tectonics, sedimentation and paleoceanography of the North Atlantic Region. Geol. Soc. Spec. Publ. 1995, 90, 199–213. [Google Scholar] [CrossRef]
  8. Munsell, C. Munsell Soil Color Charts, New Revised Edition; Macbeth Division of Kollmorgen Instruments; New Windsor: New York, NY, USA, 2009. [Google Scholar]
  9. Walker, R.G.; James, N.P. Facies Models and Modern Stratigrahic Concepts. In Facies Models—Response to Sea Level Change; Walker, R.G., James, N.P., Eds.; Geological Association of Canada: St. John’s, ON, Canada, 1992. [Google Scholar]
  10. Tauhata, L.; Salati, I.; Di Prinzio, R.; Di Prinzio, A.R. Radioproteção e Dosimetria: Fundamentos; CBPF: Dampier Peninsula, Australia, 2003; Volume 254. [Google Scholar]
  11. Ferretti, M. Princípios e aplicações de espectroscopia de fluorescência de Raios X (FRX) com instrumentação portátil para estudo de bens culturais. Rev. CPC 2009, 7, 74–98. [Google Scholar] [CrossRef][Green Version]
  12. Azevedo, A.Q.; Gonçalves, T.R.; Soares, V.G.; Quina, D.F.; Ayres, A.; Rosa, L.H.; Jovane, L. Tropical Atlantic: Upper ocean structure from the last 80 kyr. In preparation.
  13. Blaauw, M.; Christeny, J.A. Flexible paleoclimate age-depth models using an autoregressive gamma process. Bayesian Anal. 2011, 6, 457–474. [Google Scholar] [CrossRef]
  14. Stuiver, M.; Reimer, P.J.; Reimer, R.W. CALIB 8.2 [WWW Program]. 2021. Available online: http://calib.org (accessed on 1 April 2021).
  15. Chen, S.; Yao, H.; Han, J.; Liu, C.; Song, J.; Shi, L.; Zhu, Y.; Pang, X.X.; Luo, K.; Li, Y.; et al. Validation of the ITS2 region as a novel DNA barcode of identifying medicinal plant species. PLoS ONE 2010, 5, e8613. [Google Scholar] [CrossRef]
  16. Richardson, R.T.; Lin, C.-H.; Sponsler, D.B.; Quijia, J.O.; Goodell, K.; Johnson, R.M. Application of ITS2 metabarcoding to determine the provenance of pollen collected by honey bees in an agroecosystem. Appl. Plant Sci. 2015, 3, 1400066. [Google Scholar] [CrossRef]
  17. Ruppert, K.M.; Kline, R.J.; Rahman, M.S. Past, present, and future perspectives of environmental DNA (eDNA) metabarcoding: A systematic review in methods, monitoring, and applications of global eDNA. Glob. Ecol. Conserv. 2019, 17, e00547. [Google Scholar] [CrossRef]
  18. da Silva, M.K.; De Souza, L.M.D.; Vieira, R.; Neto, A.A.; Lopes, F.A.C.; De Oliveira, F.S.; Convey, P.; Carvalho-Silva, M.; Duarte, A.W.F.; Câmara, P.E.A.S.; et al. Fungal and fungal-like diversity in marine sediments from the maritime Antarctic assessed using DNA Metabarcoding. Sci. Rep. 2022, 12, 21044. [Google Scholar] [CrossRef]
  19. Bushnell, B. BBMap: A Fast, Accurate, Splice-Aware Aligner; Lawrence Berkeley National Lab (LBNL): Berkeley, CA, USA, 2014. [Google Scholar]
  20. Bolyen, E.; Rideout, J.R.; Dillon, M.R.; Bokulich, N.A.; Abnet, C.C.; Al-Ghalith, B.A.; Alexander, H.; Alm, E.J.; Arumugam, M.; Asnicar, F.; et al. Reproducible, interactive, scalable and extensible microbiome data science using QIIME 2. Nat. Biotechnol. 2019, 37, 852–857. [Google Scholar] [CrossRef]
  21. Callahan, B.J.; McMurdie, P.J.; Rosen, M.J.; Han, A.W.; Johnson, A.J.A.; Holmes, S.P. DADA2: High-Resolution sample inference from Illumina Amplicon Data. Nat. Methods 2016, 13, 581–583. [Google Scholar] [CrossRef] [PubMed]
  22. Bokulich, N.A.; Kaehler, B.D.; Rideout, J.R.; Dillon, M.; Bolyen, E.; Knight, R.; Huttley, G.G.; Caporaso, J.G. Optimizing taxonomic classification of marker-gene amplicon sequences with QIIME 2′s q2-feature-classifier plugin. Microbiome 2018, 6, 90. [Google Scholar] [CrossRef] [PubMed]
  23. Banchi, E.; Ametrano, C.G.; Greco, S.; Stankovic, D.; Muggia, L.; Pallavicini, A. PLANiTS: A curated sequence reference dataset for plant ITS DNA metabarcoding. Database 2020, 2020, baz155. [Google Scholar] [CrossRef] [PubMed]
  24. Abarenkov, K.; Zirk, A.; Piirmann, T.; Pohonen, R.; Ivanov, F.; Nilsson, R.H.; Kõljalg, U. UNITE QIIME Release for Eukaryotes; Version 04.02.2020; UNITE Community: London, UK, 2020. [Google Scholar] [CrossRef]
  25. Camacho, C.; Coulouris, G.; Avagyan, V.; Ma, N.; Papadopoulos, J.; Bealer, K.; Madden, T. BLAST+: Architecture and applications. BMC Bioinform. 2009, 10, 421. [Google Scholar] [CrossRef]
  26. Hudson, D.H.; Beier, S.; Flade, I.; Górska, A.; El-Hadidi, M.S.; Ruscheweyh, H.-J.; Tappu, R. MEGAN community edition-interactive exploration and analysis of large-scale microbiome sequencing data. PLoS Comput. Biol. 2016, 12, e1004957. [Google Scholar] [CrossRef]
  27. Giner, C.R.; Forn, I.; Romac, S.; Logares, R.; Vargas, C.; Massana, R. Environmental sequencing provides reasonable estimates of the relative abundance of specific picoeukaryotes. Appl. Environ. Microbiol. 2016, 82, 4757–4766. [Google Scholar] [CrossRef]
  28. Ondov, B.D.; Bergman, N.H.; Phillippy, A.M. Interactive metagenomic visualization in a web browser. BMC Bioinform. 2011, 12, 385. [Google Scholar] [CrossRef]
  29. Rosa, L.H.; Pinto, O.H.B.; Convey, P.; Carvalho-Silva, M.; Rosa, C.A.; Câmara, P.E.A.S. DNA metabarcoding to assess the diversity of airborne fungi present over Keller Peninsula, King George Island, Antarctica. Microb. Ecol. 2021, 82, 165–172. [Google Scholar] [CrossRef]
  30. Hammer, Ø.; Harper, D.A.T.; Ryan, P.D. PAST: Paleontological statistics software package for education and data analysis. Palaeontol. Electron. 2001, 4, 1. [Google Scholar]
  31. Bardou, P.; Mariette, J.; Escudié, F.; Djemiel, C.; Klopp, C. Jvenn: An interactive Venn diagram viewer. BMC Bioinform. 2014, 15, 293. [Google Scholar] [CrossRef]
  32. Thompson, S.B.; Craveling, J.R. A global database of marine isotope substage 5a and 5c marine terraces and paleoshoreline indicators. Earth Syst. Sci. Data 2021, 13, 3467–3490. [Google Scholar] [CrossRef]
  33. Breyer, E.; Baltar, F. The largely neglected ecological role of oceanic pelagic fungi. Trends Ecol. Evol. 2023, 38, 870–888. [Google Scholar] [CrossRef] [PubMed]
  34. Musa, H.; Kasim, F.H.; Gunny, A.A.N.; Gopinath, S.C.B. Salt-adapted moulds and yeasts: Potentials in industrial and environmental biotechnology. Process Biochem. 2018, 69, 33–44. [Google Scholar] [CrossRef]
  35. Chen, Q.; Hou, L.W.; Duan, W.J.; Crous, P.W.; Cai, L. Didymellaceae revisited. Stud. Mycol. 2017, 87, 105–159. [Google Scholar] [CrossRef]
  36. Swathi, J.; Sowjanya, K.M.; Narendra, K.; Reddy, K.V.N.R.; Satya, A.K. Isolation, identification and production of bioactive metabolites from marine fungi collected from coastal area of Andhra Pradesh, India. J. Pharm. Res. 2013, 6, 663–666. [Google Scholar] [CrossRef]
  37. Godinho, V.M.; Gonçalves, V.N.; Santiago, I.F.; Figueredo, H.M.; Vitoreli, G.A.; Schaefer, C.E.G.R.; Barbosa, E.C.; Oliveira, J.G.; Alves, T.M.A.; Zani, C.L.; et al. Diversity and bioprospection of fungal community present in oligotrophic soil of continental Antarctica. Extremophiles 2015, 19, 585–596. [Google Scholar] [CrossRef]
  38. Bensch, K.; Groenewald, J.Z.; Dijksterhuis, J.; Starink-Willemse, M.; Andersen, B.; Summerell, B.A.; Shin, H.-D.; Dugan, F.M.; Schroes, H.-J.; Braun, U.; et al. Species and ecological diversity within the Cladosporium cladosporioides complex (Davidiellaceae, Capnodiales). Stud. Mycol. 2010, 67, 1–94. [Google Scholar] [CrossRef]
  39. Apangu, G.P.; Frisk, C.A.; Petch, G.M.; Muggia, L.; Pallavicini, A.; Hanson, M.; Skjoth, C.A. Environmental DNA reveals diversity and abundance of Alternaria species in neighbouring heterogeneous landscapes in Worcester, UK. Aerobiologia 2022, 38, 457–481. [Google Scholar] [CrossRef]
  40. Gunde-Cimerman, N.; Zalarb, P.; de Hoogs, S.; Plemenitasd, A. Hypersaline water in salterns—Natural ecological niches for halophilic black yeasts. FEMS Microbiol. Ecol. 2000, 32, 235–240. [Google Scholar]
  41. Gonçalves, V.N.; Soares, F.O.; Corrêa, G.R.; Senra, E.O.; Lopes, F.A.C.; Silva, M.C.; Convey, P.; Câmara, P.E.A.S.; Duarte, A.W.F.; Rosa, L.H. Fungal diversity present in ornithogenic soils of extreme equatorial Atlantic São Pedro and São Paulo archipelago using DNA metabarcoding. Braz. J. Microbiol. 2025, 56, 1619–1629. [Google Scholar] [CrossRef]
  42. Rotem, J. The genus Alternaria: Biology, Epidemiology and Pathogenicity; American Phytopathological Society: Saint Paul, MN, USA, 1994. [Google Scholar]
  43. Ding, H.; Zhang, D.; Zhou, B.; Ma, Z. Inhibitors of BRD4 Protein from a marine-derived fungus Alternaria sp. NH-F6. Mar. Drugs. 2017, 15, 76. [Google Scholar] [CrossRef]
  44. Nag Raj, T.R.; Ponnappa, K.M. Blight of water-hyacinth caused by Alternaria eichhorniae sp. nov. Trans. Br. Mycol. Soc. 1970, 55, 123–130. [Google Scholar] [CrossRef]
  45. Charudattanl, R.; Rao, R.V. Bostrycin and 4-deoxybostrycin: Two nonspecific phytotoxins produced by Alternaria eichhorniae. Appl. Environ. Microbiol. 1982, 43, 846–849. [Google Scholar] [CrossRef] [PubMed]
  46. Mehta, T.; Meena, M.; Nagda, A. Bioactive compounds of Curvularia species as a source of various biological activities and biotechnological applications. Front. Microbiol. 2022, 8, 1069095. [Google Scholar] [CrossRef] [PubMed]
  47. Yurchenko, A.N.; Smetanina, O.F.S.; Khudyakova, Y.V.; Kirichuk, N.N.; Yurchenko, E.A.; Afiyatullov, S.S. Metabolites of the marine isolate of the fungus Curvularia inaequalis. Chem. Nat. Compd. 2013, 49, 163–164. [Google Scholar] [CrossRef]
  48. Morton, F.J.; Smith, G. The genera Scopulariopsis Bainier, Microascus Zukal, and Doratomyces Corda. Mycol. Pap. 1963, 86, 1–96. [Google Scholar]
  49. Tosti, A.; Piraccini, B.M.; Stinchi, C.; Lorenzi, S. Onychomycosis due to Scopulariopsis brevicaulis: Clinical features and response to systemic antifungals. Br. J. Dermatol. 1996, 135, 799–802. [Google Scholar] [CrossRef]
  50. Vaupotič, T.; Plemenitaš, A. Differential gene expression and Hog1 interaction with osmoresponsive genes in the extremely halotolerant black yeast Hortaea werneckii. BMC Genom. 2007, 8, 280. [Google Scholar] [CrossRef]
  51. Gostinčar, C.; Stajich, J.E.; Gunde-Cimerman, N. Extremophilic and extremotolerant fungi. Curr. Biol. 2023, 33, R743–R759. [Google Scholar] [CrossRef]
  52. Ianiri, G.; LeibundGut-Landmann, S.; Dawson, T.L., Jr. Malassezia: A commensal, pathogen, and mutualist of human and animal skin. Annu. Rev. Microbiol. 2022, 8, 757–782. [Google Scholar] [CrossRef] [PubMed]
  53. Rosa, L.H.; Da Silva, T.H.; Ogaki, M.B.; Pinto, O.H.B.; Stech, M.; Convey, P.; Carvalho-Silva, M.; Rosa, C.A.; Câmara, P.E.A.S. DNA metabarcoding uncovers fungal diversity in soils of protected and non-protected areas on Deception Island, Antarctica. Sci. Rep. 2020, 10, 21986. [Google Scholar] [CrossRef] [PubMed]
  54. Zhao, J.; Cao, X.; Wang, Z.; Dai, Y.; Xing, B. Mechanistic understanding toward the toxicity of graphene-family materials to freshwater algae. Water Res. 2017, 111, 18–27. [Google Scholar] [CrossRef]
  55. Mayén-Estrada, R.; Dávila, S.; Dias, R.J.P. Ciliate symbionts of bivalves with notes on their worldwide geographic distribution. Zootaxa 2024, 14, 451–481. [Google Scholar] [CrossRef]
  56. Mabberley, D.J. Mabberley’s Plant-Book: A Portable Dictionary of Plants, Their Classification and Uses, 4th ed.; Cambridge University Press: Cambridge, UK, 2017. [Google Scholar]
  57. Armbrecht, L.; Weber, M.E.; Raymo, M.E.; Peck, V.L.; Williams, T.; Warnock, J.; Kato, Y.; Hernández-Almeida, I.; Hoem, F.; Reilly, B.; et al. Ancient marine sediment DNA reveals diatom transition in Antarctica. Nat. Commun. 2022, 13, 5787. [Google Scholar] [CrossRef]
  58. Pickering, J.L. Terrace formation in the upper Bengal basin since the Middle Pleistocene: Brahmaputra fan delta construction during multiple highstands. Basin Res. 2017, 30, 550–567. [Google Scholar] [CrossRef]
Figure 1. Sites where abyssal sediment cores were obtained in the equatorial Atlantic Ocean. The two sites (4280 m and 4444 m water depth) are represented by yellow stars and are located between the Fernando de Noronha and São Pedro and São Paulo archipelagos, which are represented by red dots.
Dna 05 00045 g001
Figure 2. Sedimentological and geochemical analyses of cores from (a) sedimentology and geochemistry of core from 4280 m water depth. (b) Sedimentology and geochemistry of core from 4444 m water depth. Ages expressed in years calibrated before present; grain size: vf = very fine; f = fine; m = medium; c = coarse; vc = very coarse; gran = granule; pebb = pebble; cbb = cobble; boul = boulder.
Dna 05 00045 g002aDna 05 00045 g002b
Scheme 1. Krona charts showing the abundances of different eukaryotic taxonomic levels detected in abyssal sediment samples obtained between the Fernando de Noronha and the São Pedro and São Paulo archipelagos in the equatorial Atlantic Ocean. (a) community abundance detected in 4280 m depth core and (b) community abundance detected in 4444 m depth core.
Dna 05 00045 sch001aDna 05 00045 sch001b
Figure 3. Rarefaction curves (Mao Tao index) for eukaryotic assemblages detected from each of the abyssal sediment samples. (a) Rarefaction curve for the assemblage in the core from 4280 m water depth. (b) Rarefaction curve for the assemblage in the core from 4444 m water depth. Blue lines represent 95% confidence interval.
Dna 05 00045 g003
Figure 4. Venn diagram of eukaryotic assemblages detected from each of the two abyssal sediment cores obtained in the equatorial Atlantic Ocean. The taxa labelled in red represent dominant fungi.
Dna 05 00045 g004
Table 1. Assigned eukaryotic amplicon sequence variants detected in abyssal sediment samples. Dominant taxa with relative abundance > 1% are shown in green.
DatabaseKingdomPhylumAmplicon Sequence VariantCore Depth and Relative Abundance (%)
42804444
UniteFungiAscomycotaDidymella sp.0.000025.1674
Cladosporium sp.4.685319.8931
Scopulariopsis sp.14.80850.0000
Alternaria eichhorniae7.98065.2631
Curvularia sp.0.00009.7575
Hortaea werneckii0.00002.5857
Penicillium sp.0.78951.3387
Starmerella apicola0.00000.6914
Penicillium atrovenetum0.05990.5548
Arxiella terrestris0.00000.5231
Aspergillus versicolor0.10810.2210
Cryomyces funiculosus0.00000.2121
Pseudogymnoascus pannorum0.00000.2109
Chaetothyriales sp.0.00000.1860
Colletotrichum sp.0.10080.0165
Acremonium charticola0.11090.0000
Pichia terricola0.07750.0000
Fusarium sp.0.07310.0000
Trapeliopsis sp.0.00000.0635
Chaetothyriales sp.0.00000.0579
Agyriales sp.0.00000.0362
Catenulostroma sp.0.00000.0297
Sugiyamaella sp.0.00000.0297
Candida albicans0.00000.0293
Dothideomycetes sp.0.00000.0273
Aspergillus sp.0.00000.0233
Physciaceae sp.0.00000.0221
Phaeosphaeria sp.0.00000.0177
Acarospora sp.0.00000.0169
Elasticomyces elasticus0.00000.0149
Buellia sp.0.00000.0129
Capnodiales sp.0.00000.0129
Phylliscum sp.0.00000.0117
Paraphaeosphaeria sp.0.00000.0112
Debaryomyces sp.0.00000.0104
Candida orthopsilosis0.00000.0088
Exophiala cancerae0.00000.0080
Starmerella etchellsii0.00000.0076
Lachancea thermotolerans0.00000.0052
Lecanora sp.0.00000.0048
Diaporthaceae sp.0.00000.0028
BasidiomycotaMalassezia globosa0.11491.5403
Rhodotorula mucilaginosa0.00000.9144
Cutaneotrichosporon debeurmannianum0.00000.4962
Malassezia restricta0.16110.0378
Papiliotrema terrestris0.12450.0000
Radulomyces sp.0.06630.0000
Naganishia diffluens0.00000.0558
Exidiaceae sp.0.00000.0333
Malassezia arunalokei0.00000.0325
Malasseziaceae sp.0.00000.0145
Phenoliferia psychrophenolica0.00000.0129
Gjaerumia minor0.00000.0117
Robbauera albescens0.00000.0096
ChromistaCiliophoraSpirotrachelostyla tani0.00000.0072
GenBankFungiAscomycotaRhizocarpon sp.0.00000.0088
Fungal sp.0.00000.0679
PlanITSViridiplantaeChlorophytaPseudochlorella pyrenoidosa0.00000.2828
Bracteacoccus bullatus0.00000.0325
Stichococcus mirabilis0.00000.0233
Diplosphaera sp.0.00000.0217
Trebouxia flava0.00000.0108
StreptophytaLaportea aestuans0.00000.0229
Tortula mucronifolia0.00000.0100
Oxyria digyna0.00000.0056
Table 2. Eukaryotic amplicon sequence variant (ASV) diversity indices detected in the abyssal sediment samples obtained from cores at 4280 m and 4444 m water depth.
Diversity IndicesCore Water Depth (m)
42804444
Number of fungal ASVs1459
Number of DNA reads 72,832176,073
Fisher’s α1.305.71
Margalef1.164.80
Simpson0.640.77
Disclaimer/Publisher’s Note: The statements, opinions and data contained in all publications are solely those of the individual author(s) and contributor(s) and not of MDPI and/or the editor(s). MDPI and/or the editor(s) disclaim responsibility for any injury to people or property resulting from any ideas, methods, instructions or products referred to in the content.