Article

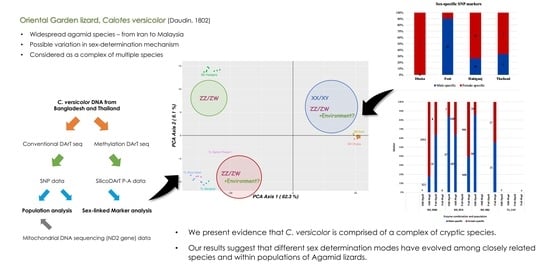
Sex-Determination Mechanisms among Populations within Cryptic Species Complex of Calotes (Squamata: Agamidae: Draconinae)

by
Shayer Mahmood Ibney Alam
1,
Tulyawat Prasongmaneerut
2,
Dianne Gleeson
1,
Arthur Georges
3,
Stephen D. Sarre
1,
Kornsorn Srikulnath
2 and
Tariq Ezaz
1,*
1
Centre for Conservation Ecology and Genomics, Institute for Applied Ecology, University of Canberra, Bruce, ACT 2617, Australia
2
Animal Genomics and Bioresource Research Center (AGB Research Center), Faculty of Science, Kasetsart University, 50 Ngamwongwan, Chatuchak, Bangkok 10900, Thailand
3
Institute for Applied Ecology, University of Canberra, Bruce, ACT 2601, Australia
*
Author to whom correspondence should be addressed.
DNA 2021, 1(2), 49-67; https://doi.org/10.3390/dna1020006
Submission received: 14 August 2021 / Revised: 23 September 2021 / Accepted: 29 September 2021 / Published: 6 October 2021

Abstract

:
Sex-determination mechanisms and sex chromosomes are known to vary among reptile species and, in a few celebrated examples, within populations of the same species. The oriental garden lizard, Calotes versicolor, is one of the most intriguing species in this regard, exhibiting evidence of multiple sex-determination modes within a single species. One possible explanation for this unusual distribution is that in C. versicolor, different modes of sex determination are confined to a particular population or a species within a cryptic species complex. Here, we report on a population genetic analysis using SNP data from a methylation-sensitive DArT sequencing analysis and mitochondrial DNA data obtained from samples collected from six locations: three from Bangladesh and three from Thailand. Our aim was to determine whether C. versicolor is best described as a single species with multiple lineages or as multiple species, as well as if its sex-determination mechanisms vary within or between species. We present evidence that the latter possibility is the case and that C. versicolor comprises a complex of cryptic species. We also identify sex-linked markers within these species and use them to identify modes of sex determination. Overall, our results suggest that different sex-determination modes have evolved among closely related species and within populations of Agamid lizards.

Graphical Abstract

1. Introduction

The determination of sex is one of the most fundamental and yet highly variable mechanisms in the animal kingdom [1], and it can evolve rapidly. Variation in this mechanism has been observed within many lineages of animals, plants, and even closely related species or populations [1,2]. For example, in the Japanese wrinkled frog, Glandirana (Rana) rugosa (Temminck and Schlegel, 1838), four genetic forms are distributed in different geographic regions of Japan [3,4], with male and female heterogametic sexes indicating a turnover of sex chromosomes within this single species across its range. The oriental garden lizard, Calotes versicolor (Daudin, 1802), is another widely cited example of a species in which different forms of sex determination are present [5,6,7], and it is this species that we report on here.
Determining heterogametic sex by identifying sex chromosomes is not easy if the sex chromosomes are cryptic. These chromosomes may contain sex-specific genes or sequences that can reveal their sex-determination mode (XY or ZW) [8,9,10,11,12,13,14]. This may be true even in the case of species with temperature-dependent sex determination (TSD) and, therefore, lacking sex-specific chromosomes or where species show diverse sex ratio patterns complicated by gene–temperature interactions. In these cases, the development of sex-linked markers can provide valuable insights by enabling genetic sex to be identified and correlated with phenotypic sex. Such markers have been successfully identified in several reptilian taxa [8,11,12,14,15,16,17], where they have been used to identify sex-determination modes and cases of sex reversal [18,19].
It is speculated that the differential methylation of the promoters of genes is involved in sex determination at sex-specific temperatures [20,21], but a full understanding of the mechanism is unknown [22]. Differences in gene methylations occurring between genetic males and females have been observed in European sea bass, Dicentrarchus labrax [23]; Nile tilapia, Oreochromis niloticus [24] and half-smooth tongue sole, Cynoglossus semilaevis [25]. Differential methylation patterns associated with phenotypic sex have also been reported in different developmental stages of the red-eared slider turtle, Trachemys scripta [26]. However, epigenetic changes do not involve a change in the nucleotide sequence but rather in the methylation of histones to influence the folding of chromatin and thus the availability of genes for expression [20,27] or in DNA methylation [27]. Restriction site-associated DNA sequencing, such as RADseq and DArTseq, has been proposed as a method for developing sex-linked markers, i.e., sex-linked loci in taxa with homomorphic sex chromosomes [8,10]. This has successfully been used to develop sex-linked markers and infer the sex-determining mode for several amphibian, squamate, and fish species [10,11,14,28,29,30,31,32,33]. Diversity Arrays Technology (Bruce, Australia), the developer of DArTseq™, has developed a methylation-sensitive DArTseq (DArTseqMet) that uses two different restriction enzyme isoschizomers (one of them CpG methylation-sensitive) to identify sex-specific markers. This has the potential to reveal DNA methylation-mediated sex determination.
The oriental garden lizard, C. versicolor, belongs to the subfamily Draconinae of the family Agamidae. It has a wide distribution and is found from Iran to Malaysia through South Asia and Southeast China across highly heterogeneous habitats [34]. It has been introduced to different countries, including the USA (Florida), Indonesia (Celebes), Maldives, Seychelles, and Kenya, and it is found across highly heterogeneous habitats in different elevation ranges. This species is sometimes considered taxonomically neglected [35], and significant variations in body size among populations of C. versicolor have been reported [36]. Studies have also shown a complex evolutionary history in this species and revealed several distinct mitochondrial lineages. This emphasizes the idea that this species may actually comprise a complex of multiple species across its known range [37,38].
This species is known neither to have chromosomal (genotypic) nor temperature-dependent modes of sex determination; rather, it has an indeterminate, bipotential gonad throughout embryonic development [39]. It lacks heteromorphic sex chromosomes [40,41,42], but gene expression analysis has shown this species to have genotypic sex determination rather than environmental sex determination, as in some other reptiles [5,7]. However, Doddamani et al. [6] claimed that C. versicolor has TSD with a novel female–male–female–male (FMFM) pattern of offspring sex ratio based on egg incubation experiments at differential temperatures involving the verification of sexes via the histological examination of the gonad and the presence of secondary sexual characteristics. It is not known whether this observed variation is due to the existence of multiple cryptic species, the transition of sex-determination mechanisms and sex chromosome turnovers, or the existence of multiple thermosensitive points among closely related species or populations. Therefore, the investigation of sex-determination modes and sex chromosomes within this species (or species complex) potentially provides a good model for examining variation in the mode of sex-determination mechanisms in a species with a wide geographic distribution.
The primary aim of this study was to identify sex-determining mechanisms (i.e., modes of sex determination and sex chromosome heterogamety) across the Calotes species complex. The first step was to determine whether C. versicolor individuals from different locations were considered as discrete genetic lineages within species or a continuum within a species. We collected known C. versicolor samples from Bangladesh and Thailand to determine the extent of genetic differentiation within its range, and we describe the probable sex-determination mechanisms between populations. We performed a population-level analysis to determine whether our collected samples were genetically distinct and then used this information to identify the sex-determination modes that could be ascribed to each discrete unit. Both of these forms of data were used to reveal whether C. versicolor consists of a series of cryptic species.

2. Materials and Methods

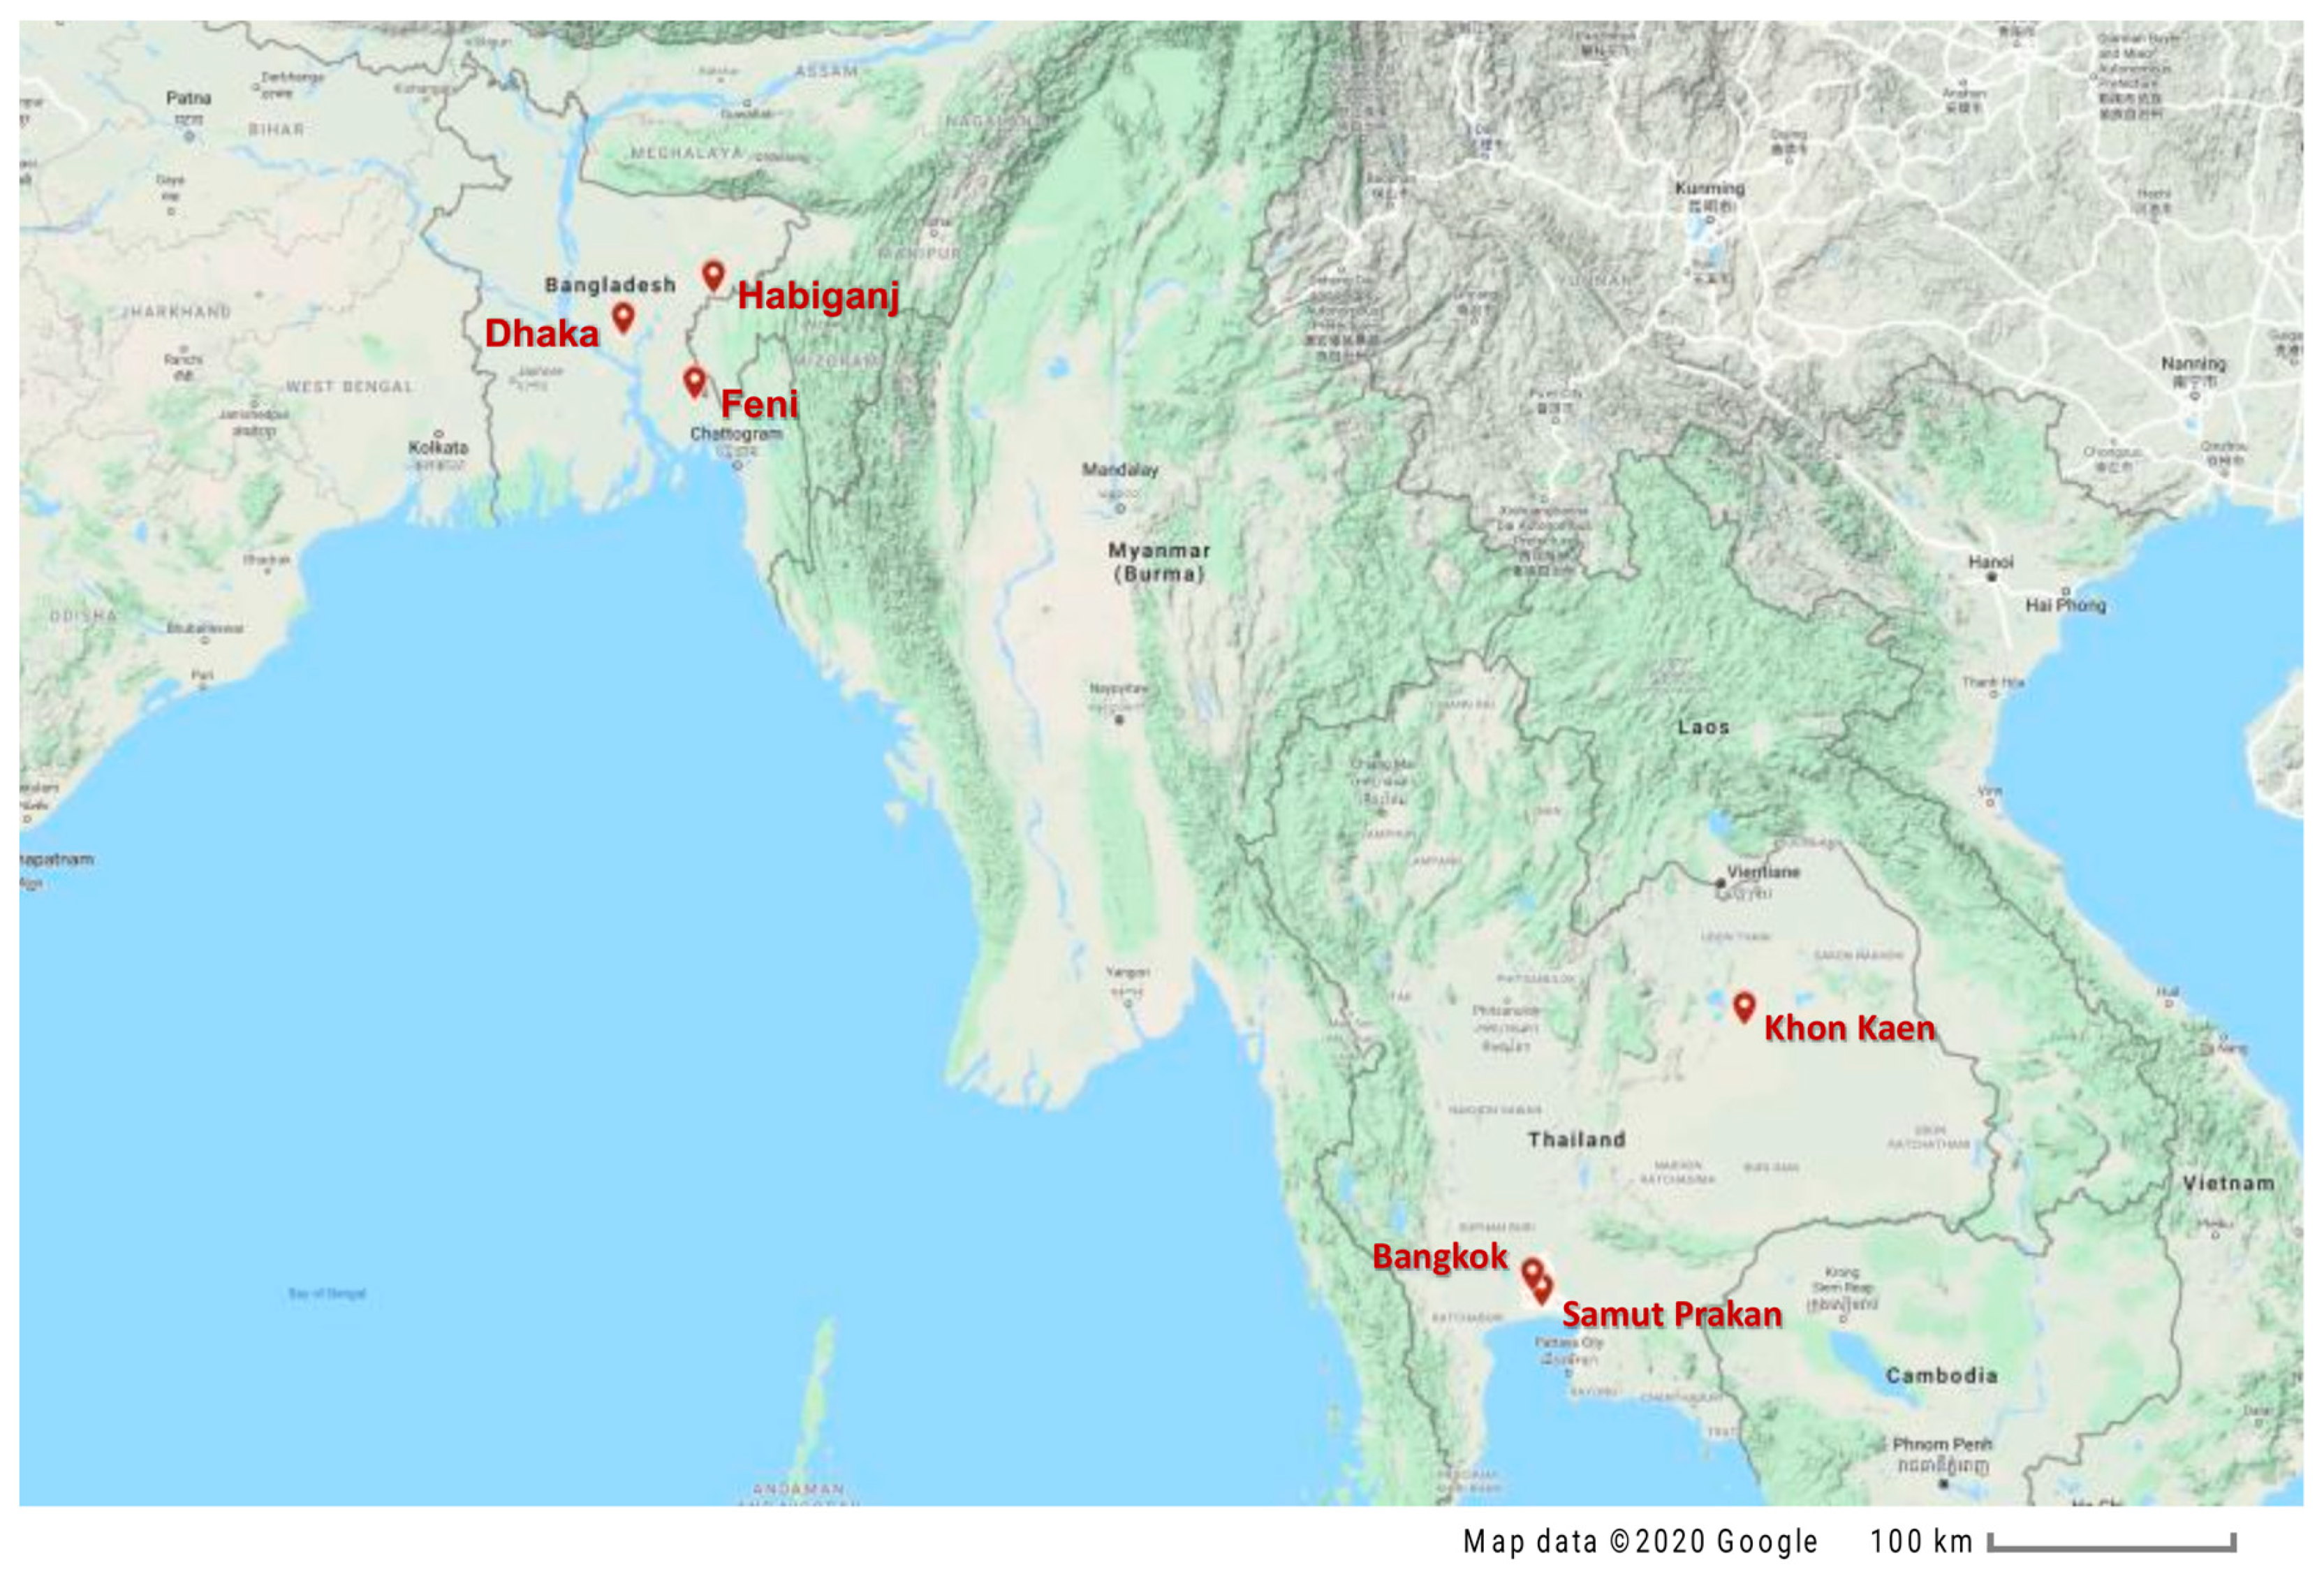
2.1. Specimen Collection

C. versicolor samples were collected from three locations in Bangladesh—Dhaka (23°39′53.0″ N 90°25′15.0″ E), Feni (23°00′13.5″ N 91°16′28.7″ E), and Habiganj (24°07′29.1″ N 91°26′40.5″ E)—and three locations from Thailand—Bangkok (13°41′30.1″ N 100°40′18.8″ E), Samut Prakan (13°40′10.2″ N 100°47′45.6″ E), and Khon Kaen (16°27′59.8″ N 102°50′51.8″ E) (Figure 1).
A total of 49 samples of C. versicolor were captured and sexed (Table 1) by everting hemipenes in males following the method of Harlow [43,44] (samples from Bangladesh) in the field or by dissecting the gonads in the lab (samples from Thailand). Tail snips from the Bangladesh samples were collected in the field using sharp scissors (sterilized between samples using hydrogen peroxide) and immediately transferred to a 5 mL 1x Hanks’ balanced salt solution (Sigma-Aldrich, St Louis, MO, USA), kept at room temperature (~25 °C), and transported to the University of Canberra within 5 days. Lizards from Thailand were collected by local people under the supervision of Tulyawat Prasongmaneerut, and the DNA was extracted from either tail or liver tissues at the Kasetsart University, Thailand and transported to the University of Canberra.

2.2. DNA Extraction and Sequencing

DNA was extracted and used for two different DNA-sequencing approaches: (i) Sanger sequencing for mitochondrial DNA and (ii) DArTseq for the nuclear DNA (SNP and SilicoDArT data). For Sanger sequencing, we randomly selected three individuals from each of the sampling locations—Dhaka (BD_DHK), Feni (BD_FEN), and Habiganj (BD_HBJ) from Bangladesh and Bangkok, Samut Prakan, and Khon Kaen from Thailand (TL_CAV). DNA was extracted from Bangladeshi samples using the DNeasy Blood & Tissue Kit (Qiagen, Hilden, Germany) following manufacturer’s instructions and from Thailand samples following the methods of Srikulnath et al. [45]. The concentrations were measured using a NanoDrop™ One Microvolume UV–Vis Spectrophotometer (Thermo Fisher, Waltham, MA, USA). DNA samples from C. versicolor were sequenced by Diversity Arrays Technology (DArTseq™) following their standard protocol.
A region of the mitochondrial genome spanning tRNATrp, the ND2 gene, and the COI gene was targeted, and all samples were amplified and sequenced with primers designed by Huang et al. [38], L3705 and H5162, which were synthesized by Integrated DNA Technologies, Inc. (IDT, Singapore). Standard polymerase chain reactions (PCR) were performed in 25 μL reactions, including approximately 1 μL of template DNA (25 ng/μL), 1 μL of each primer (10 pmol/μL), 12.5 μL of MyTaq™ HS Red Mix, 2x (Bioline, Memphis, TN, USA), and 9.5 μL of nucleus-free water (Ambion, Austin, TX, USA). PCR was conducted following the conditions set by Huang et al. [38] as an initial denaturing step at 95 °C for 4 min, 35 cycles of denaturing at 94 °C for 35 s, annealing at 65 °C for 45 s with an extension at 72 °C for 90 s, and a final extension step at 72 °C for 8 min. The PCR products were electrophoresed in 0.8% agarose gels and visualized with SYBR® Safe DNA gel stain (Invitrogen, Eugene, OR, USA). The PCR products (amplicons) were purified with the PureLink™ PCR Purification Kit (Invitrogen, Carlsbad, CA, USA) and sequenced at the ACRF Biomolecular Resource Facility (BRF) of the Australian National University using the corresponding PCR primers.

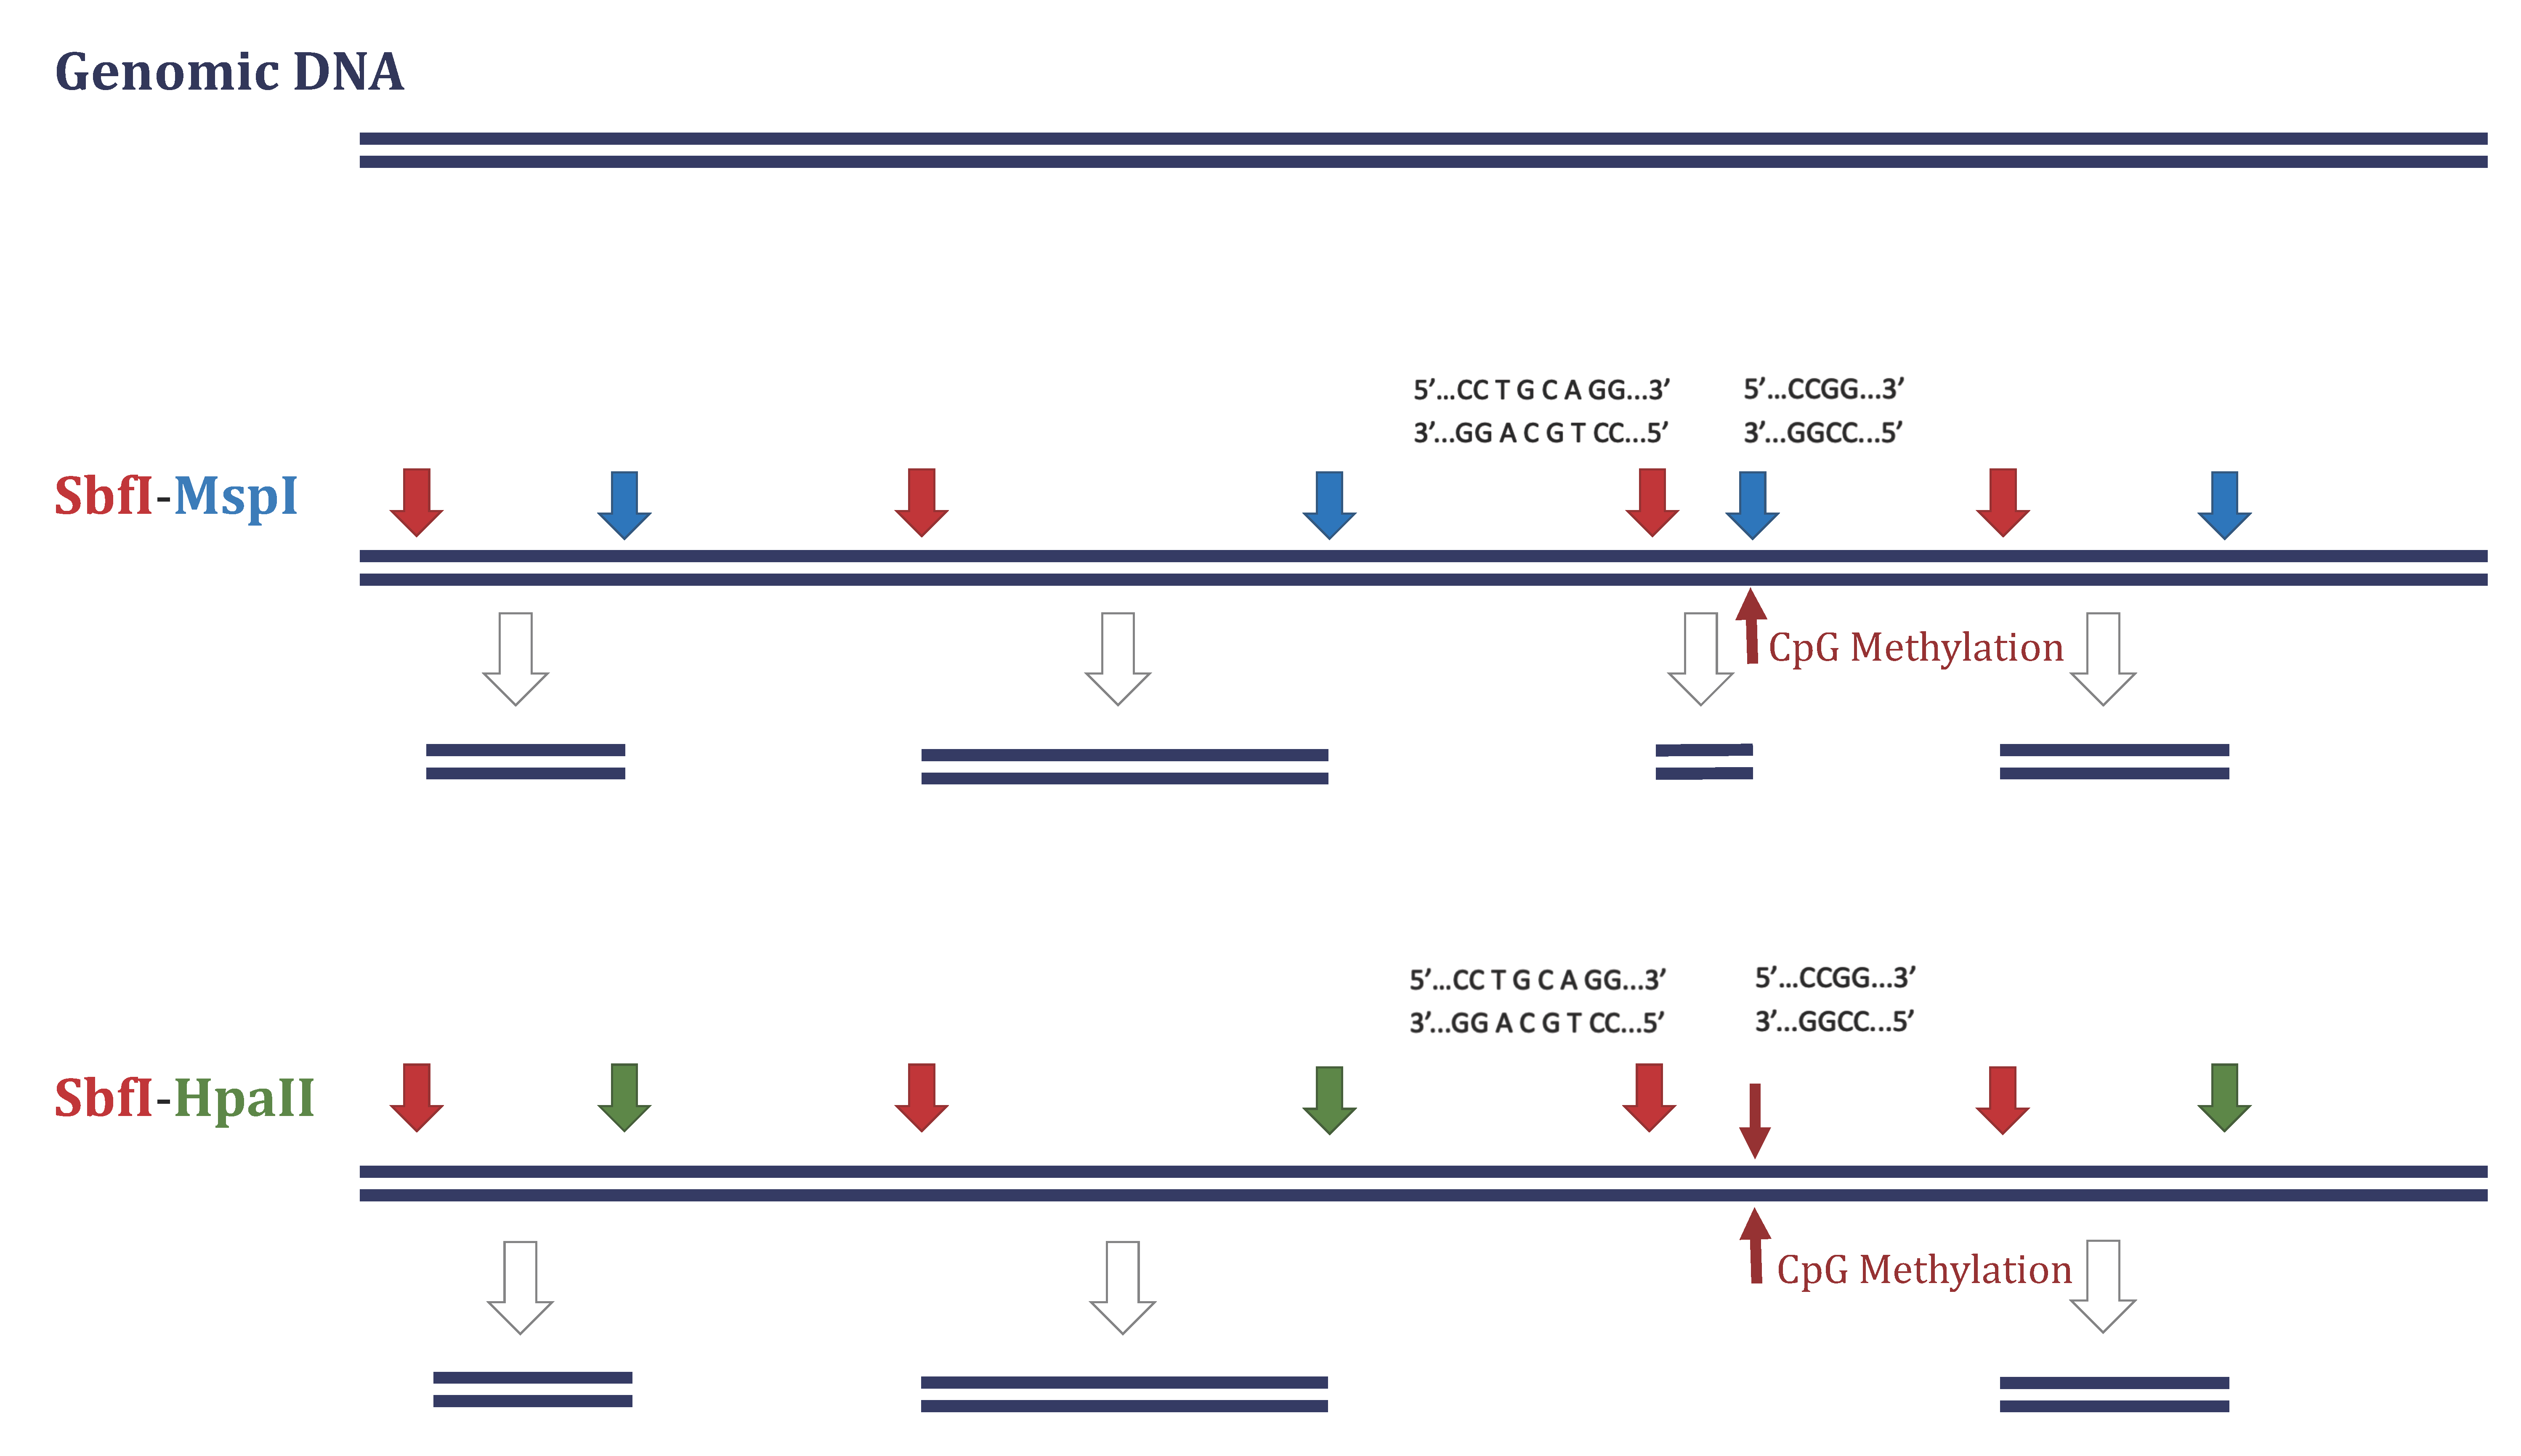
2.3. DArTseqMet—Methylation Analysis

Diversity Arrays Technology has developed a dedicated methylation analysis (DArTseqMet) using the DArTseqTM platform (Figure 2). Informative silicoDArT presence–absence markers were used to genotype individuals using this DArTseqMet method. In this study, for silicoDArT presence–absence markers, two complexity-reduction methods were created for each sample. Both methods used the same ‘rare cutting’ restriction enzyme, while two isoschizomer restriction enzymes that differed in sensitivity to cytosine methylation were used as ‘frequent cutting’ enzymes for the DArTseqMet.
Diversity Arrays Technology has a pool of known restriction enzyme combinations, and multiple combinations, chosen based on their previous usages on related species, were used for the initial study. Later, only the combinations that yielded the maximum number of loci were selected. Single nucleotide polymorphism (SNP) data were obtained using the conventional DArTseq method and genotyping by sequencing performed by DArTseq™ using a combination of DArT complexity-reduction methods and next-generation sequencing following protocols described by Kilian et al. [46] and Lambert et al. [10]. For SNP data, a PstI (rare cutter with recognition sequence 5′-CTGCA|G-3–HpaII (frequent cutter with recognition sequence 5′-C|CGG-3′) combination was used.
In contrast to the conventional DArTSeq analysis, two different rare cutting restriction enzymes were used for DArTseqMet SilicoDArT data; these were (1) SbfI (recognition sequence 5′-CCTGCA|GG-3′) and (2) PstI (recognition sequence 5′-CTGCA|G-3′). The primary goal here was to develop a series of sex-linked markers in C. versicolor and infer their sex-determination modes based on sex bias within these markers. The two different restriction enzymes (isoschizomers; as frequent cutters) that recognized the same sequence (5′-C|CGG-3′) were (1) HpaII as CpG methylation-sensitive and (2) MspI as CpG methylation-insensitive. A comparison of the sequence composition of the two resulting representations (libraries) revealed differences in methylation patterns across the genome and had the potential to reveal any methylation-mediated sex determination (Figure 2). As a result, the data (presence/absence of restriction fragments in representation, i.e., PA markers) were obtained from four different treatments with four restriction enzyme combinations as (1) SbfI–HpaII, (2) SbfI–MspI, (3) PstI–HpaII, and (4) PstI–MspI. Sex-linked markers were identified and analyzed using MS ‘Excel’ [32] and ‘R’ packages rdist and ggplot2.
Out of 49 samples, a total of 45 (23 males and 22 females) were used for data analysis (for sex-linked markers) using both SNP and SilicoDArT data (Table 1).

2.4. Population and Phylogenetic Analyses

Both nuclear (DArTseq—SNP) and mitochondrial DNA (Sanger sequencing) data were used for population genetic analyses. For all analyses, we filtered the total 65,652 SNP sites identified by DArTseq based on (i) call rate by locus (the proportion of samples of which genotype call was certain; at least 80%, i.e., 0.8–1.0) and (ii) RepAvg (the proportion of technical replicate assay pairs for which the marker score was consistent; at least 95%, i.e., 0.95–1.0). The genetic dissimilarity of individuals and populations was visualized using PCoA (principal coordinate analysis) with the R package dartR [47]. Population differentiation was calculated using the R package hierfstat and StAMPP (pair-wise Fst values). We also calculated the fixed differences (i.e., counts of loci for which all alleles are in one state in one population and in the other state in the other population [48,49]) using R packages dartR, reshape, and adegenet. Isolation by distance was assessed using Mantel’s test in the R package dartR.
Data obtained from Sanger sequencing were edited and aligned, and consensus sequences were created using BioEdit software (version 7.2.5). We also used BLAST (Basic Local Alignment Search Tool) for the consensus sequences (NCBI BLASTN 2.10.0+) and downloaded top hit sequences (threshold E-value: 0.0) from GenBank to construct maximum likelihood (1000 bootstraps) and Bayesian (1,100,000 iterations) gene trees using the PHYML and MrBayes plugins of Geneious Prime (version 2020.2.3) software with default parameters, respectively. HKY85 was chosen as the substitution model determined using MEGA version 10.1.8. After careful visual checking (peaks in the chromatogram), each sequence was further edited and aligned, and phylogenetic trees were constructed while only considering the region of the ND2 gene together with sequences from Chamaeleo chamaeleon (1013 bp; NCBI accession number EF222202.1) and Uromastyx ornata (1013 bp; NCBI accession number AB113822.1) as outgroups of the family Agamidae and subfamily Draconinae, respectively. We also used a second C. versicolor sequence (1013 bp; NCBI accession number KC875647.1) from Hainan Province, China, for this analysis because we applied the sequencing primers from [38]. However, our first hit sequence (1013 bp; NCBI accession number DQ289476.1) was from a study in Myanmar [37]. Therefore, we were able to cover a wider range of C. versicolor, including those from Bangladesh (this study), Myanmar, Thailand (this study), and China.

2.5. Sex-Linked Marker Analysis
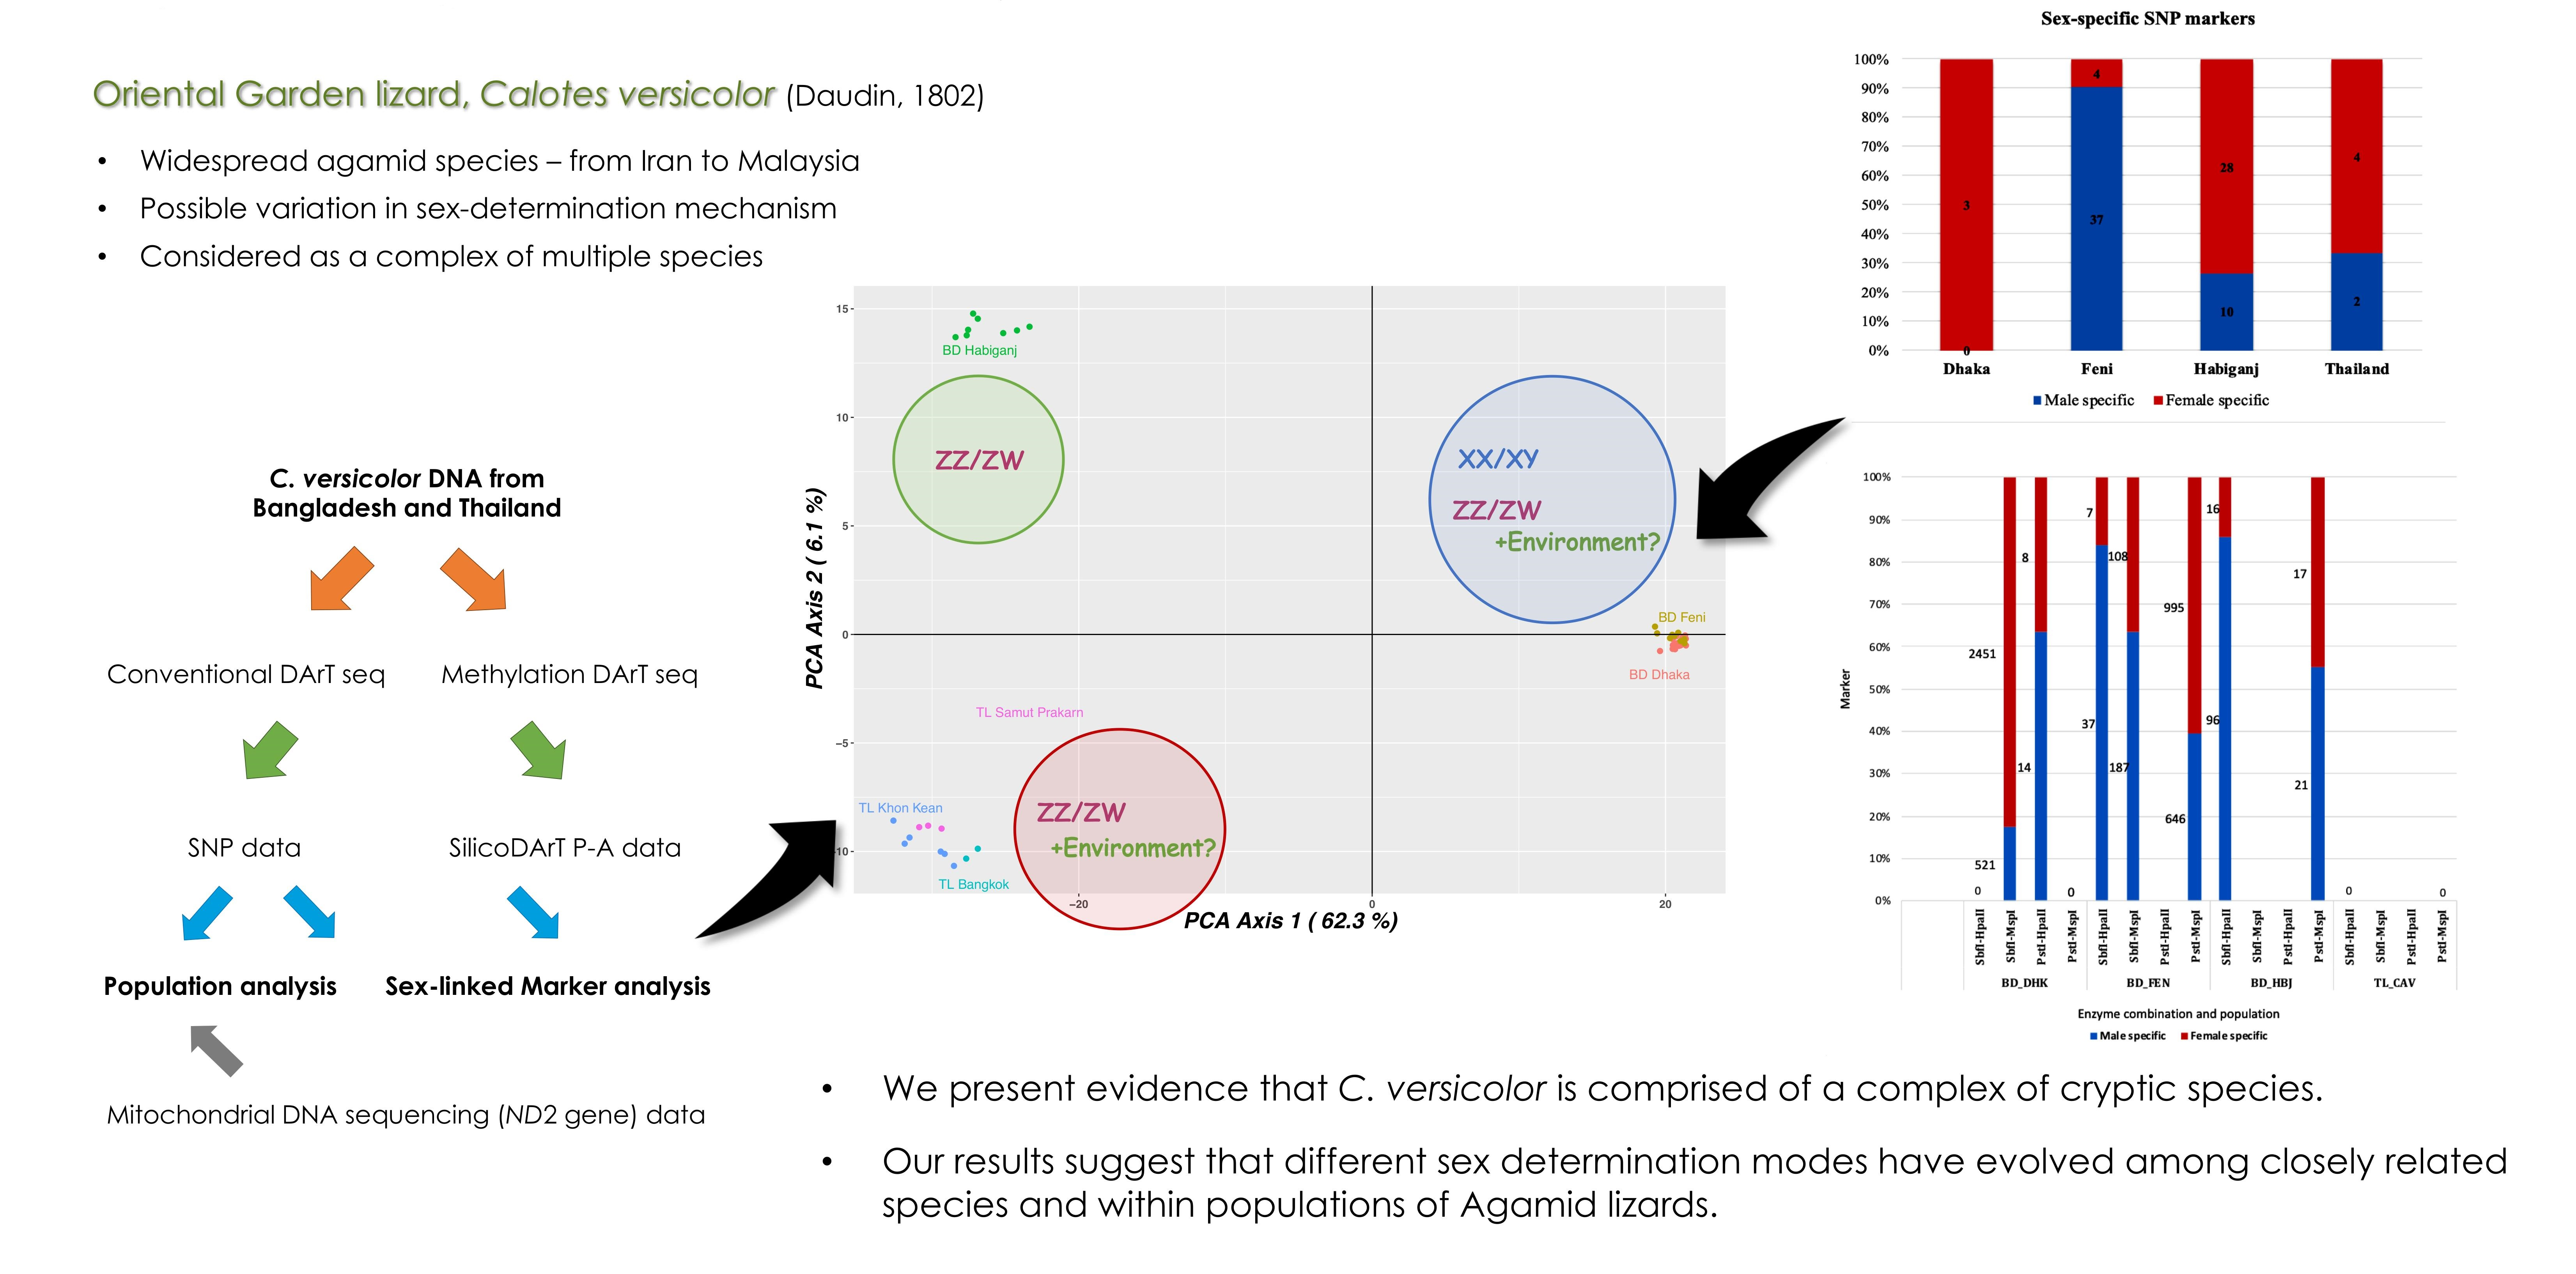
We identified sex-linked SNPs and silicoDArT (presence–absence; PA) loci independently for each population. Following criteria set by Lambert et al. [10] with modifications. For the sex-linked markers, we filtered the total 65,652 SNP and 741,396 PA sites identified by DArTseq based on (i) call rate by locus (at least 80%, i.e., 0.8–1.0 and recalculated for each population) (for SNP and PA markers), (ii) average read depth (the sum of the tag read counts for all samples divided by the number of samples with non-zero tag read counts; ≥10) (for PA markers), and (iii) reproducibility/RepAvg (at least 90%, i.e., 0.9–1.0) (for SNP and PA markers).
The initial screening of candidate sex-linked markers was performed by filtering loci that met the criteria for ZZ/ZW or XX/XY systems. For a ZZ/ZW system, at least one condition of loci with female heterozygosity above 75% and male heterozygosity less than 20%, male reference allele homozygosity of more than 80% and female reference allele homozygosity of less than 10%, or male SNP allele homozygosity of no more than 10% and female SNP allele homozygosity of more than 90% had to be met for the particular loci to be considered as a sex-linked marker. For an XX/XY system, we used the same criteria but with opposite proportions.
Previous studies have identified that at least 13–15 individuals per sex are required to minimize the occurrences of false-positive sex-linked loci provided that the loci are not in linkage disequilibrium [10,30,50]. Since our sample sizes were small (4–9 per sex per population for SNP and 1–8 for PA marker analysis), we only considered loci that were perfectly sex-linked, especially for silicoDArT PA data. Spurious sex association is more likely when the sample size is small, so we used the formula Pi = 0.5n [10], where Pi is the probability that any locus is sex-linked by chance and n is the sample size (male and female together). Pi was multiplied by the number of SNP/PA markers (remaining after filtering), which gave an estimation of the number of random sex-linked loci produced through analysis.

3. Results

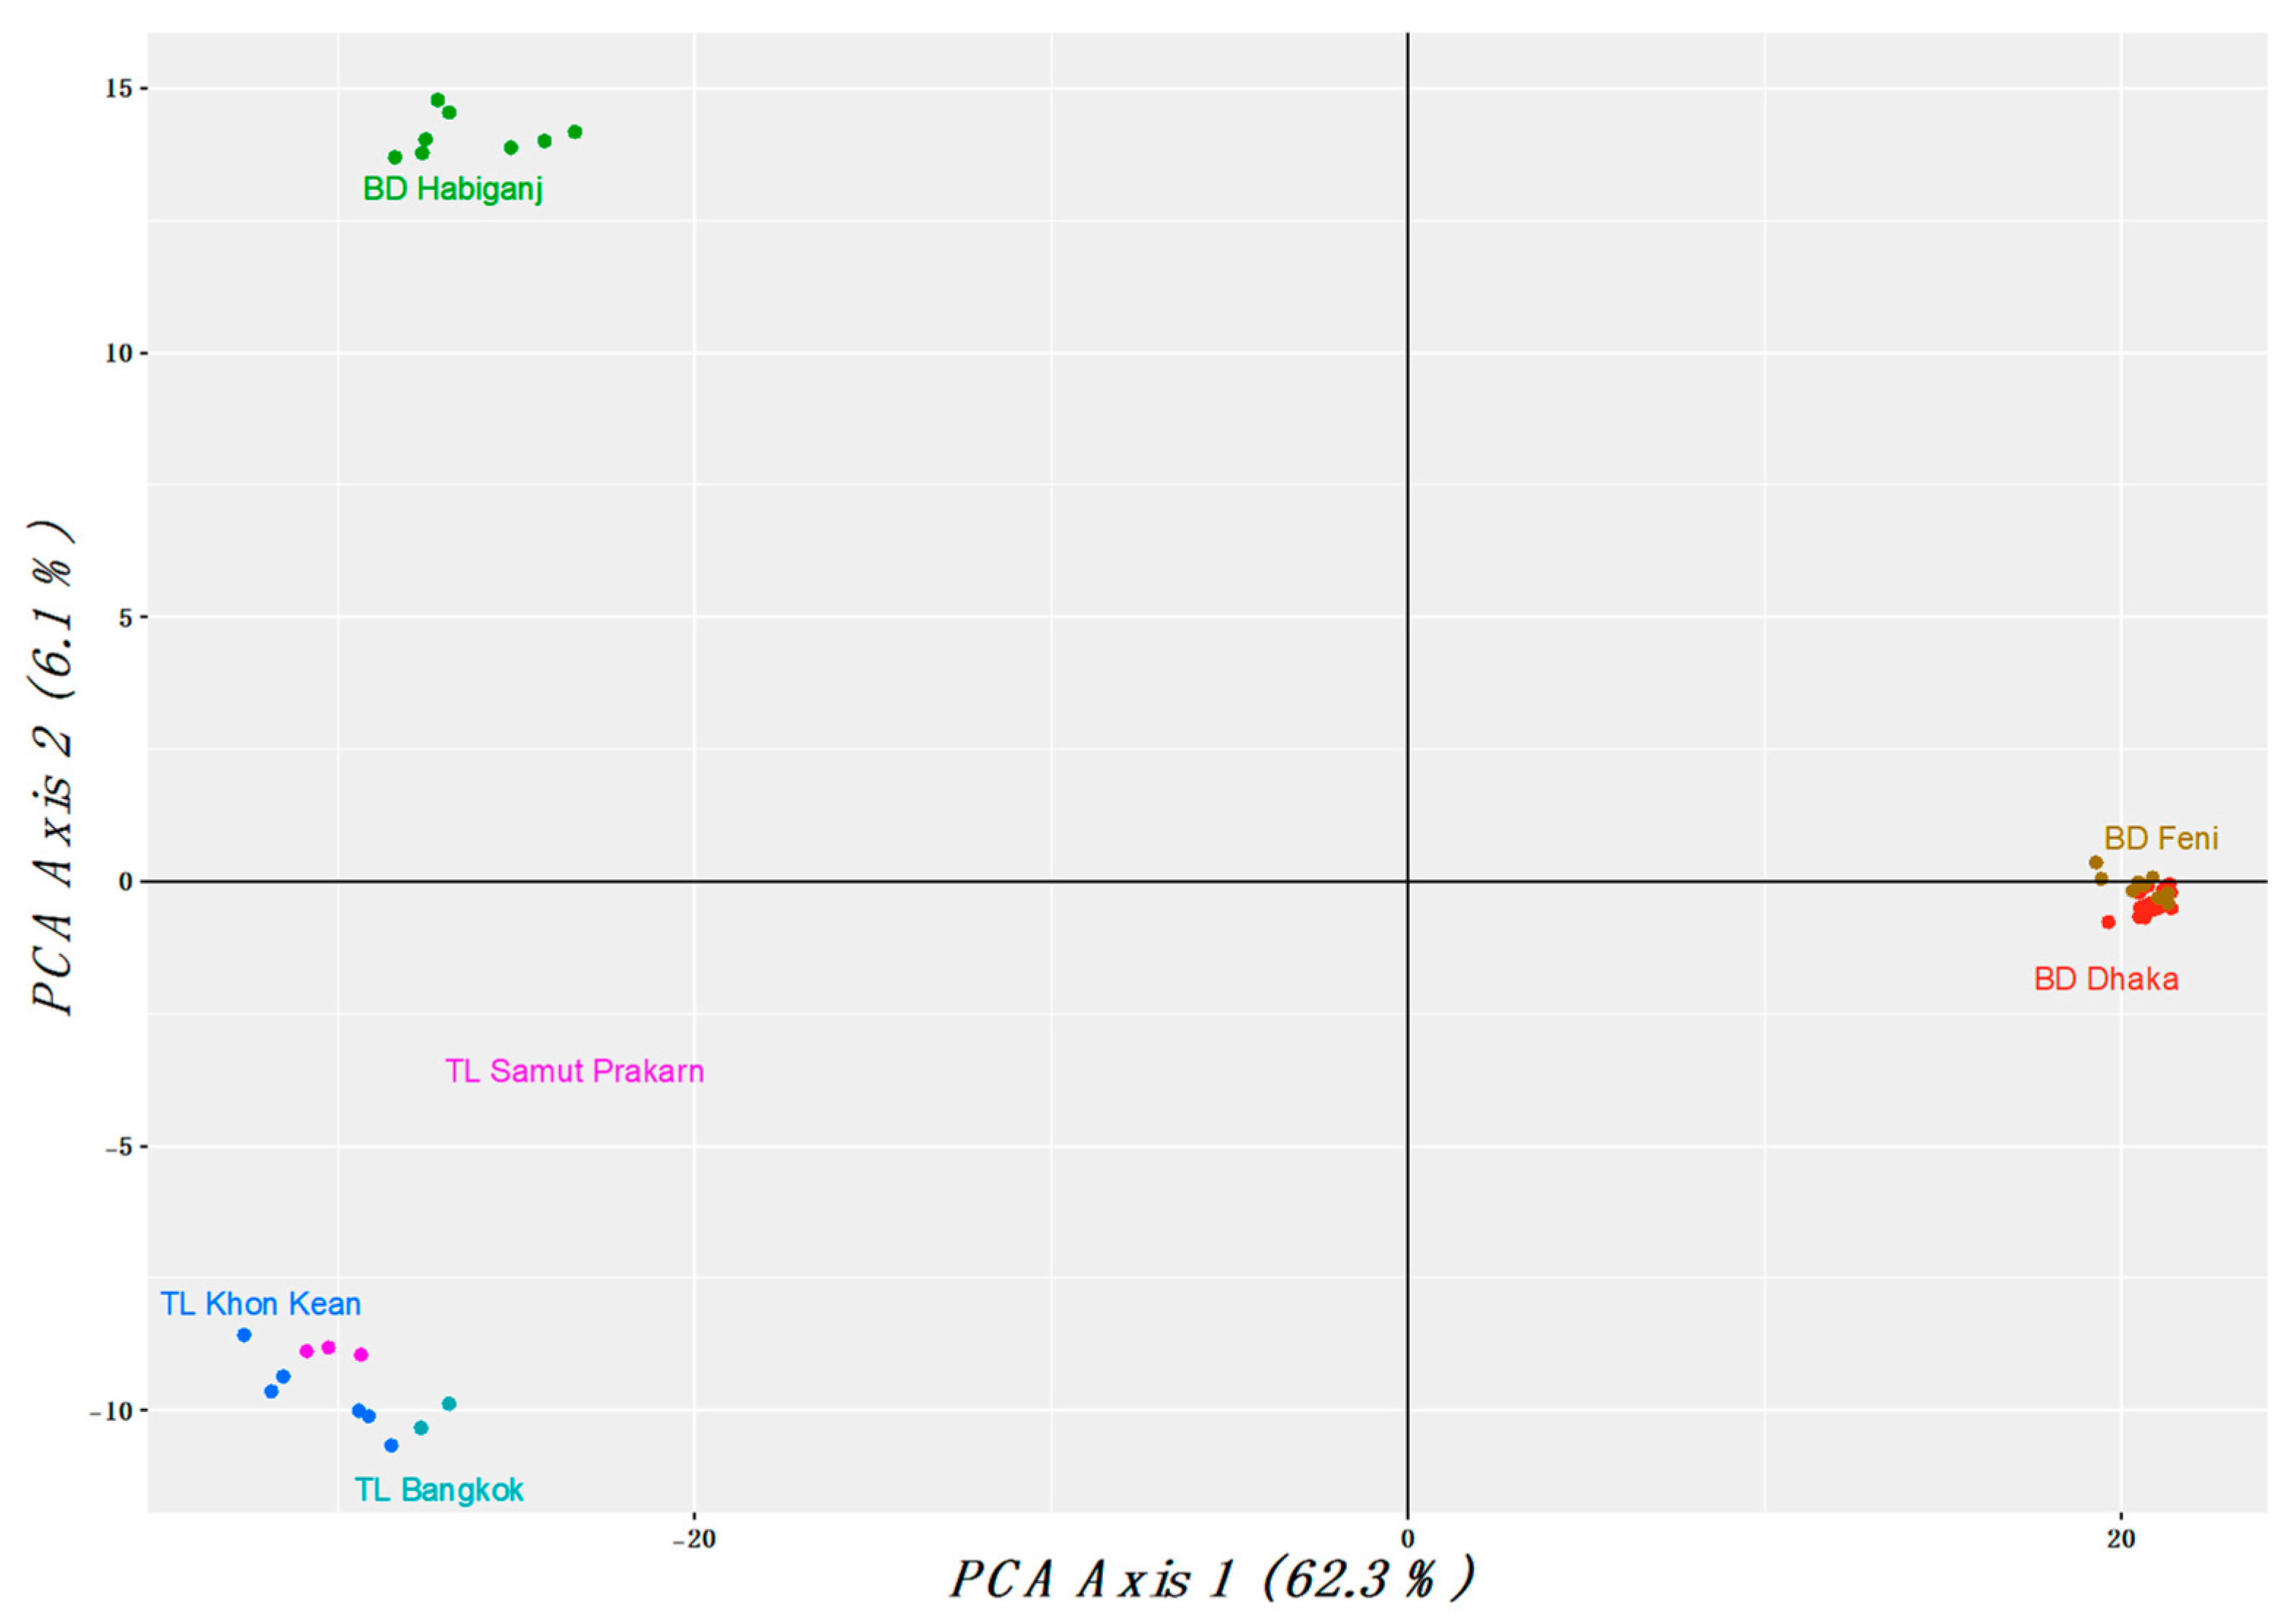
3.1. Population Analysis with DArTseq Results

The PCoA plot revealed three distinctive clusters within the sampled populations of C. versicolor: (1) Dhaka and Feni samples together, (2) Habiganj samples, and (3) Thailand samples together (Figure 3). Most of the variation is represented in axis 1 (62.3%), while axis 2 represents lower variation (6.1%).
Pairwise genetic differentiation (Fst) between pairs of sites ranged between 0.2 and 0.86 (Table 2). Genetic structures based on different localities in Thailand showed low differences, with Fst ranging between 0.09 and 0.22. By contrast, and in line with the level of differentiation suggested by the PCoA, Fst values were extremely high among the Bangladesh localities. Genetic structure based on different localities in Bangladesh showed low significant differences between Dhaka and Feni, with an Fst value of 0.21, to highly significant differences between Dhaka and Habiganj and between Feni and Habiganj, with Fst values of 0.81 and 0.84, respectively.
An analysis of fixed differences confirmed the diagnosability (significant number of fixed differences) of each of the six clades as Dhaka, Feni, and Habiganj from Bangladesh and Bangkok, Khon Kaen, and Samut Prakan from Thailand. Fixed difference refers to the number of loci where the populations share no alleles at that locus [48]. Lower fixed differences between populations indicate recent divergence or higher gene flow, and higher fixed differences indicate periods of long isolation and lack of gene flow. The divergences in pairwise comparisons ranged from 338 to 13,900 fixed differences between the clades (Table 3). Among the Bangladesh samples, the divergence of populations ranged from 652 to 13,900 fixed differences. Dhaka samples differed from Feni samples by 652 fixed differences and from Habiganj by 13,895 fixed differences. Feni and Habiganj samples differed by 13,900 fixed differences. However, among the Thailand samples, the divergence of populations was comparatively lower, ranging from 338 to 439 fixed differences. Between the Bangladesh and Thailand samples, the divergence of populations ranged from 1544 to 12,753 fixed differences. The lowest fixed difference was observed between Habiganj and Bangkok with 1544 loci, and the highest was between Dhaka and Khon Kaen with 12,753 loci.

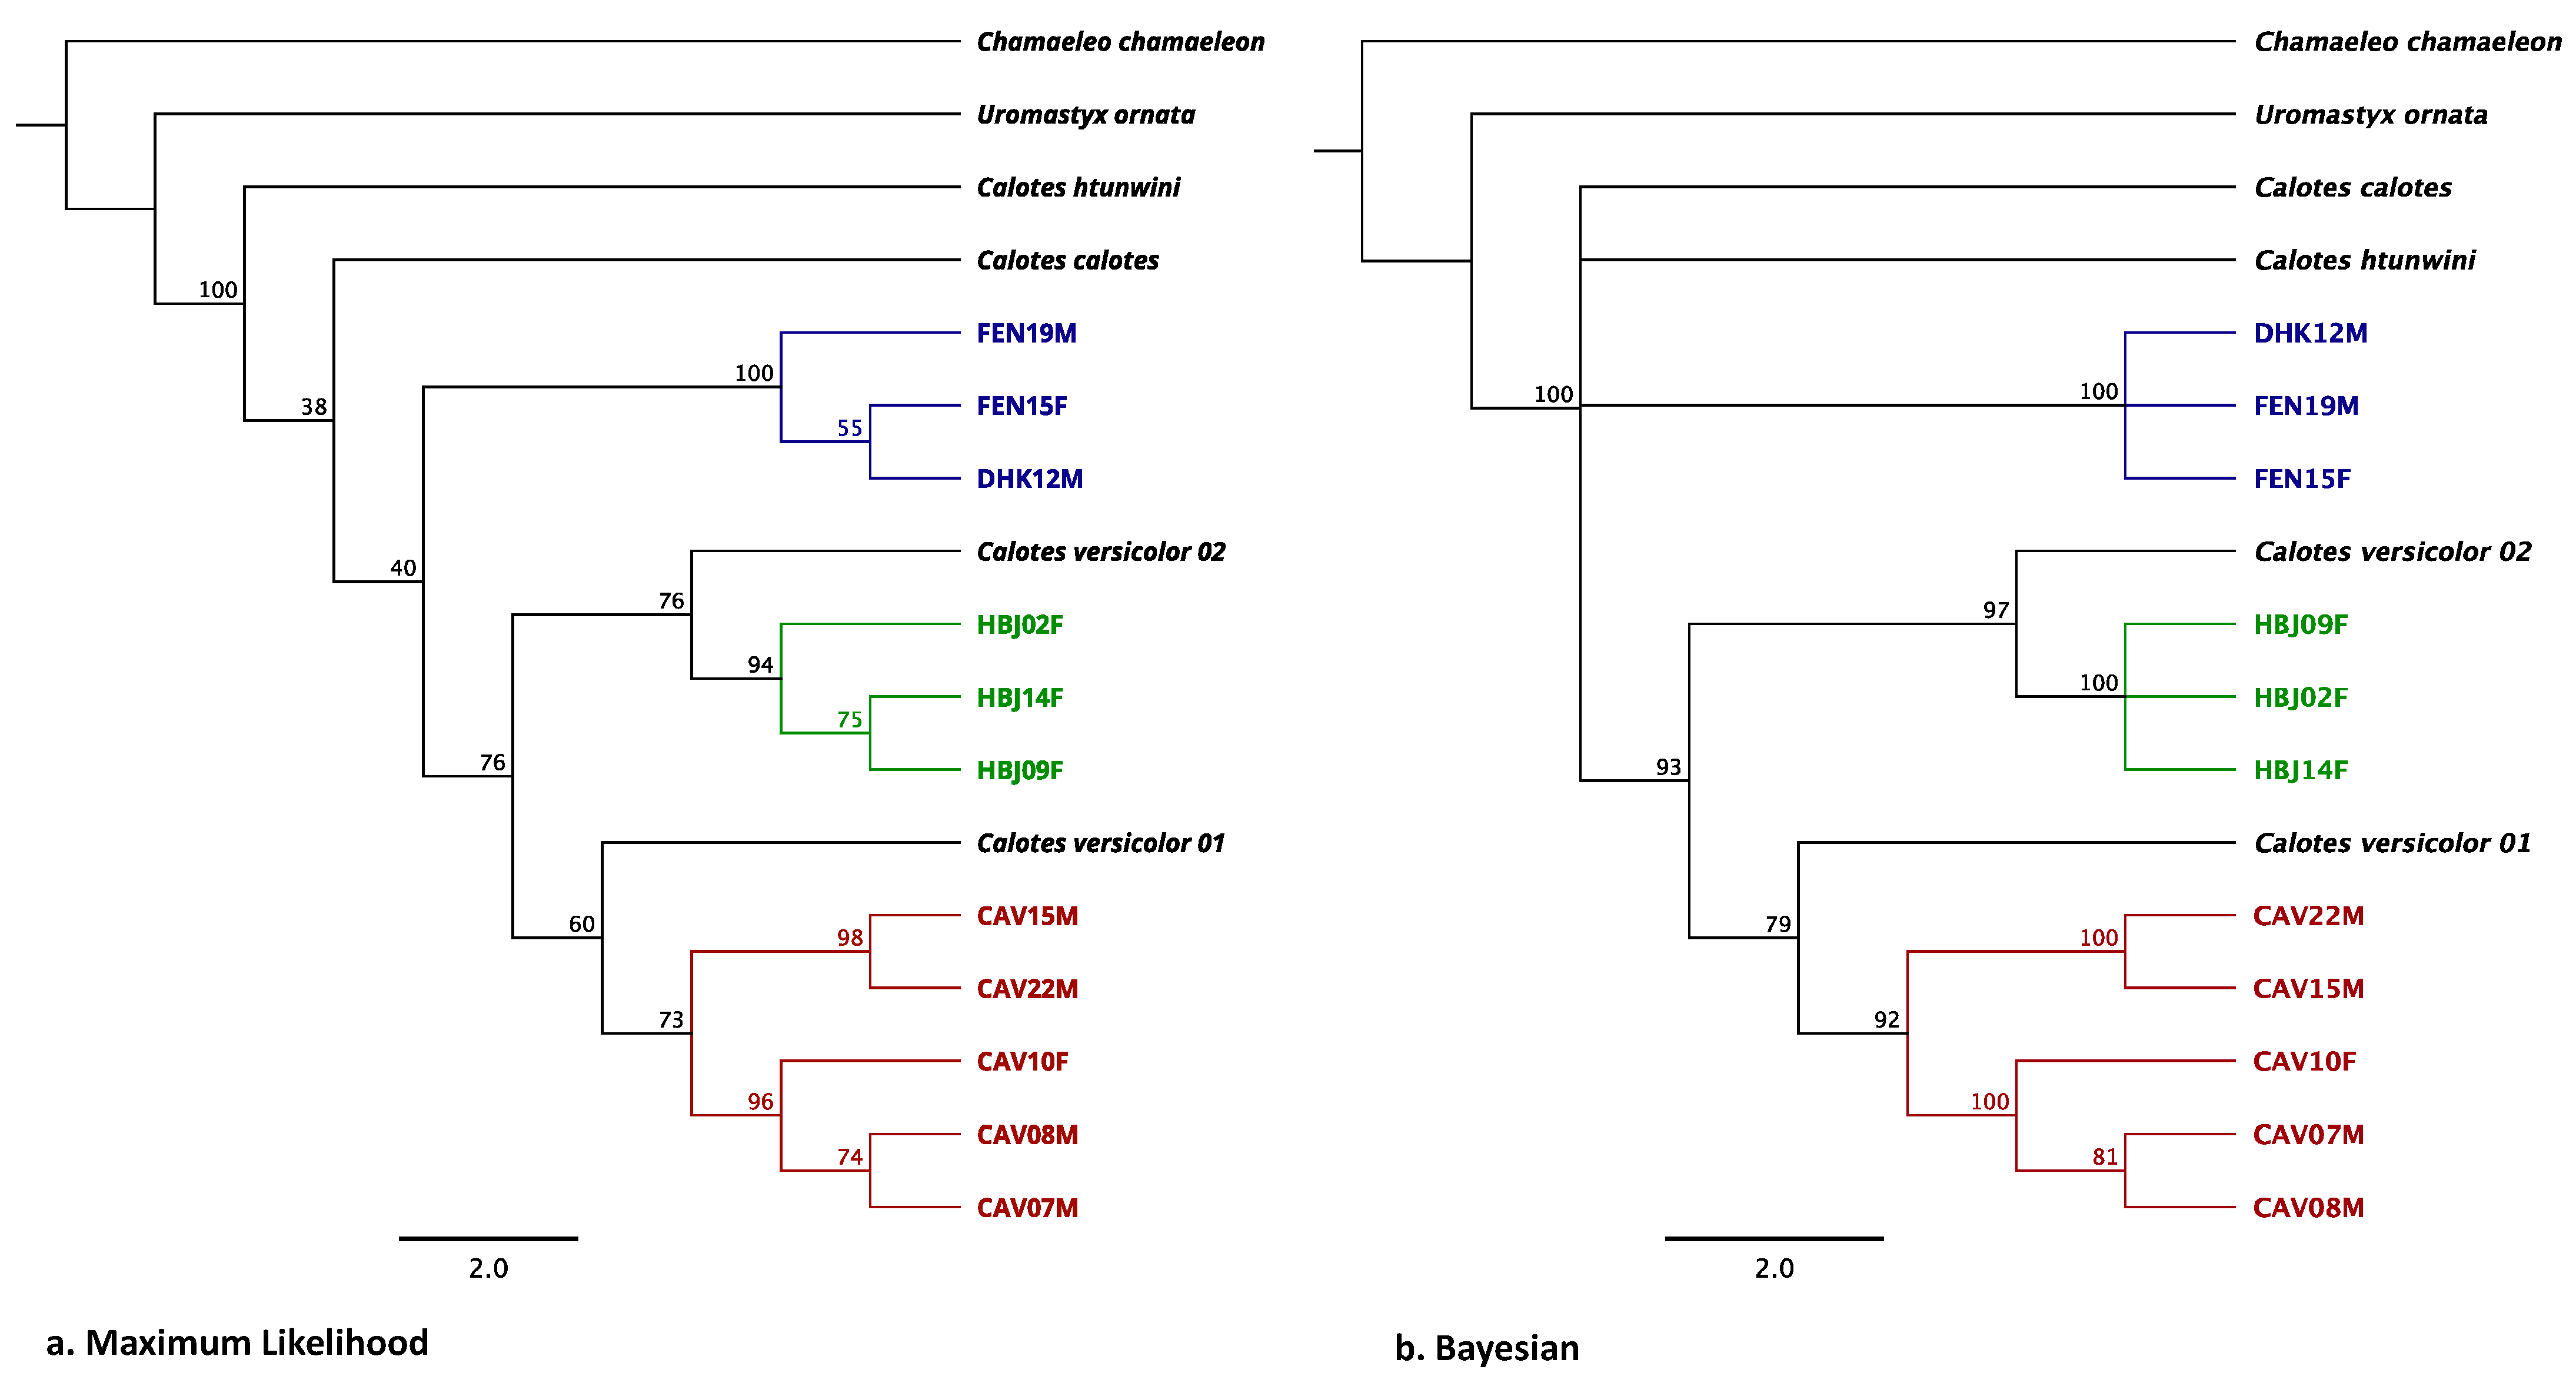
3.2. Phylogenetic Analysis with Sanger Sequencing Results

As found by Huang et al., we expected the overall region of the mitochondrial DNA sequenced to be 2663 bp in total, spanning tRNATrp, ND2, and COI for each of the C. versicolor samples [38]. However, our consensus sequences were found to be much shorter, instead ranging between 882 and 1377 bp long. The BLASTN of these consensus sequences resulted in hits of Dhaka (BD_DHK) and Feni (BD_FEN) samples with Calotes calotes, Calotes htunwini, and C. versicolor, while sequences from Habiganj (BD_HBJ) and Thailand (TL_CAV) only had hits with C. versicolor sequences (Table 4). We could not amplify the target amplicon from the Bangkok samples using this method, so only the Samut Prakan and Khon Kaen samples from Thailand were included in the analysis.
We deposited all new sequences in GenBank with accession numbers MW478730–MW478740. The maximum-likelihood and Bayesian dendrograms derived from the consensus sequences are shown in Figure 4. We set thresholds to support a clade, i.e., >70% bootstrap in ML trees and >75% consensus support in Bayesian trees. Based on these, three distinct clades were observed: one from the Thailand TL_CAV samples and two from the Bangladesh samples as Dhaka–Feni (BD_DHK—BD_FEN) and BD_HBJ, respectively. The BD_HBJ and TL_CAV samples shared a common root within the clade that included different C. versicolor populations. By contrast, the BD_DHK and BD_FEN samples from Bangladesh fell within the clade with a common root from C. calotes (Figure 4). This indicated that C. versicolor samples comprised three genetically distinct clades with the possibility of two distinct species under the genus Calotes.

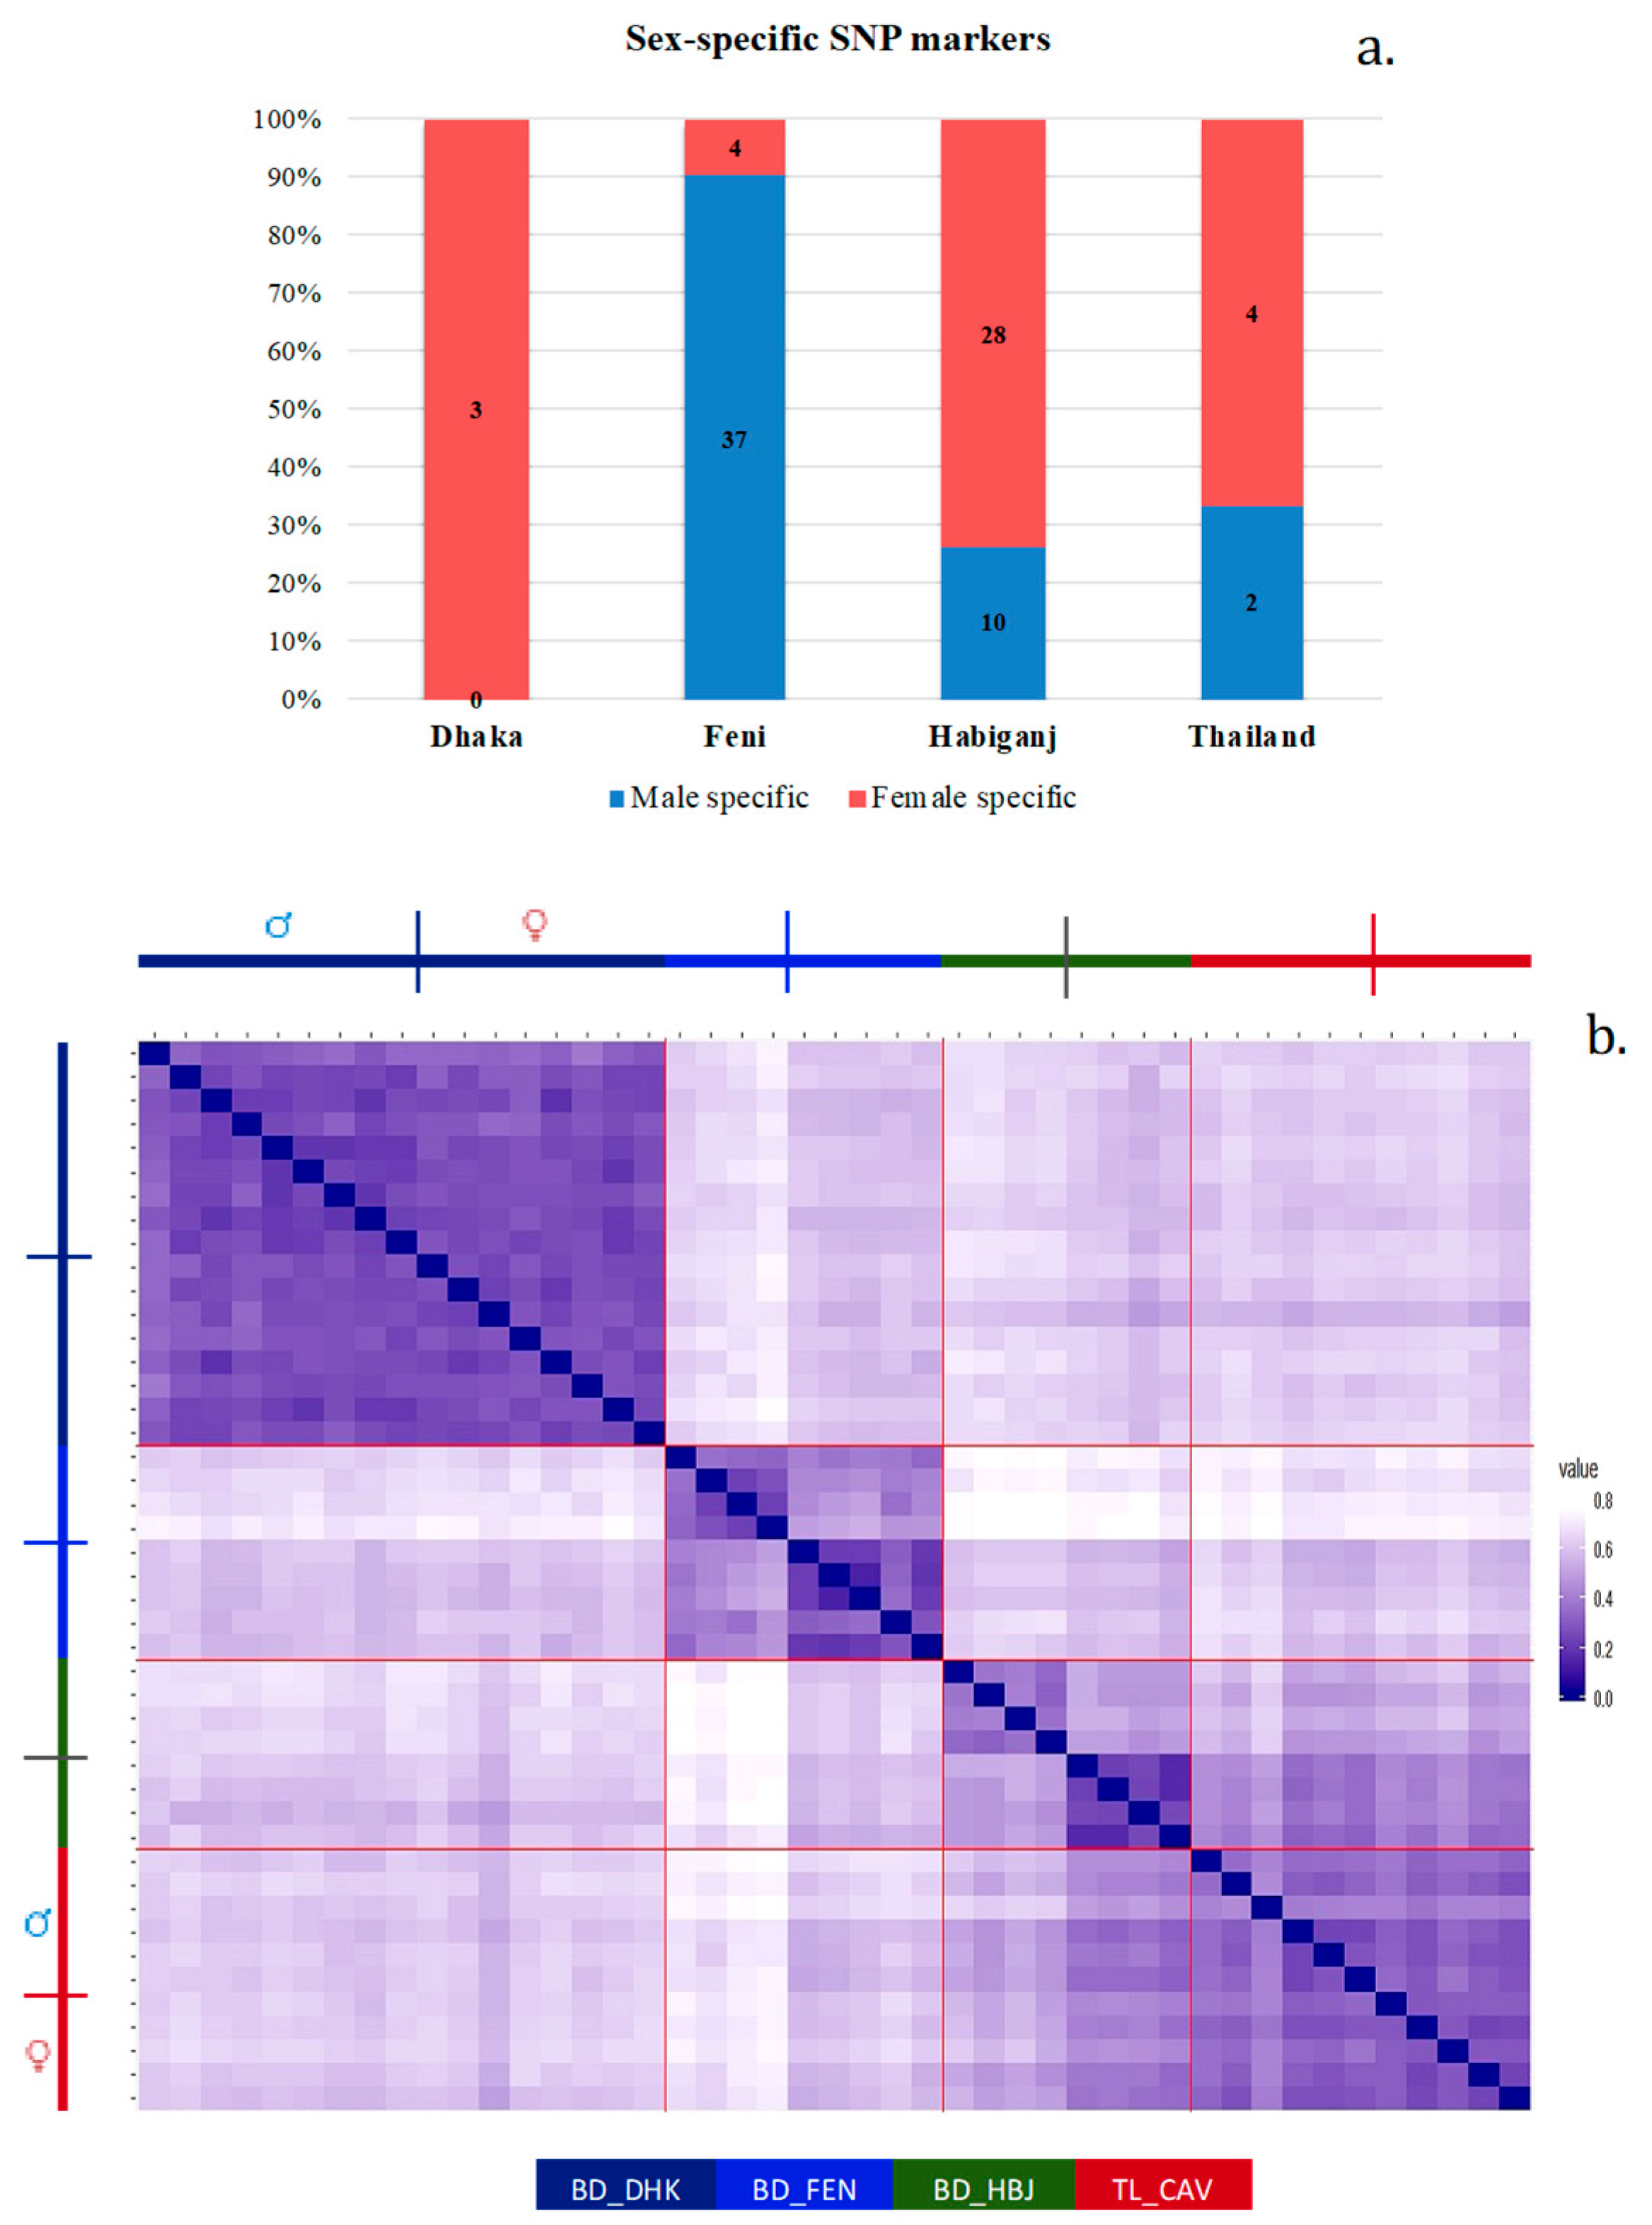
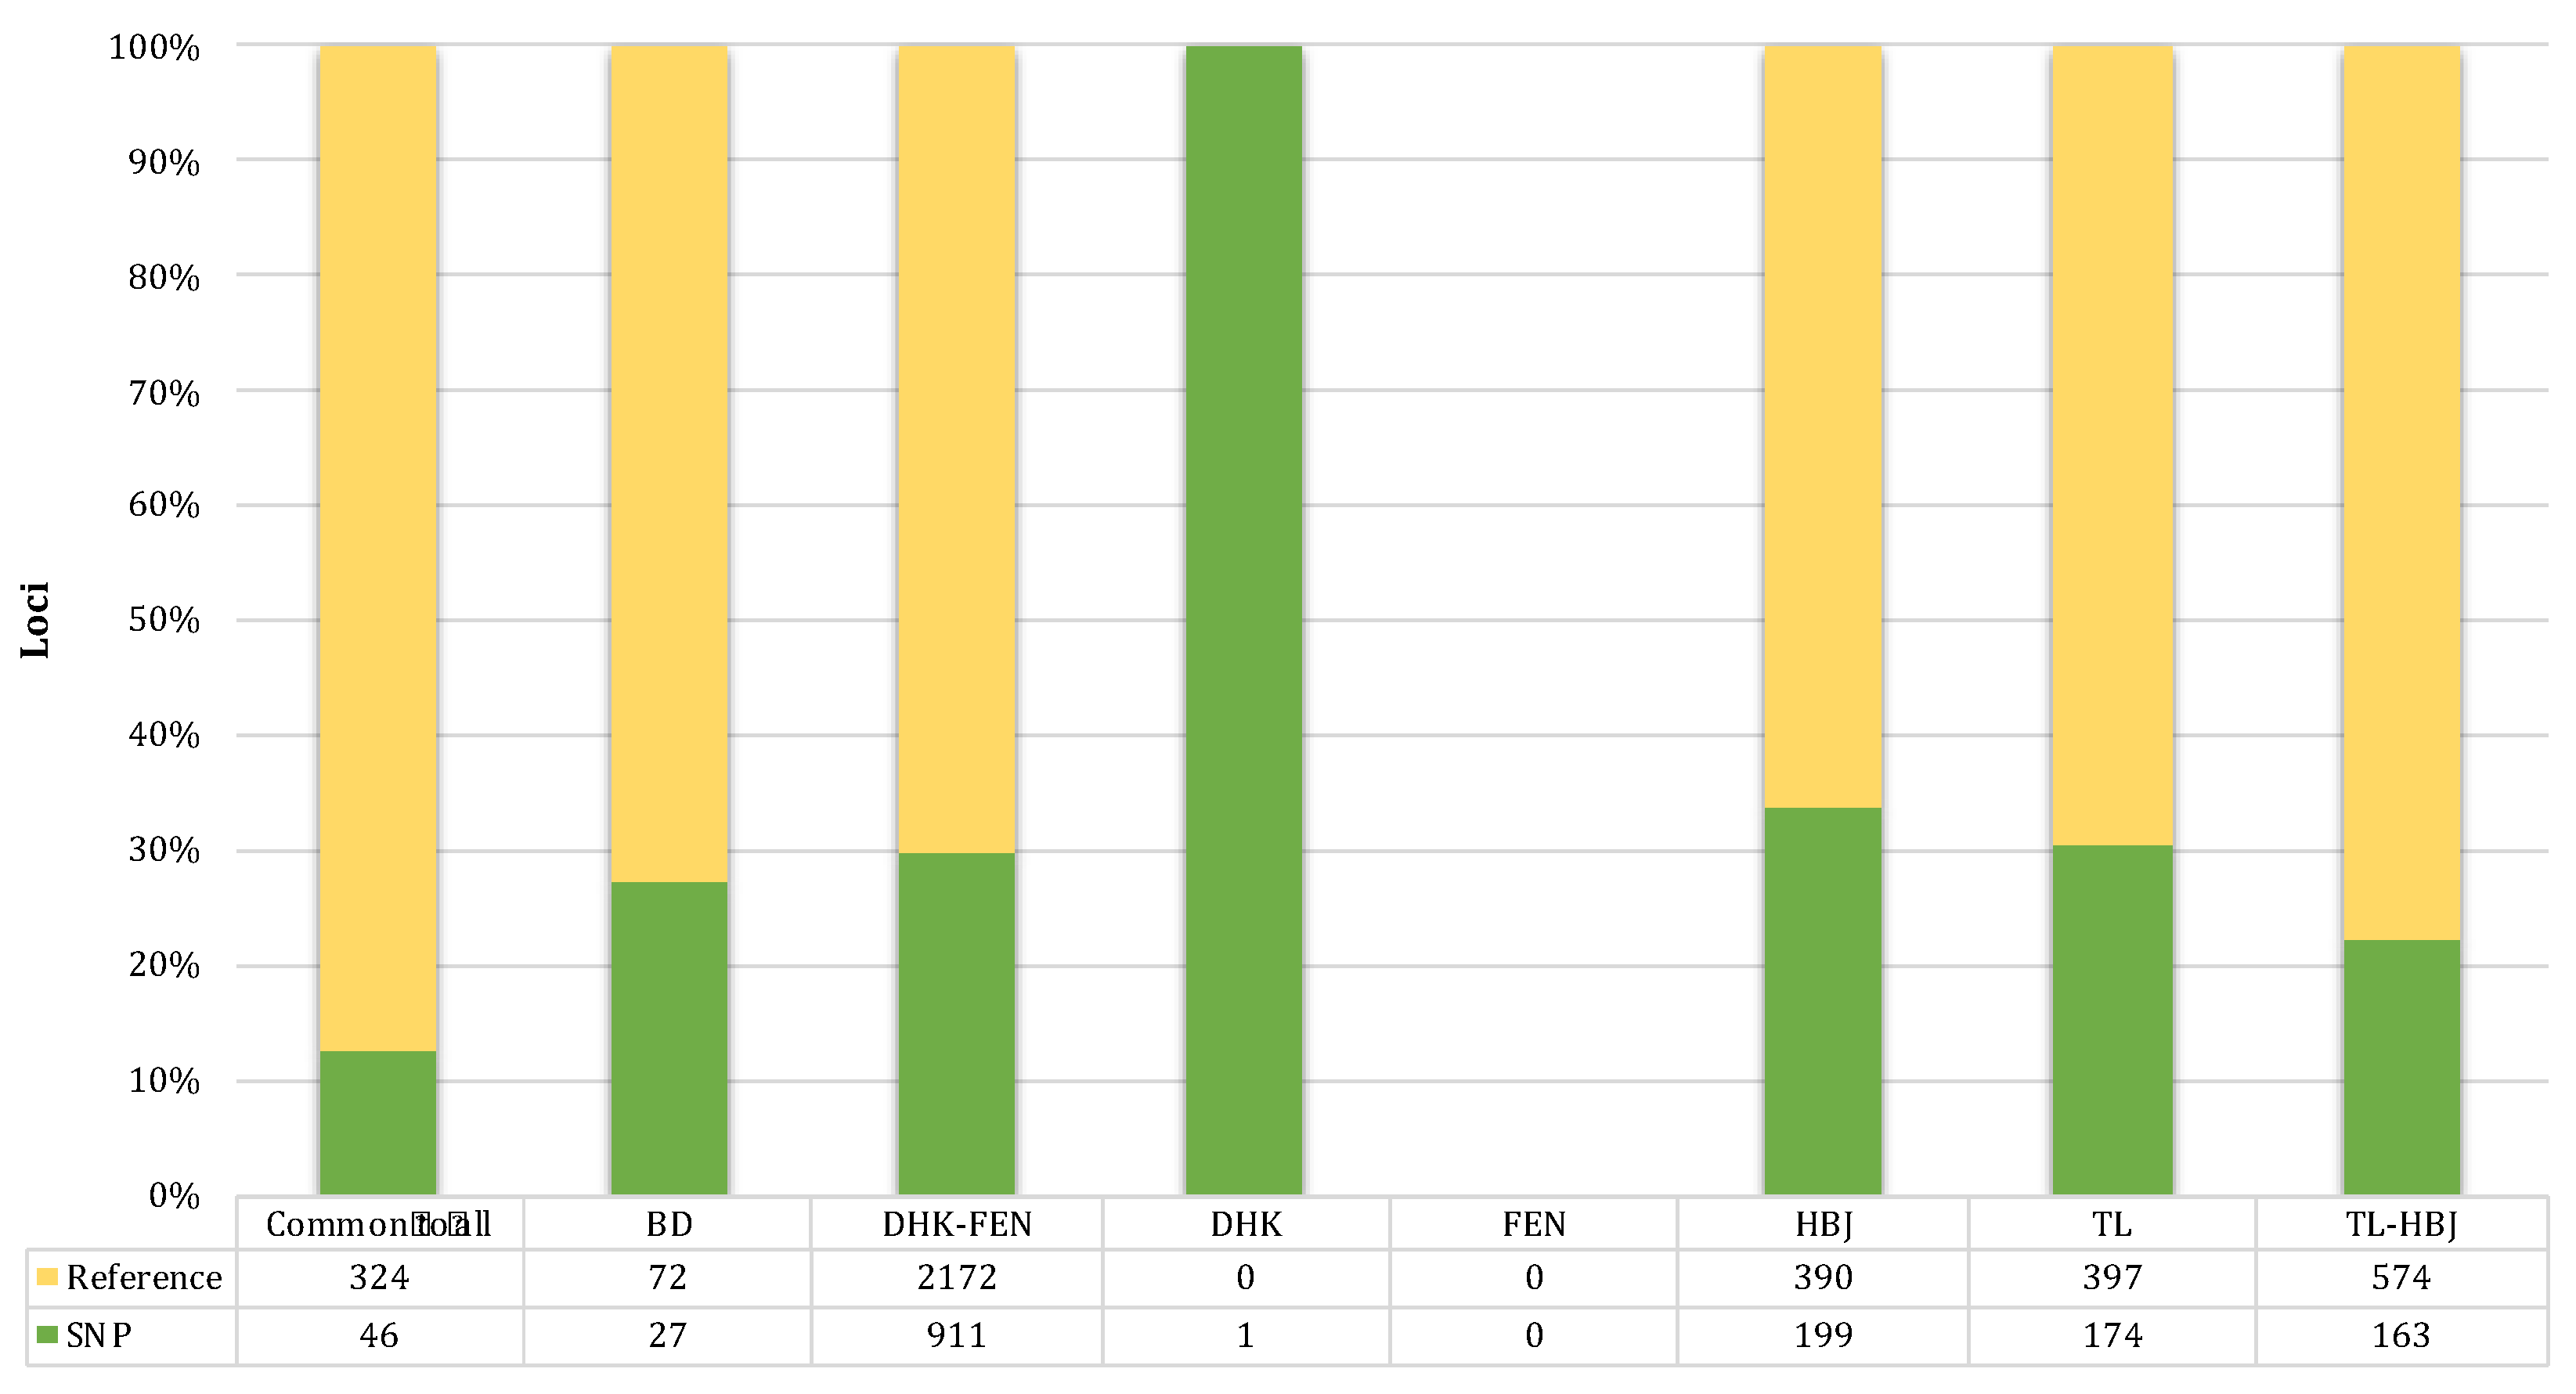
3.3. Sex-Linked Marker Analysis Using SNP Data

A total of 7136 out of 65,652 loci (45 individuals) were retained for sex-linked screening after quality filtering. Screening for loci that met our sex-linked criteria using samples from all populations together yielded no sex-linked markers; however, separate specific screening for each population resulted in 88 loci that exhibited a sex bias (Figure 5a). Of these, the BD_DHK population had three loci (100%) correlating to females, the pattern expected for a sex chromosome system with ZW females and ZZ males. Likewise, 4 out of 41 loci were assigned to the ZZ/ZW system, and the remaining 37 (90%) were assigned to the XX/XY system for the BD_FEN population. The BD_HBJ population had 38 loci, with 10 assigned to XX/XY system and another 28 loci (74%) assigned to the ZZ/ZW system, while 4 out of 6 loci (66%) indicated ZZ/ZW and the other 2 loci suggested the XX/XY system for the TL_CAV population.
Following the equation of Lambert et al. [10], our filtered dataset of 7136 SNP markers, for a sample range of 8–17 phenotypically sexed individuals, revealed that 0.05–28 markers are likely to be spuriously sex-linked [10]. Given the number of tested SNP markers, 13 individuals are sufficient for us to confidently state that less than one marker is spuriously sex-linked if the loci are completely independent.

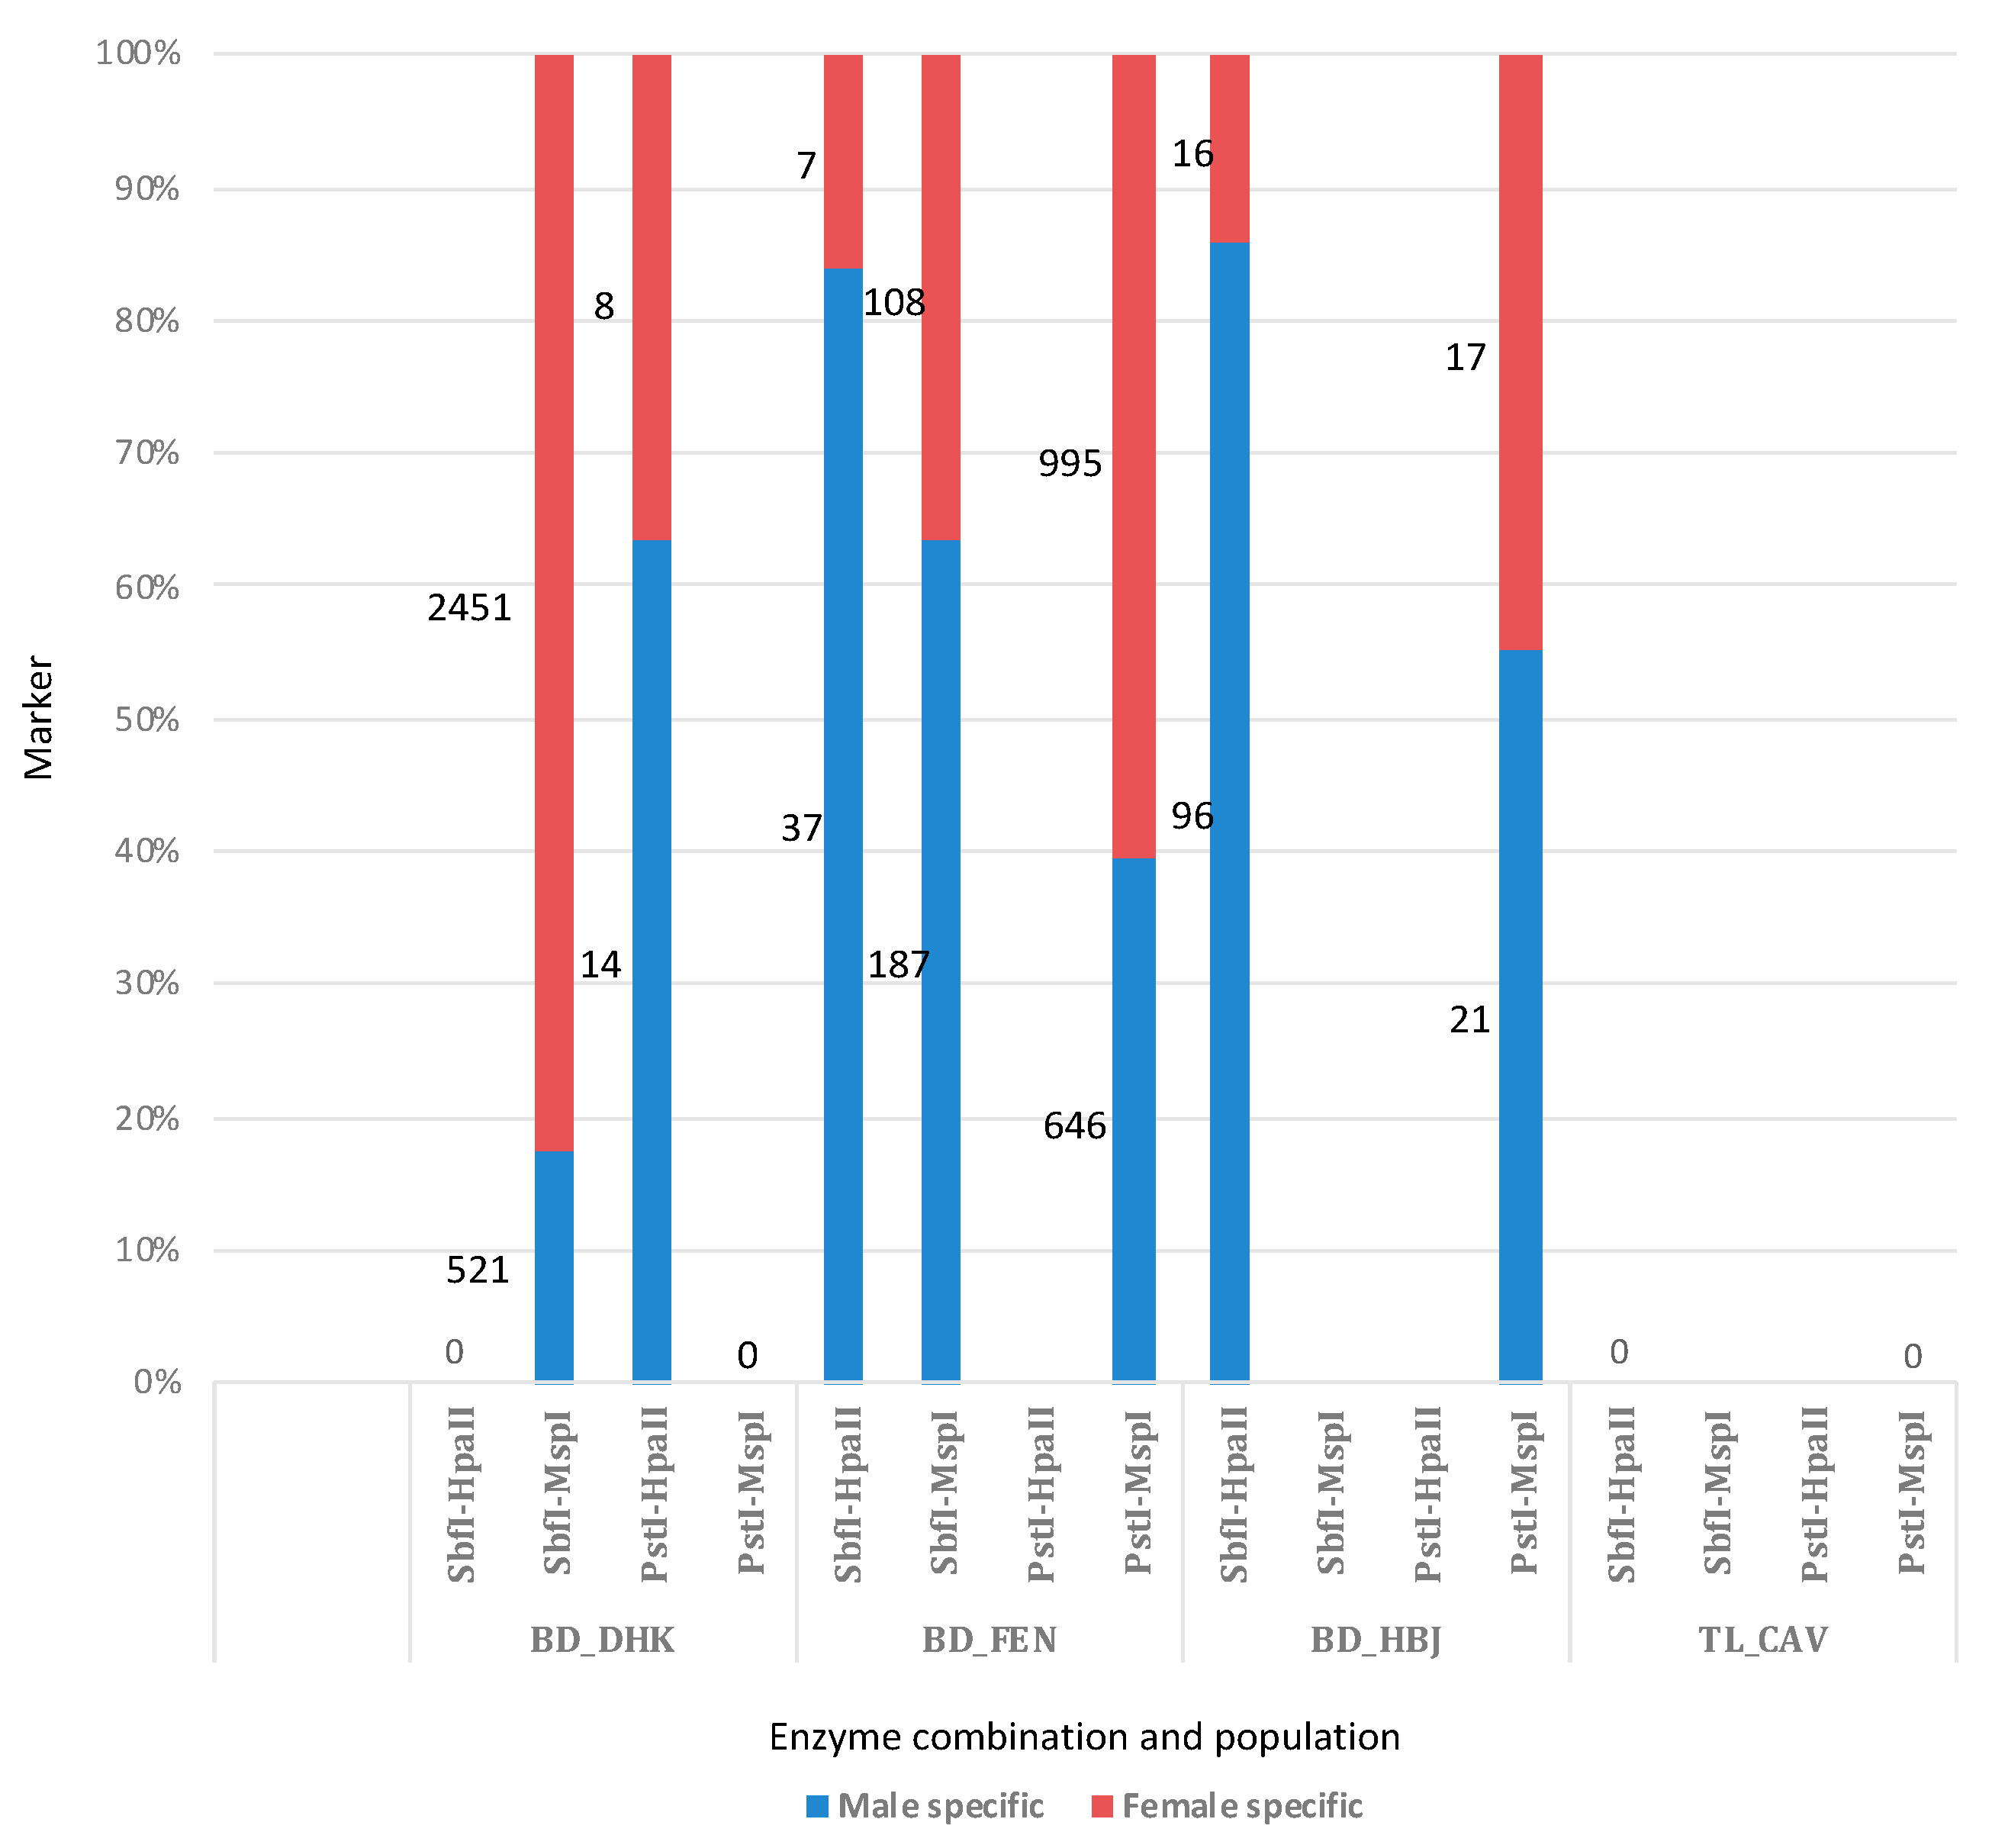
3.4. Sex-Linked Marker Analysis Using SilicoDArT Presence–Absence Data

From the initial sequenced 741,396 PA markers (45 individuals), we retained 277,926 PA loci after filtering. The data belonged to four different treatments with four diverse restriction enzyme combinations: (1) SbfI–HpaII, (2) SbfI–MspI, (3) PstI–HpaII, and (4) PstI–MspI. Not all treatments worked for all populations. Each population revealed different numbers of markers based on the type of treatment (Figure 6; Supplementary Table S1). Considering that markers identified using SbfI–HpaII comprised a subset of the markers identified using SbfI–MspI (and PstI–HpaII of PstI–MspI), methylation-mediated marker profiles could only be created from the BD_DHK and BD_FEN populations. In BD_DHK, no marker from the SbfI–HpaII treatment was identified, denoting that all 2972 markers identified using SbfI–MspI are methylated at their recognition sites. Meanwhile, in BD_FEN, 44 loci out of 295 identified by SbfI–MspI were also identified by SbfI–HpaII, denoting the remaining 251 markers to be methylated at their recognition sites.
Following the equation of Lambert et al., in our filtered dataset of 277,926 PA markers, for a sample range of 4–16 phenotypically sexed individuals, it was revealed that 4–17,370 markers are likely to be spuriously sex-linked [10]. With this equation and this number of PA markers, 20 individuals of each sex is sufficient for us to confidently state that less than one marker is spuriously sex-linked.

4. Discussion

Calotes versicolor is an agamid species with a wide distribution and is regarded as likely to consist of a species complex [37,38]. At present, this species is considered to be a TSD species [6] without any detectable heteromorphic sex chromosomes [40,41,42]. However, it is apparent from multiple previous studies that this species may vary in terms of its sex-determination mechanisms in different parts of its range [5,6,7,40,41,52]. In this study, we found that C. versicolor comprises a combination of different divergent lineages, at least within the sampled locations, and it potentially comprises two different species, i.e., C. calotes and C. versicolor, which may each have evolved different modes of sex determination.

4.1. Population and Phylogenetic Analysis

We used both genomic (DArT sequencing) and mitochondrial DNA (Sanger sequencing) to study the population structure and phylogenetic relationships among C. versicolor samples obtained from six locations in Bangladesh and Thailand. Results from PCoA, Fst, and fixed difference analysis using DArTseq data and phylogenetic analyses of mtDNA revealed three distinct clades across the sample populations: clade 1 (Dhaka–Feni; BD_DHK—BD_FEN), clade 2 (Habiganj; BD_HBJ), and clade 3 (Thailand; TL_CAV). Based on the Fst and fixed difference values, the Habiganj clade was found to be associated more closely with the Thailand clade than the other Bangladesh clades (Dhaka–Feni). The Fst values between those two clades (clades 1 and 2) were at least four times as that seen between the two major clusters from Bangladesh (clade 1) and tended to be less affected by geographic distance than within-cluster comparisons, as would be expected among highly divergent evolutionary lineages [53]. Low and non-significant isolation by distance was detected (Mantel’s test: r = 0.4049; p = 0.080556) while considering all six sampling locations, indicating that genetic dissimilarities within C. versicolor populations are not related to the distance across all study locations. Our phylogenetic analysis also revealed that the Thailand and Habiganj sequences cluster with C. versicolor, whereas the Dhaka–Feni sequences group with C. calotes sequences instead.
It has been previously suggested that adaptation to local environments might play an important role in the diversification of C. versicolor [38]. We found 370 loci common to all location samples (both SNP and reference alleles; Figure 7) and identified SNP loci unique to sampling locations. The straight-line distance between the two countries—Bangladesh and Thailand—is approximately 1500 km, distances between Bangladesh locations (clade 1—Dhaka and Feni; clade 2—Habiganj) range from 116 to 128 km, and distances between Thailand locations (clade 3—Bangkok, Samut Prakan, and Khon Kaen) range from 20 to 394 km. The levels of sequence divergence and the frequencies of private haplotypes were found to be high for intraspecific data within the Bangladesh lineages, i.e., across a small geographical area. Our results therefore do not suggest that patterns in C. versicolor in Bangladesh are consistent with the isolation-by-distance model [54], whereby gene flow decreases with increasing geographical distance because of limited dispersal. This is also evident when high but non-significant isolation by distance was detected after removing clade 1 (Mantel’s test: r = 0.8285; p = 0.0833) and clade 3 (Mantel’s test: r = 0.7694; p = 0.1666) from the analysis. Given that there has been limited gene flow occurring between the Dhaka–Feni and Habiganj lineages, one plausible scenario could result from their different geographic positions and geographical barriers that leads to speciation. Geologically, Dhaka and Feni are floodplain areas affected by seasonal flooding predominantly caused by human-modified landscapes, whereas the Habiganj sampling location consists of hilly tracts with tropical evergreen forests [55]. Both the Habiganj and Thailand sampling locations fall under the Indo-Burma biodiversity hotspot area [56] within the Indo-Chinese sub-region of the oriental zoogeographic region. Dhaka and Feni, on the other hand, fall within the Indian sub-region of the oriental region [57]. A high but non-significant isolation by distance (Mantel’s test: r = 0.8285; p = 0.0833) was detected among the Habiganj and Thailand sampling locations.
Zug et al. [37] found evidence of a species complex with high genetic differentiation without a differentiated morphotype in C. versicolor. They postulated that C. versicolor represents multiple species and at least two clades, one from India–Myanmar and another from Myanmar–Southeast Asia. Our data also provide evidence of high genetic divergence between the samples reflected in clustering into three distinct groups. These three groups can be considered as three distinct evolutionarily significant units (ESUs) and potentially support the presence of a C. versicolor species complex. Based on our population and phylogenetic analyses, it can be predicted that the Thailand and Habiganj samples could be C. versicolor, while the Dhaka–Feni samples could be C. calotes or even a new species within a cryptic species complex. C. calotes is commonly known as the green forest calotes across South India and Sri Lanka [34], with a completely different phenotypic appearance and green coloration [58]; therefore, it does not comply with our samples’ phenotypes. Additionally, there has been no report of C. calotes from Bangladesh yet [59], mainly due to a lack of morphometric and genetic studies. Our study therefore stresses the need for future studies providing evidence that the known C. versicolor in Bangladesh is not a single species but rather comprises different species. However, samples from Habiganj and Thailand may also represent different intraspecific lineages within C. versicolor. Future studies with broader geographic coverage, including type localities of C. versicolor, are essential to further confirm this claim.

4.2. Sex-Determination Modes across Calotes Species Complex

DArTseq data have been previously used to identify sex-linked markers in both amphibians and reptiles [10,12,32]. We applied this method to search for sex-linked markers in C. versicolor. Our results identified a total of 88 SNP loci that were linked to phenotypic sex but extended across different lineages. None of these loci were shared between or among lineages. We also identified up to 2972 sex-linked loci that varied according to lineage.
The SNP DArT results imply that C. versicolor has a TSD system, since no sex-linked markers were found, or that multiple sex-determination systems exist in this species. Our population-specific analysis indicates that the low marker counts seen in the Dhaka and Thailand populations may result from TSD or ZZ/ZW systems, while the Habiganj and Feni populations showed clear biases towards the ZZ/ZW and XX/XY systems, respectively. In this scenario, C. versicolor exhibited multiple sex-determination systems of both XY and ZW, including environmental sex determination (ESD). The sex-determination system of C. versicolor is elusive due to the lack of clear heteromorphic sex chromosomes and contradictory research results regarding sex determination. Previous studies have shown both the effect and lack of effect of temperature in influencing the sex of hatchlings [6,52]. However, Wilson et al. [60] found four weakly sex-associated RAD-tag markers in C. versicolor and concluded that their data did not support the presence of strongly differentiated sex chromosomes in their population of C. versicolor.
These contradicting results could originate from a possible sex reversal caused by temperature that overrides the original sex-determination system, as recorded in other agamid lizards such as in Pogona vitticeps [18,61,62] and the skink Bassiana duperreyi [17], or the existence of multiple sex-determination systems within the same species, as in the Japanese wrinkled frog G. rugosa [3,4]. In previous studies, most C. versicolor samples were from India, while in this study, the samples were from Bangladesh and Thailand. Our results suggest multiple systems based on population and locality. C. versicolor has a vast distribution area from Iran to Southeast Asia, with the potential for each population to adapt to different sex-determination systems, which is similar to amphibians where different populations independently evolve sex-determination [3,4]. Our study, including samples from Bangladesh and Thailand, identified the existence of a Calotes cryptic species complex, as previously suggested by Zug et al. [37]. Therefore, it can be assumed that previously observed variations in sex-determination mechanisms in C. versicolor were due to evolutionary mechanisms by different cryptic species undergoing the process of speciation. This could also have been the case when Doddamani et al. [6] raised the possibility that C. versicolor has a novel FMFM pattern of TSD based on multi-year experiments over several seasons. However, we cannot be certain because they did not include the collection localities of the C. versicolor individuals or eggs. Based on our results, it can be presumed that the pattern inferred from incubation experiments by Doddamani et al. [6] might have come from different populations or even species that were assumed to be single species with the same sex-determination system.
Methylation DArTseq data identified dominant sex-specific markers as loci that were either present or absent according to sex. However, not all combinations of restriction enzymes worked for all populations. We only obtained results from both methylation-sensitive and non-sensitive restriction enzyme combinations from the Dhaka and Feni populations (from the SbfI–HpaII/ SbfI–MspI combination). However, the SbfI–HpaII combination yielded markers from all populations, and this combination was used to generate SNP markers. Theoretically, treatment with a methylation-insensitive restriction enzyme (MspI) should have more or equal numbers of loci than a methylation-sensitive restriction enzyme (HpaII) combination. Such phenomena were observed in the Dhaka and Feni samples (only in the SbfI–HpaII/MspI combination). Therefore, we assumed that loci identified from the SbfI–HpaII combination might be a subset of loci from the non-methylated SbfI–HpaII/MspI combination. We found that all markers identified from Dhaka for this enzyme combination were CpG-methylated on their restriction sites. In the Feni samples, we found that the restriction sites of female loci (93.5%) were more methylated than the male loci (80.2%). By contrast, more sex-specific loci were observed in methylation-sensitive restriction enzyme combinations than insensitive combinations in the Dhaka (in the PstI–HpaII/MspI combination) and Habiganj samples (between SbfI–HpaII and PstI–MspI combinations), making it harder to predict methylation patterns in these treatments.
Complete SbfI–HpaII/MspI combination datasets from the Dhaka and Feni populations (Figure 6) and the number of sex-linked loci associates suggest a ZZ/ZW system in the Dhaka (BD_DHK) population and an XX/XY system with probable environmental influences in the Feni (BD_FEN) population, in accordance with the SNP data (Figure 5a). However, there could be an environmental influence in both cases, since the female-specific markers accounted for 82% and the male-specific markers accounted for only 63% of the total sex-specific markers in BD_DHK and BD_FEN, respectively (Figure 6). Putative male-linked alleles were present in ZZ/ZW populations (Habiganj and Thailand), while female-linked alleles were present in the XX/XY population (Feni), suggesting the frequent sex reversal of female-to-male phenotypes and vice versa. Such sex reversals could be caused by environmental factors, i.e., temperature influences during the incubation period, as in P. vitticeps [63] and B. duperreyi [64]. The cytogenetic analysis of C. versicolor revealed no variation between male and female karyotypes [40,41,65]. This finding does not contradict the possibility of a genetic sex determination, since other agamids such as Phrynocephalus vlangalii [66] and P. vitticeps [67,68] have ZW/ZZ sex chromosome systems. This suggests that C. versicolor might have a genetic sex determination with homomorphic sex chromosomes that are in the early stage of differentiation.

5. Conclusions

Sex-determination mechanisms can occur between closely related species or even between populations within a species. We chose Calotes versicolor for our model because this taxon has a wide geographic distribution with potential for population-level differentiation. Evidence suggested that C. versicolor may not exist as a single species across its known range but rather as a combination of genetically distinct but morphologically similar groups as a cryptic species complex, as indicated by Zug et al. [37]. Our findings showed variations in sex-linked markers, indicating diverse sex-determination modes and mechanisms between genetically distinct lineages comprising both populations and species. Further studies using more individuals with confirmed morphological identification and sex would enable a better understanding of the underlying mechanisms of sex determination within these closely related lineages. Additional sampling locations spanning the entire range of C. versicolor would provide further in-depth information regarding the intensity and diversity of this cryptic species complex. Future detailed research is likely to open up a new window to explore the evolution of sex-determination mechanisms both within this species complex and in reptiles in general.

Supplementary Materials

The following are available online at https://www.mdpi.com/article/10.3390/dna1020006/s1, Table S1: Number of presence-absence markers (100% concordant) in C. versicolor per restriction enzyme combinations.

Author Contributions

Conceptualization, T.E., S.M.I.A. and K.S.; methodology, T.E., K.S., D.G. and S.M.I.A.; formal analysis, S.M.I.A. and T.P.; investigation, S.M.I.A. and T.P.; resources, T.E. and K.S.; data curation, T.E. and S.M.I.A.; writing—original draft preparation, S.M.I.A. and T.P.; writing—review and editing, T.E., D.G., A.G., S.D.S., K.S., S.M.I.A. and T.P.; visualization, S.M.I.A. and T.P.; supervision, T.E., D.G., A.G., S.D.S. and K.S. All authors have read and agreed to the published version of the manuscript.

Funding

S.M.I.A. is supported by the International Research Training Program-Higher Degree by Research (RTP-HDR) Scholarship of the University of Canberra. T.P. and K.S. are supported by The Fellowship of Capacity Building for Kasetsart University on Internationalization at Kasetsart University.

Institutional Review Board Statement

C. versicolor samples (tail snips) from Bangladesh were collected with the permission of the Bangladesh Forest Department (letter number 22.01.0000.101.23.2018). Thailand C. versicolor specimen collection was approved by the Animal Experiment Committee, Kasetsart University, Thailand (approval number ACKU61-SCI-021).

Data Availability Statement

All nucleotide (ND2 gene) sequences were deposited in GenBank under the following accession numbers: BankIt2415978 CAV07M MW478730, BankIt2415978 CAV08M MW478731, BankIt2415978 CAV10F MW478732, BankIt2415978 CAV15M MW478733, BankIt2415978 CAV22M MW478734, BankIt2415978 DHK12M MW478735, BankIt2415978 FEN15F MW478736, BankIt2415978 FEN19M MW478737, BankIt2415978 HBJ02F MW478738, BankIt2415978 HBJ09F MW478739, and BankIt2415978 HBJ14F MW478740.

Acknowledgments

The authors would like to thank Hossain Mineuddin and Abu Sina for assistance with sample collection from Bangladesh at their own cost; Mohammad Abdul Baki and Habibon Naher from the Department of Zoology, Jagannath University, Bangladesh obtained official permission to collect C. versicolor samples from Bangladesh. The authors would also like to thank Jason Carling from the Diversity Arrays Technology for his support in understanding DArT sequencing data and analysis; Peter Unmack for his input during the phylogenetic analyses; and Emily Stringer, Professor Bernd Gruber, and Foyez Shams for their assistance with population analyses.

Conflicts of Interest

The authors declare no conflict of interest.

References

  1. Bull, J.J. Evolution of Sex Determining Mechanisms; The Benjamin/Cummings Publishing Company, Inc.: Menlo Park, CA, USA, 1983. [Google Scholar]
  2. Charlesworth, B. The evolution of chromosomal sex determination and dosage compensation. Curr. Biol. 1996, 6, 149–162. [Google Scholar] [CrossRef] [Green Version]
  3. Miura, I. An evolutionary witness: The frog Rana rugosa underwent change of heterogametic sex from XY male to ZW female. Sex. Dev. 2007, 1, 323–331. [Google Scholar] [CrossRef]
  4. Nishioka, M.; Hanada, H.; Miura, I.; Ryuzaki, M. Four kinds of sex chromosomes in Rana rugosa. Sci. Rep. Lab. Amphib. Biol. 1994, 13, 1–34. [Google Scholar]
  5. Chakraborty, A.; Sreenivasulu, K.; Raman, R. Involvement of androgen receptor gene in male gonad differentiation in Indian garden lizard, Calotes versicolor. Mol. Cell. Endocrinol. 2009, 303, 100–106. [Google Scholar] [CrossRef]
  6. Doddamani, L.S.I.; Vani, V.; Seshagiri, P.B. A tropical oviparous lizard, Calotes versicolor, exhibiting a potentially novel FMFM pattern of temperature-dependent sex determination. J. Exp. Zool. A Ecol. Genet. Physiol. 2012, 317, 32–46. [Google Scholar] [CrossRef] [PubMed]
  7. Tripathi, V.; Raman, R. Identification of Wnt4 as the ovary pathway gene and temporal disparity of its expression vis-a-vis testis genes in the garden lizard, Calotes versicolor. Gene 2010, 449, 77–84. [Google Scholar] [CrossRef] [PubMed]
  8. Gamble, T.; Zarkower, D. Identification of sex-specific molecular markers using restriction site-associated DNA sequencing. Mol. Ecol. Resour. 2014, 14, 902–913. [Google Scholar] [CrossRef] [Green Version]
  9. Gamble, T.; Coryell, J.; Ezaz, T.; Lynch, J.; Scantlebury, D.P.; Zarkower, D. Restriction Site-Associated DNA Sequencing (RAD-seq) Reveals an Extraordinary Number of Transitions among Gecko Sex-Determining Systems. Mol. Biol. Evol. 2015, 32, 1296–1309. [Google Scholar] [CrossRef] [PubMed] [Green Version]
  10. Lambert, M.R.; Skelly, D.K.; Ezaz, T. Sex-linked markers in the North American green frog (Rana clamitans) developed using DArTseq provide early insight into sex chromosome evolution. BMC Genom. 2016, 17, 844. [Google Scholar] [CrossRef] [Green Version]
  11. Gamble, T.; Castoe, T.A.; Nielsen, S.V.; Banks, J.L.; Card, D.C.; Schield, D.R.; Schuett, G.W.; Booth, W. The Discovery of XY Sex Chromosomes in a Boa and Python. Curr. Biol. 2017, 27, 2148–2153.e2144. [Google Scholar] [CrossRef] [PubMed] [Green Version]
  12. Hill, P.L.; Burridge, C.P.; Ezaz, T.; Wapstra, E. Conservation of sex-linked markers among conspecific populations of a viviparous skink, Niveoscincus ocellatus, exhibiting genetic and temperature-dependent sex determination. Genome Biol. Evol. 2018, 10, 1079–1087. [Google Scholar] [CrossRef] [Green Version]
  13. Ogata, M.; Lambert, M.; Ezaz, T.; Miura, I. Reconstruction of female heterogamety from admixture of XX-XY and ZZ-ZW sex-chromosome systems within a frog species. Mol. Ecol. 2018, 27, 4078–4089. [Google Scholar] [CrossRef] [PubMed]
  14. Nielsen, S.V.; Pinto, B.J.; Guzmán-Méndez, I.n.A.; Gamble, T. First report of sex chromosomes in night lizards (Scincoidea: Xantusiidae). J. Hered. 2020, 111, 307–313. [Google Scholar] [CrossRef] [PubMed]
  15. Quinn, A.E.; Radder, R.S.; Sarre, S.D.; Georges, A.; Ezaz, T.; Shine, R. Isolation and development of a molecular sex marker for Bassiana duperreyi, a lizard with XX/XY sex chromosomes and temperature-induced sex reversal. Mol. Genet. Genom. 2009, 281, 665–672. [Google Scholar] [CrossRef]
  16. Cornejo-Páramo, P.; Dissanayake, D.S.B.; Lira-Noriega, A.; Martínez-Pacheco, M.L.; Acosta, A.; Ramírez-Suástegui, C.; Méndez-de-la-Cruz, F.R.; Székely, T.; Urrutia, A.O.; Georges, A.; et al. Viviparous Reptile Regarded to Have Temperature-Dependent Sex Determination Has Old XY Chromosomes. Genome Biol. Evol. 2020, 12, 924–930. [Google Scholar] [CrossRef] [PubMed]
  17. Dissanayake, D.S.; Holleley, C.; Hill, L.; O’Meally, D.; Deakin, J.; Georges, A. Identification of Y chromosome markers in the eastern three-lined skink (Bassiana duperreyi) using in-silico whole genome subtraction. BMC Genom. 2020, 21, 667. [Google Scholar] [CrossRef]
  18. Holleley, C.E.; O’Meally, D.; Sarre, S.D.; Graves, J.A.M.; Ezaz, T.; Matsubara, K.; Azad, B.; Zhang, X.W.; Georges, A. Sex reversal triggers the rapid transition from genetic to temperature-dependent sex. Nature 2015, 523, 79–82. [Google Scholar] [CrossRef]
  19. Castelli, M.A.; Georges, A.; Cherryh, C.; Rosauer, D.F.; Sarre, S.D.; Contador-Kelsall, I.; Holleley, C.E. Evolving thermal thresholds explain the distribution of temperature sex reversal in an Australian dragon lizard. Divers. Distrib. 2021, 27, 427–438. [Google Scholar] [CrossRef]
  20. Ge, C.; Ye, J.; Weber, C.; Sun, W.; Zhang, H.; Zhou, Y.; Cai, C.; Qian, G.; Capel, B. The histone demethylase KDM6B regulates temperature-dependent sex determination in a turtle species. Science 2018, 360, 645–648. [Google Scholar] [CrossRef] [Green Version]
  21. Ge, C.; Ye, J.; Zhang, H.; Zhang, Y.; Sun, W.; Sang, Y.; Capel, B.; Qian, G. Dmrt1 induces the male pathway in a turtle species with temperature-dependent sex determination. Development 2017, 144, 2222–2233. [Google Scholar]
  22. Deakin, J.E.; Domaschenz, R.; Lim, P.S.; Ezaz, T.; Rao, S. Comparative epigenomics: An emerging field with breakthrough potential to understand evolution of epigenetic regulation. AIMS Genet. 2014, 1, 34–54. [Google Scholar] [CrossRef]
  23. Navarro-Martín, L.; Viñas, J.; Ribas, L.; Díaz, N.; Gutiérrez, A.; Di Croce, L.; Piferrer, F. DNA methylation of the gonadal aromatase (cyp19a) promoter is involved in temperature-dependent sex ratio shifts in the European sea bass. PLoS Genet. 2011, 7, e1002447. [Google Scholar] [CrossRef] [PubMed] [Green Version]
  24. Baroiller, J.F.; D’Cotta, H. The Reversible Sex of Gonochoristic Fish: Insights and Consequences. Sex. Dev. 2016, 10, 242–266. [Google Scholar] [CrossRef] [PubMed]
  25. Shao, C.; Li, Q.; Chen, S.; Zhang, P.; Lian, J.; Hu, Q.; Sun, B.; Jin, L.; Liu, S.; Wang, Z. Epigenetic modification and inheritance in sexual reversal of fish. Genome Res. 2014, 24, 604–615. [Google Scholar] [CrossRef] [PubMed] [Green Version]
  26. Ramsey, M.; Shoemaker, C.; Crews, D. Gonadal expression of Sf1 and aromatase during sex determination in the red-eared slider turtle (Trachemys scripta), a reptile with temperature-dependent sex determination. Differentiation 2007, 75, 978–991. [Google Scholar] [CrossRef] [PubMed]
  27. Matsumoto, Y.; Hannigan, B.; Crews, D. Temperature Shift Alters DNA Methylation and Histone Modification Patterns in Gonadal Aromatase (cyp19a1) Gene in Species with Temperature-Dependent Sex Determination. PLoS ONE 2016, 11, e0167362. [Google Scholar] [CrossRef] [PubMed] [Green Version]
  28. Palaiokostas, C.; Bekaert, M.; Davie, A.; Cowan, M.E.; Oral, M.; Taggart, J.B.; Gharbi, K.; McAndrew, B.J.; Penman, D.J.; Migaud, H. Mapping the sex determination locus in the Atlantic halibut (Hippoglossus hippoglossus) using RAD sequencing. BMC Genom. 2013, 14, 566. [Google Scholar] [CrossRef] [Green Version]
  29. Wilson, C.A.; High, S.K.; McCluskey, B.M.; Amores, A.; Yan, Y.-l.; Titus, T.A.; Anderson, J.L.; Batzel, P.; Carvan, M.J.; Schartl, M. Wild sex in zebrafish: Loss of the natural sex determinant in domesticated strains. Genetics 2014, 198, 1291–1308. [Google Scholar] [CrossRef] [Green Version]
  30. Brelsford, A.; Dufresnes, C.; Perrin, N. High-density sex-specific linkage maps of a European tree frog (Hyla arborea) identify the sex chromosome without information on offspring sex. Heredity 2016, 116, 177–181. [Google Scholar] [CrossRef]
  31. Utsunomia, R.; Scacchetti, P.C.; Hermida, M.; Fernandez-Cebrian, R.; Taboada, X.; Fernandez, C.; Bekaert, M.; Mendes, N.J.; Robledo, D.; Mank, J.E. Evolution and conservation of Characidium sex chromosomes. Heredity 2017, 119, 237–244. [Google Scholar] [CrossRef] [Green Version]
  32. Sopniewski, J.; Shams, F.; Scheele, B.C.; Kefford, B.J.; Ezaz, T. Identifying sex-linked markers in Litoria aurea: A novel approach to understanding sex chromosome evolution in an amphibian. Sci. Rep. 2019, 9, 1–10. [Google Scholar] [CrossRef] [Green Version]
  33. Koomgun, T.; Laopichienpong, N.; Singchat, W.; Panthum, T.; Phatcharakullawarawat, R.; Kraichak, E.; Sillapaprayoon, S.; Ahmad, S.F.; Muangmai, N.; Peyachoknagul, S.; et al. Genome Complexity Reduction High-Throughput Genome Sequencing of Green Iguana (Iguana iguana) Reveal a Paradigm Shift in Understanding Sex-Chromosomal Linkages on Homomorphic X and Y Sex Chromosomes. Front. Genet. 2020, 11, 556267. [Google Scholar] [CrossRef] [PubMed]
  34. Uetz, P.; Freed, P.; Hošek, J. The Reptile Database. Available online: http://reptile-database.org (accessed on 14 February 2020).
  35. Gowande, G.; Mishra, A.; Mirza, Z.A. Neotype designation for Calotes versicolor Daudin, 1802 (Sauria: Agamidae) with notes on its systematics. Zootaxa 2016, 4126, 271–279. [Google Scholar] [CrossRef] [PubMed]
  36. Wei, X.; Yan, L.; Zhao, C.; Zhang, Y.; Xu, Y.; Cai, B.; Jiang, N.; Huang, Y. Geographic variation in body size and its relationship with environmental gradients in the Oriental Garden Lizard, Calotes versicolor. Ecol. Evol. 2018, 8, 4443–4454. [Google Scholar] [CrossRef]
  37. Zug, G.R.; Brown, H.H.; Schulte, J.A.; Vindum, J.V. Systematics of the garden lizards, Calotes versicolor group (Reptilia, Squamata, Agamidae), in Myanmar: Central dry zone populations. Proc. Calif. Acad. Sci. 2006, 57, 35–68. [Google Scholar]
  38. Huang, Y.; Guo, X.; Ho, S.Y.; Shi, H.; Li, J.; Li, J.; Cai, B.; Wang, Y. Diversification and Demography of the Oriental Garden Lizard (Calotes versicolor) on Hainan Island and the Adjacent Mainland. PLoS ONE 2013, 8, e64754. [Google Scholar] [CrossRef] [Green Version]
  39. Tripathi, V.; Raman, R. Conservation of Ovary-Specific Genes, Foxl2, Aromatase, and Rspo1, in the Common Indian Garden Lizard, Calotes versicolor, That Lacks Chromosomal or Temperature-Dependent Sex Determination. Sex. Dev. 2018, 12, 295–307. [Google Scholar]
  40. Singh, L. Study of mitotic and meiotic chromosomes in seven species of lizards. Proc. Zool. Soc. Calcutta 1974, 27, 57–79. [Google Scholar]
  41. Ganesh, S.; Mohanty, J.; Raman, R. Male-biased distribution of the human Y chromosomal genes SRY and ZFY in the lizard Calotes versicolor, which lacks sex chromosomes and temperature-dependent sex determination. Chromosome Res. 1997, 5, 413–419. [Google Scholar] [CrossRef]
  42. Singchat, W.; Sillapaprayoon, S.; Muangmai, N.; Baicharoen, S.; Indananda, C.; Duengkae, P.; Peyachoknagul, S.; O’Connor, R.E.; Griffin, D.K.; Srikulnath, K. Do sex chromosomes of snakes, monitor lizards, and iguanian lizards result from multiple fission of an “ancestral amniote super-sex chromosome”? Chromosome Res. 2020, 28, 209–228. [Google Scholar] [CrossRef]
  43. Harlow, P. A harmless technique for sexing hatchiling lizards. Herpetol. Rev. 1996, 27, 71–72. [Google Scholar]
  44. Harlow, P. Temperature-Dependent Sex Determination in Lizards; Smithsonian Books: Washington, DC, USA, 2004; pp. 42–52. [Google Scholar]
  45. Srikulnath, K.; Matsubara, K.; Uno, Y.; Thongpan, A.; Suputtitada, S.; Nishida, C.; Matsuda, Y.; Apisitwanich, S. Genetic relationship of three butterfly lizard species (Leiolepis reevesii rubritaeniata, Leiolepis belliana belliana, Leiolepis boehmei, Agamidae, Squamata) inferred from nuclear gene sequence analyses. Kasetsart J. Nat. Sci. 2010, 44, 424–435. [Google Scholar]
  46. Kilian, A.; Wenzl, P.; Huttner, E.; Carling, J.; Xia, L.; Blois, H.; Caig, V.; Heller-Uszynska, K.; Jaccoud, D.; Hopper, C. Diversity arrays technology: A generic genome profiling technology on open platforms. In Data Production and Analysis in Population Genomics; Methods in Molecular Biology (Methods and Protocols); Humana Press: Totowa, NJ, USA, 2012; Volume 888, pp. 67–89. [Google Scholar]
  47. Gruber, B.; Unmack, P.J.; Berry, O.F.; Georges, A. dartr: An r package to facilitate analysis of SNP data generated from reduced representation genome sequencing. Mol. Ecol. Resour. 2018, 18, 691–699. [Google Scholar] [CrossRef]
  48. Georges, A.; Gruber, B.; Pauly, G.B.; White, D.; Adams, M.; Young, M.J.; Kilian, A.; Zhang, X.; Shaffer, H.B.; Unmack, P.J. Genomewide SNP markers breathe new life into phylogeography and species delimitation for the problematic short-necked turtles (Chelidae: Emydura) of eastern Australia. Mol. Ecol. 2018, 27, 5195–5213. [Google Scholar] [CrossRef]
  49. Unmack, P.; Young, M.; Gruber, B.; White, D.; Kilian, A.; Zhang, X.; Georges, A. Phylogeography and species delimitation of Cherax destructor (Decapoda: Parastacidae) using genome-wide SNPs. Mar. Freshw. Res. 2019, 70, 857–869. [Google Scholar] [CrossRef] [Green Version]
  50. Brelsford, A.; Lavanchy, G.; Sermier, R.; Rausch, A.; Perrin, N. Identifying homomorphic sex chromosomes from wild-caught adults with limited genomic resources. Mol. Ecol. Resour. 2016, 17, 752–759. [Google Scholar] [CrossRef] [PubMed] [Green Version]
  51. Macey, J.R.; Schulte, J.A.; Larson, A. Evolution and phylogenetic information content of mitochondrial genomic structural features illustrated with acrodont lizards. Syst. Biol. 2000, 49, 257–277. [Google Scholar] [CrossRef] [PubMed] [Green Version]
  52. Ganesh, S.; Raman, R. Sex reversal by testosterone and not by estradiol or temperature in Calotes versicolor, the lizard lacking sex chromosomes. J. Exp. Zool. 1995, 271, 139–144. [Google Scholar] [CrossRef]
  53. McCartney-Melstad, E.; Gidiş, M.; Shaffer, H.B. Population genomic data reveal extreme geographic subdivision and novel conservation actions for the declining foothill yellow-legged frog. Heredity 2018, 121, 112–125. [Google Scholar] [CrossRef] [Green Version]
  54. Wright, S. Isolation by distance. Genetics 1943, 28, 114–138. [Google Scholar] [CrossRef]
  55. Nishat, A.; Huq, S.I.; Barua, S.P.; Reza, A.; Khan, A.M. Bio-Ecological Zones of Bangladesh; The World Conservation Union (IUCN): Dhaka, Bangladesh, 2002; p. 141. [Google Scholar]
  56. Myers, N.; Mittermeier, R.A.; Mittermeier, C.G.; Da Fonseca, G.A.; Kent, J. Biodiversity hotspots for conservation priorities. Nature 2000, 403, 853–858. [Google Scholar] [CrossRef] [PubMed]
  57. Wallace, A.R. The Geographical Distribution of Animals: With a Study of the Relations of Living and Extinct Faunas as Elucidating the Past Changes of the Earth’s Surface; Macmillan and Co.: London, UK, 1876; Volume 1. [Google Scholar]
  58. Pal, S.; Vijayakumar, S.; Shanker, K.; Jayarajan, A.; Deepak, V. A systematic revision of Calotes Cuvier, 1817 (Squamata: Agamidae) from the Western Ghats adds two genera and reveals two new species. Zootaxa 2018, 4482, 401–450. [Google Scholar] [CrossRef] [PubMed]
  59. IUCN Bangladesh. Red List of Bangladesh Volume 4: Reptiles and Amphibians; International Union for Conservation of Nature (IUCN), Bangladesh Country Office: Dhaka, Bangladesh, 2015; pp. xvi+320. [Google Scholar]
  60. Wilson, C.A.; Priyanka; Titus, T.; Batzel, P.; Postlethwait, J.H.; Raman, R. A search for sex-linked loci in the agamid lizard, Calotes versicolor. Sex. Dev. 2019, 13, 143–150. [Google Scholar] [CrossRef] [PubMed]
  61. Quinn, A.E.; Georges, A.; Sarre, S.D.; Guarino, F.; Ezaz, T.; Graves, J.A.M. Temperature sex reversal implies sex gene dosage in a reptile. Science 2007, 316, 411. [Google Scholar] [CrossRef] [PubMed] [Green Version]
  62. Holleley, C.E.; Sarre, S.D.; O’Meally, D.; Georges, A. Sex Reversal in Reptiles: Reproductive Oddity or Powerful Driver of Evolutionary Change? Sex. Dev. 2016, 10, 279–287. [Google Scholar] [CrossRef]
  63. Quinn, A.; Georges, A.; Sarre, S.; Guarino, F.; Ezaz, T.; Graves, J. Sex Chromosomes and incubation temperature interact to determine sex of a reptile. IAHS Proc. Rep. 2007, 316, 411. [Google Scholar]
  64. Shine, R.; Elphick, M.; Donnellan, S. Co-occurrence of multiple, supposedly incompatible modes of sex determination in a lizard population. Ecol. Lett. 2002, 5, 486–489. [Google Scholar] [CrossRef]
  65. Patawang, I.; Tanomtong, A.; Chuaynkern, Y.; Chuaynkern, C.; Duengkae, P. Karyotype homology between Calotes versicolor and C. mystaceus (Squamata, Agamidae) from northeastern Thailand. Nucleus 2015, 58, 117–123. [Google Scholar] [CrossRef]
  66. Zeng, X.M.; Wang, Y.Z.; Liu, Z.J.; Fang, Z.L.; Wu, G.F. Karyotypes on nine species in the genus Phrynocephalus, with discussion of karyotypic evolution of Chinese Phrynocephalus. Acta Zool. Sin. 1997, 43, 399–410. [Google Scholar]
  67. Ezaz, T.; Quinn, A.E.; Miura, I.; Sarre, S.D.; Georges, A.; Marshall Graves, J.A. The dragon lizard Pogona vitticeps has ZZ/ZW micro-sex chromosomes. Chromosome Res. 2005, 13, 763–776. [Google Scholar] [CrossRef] [PubMed]
  68. Ezaz, T.; Quinn, A.E.; Sarre, S.D.; O’Meally, D.; Georges, A.; Graves, J.A. Molecular marker suggests rapid changes of sex-determining mechanisms in Australian dragon lizards. Chromosome Res. 2009, 17, 91–98. [Google Scholar] [CrossRef] [PubMed]
Figure 1. Collection locations of Calotes versicolor. Samples were collected from Bangladesh and Thailand, with three locations from each country.
Dna 01 00006 g001
Figure 2. Schematic view of the use of the DArTseqMet process. The two isoschizomer restriction enzymes, HpaII and MspI, differ in sensitivity to cytosine methylation and result in two different representations based on methylation patterns across the genome.
Dna 01 00006 g002
Figure 3. PCoA plot using DArTseq SNP data showing samples clustered in three distinct lineages: Dhaka–Feni, Habiganj, and Thailand (Bangkok, Samut Prakan, and Khon Kaen).
Dna 01 00006 g003
Figure 4. Relationship of all Calotes individuals inferred from mtDNA (ND2 gene) consensus sequences using maximum-likelihood (a) (with bootstrap proportions) and Bayesian (b) (with consensus support %) trees. These trees indicate three distinct clades—(1) Thailand (TL_CAV), (2) Dhaka–Feni (BD_DHK—BD-FEN), and (3) Habiganj (BD-HBJ)—supporting the findings from the DArTseq SNP (genomic DNA) data. The trees were constructed using the Chamaeleo chamaeleon ND2 gene sequence as an outgroup. C. versicolor 01 is KC875647.1, and C. versicolor 02 is DQ289476.1.
Dna 01 00006 g004
Figure 5. Sex-specific SNP markers identified in different populations/lineages (a) and Hamming distance matrix (b) illustrating proportional differences across the analyzed adults using all 88 sex-biased SNP loci. Values closer to zero (dark purple) signify high similarity, whereas values closer to one (light purple) are more dissimilar across the SNP loci.
Dna 01 00006 g005
Figure 6. Sex-specific silicoDArT presence–absence (PA) markers identified in different populations. The number of markers is shown on the left side of the corresponding bar. Zero refers to scenarios where no sex-specific loci were identified, whereas empty spaces refer to scenarios where the particular enzyme combination did not work out.
Dna 01 00006 g006
Figure 7. Number of population-specific loci (DArT seq data). The high number of unique loci in Dhaka–Feni samples and lower individual numbers (1 in Dhaka and 0 in Feni) indicate that these two populations are a single population that is unique from the Habiganj and Thailand samples. BD—Bangladesh; TL—Thailand; DHK—Dhaka; FEN—Feni; HBJ—Habiganj.
Dna 01 00006 g007
Table 1. Calotes versicolor sample details. A total of 49 individuals, including 36 from Bangladesh and 13 from Thailand, were collected and sexed. Of these, 45 were successfully DArT-sequenced and analyzed for SNPs (single-nucleotide polymorphisms), SilicoDArT, and methylation-sensitive DArT data.
Sl. No.Sample IDLocationSexUsed for
DArT SequencingSanger Sequencing
1.TL_CAV5Bangkok, ThailandFemaleX
2.TL_CAV6Bangkok, ThailandMaleX
3.TL_CAV7Khon Kaen, ThailandMaleXX
4.TL_CAV8Khon Kaen, ThailandMaleXX
5.TL_CAV9Khon Kaen, ThailandFemaleX
6.TL_CAV10Khon Kaen, ThailandFemaleXX
7.TL_CAV11Khon Kaen, ThailandFemaleX
8.TL_CAV12Khon Kaen, ThailandFemaleX
9.TL_CAV13Samut Prakan, ThailandMaleX
10.TL_CAV15Samut Prakan, ThailandMale X
11.TL_CAV17Samut Prakan, ThailandMale X
12.TL_CAV19Samut Prakan, ThailandMaleX
13.TL_CAV20Samut Prakan, ThailandMaleX
14.TL_CAV22Samut Prakan, ThailandMale X
15.BD_DHK01Dhaka, BangladeshMaleXX
16.BD_DHK02Dhaka, BangladeshMaleX
17.BD_DHK03Dhaka, BangladeshMaleX
18.BD_DHK04Dhaka, BangladeshFemaleX
19.BD_DHK05Dhaka, BangladeshFemaleX
20.BD_DHK06Dhaka, BangladeshMaleX
21.BD_DHK07Dhaka, BangladeshFemaleX
22.BD_DHK08Dhaka, BangladeshMaleXX
23.BD_DHK09Dhaka, BangladeshMaleX
24.BD_DHK11Dhaka, BangladeshMaleX
25.BD_DHK12Dhaka, BangladeshMaleXX
26.BD_DHK13Dhaka, BangladeshFemaleX
27.BD_DHK15Dhaka, BangladeshFemaleX
28.BD_DHK16Dhaka, BangladeshMaleX
29.BD_DHK18Dhaka, BangladeshFemaleX
30.BD_DHK19Dhaka, BangladeshFemaleX
31.BD_DHK20Dhaka, BangladeshFemaleX
32.BD_FEN02Feni, BangladeshFemaleX
33.BD_FEN03Feni, BangladeshFemaleX
34.BD_FEN06Feni, BangladeshFemaleX
35.BD_FEN07Feni, BangladeshFemaleXX
36.BD_FEN10Feni, BangladeshMaleX
37.BD_FEN15Feni, BangladeshFemaleXX
38.BD_FEN17Feni, BangladeshMaleX
39.BD_FEN18Feni, BangladeshMaleX
40.BD_FEN19Feni, BangladeshMaleXX
41.BD_HBJ02Habiganj, BangladeshFemale X
42.BD_HBJ08Habiganj, BangladeshMaleX
43.BD_HBJ09Habiganj, BangladeshFemaleXX
44.BD_HBJ10Habiganj, BangladeshFemaleX
45.BD_HBJ11Habiganj, BangladeshFemaleX
46.BD_HBJ14Habiganj, BangladeshFemaleXX
47.BD_HBJ16Habiganj, BangladeshMaleX
48.BD_HBJ17Habiganj, BangladeshMaleX
49.BD_HBJ20Habiganj, BangladeshMaleX
Table 2. Pairwise Fst values between the clusters.
Fst ValuesThailandBangladesh
Khon KaenSamut PrakanBangkokDhakaFeniHabiganj
ThailandKhon Kaen0
Samut Prakan0.2210
Bangkok0.2010.09450
BangladeshDhaka0.8380.8140.7980
Feni0.8640.8440.8290.2060
Habiganj0.5480.5090.4910.8130.8370
Table 3. Fixed difference analyses between the sample locations.
Fixed DifferencesThailandBangladesh
Khon KaenSamut PrakanBangkokDhakaFeniHabiganj
ThailandKhon Kaen0
Samut Prakan4390
Bangkok4203380
BangladeshDhaka12,75311,04488890
Feni12,60610,92387096520
Habiganj19741748154413,89513,9000
Table 4. BLASTN results against Calotes spp. mitochondrial DNA consensus sequences (1013 bp). The table shows the topmost hits based on their highest total scores, query covers, percent identity, and lowest E-values. The C. calotes sequence was taken from the work of Macey et al. [51], and C. versicolor sequences were taken from the work of Zug et al. [37]. Only the sequences in bold were used for phylogenetic tree construction.
Sample IDSpeciesAccession No.Total ScoreQuery CoverE-ValuePercent Identity
BangladeshBD_DHK 01MC. calotesAF128482.135598%7 × 10−9362.74%
BD_DHK 12MC. calotesAF128482.11273100%0.087.86%
BD_FEN 07FC. calotesAF128482.135192%9 × 10−9262.08%
BD_FEN 15FC. calotesAF128482.11266100%0.087.66%
BD_FEN 19FC. calotesAF128482.11275100%0.087.86%
BD_HBJ 02FC. versicolorDQ289476.11739100%0.098.03%
BD_HBJ 09FC. versicolorDQ289476.11742100%0.098.12%
BD_HBJ 14FC. versicolorDQ289476.11737100%0.098.03%
ThailandTL_CAV 07MC. versicolorDQ289474.11544100%0.096.09%
TL_CAV 08MC. versicolorDQ289474.11643100%0.095.95%
TL_CAV 10FC. versicolorDQ289474.11656100%0.096.25%
TL_CAV 15MC. versicolorDQ289474.11646100%0.095.95%
TL_CAV 17MC. versicolorDQ289469.177188%0.073.83
TL_CAV 22MC. versicolorDQ289474.11649100%0.096.05%
Publisher’s Note: MDPI stays neutral with regard to jurisdictional claims in published maps and institutional affiliations.

