1. Introduction
Anaerobic digestion (AD) is a sustainable and efficient technology for treating organic waste. It produces biogas, a renewable energy source that can substitute fossil fuels, mitigate greenhouse gas emissions, reduce deforestation, and generate high-quality fertilizer, particularly in developing countries [
1,
2]. This by-product, is rich in nutrients such as nitrogen and phosphorus, making it suitable for agricultural applications [
3,
4]. Globally, large amounts of organic waste are generated, which can be converted into both biogas and organic fertilizer through AD technology [
5]. This represents a major opportunity to enhance quality of life while contributing to the bioeconomy, public health, and environmental sustainability worldwide [
6].
AD can process a wide variety of organic wastes using different types of bioreactors [
7]. To optimize the reactor design and operation, the Biochemical Methane Potential (BMP) test is employed to determine the methane yield of specific substrates [
8]. BMP tests are widely recognized as the state-of-the-art method for assessing methane yield and are therefore essential for the design and scaling of anaerobic digesters [
9]. In recent years, interest in BMP testing has increased significantly, as evidenced by the growing number of publications on this topic [
10].
BMP tests are valuable tools for both researchers and practitioners. They have been applied to identify suitable feedstocks for AD [
11], to evaluate the ultimate methane yield of substrates used in modeling approaches [
12], and to provide critical information for determining organic loading rates and hydraulic retention times [
13].
However, comparing BMP results across studies remains challenging due to differences in methodologies, operating conditions, equipment, and pretreatment procedures [
14,
15,
16]. Several standardized BMP protocols have been developed, including the method proposed by Angelidaki et al. in 2009 [
8], the 2011 VDLUFA guidelines [
17]. In 2015, an international initiative was launched to improve reproducibility in BMP testing, leading to new guidelines and validation criteria [
18,
19], thereby strengthening the reliability of results, enhancing cross-laboratory comparability, and fostering global standardization in anaerobic digestion research. The VDI 4630 protocol published in 2016 [
20] is extensively applied in Germany, where more than 30 laboratories routinely use it for BMP characterization, establishing it as the benchmark method in anaerobic digestion research. Its application has also been consolidated in other European countries, including the Technical University of Denmark, Lund University in Sweden and both BOKU–University of Natural Resources and Life Sciences and the University of Innsbruck in Austria. Beyond Europe, institutions such as the Institute of Environment, Natural Resources and Biodiversity (IRENA) at Universidad de León (UL) in Spain and the Universidad Pontificia Bolivariana (UPB) in Colombia have likewise adopted this protocol.
Table 1 offers a detailed overview of the main points and limitations of various Biochemical Methane Potential (BMP) methods, compared with the BMP analysis recommended in the referenced study. It highlights the strengths and weaknesses of each approach, including factors such as reproducibility, substrate specificity, operational complexity, and potential sources of error. By presenting this comparison, the table aims to provide readers with a clearer understanding of how alternative methods measure up against the standard BMP protocol, helping to inform method selection and experimental design.
This study presents the design and construction of an automated BMP measurement prototype developed at Universidad Pontificia Bolivariana (UPB) in Colombia, which integrates a Programmable Logic Controller (PLC) to enable real-time monitoring, control, and data acquisition. The system integrates bioreactors with temperature control, biogas volume quantification, and a data acquisition platform based on low-cost embedded systems. The prototype was tested with pig manure and sludge from a wastewater treatment plant, enabling real-time monitoring of pH, temperature, and methane production.
The system offers several advantages over traditional methodologies used to determine BMP. Being an automated, low-cost prototype, it facilitates the measurement process and reduces the need for manual labor compared to protocols such as the VDI 4630 standard, which are typically more expensive and complex. The incorporation of pressure, temperature, pH and biogas flow sensors also allows for real-time monitoring of digestion conditions, representing a significant advance over the classic Owen et al. method and responding to Angelidaki and Holliger’s recommendations regarding the control of critical variables. Furthermore, the built-in heat exchanger allows for rapid and stable achievement of mesophilic conditions, reinforcing the system’s reliability.
Still, the prototype has some clear limits. Unlike well-established protocols, it has not been tested across different laboratories, which means its results cannot yet be compared with confidence. Its small scale, using only three two-liter reactors, also weakens the strength of the tests and makes the data less representative. In addition, because it is not officially recognized as a standard, unlike VDI 4630, it carries no regulatory weight. Also, the system does not include some key methodological steps described in the guidelines of Angelidaki and Holliger, such as setting the right inoculum-to-substrate ratio, adding proper controls, and defining clear criteria for when the tests should end.
2. Materials and Methods
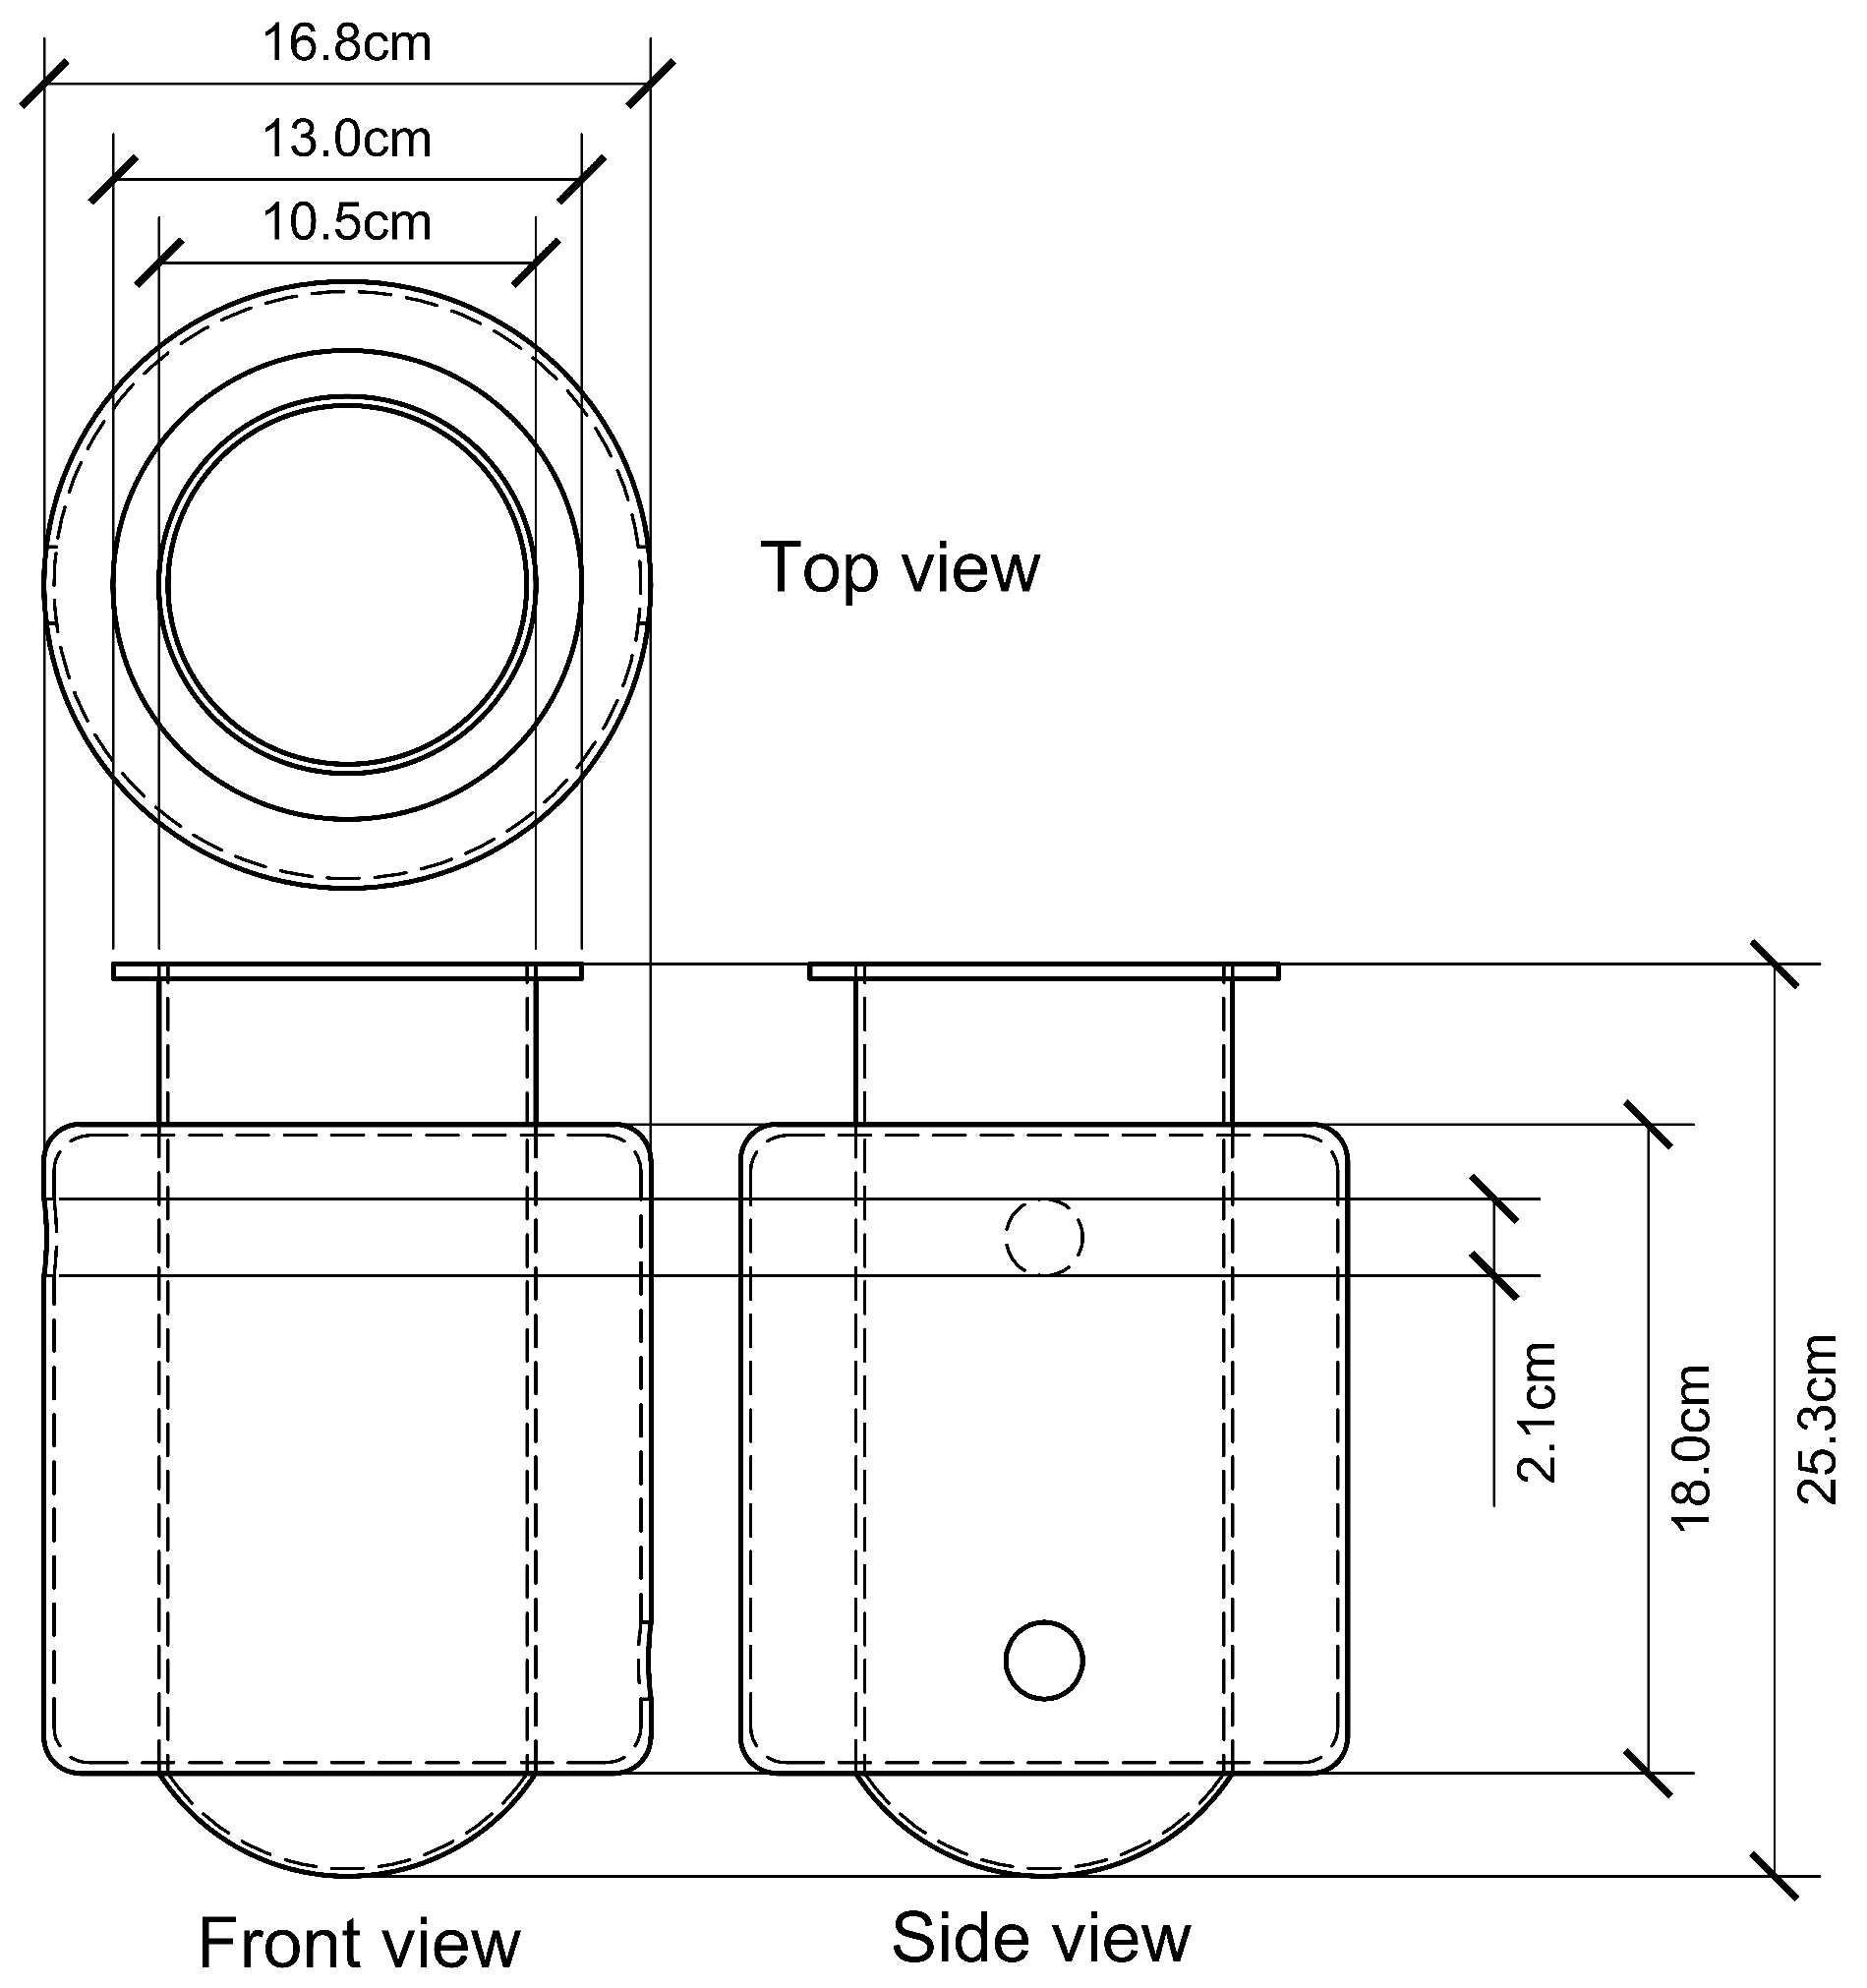
The automated BMP prototype
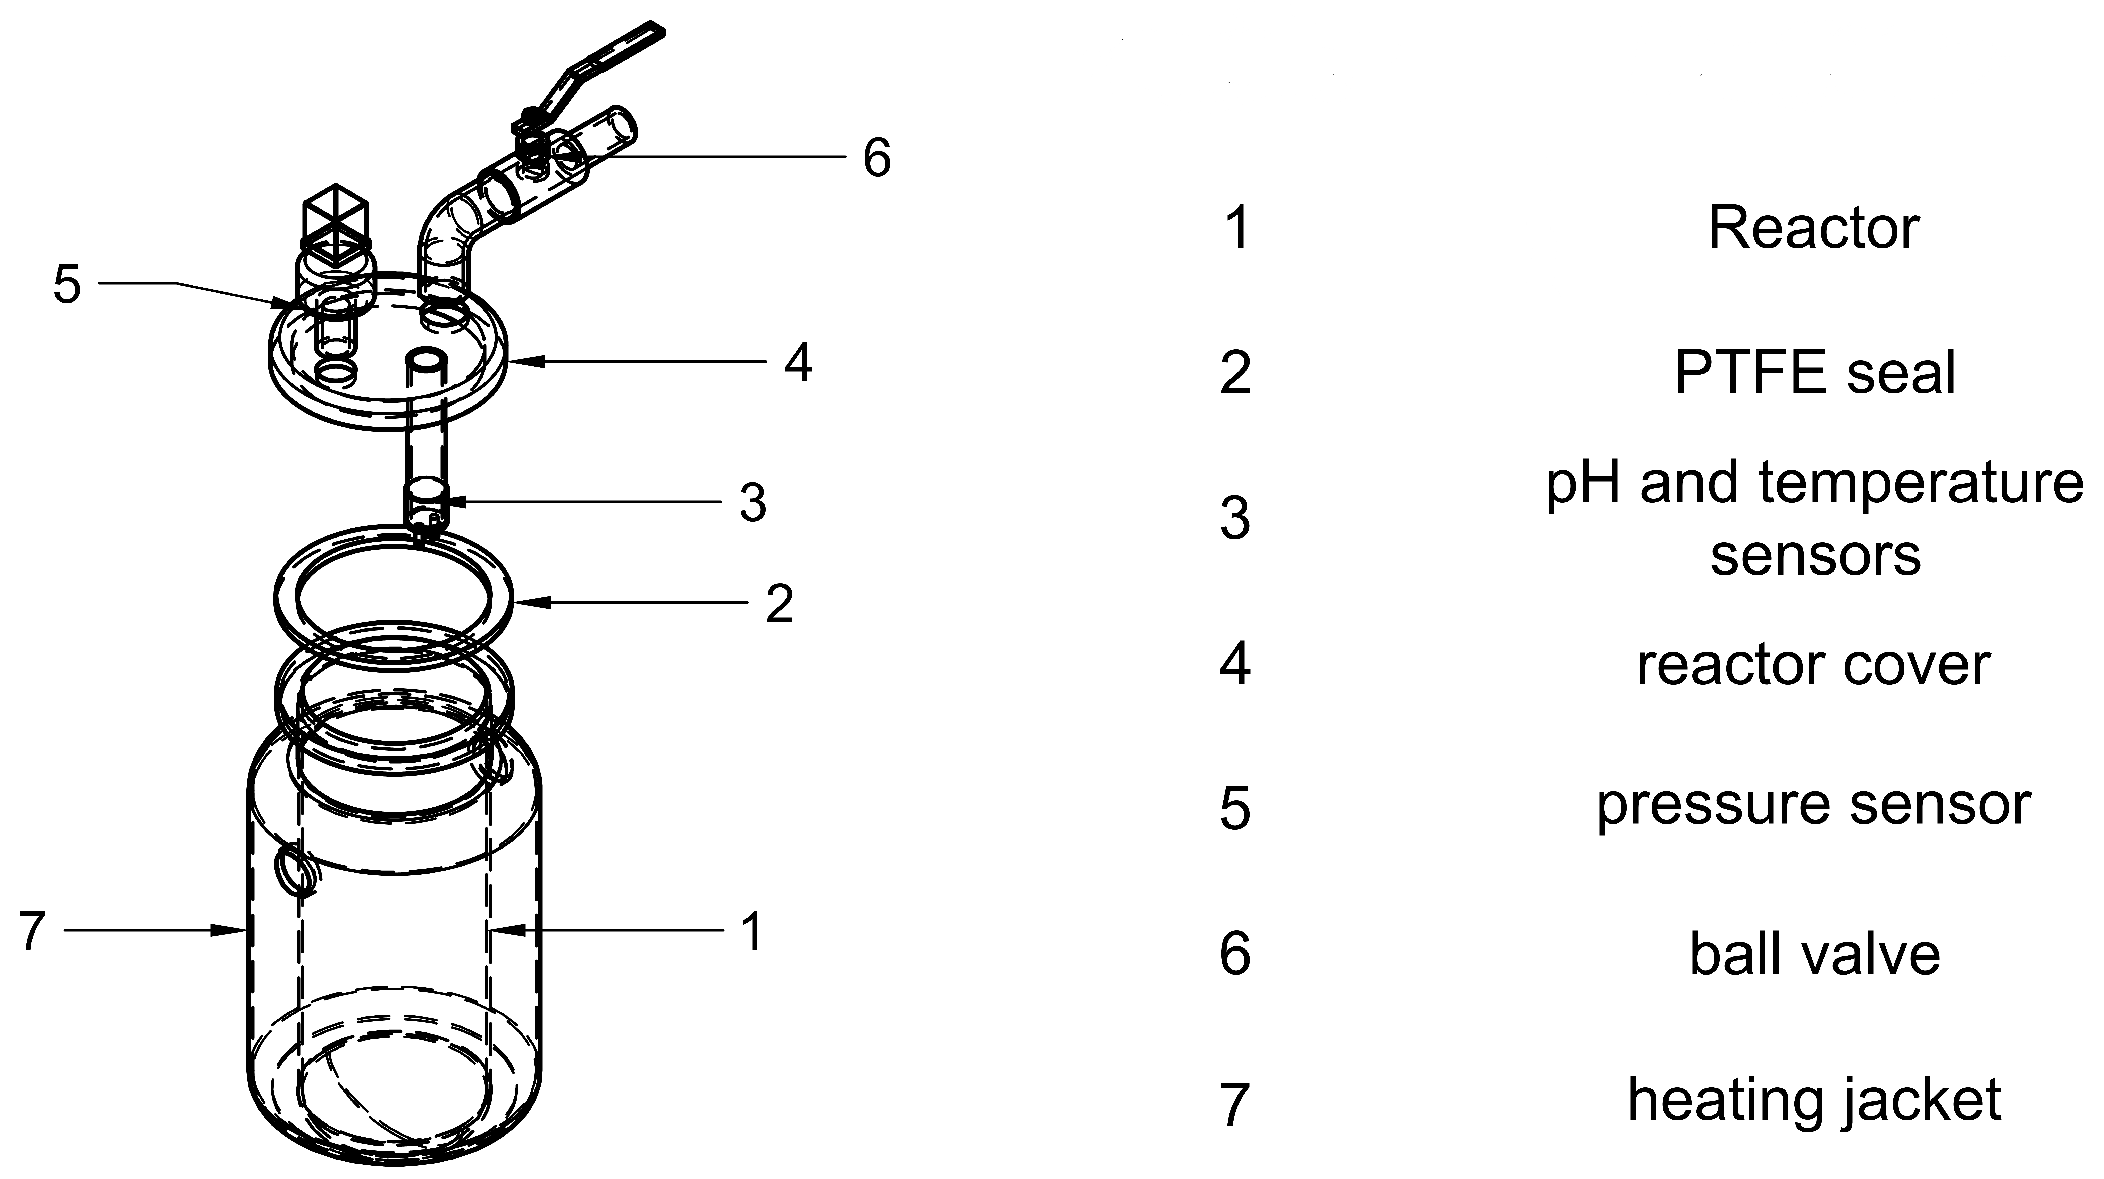
Figure 1a consists of three batch reactors with identical geometry, selected to ensure statistical validity and reproducibility [
22]. The system is scalable in multiples of three, allowing for simultaneous testing. Each reactor includes a jacketed heat exchanger supplied with recirculating hot water, as well as temperature, pressure and pH sensors. Biogas production is estimated indirectly using the ideal gas law and a custom-built flow meter developed in this study. Stirring mechanisms were excluded, as the prototype is designed for diluted or easily degradable substrates, where mixing is not required, as supported by one of the studies consulted [
23].
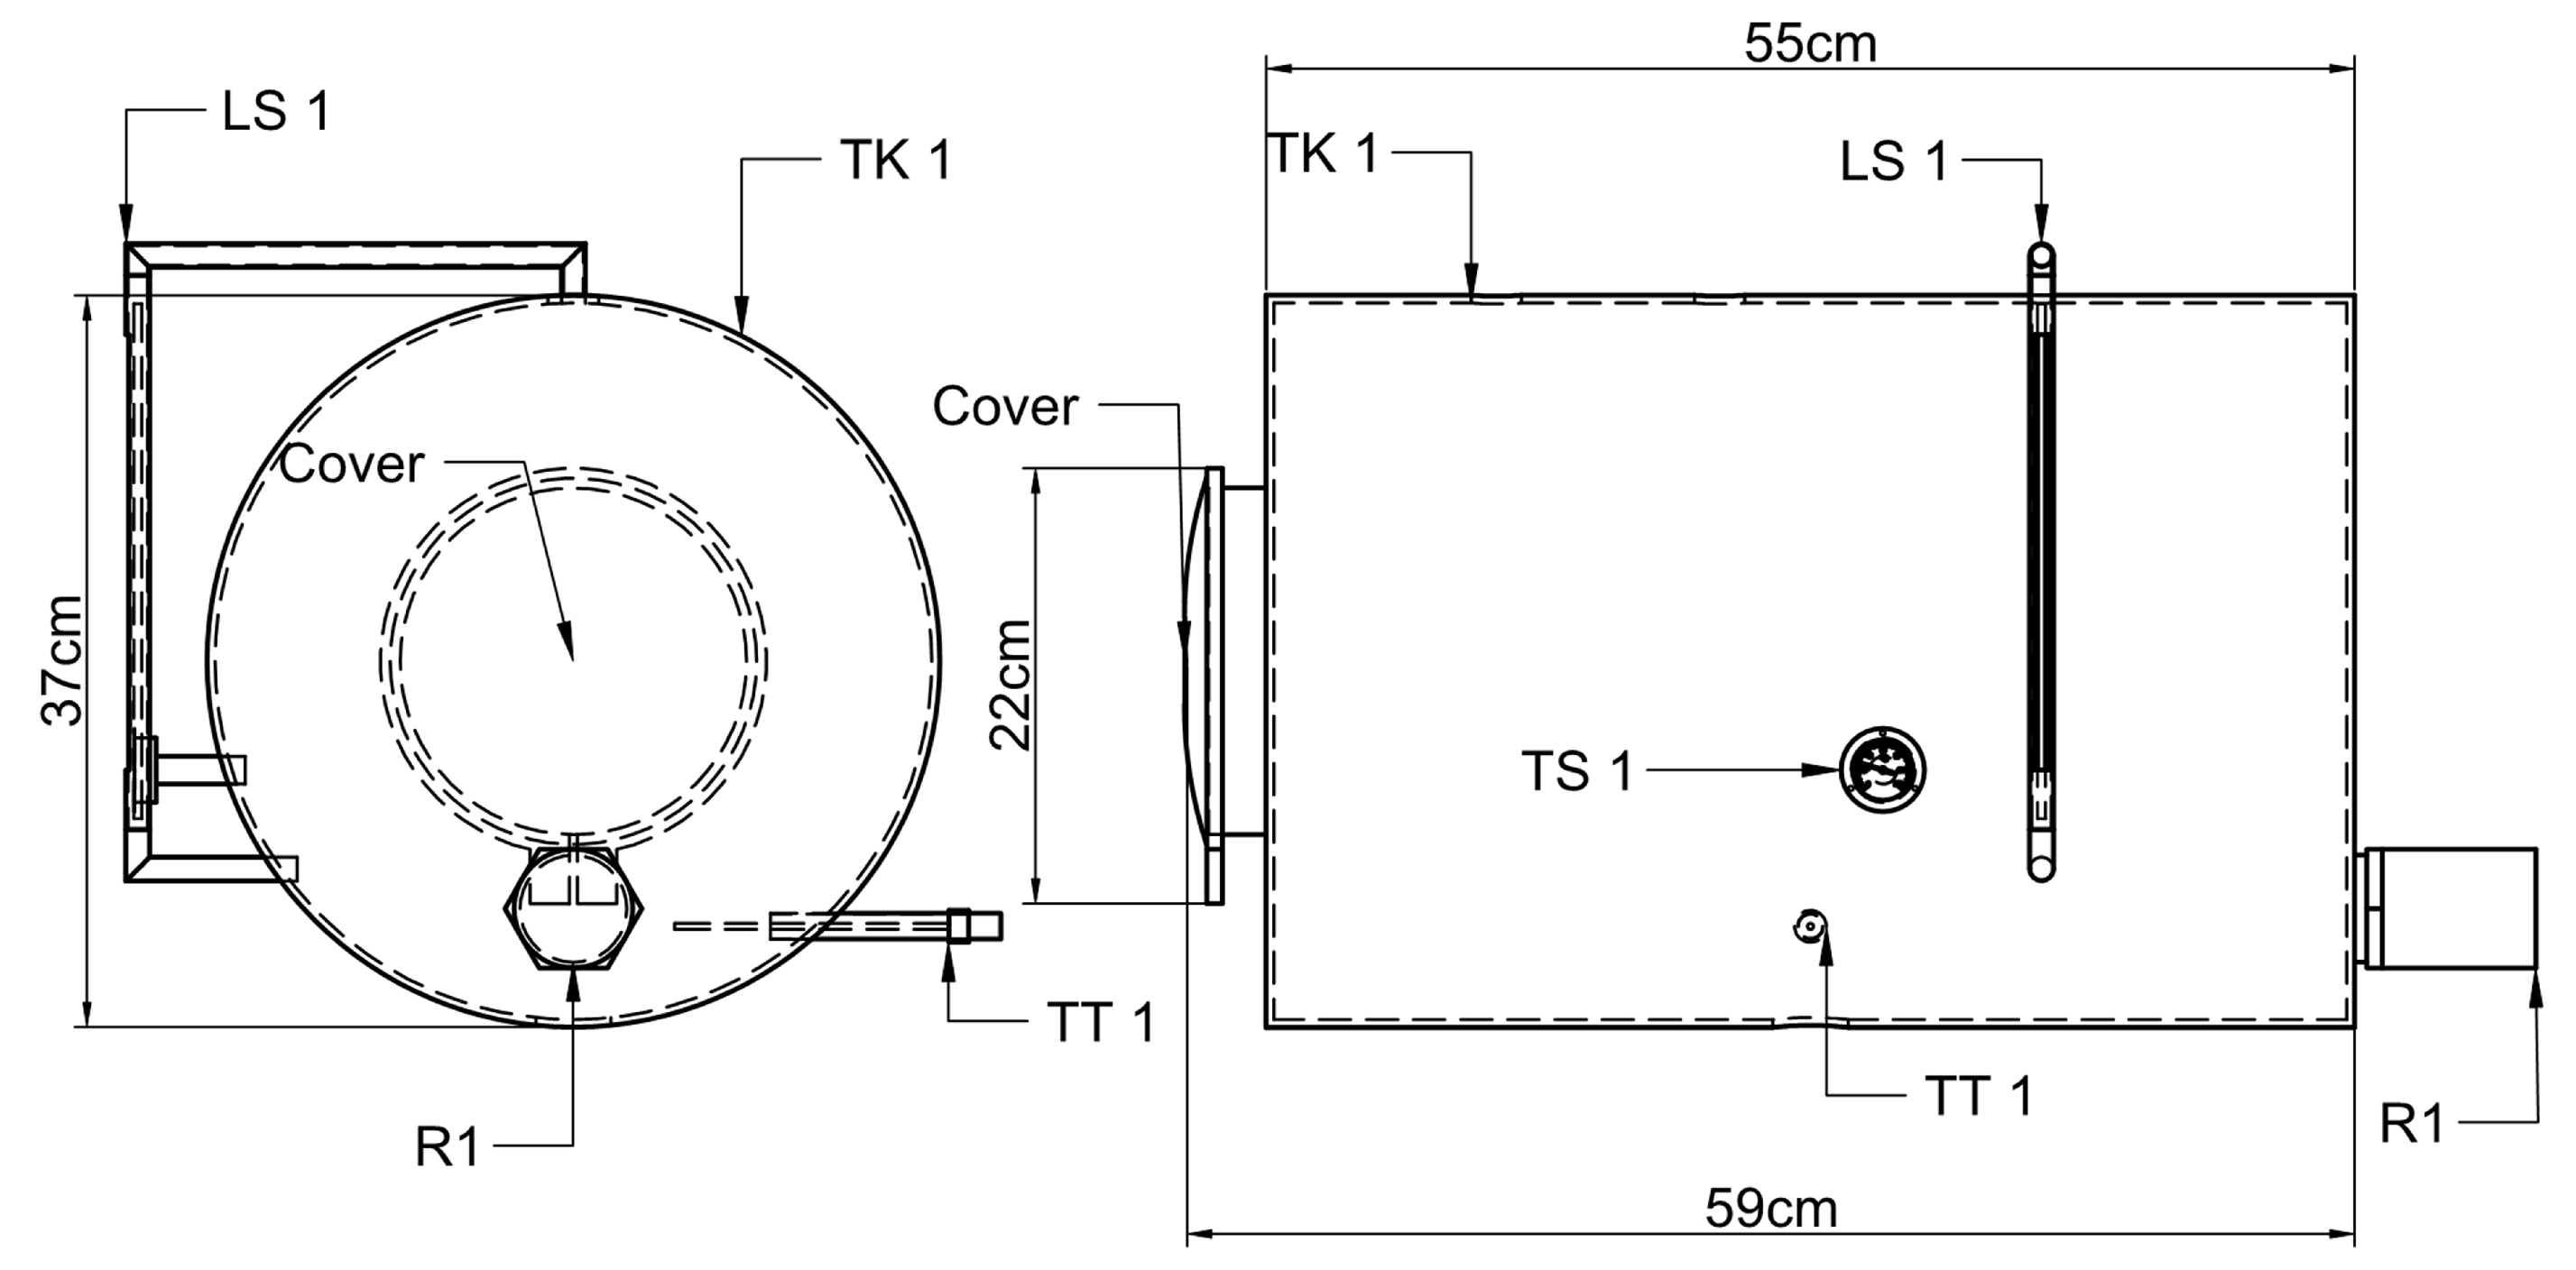
Figure 1b shows the general dimensions of the prototype, which was designed for easy mobility. The system allows for scalability, enabling the addition of more reactors (up to 15) either on the same or a second level, depending on space availability. The heat exchanger system was also designed with this expansion in mind. The general BMP process is detailed in the PID diagram (
Figure 2), which outlines the components, the process flow and the electronic devices involved in the temperature, pressure control and data acquisition. The acronyms R1, R2 and R3 correspond to the three reactors; LS and TS denote the level switch and the temperature switch, respectively; TK1 identifies Tank 1 and P1 refers to Pump 1. The terms used in the equations represent the readings from the temperature and level transmitters, while the others are only intended to identify the system components.
The heating system uses galvanized steel pipes (¼ inch or 6.35 mm diameter) to circulate hot water, shown as continuous lines in the diagram. The system allows the connection of up to 12 additional reactors via valve SV-4. Its design was based on the heat exchanger capacity and pump power to ensure efficient thermal performance.
2.1. Heat Exchanger Configuration
Maintaining a constant temperature is essential in the BMP system to ensure reproducible results. The heating system uses recirculating hot water circulated through jacketed reactors, heated by an electric resistance inside a 50-L tank (
Figure 3). A centrifugal pump [
24] drives the water through the system: from the tank to the reactor jackets and then back to the tank in a closed loop.
The heating system uses a centrifugal pump, designed based on pipe length and a minimum flow rate of 40 L/min. This ensures rapid heat transfer, allowing a quick temperature increase in the reactors and anticipating the thermal demand of future reactor expansions. The hot water circulates through a network of connected pipes and fittings, directing flow through the reactor jackets. The pump design was based on mass conservation principles for incompressible fluids in steady state, and its maximum head was estimated using the following expression (1) [
24]:
Since the system operates in recirculation, the elevation difference between the supply and return points is assumed to be zero, making the elevation term equal to 0. Therefore, the maximum pump head was estimated using (2):
Which explains that pressure losses in the piping system are caused by friction and fittings. The friction factor is determined using the average velocity (3), the Reynolds number (4), and the Colebrook Equation (5), as detailed below.
Head losses from fittings and accessories were estimated using loss coefficients proposed by Çengel and Cimbala [
24]. The list of accessories and their corresponding loss coefficients is presented in
Table 2.
The pump power was calculated using Equation (6). The system of equations was solved in MS Excel using an iterative numerical method (affine homotopy).
2.2. Reactor Design Parameters
The reactor design started with defining the volume and number of units. The volume was selected based on heuristic guidelines proposed by experts in anaerobic digestion [
23], while the number of reactors (replicates) was determined following statistical principles for data analysis and reproducibility [
22]. The dimensions of the reactor, diameter and height, were calculated using Equations (7) and (8) [
6].
The reactor diameter was chosen based on the availability of stainless steel SCH 40 pipes in the local market. The height was determined using the length-to-diameter ratio
, and the reactor volume—ranging from 125 mL to 2000 mL was estimated using Equations (7) and (8) [
25]. The selected heat exchange system was jacketed heating, suitable for small reactors, requiring low operating temperatures and lower capital costs (CAPEX) compared to other systems. The energy balance for the jacket design is shown in Equation (9) [
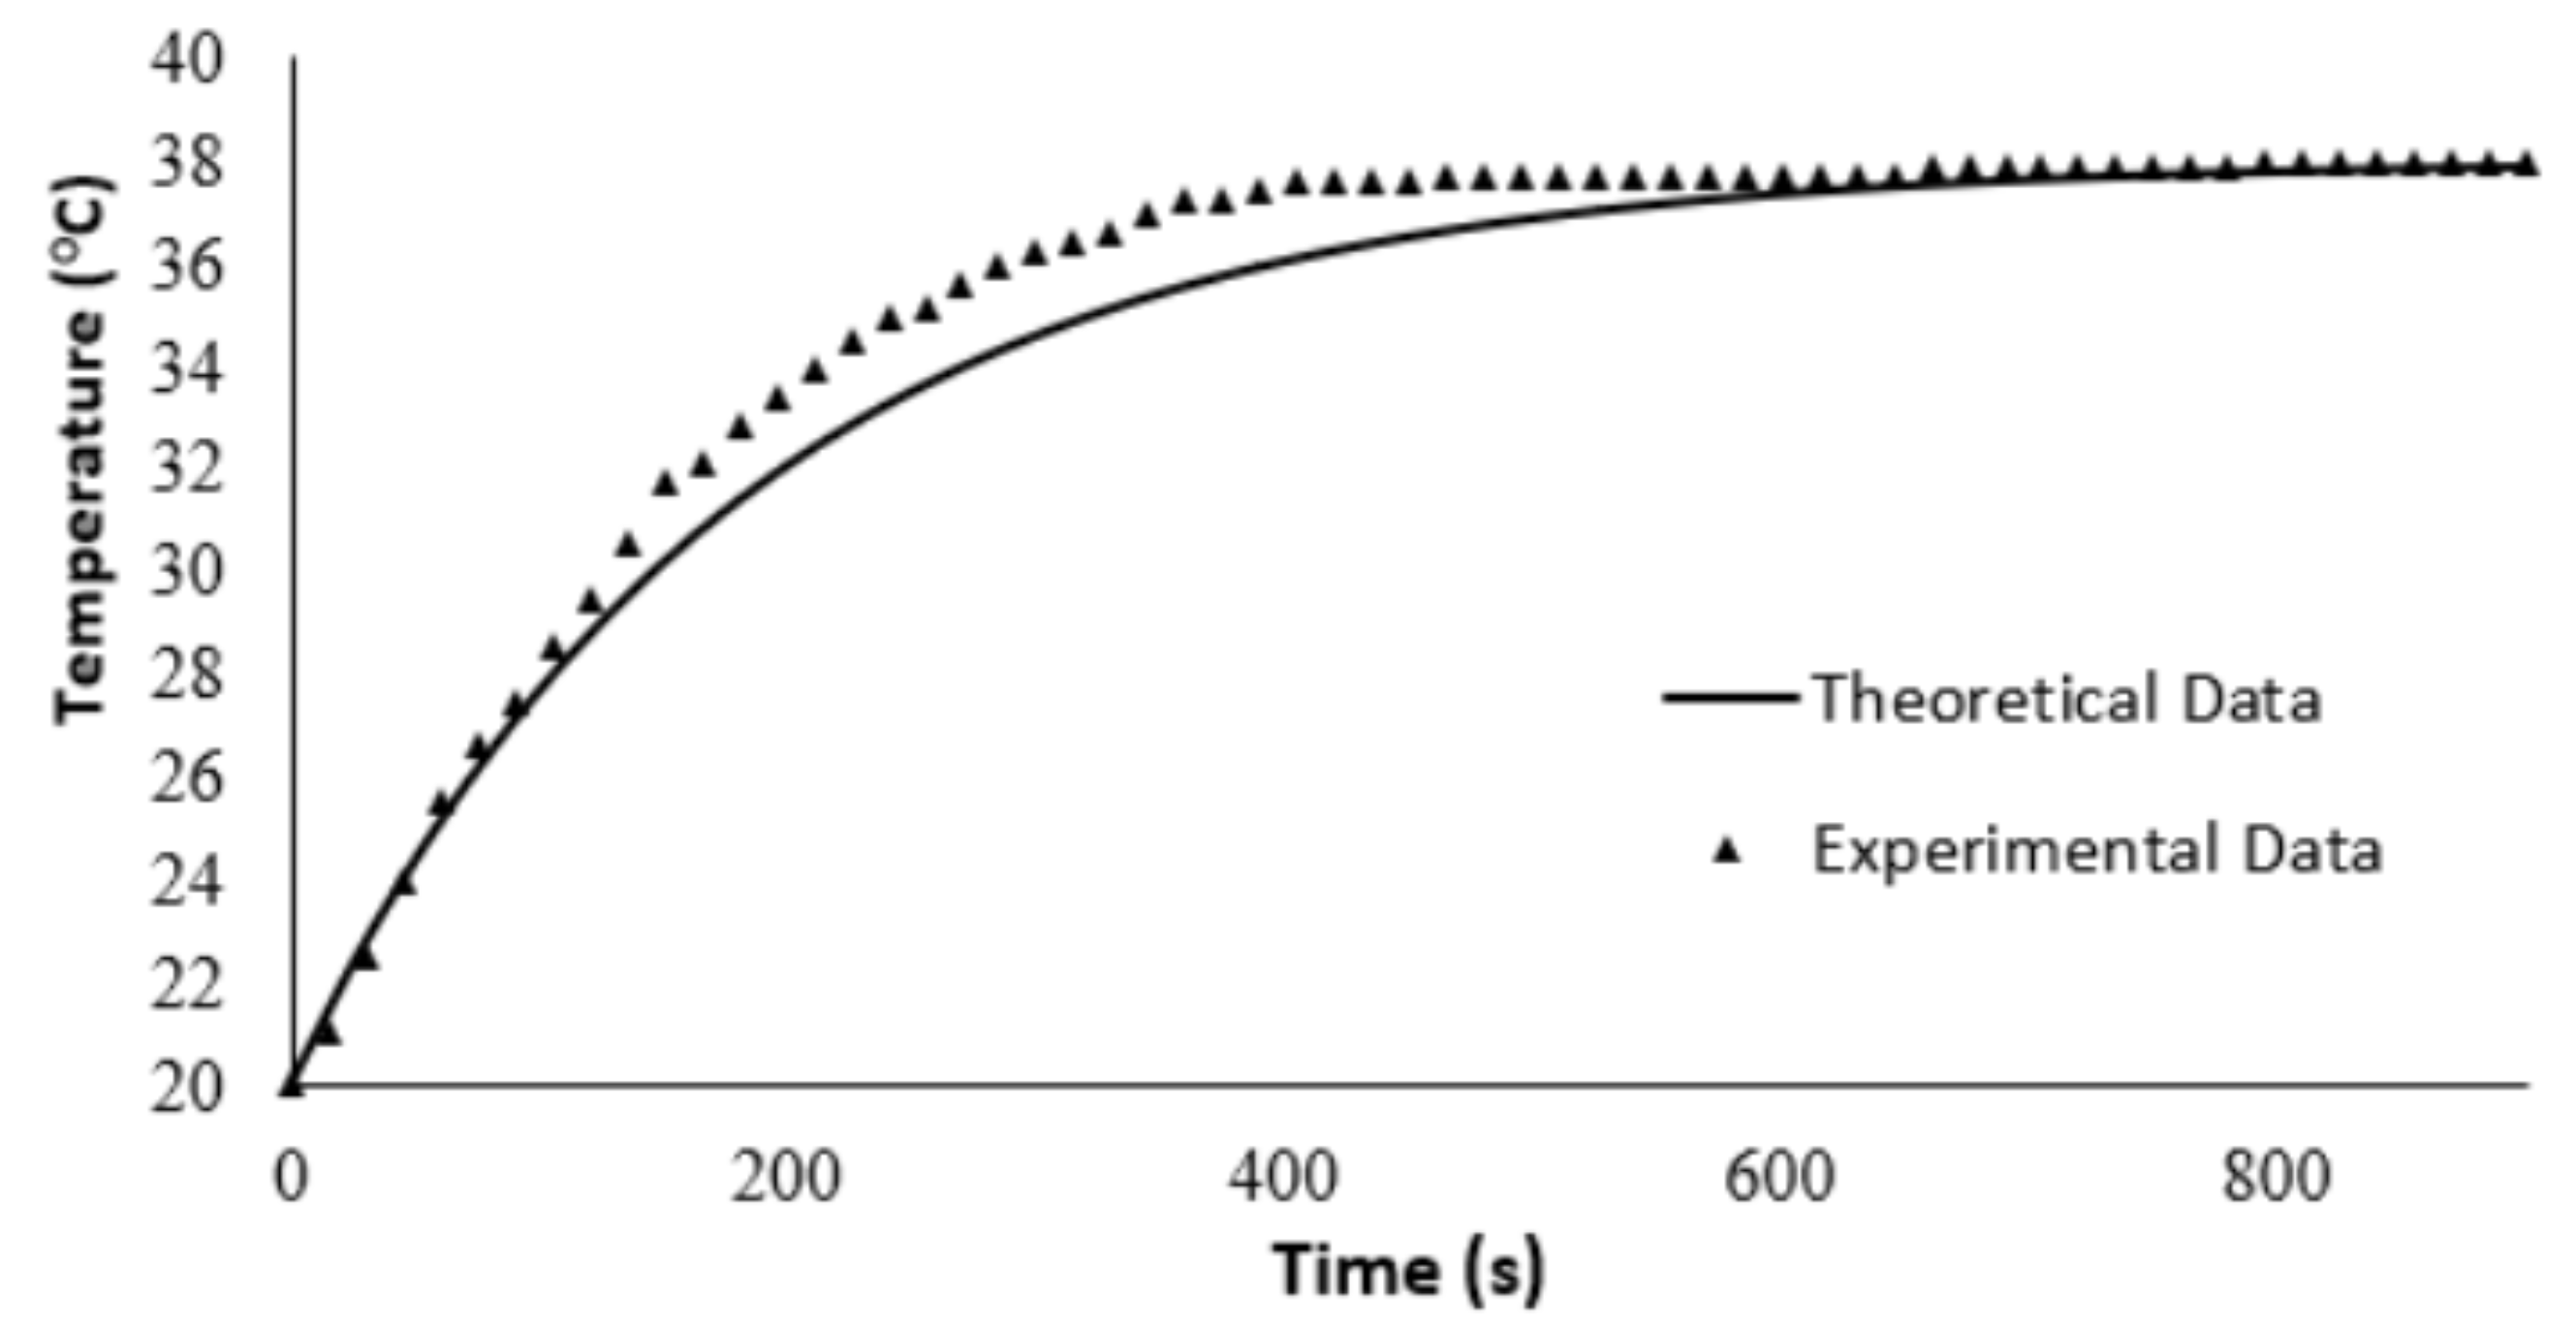
26].
where K is calculated according to Equation (10).
Based on the recommended hot water outlet temperature, a global heat transfer coefficient of 0.5 was used [
27]. The thermal system was simulated using Polymath
® software, applying the Runge-Kutta 45 (RKF45) numerical method.
2.3. Control System and Data Acquisition
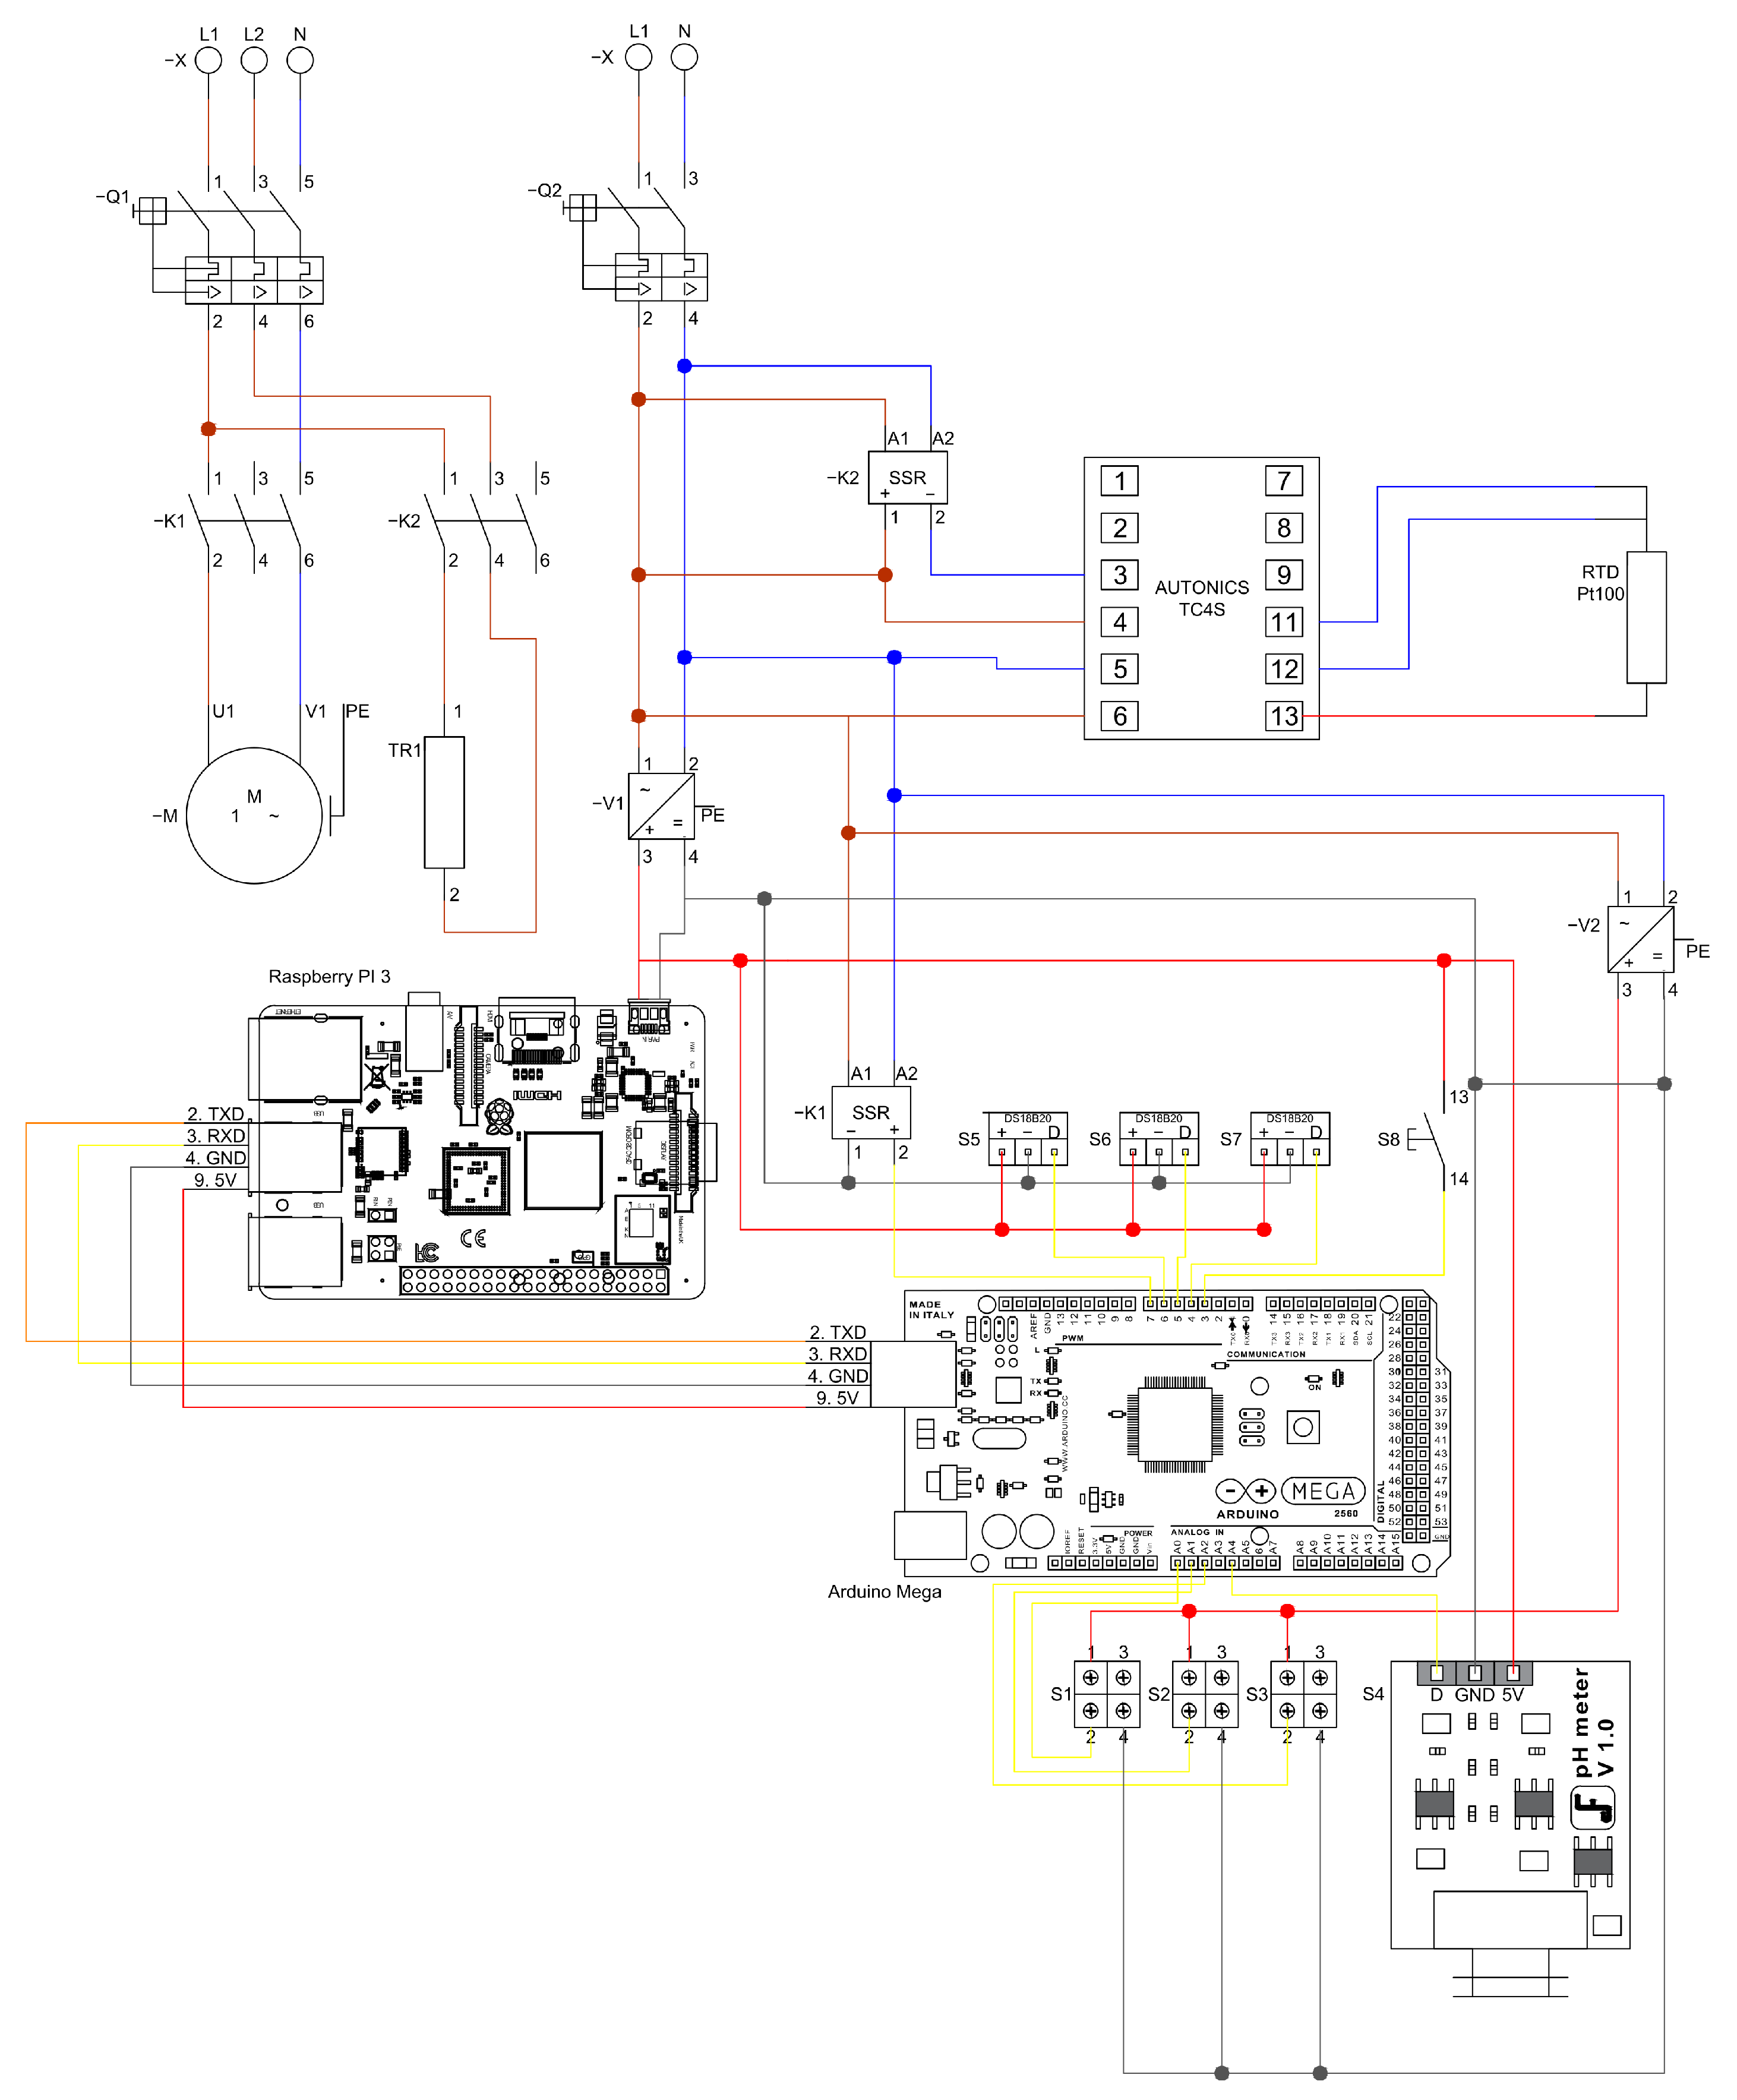
The control and data acquisition system consists of two control loops, as shown in
Figure 4. The first loop, managed by PLC1 (Arduino Mega2560 and Raspberry Pi 3, Somerville, MA, USA), controls the on/off state of the recirculation pump to maintain the internal reactor temperature at the selected set-point. It also receives analog and digital signals from the pressure sensor (Wika/Eco-1, Klingenberg am Main, Germany), pH sensor (Dfrobot/Sen0161, Shanghai, China), and a homemade flow sensor developed at UPB-UL.
The second loop, operated by PLC2 (Autonics TK4 series), manages the heating system. This loop maintains a higher set-point than the reactor’s internal temperature and regulates a 300 W electric heating resistance using an RTD Pt100 temperature sensor. The temperature sensor used in the system is a Dallas/DS18B20 by Analog Devices (known befores as Maxim Integrated/Dallas Semiconductor), in Wilmington, MA, USA, and the heating circuit is controlled through contactors ABB/A110-30-11 (AC1) and LC1/D09 1G (AC2). The complete power and logic wiring diagram is shown in
Figure 4, accompanied by a nomenclature table describing the referenced components.
Figure 4 illustrates the configuration of the control and power system. At the top, the connection of the pump motor along with its respective protective devices is presented. On the right-hand side, the single-line diagram of the alternating current supply system is shown, together with the corresponding AC–DC converters. In the central section, the high-level control unit implemented through a Raspberry Pi board is displayed on the left, while on the right, the data acquisition system managed by an Arduino ATMEGA board is depicted. At the bottom, the connection of the pH meter is indicated. Surrounding the data acquisition system, the figure also details each of the sensors integrated into the system. The colors on the lines are only to visually differentiate the connections.
2.3.1. Temperature Sensors Connection to PLC1
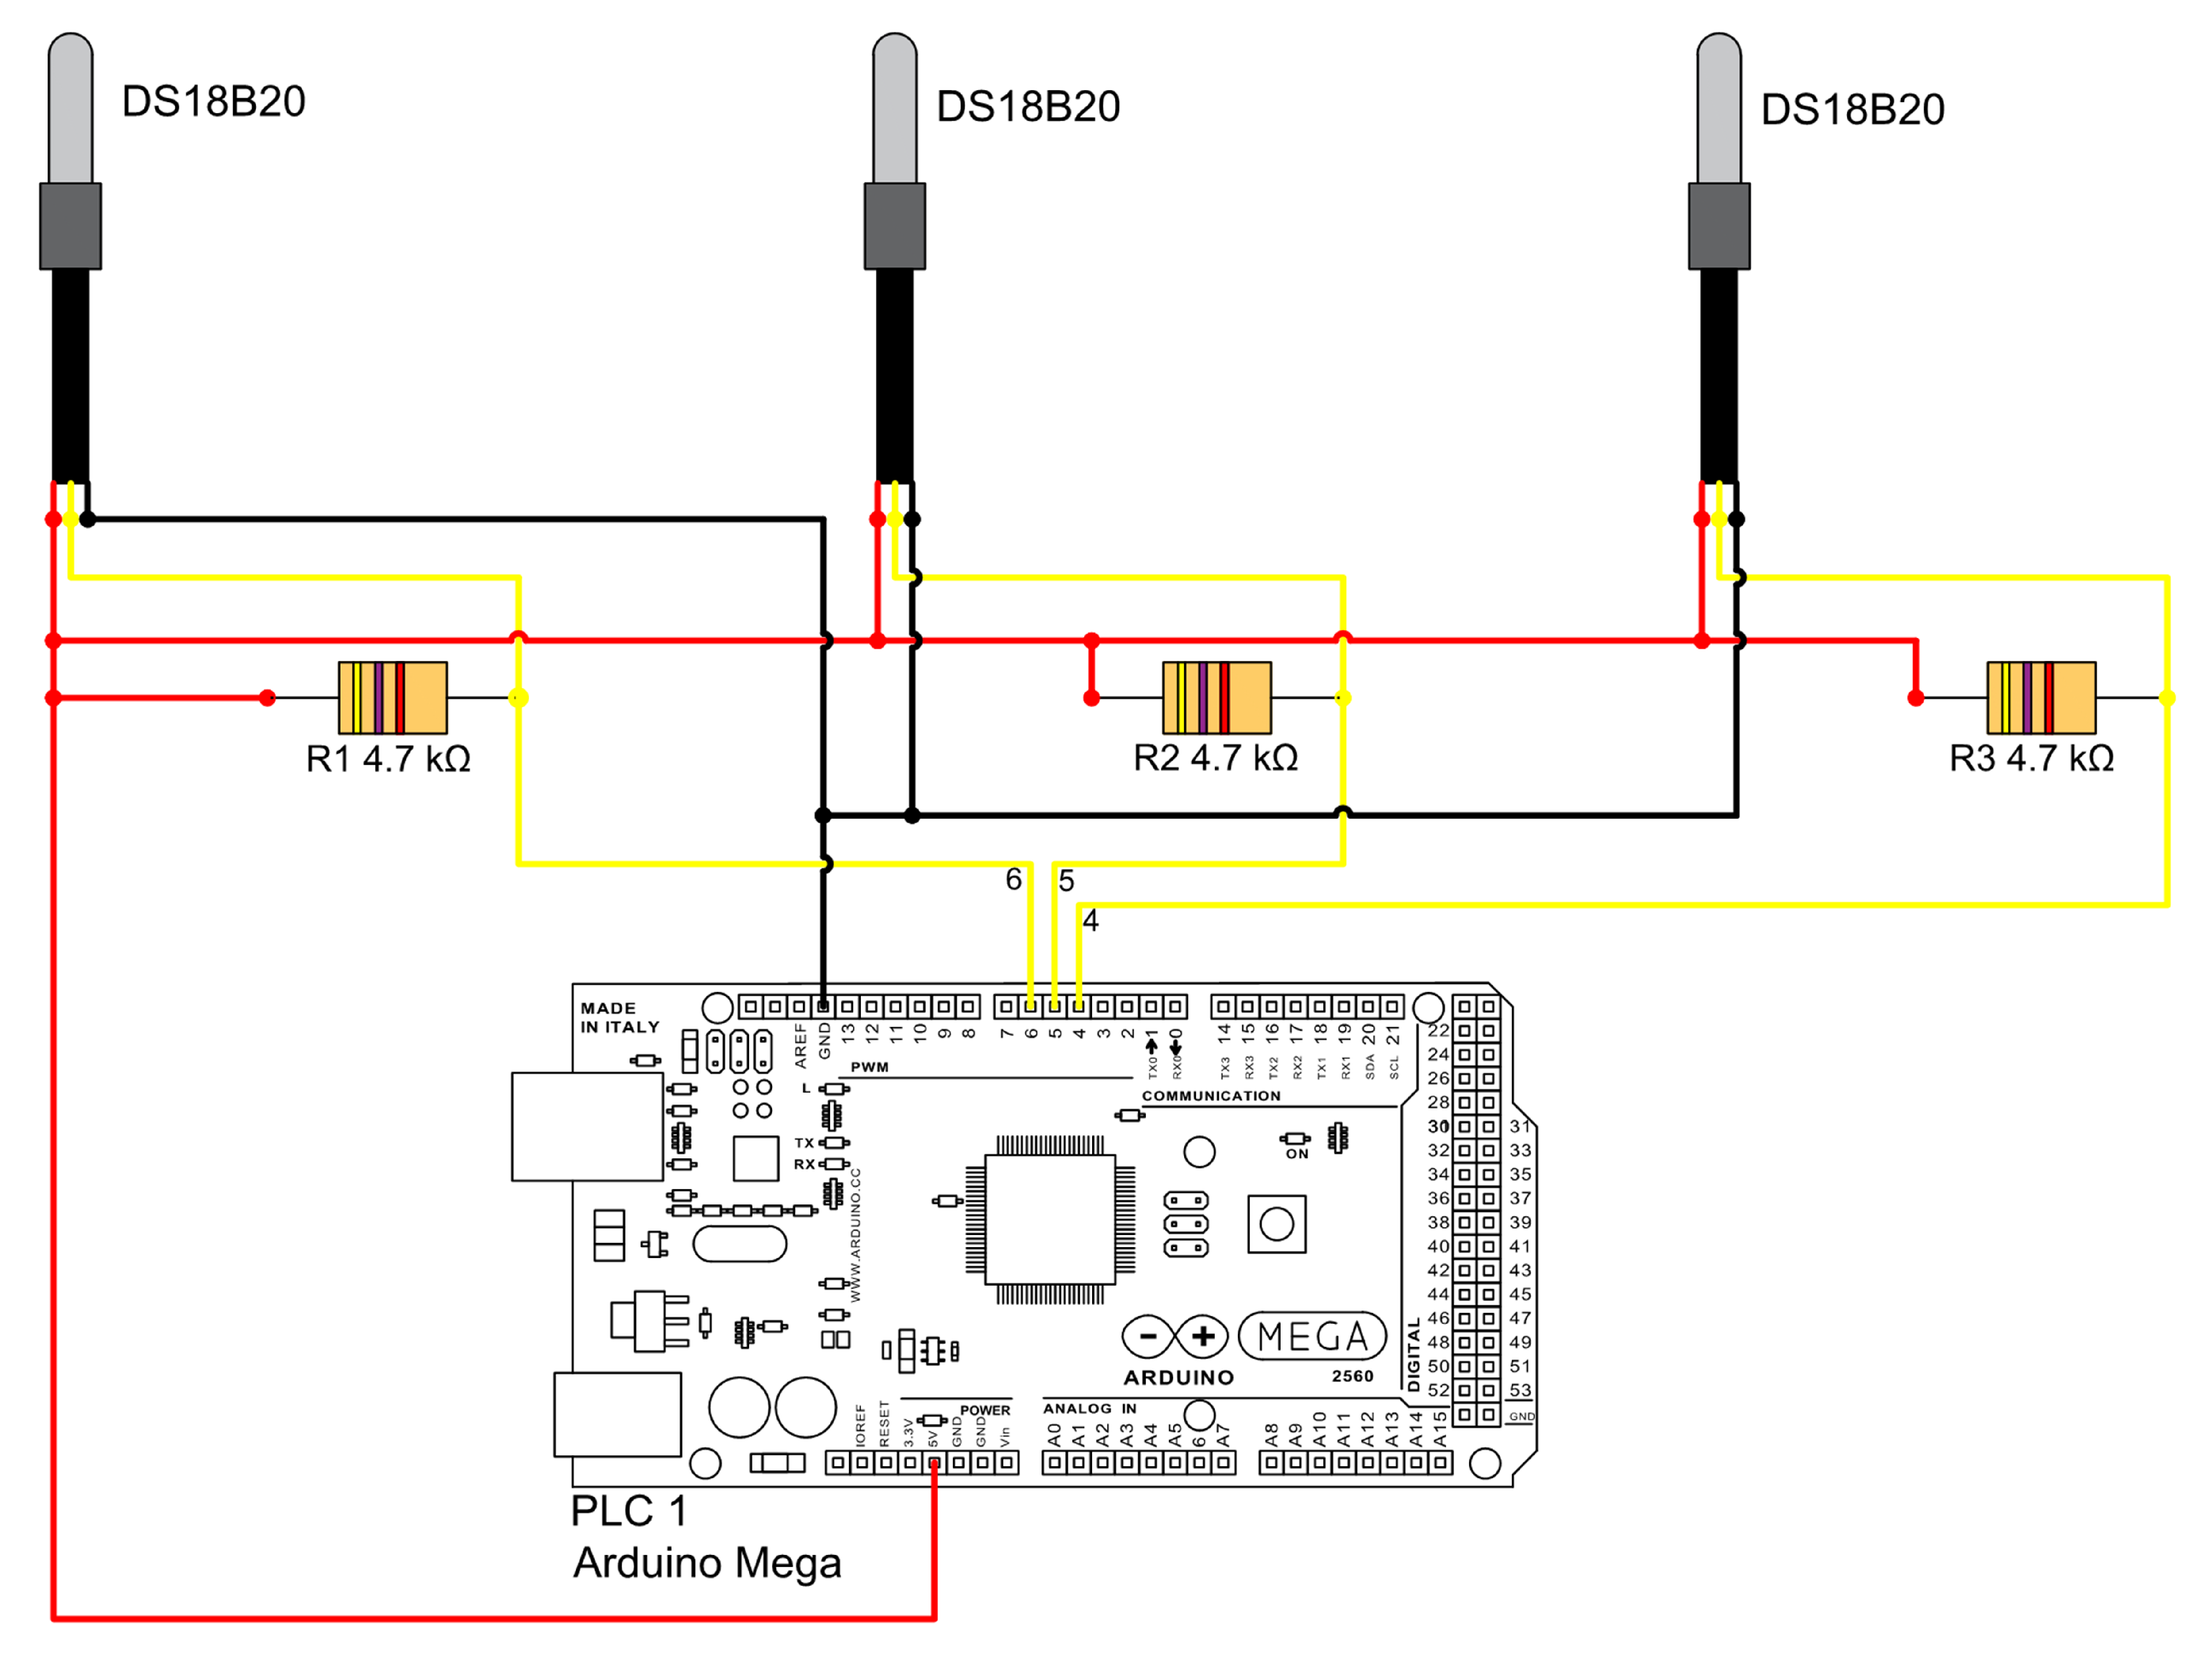
The digital temperature sensors (Dallas, DS18B20) are connected to the Arduino Mega 2560 via digital ports 4, 5, and 6, assigned to reactors 1, 2, and 3 respectively, as shown in
Figure 5. These sensors transmit data in binary format, which is converted to decimal using the corresponding sensor library [
28,
29]. The sampling interval is set to 1 s, with the program outputting the average temperature every 30 min. As in the previous diagram, the color of the lines is not intended to distinguish any particular element.
2.3.2. Pressure Sensors Connection to PLC1
The pressure sensors (Wika Eco-1), which measure a range of 0–15 psig, transmit a 4–20 mA analog signal and require a 24 VDC power supply. They are connected to PLC1 through analog ports A0, A1 and A2 (
Figure 6). To convert the signal to 0–5 VDC, 220
resistors were used. The ground terminals of the 24 VDC and 5 VDC power sources are unified to prevent sensor or equipment malfunction. The color of the connection lines does not differentiate any element.
An analog manometer (Test Gauge, PGS-35L-30, Palmetto, FL, USA) was used to calibrate the pressure sensors. Equation (11) was applied for the 0–3 psig range, while Equation (12) was used for measurements between 3–15 psig. Based on prior experience with similar calibration approaches, this method provides a reliable way to validate sensor performance.
2.3.3. pH Sensor Connection to PLC1
For pressures below 3 psig, a polynomial linear regression was used to obtain the calibration curve, while for pressures above 3 psig, a simple linear regression was applied [
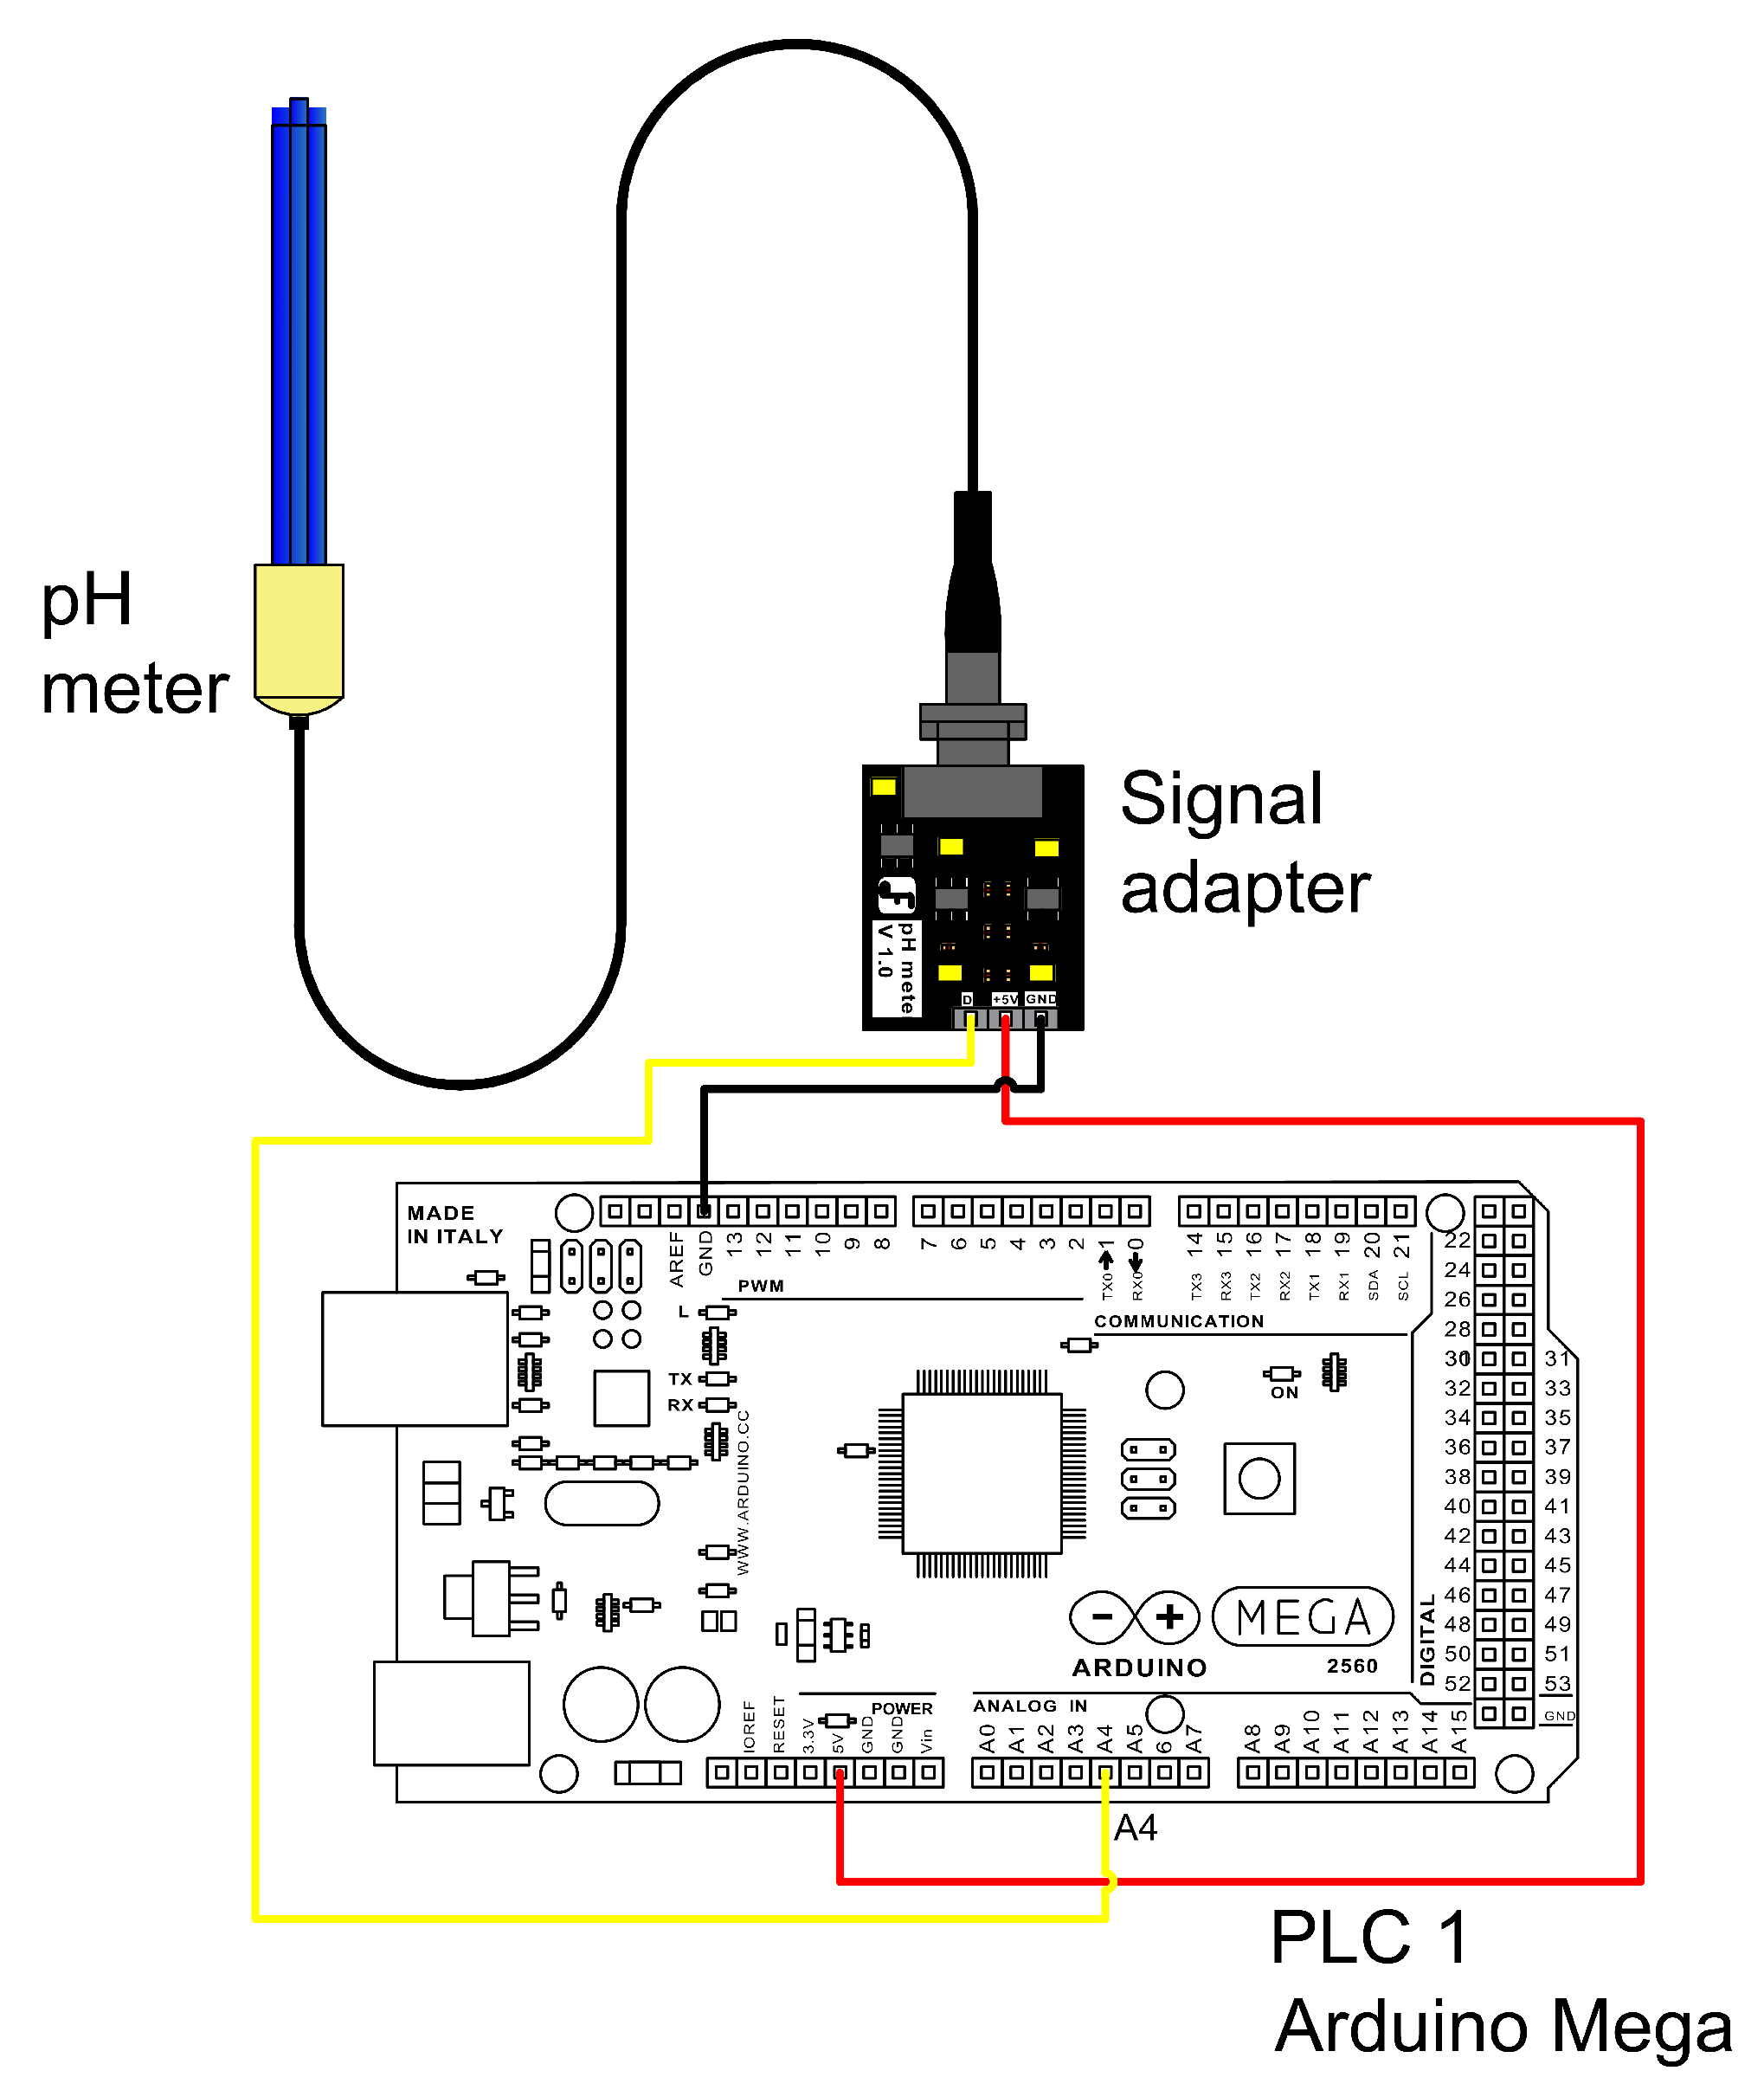
30]. The pH sensor (DFRobot
®, SEN0161) emits a 0–5 VDC analog signal and is connected to analog port A4 of the Arduino. It is powered by a 5 VDC supply from the Arduino itself (
Figure 7). The color of the connection lines does not differentiate any element.
The calibration curve for the pH sensor was developed using Equation (13), as recommended by the manufacturer [
31].
2.4. Control System Using the PLC1 for the Pump Operation
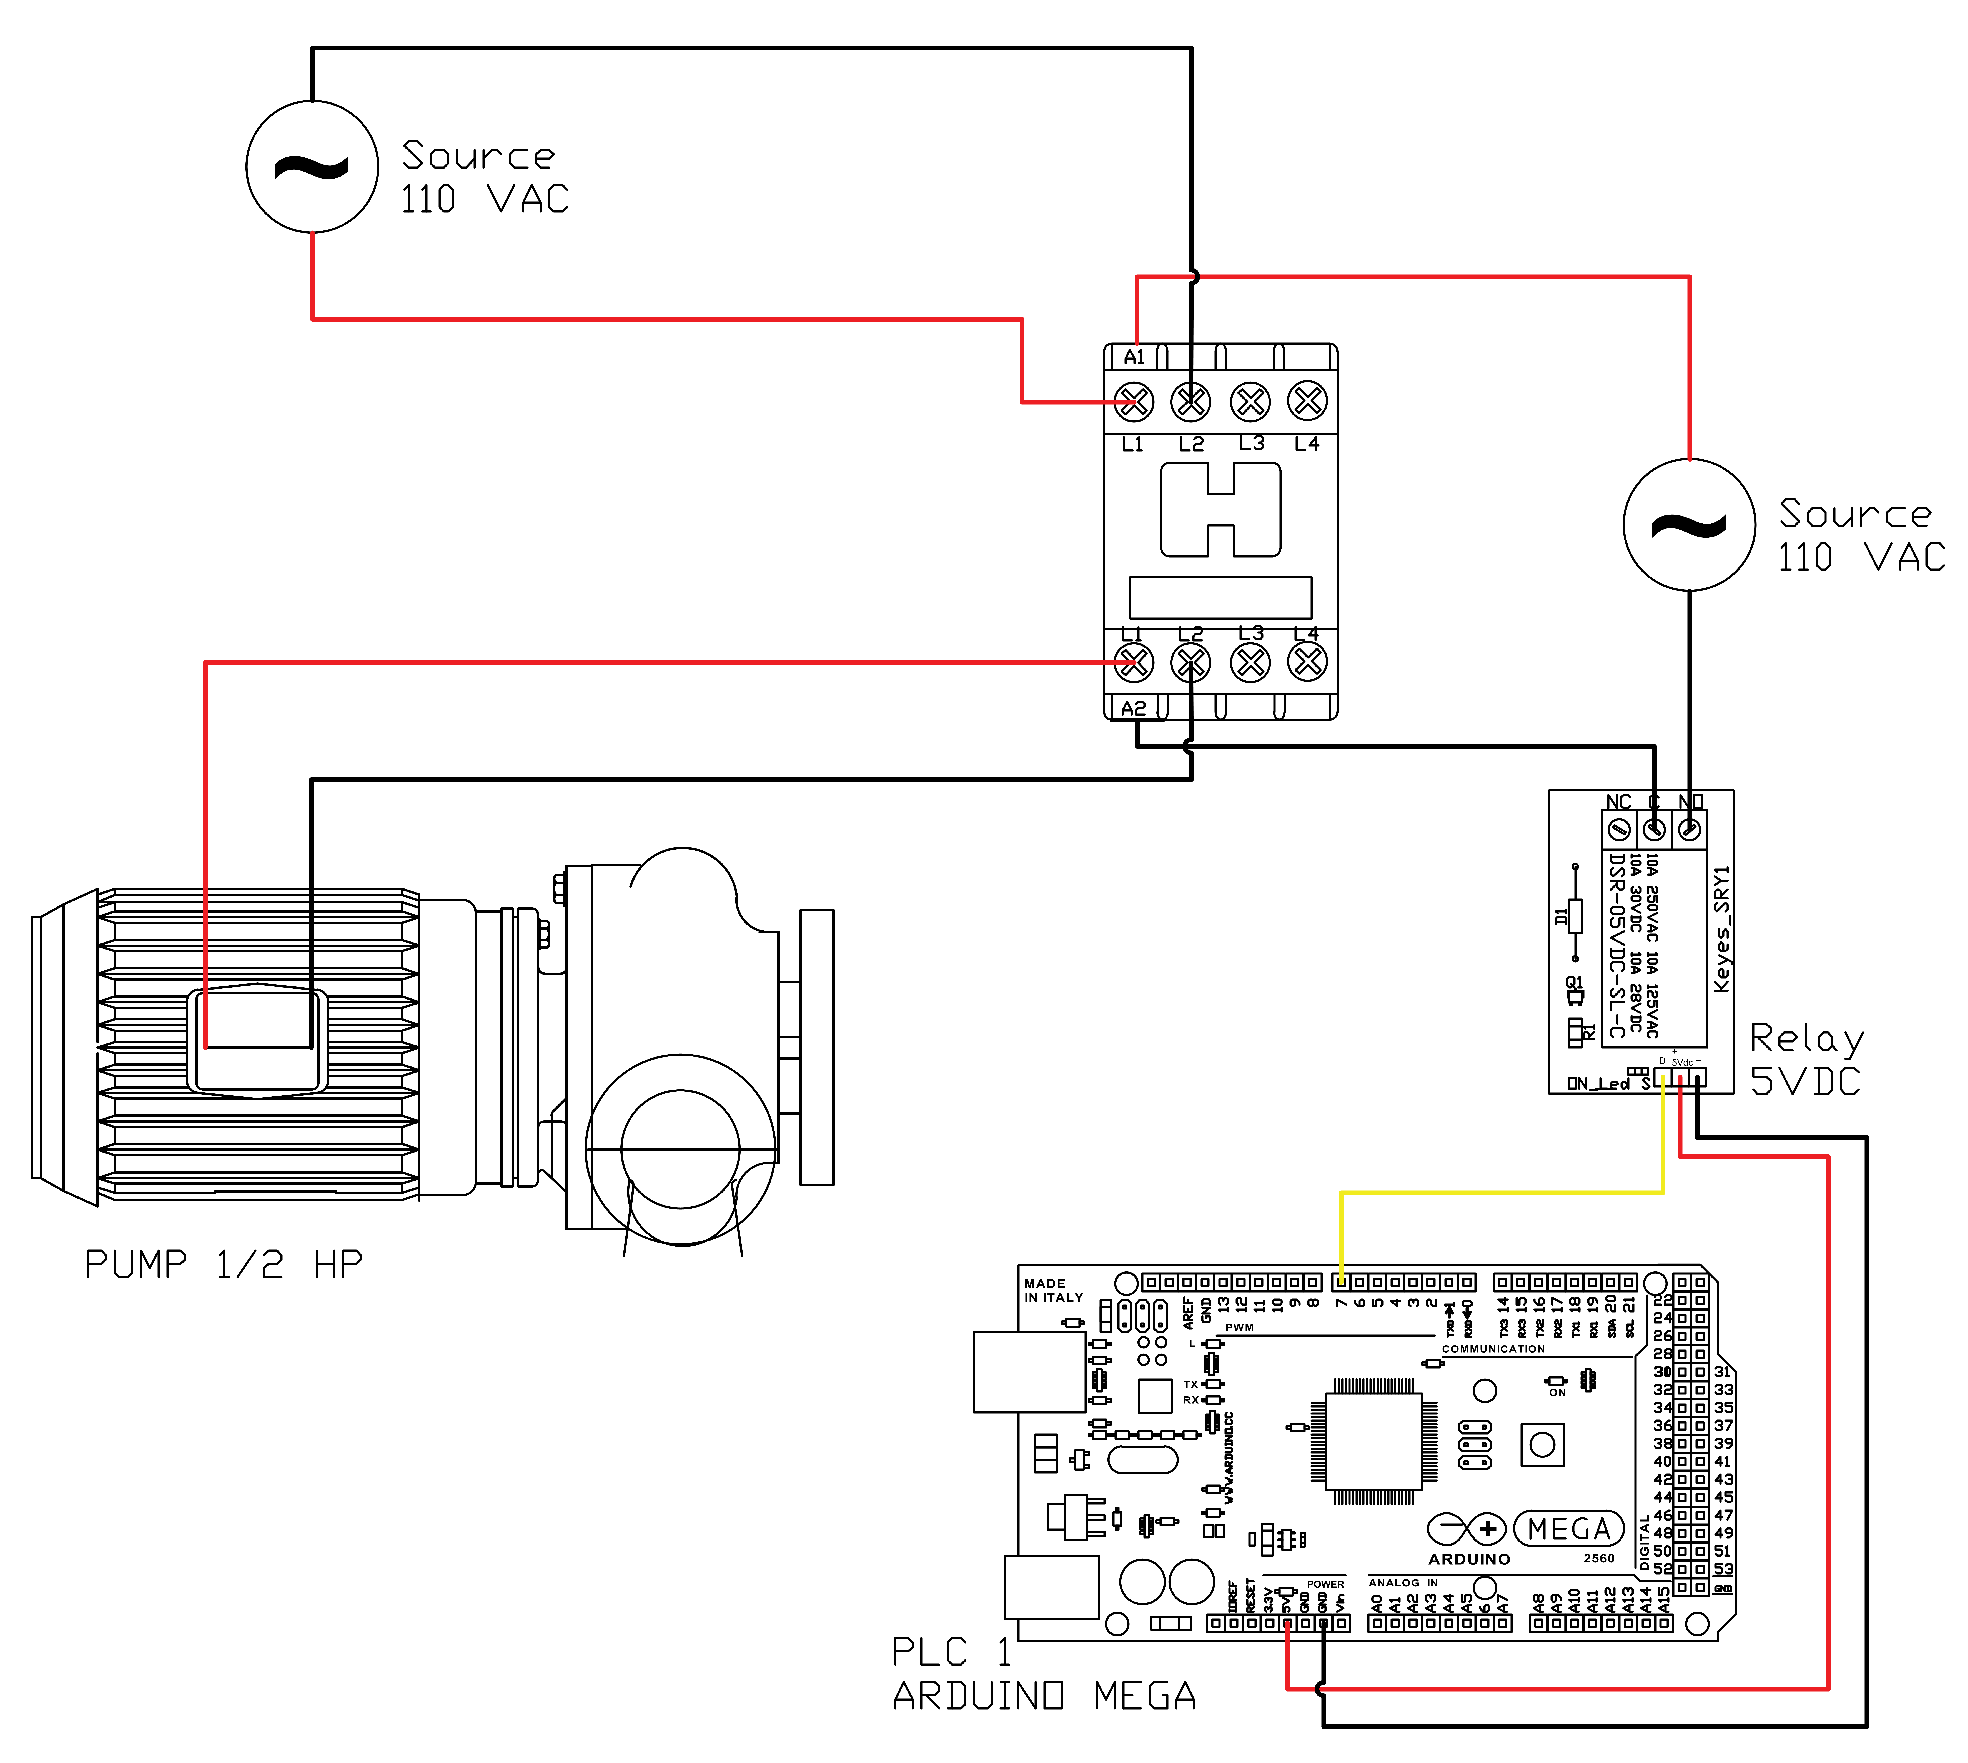
The On/Off pump control, managed by PLC1 (
Figure 8), regulates the internal reactor temperature. BMP tests are typically performed under mesophilic conditions (35 ± 2 °C) [
32], but the prototype also supports operation at 55 °C and could be adapted for psychrophilic conditions with minor modifications. The colors of the connections are not meant to indicate any difference.
2.5. Flow Sensor for the Biogas Produced
Technological surveillance was conducted to develop a flow meter suitable for low biogas production (0.01–1 L/min). Koch et al. reported less than 5 % difference between manometric and gravimetric methods [
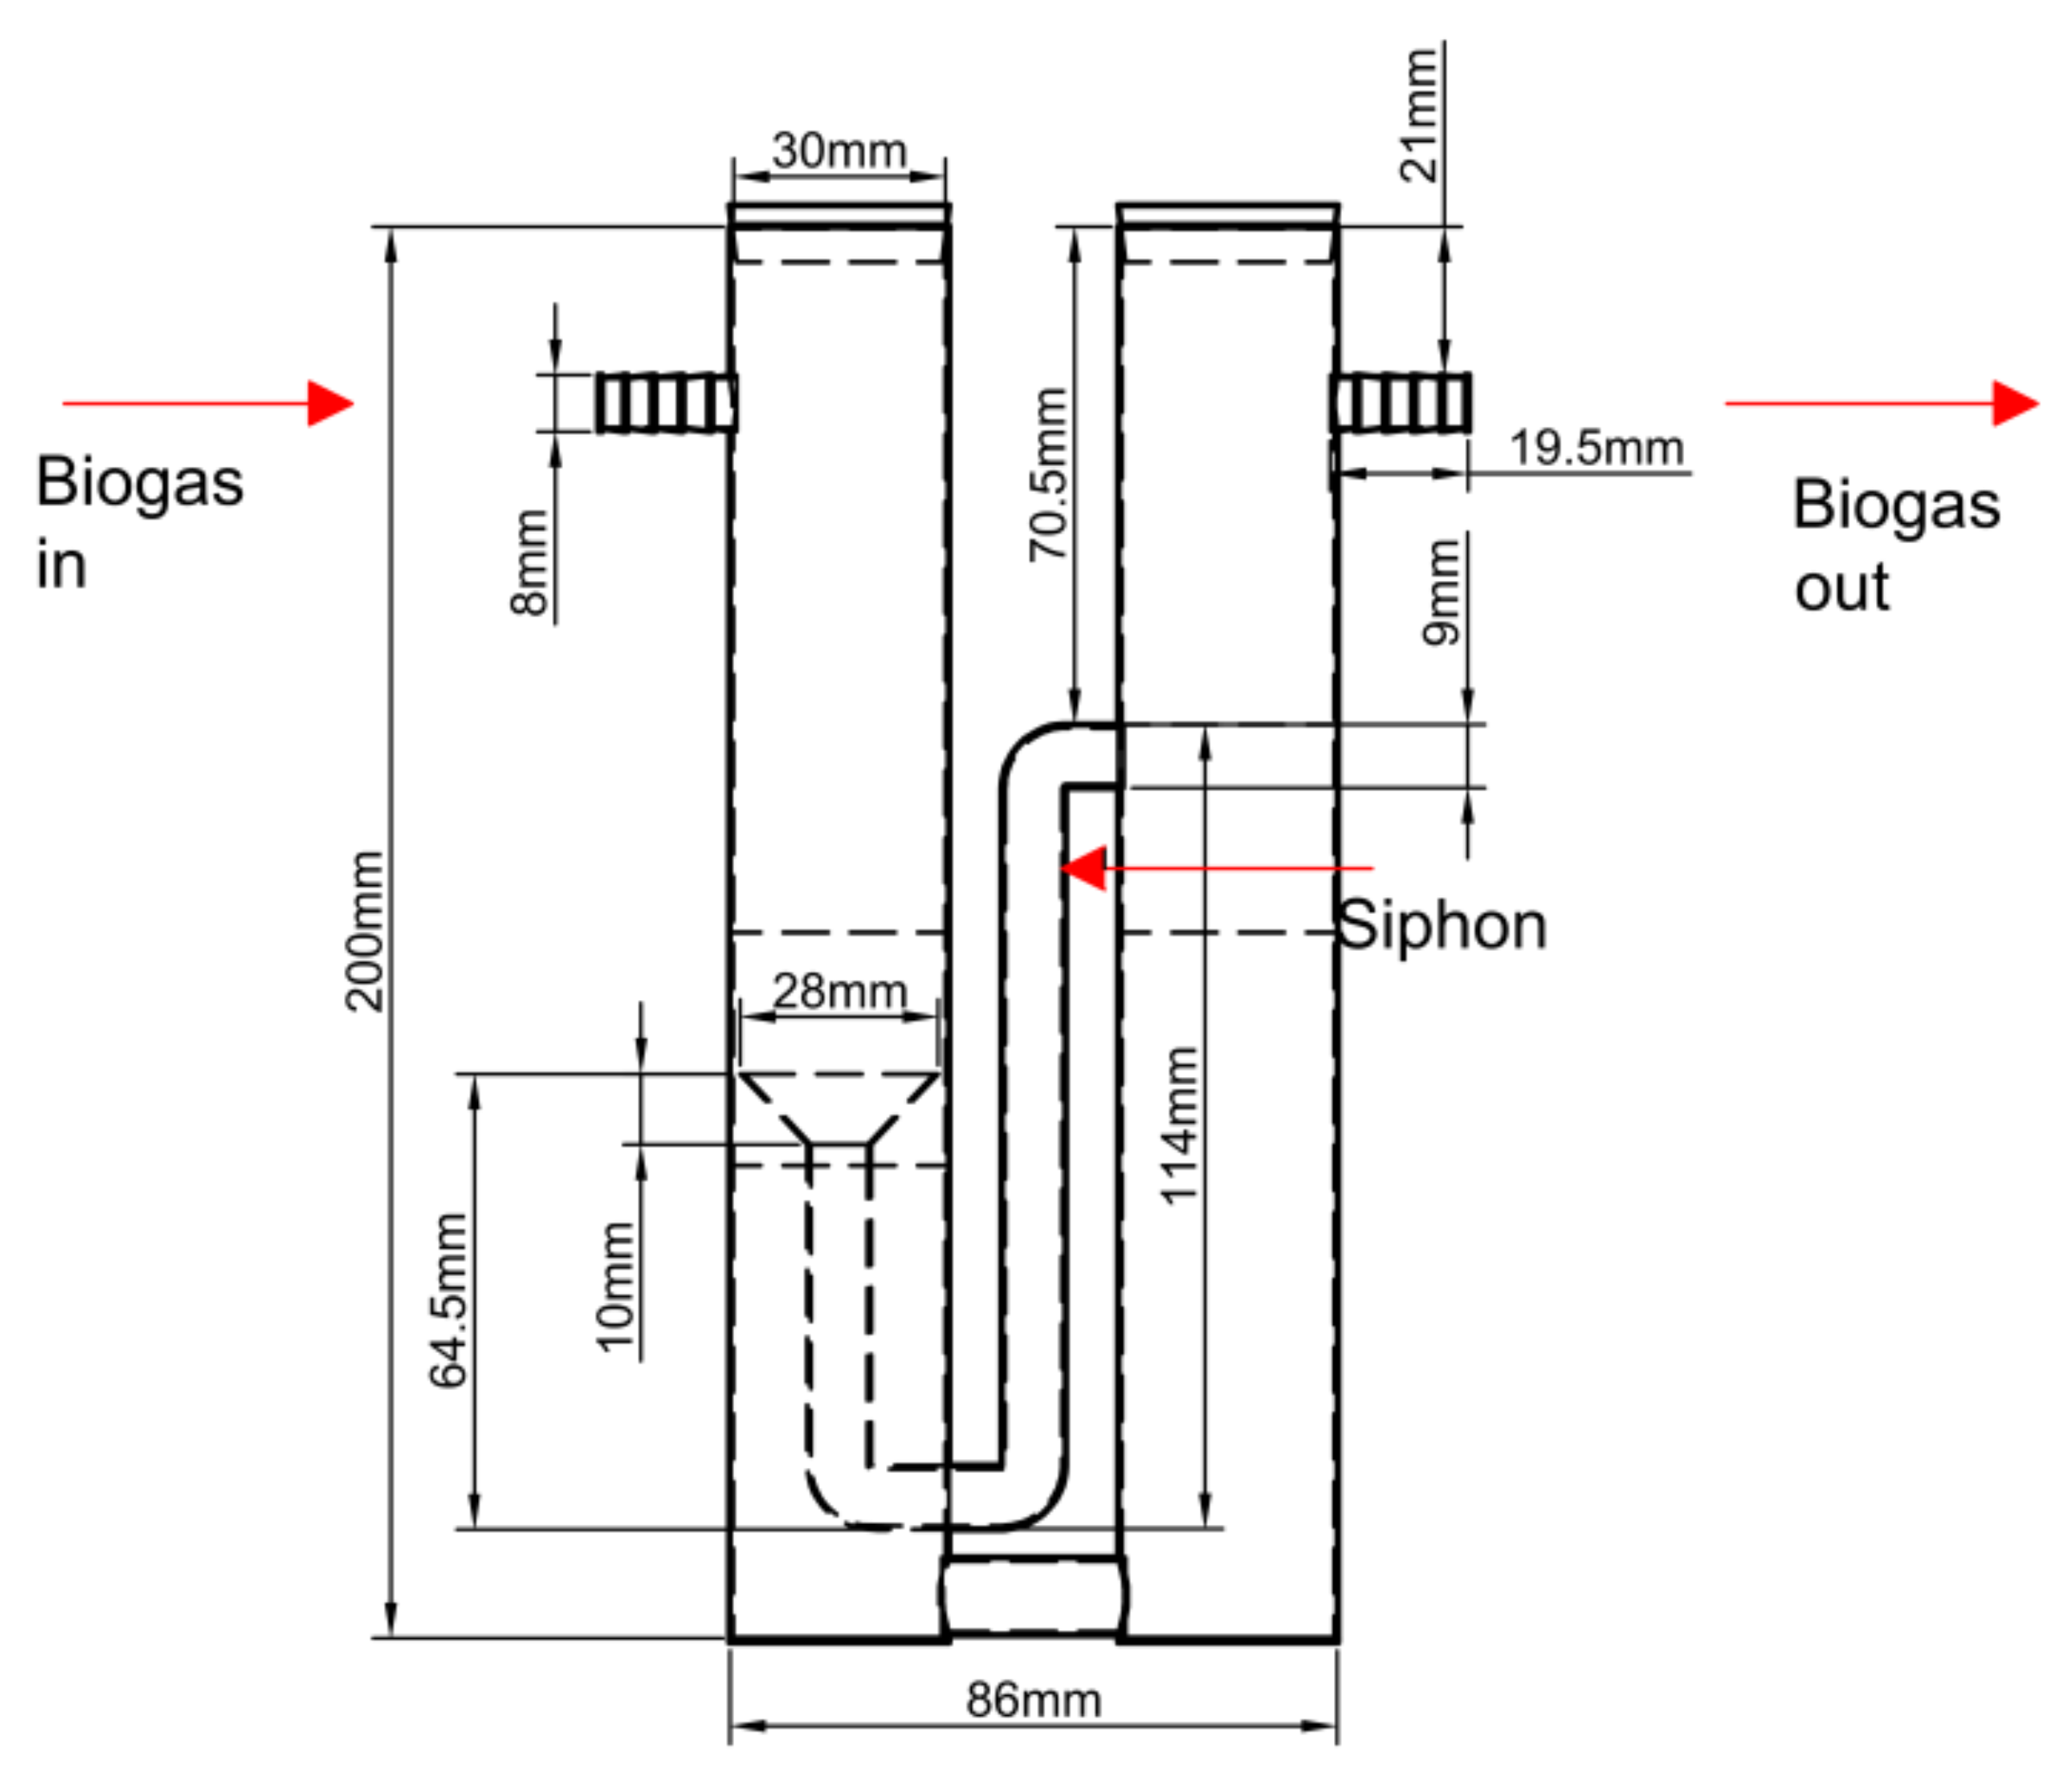
33]. In this study, a siphon-based displacement flow meter designed by the IRENA group at the Universidad de León was used (
Figure 9).
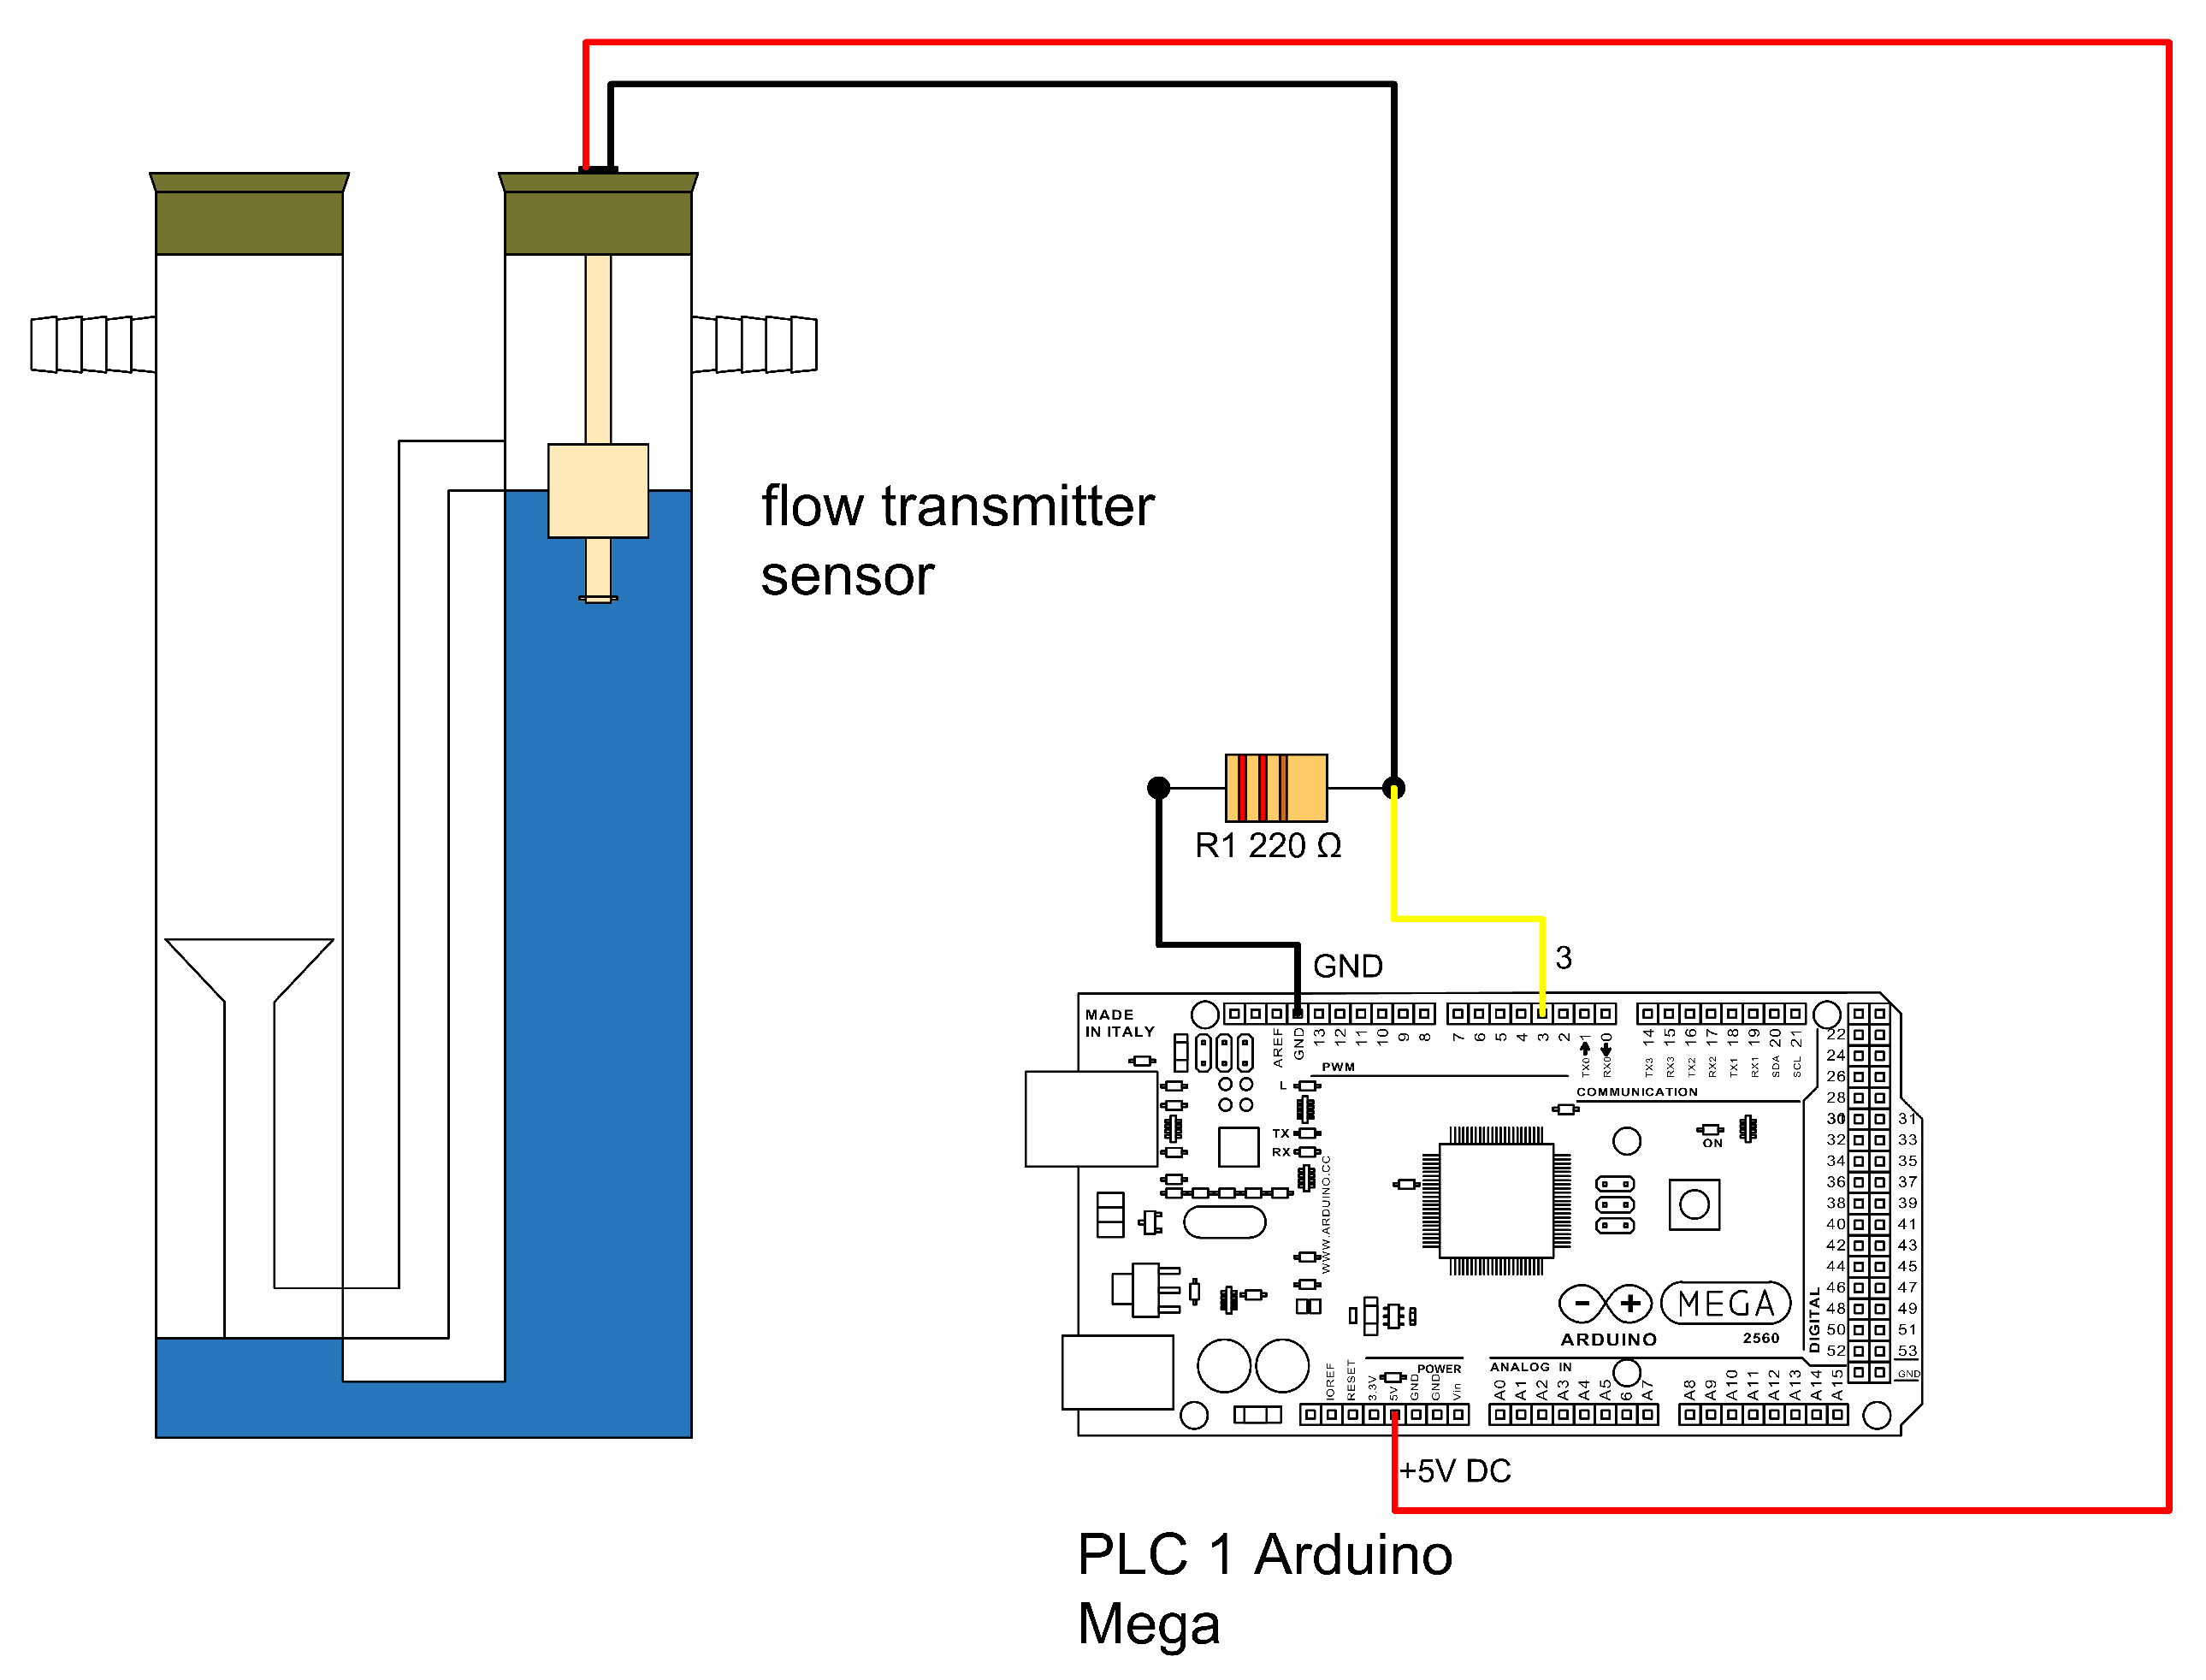
The flow meter operates by detecting pressure increases in the left compartment due to biogas production from the reactor. This pressure displaces water through a siphon into the right compartment. When the water in the right compartment reaches a maximum level, an electronic circuit registers a count, after which the water returns to the left compartment and the cycle repeats. The count signal is sent to PLC1 (
Figure 10), where it is processed and stored. The colors of the connections are not meant to indicate any difference.
Daily samples were collected from the headspace of the reactors and analysed by gas chromatography (GC) using a GC Agilent 6890A from Agilent Technologies, in Santa Clara, CA, USA, which was equipped with HP-PLOT/Q and HP-MOLSIEVE columns, in order to determine the concentrations of methane, carbon dioxide and other trace gases [
25].
2.6. PLC2 Connection to Control the Temperature in the TALT
Temperature control was achieved using an Autonics TC4S temperature controller, an RTD pt100 sensor (as mentioned before, it is a Dallas/DS18B20 by Analog Devices (formerly Maxim Integrated/Dallas Semiconductor), based in Wilmington, MA, USA) and a 1.5 kW electric resistance. The ABB AF30-0013 contactor, activated by a universal relay ABB CR-U230AC2, controls the resistance. As shown in
Figure 11, the electric resistance is triggered by the controller’s ignition coil through pins 3 and 4, maintaining a stable temperature according to the selected temperature control set-point. All connections serve the same purpose, regardless of their color in the diagram.
2.7. PLC1 Configuration
PLC1 consists of an Arduino Mega 2560
® (AM2560) and a Raspberry Pi 3 Model B
® (RBP3), which includes additional USB and Ethernet ports [
34]. The two devices are connected via a USB cable, as shown in
Figure 12. The Arduino is powered through this cable with 5 VDC supplied by the Raspberry Pi, which also enables data communication. A serial protocol at 9600 bps was configured, using four lines: pin 2 for transmitted data (TXD), pin 3 for received data (RXD), pin 4 for ground and pin 9 for voltage. The Arduino was configured using the free Integrated Development Environment (IDE) available on the Arduino website [
35] and programmed using an object-oriented programming language.
2.8. Raspberry PI 3®
Configuration to Data Storage
The Raspberry Pi 3
® was used to capture and store data from the Arduino Mega
® due to its easy integration, simple programming, versatile communication protocols, low cost and local availability. It was configured using the Raspbian
® operating system and the open-source software Node-RED
® by IBM
®, which enables a block-based interface for data acquisition and storage, as shown in
Figure 13. The numbers are intended to guide the sequence of steps for data management.
In the Node-RED® configuration: Node 1 establishes unidirectional communication between the Arduino Mega® and Raspberry Pi 3® via a 9600 baud serial port in STRING format; Node 2 converts the data from STRING to JSON; Node 3 introduces a 30-min delay to store one data point every 30 min; Node 4 converts the JSON to CSV format; and Node 5 assigns a local path for data storage.
2.9. Function Test, Manure Pig BMP Test
Once the prototype was built, a BMP test was conducted using pig manure as substrate and sludge from the San Fernando WWTP in Medellín-Colombia as inoculum. Both were characterized beforehand by analyzing Total Solids (TS) and Volatile Solids (VS) according to APHA standards [
36]. The substrate-inoculum mixture was prepared using a 2:1 VS ratio [
37], measured with an analytical balance, and adjusted with water to the final volume before being fed into the sealed reactors. Based on these values, the mixture was prepared with 178 g of pig manure, 107 g of WWTP sludge and 1.215 g of water to fill 90% of the reactor volume. Throughout the test, pH, temperature, flow and pressure were continuously monitored. The equipment was then activated for control and data acquisition. The test lasted 22 days at a set temperature of 37 °C. Every four days, methane concentration in the headspace gas was measured using a calibrated IMR 2800P biogas analyzer. Additionally, pH was adjusted using 1 M NaOH and monitored every 30 min. The results are presented below.
4. Discussion
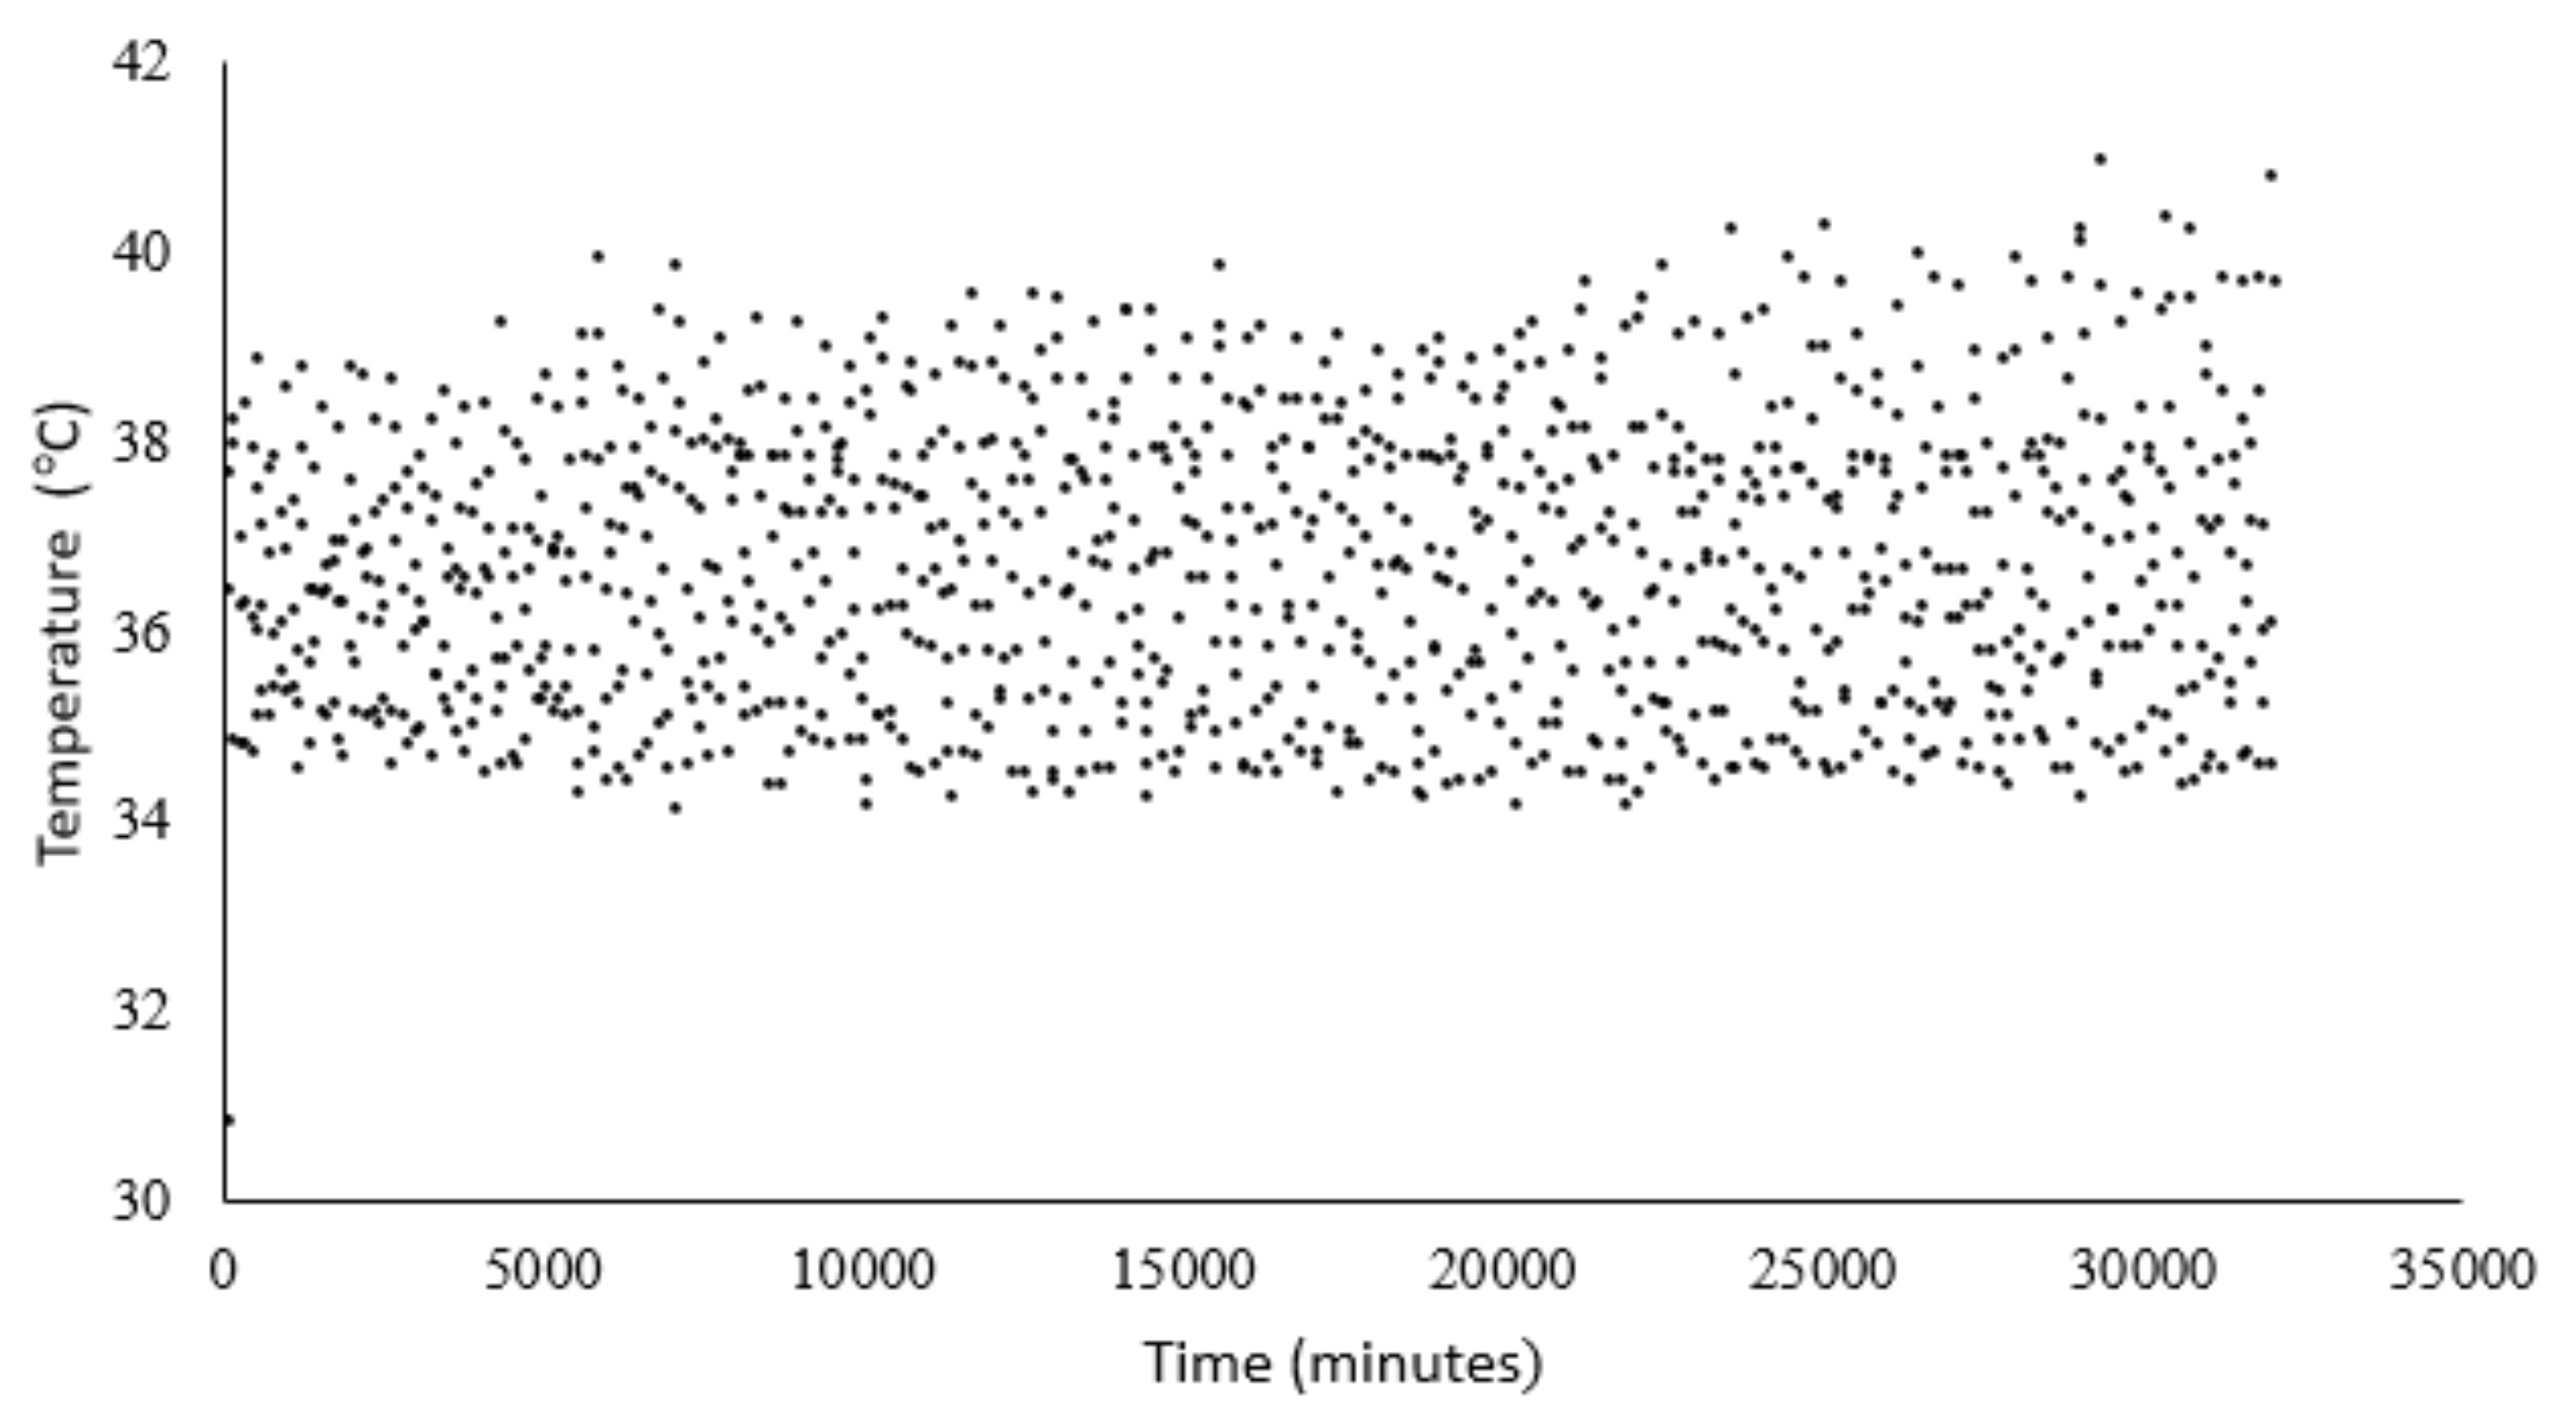
The prototype enables continuous pH monitoring, allowing correlation with daily or cumulative methane production and helping to prevent undesirable pH deviations during the test. Temperature, another critical parameter, was also continuously monitored and controlled, with a set-point of 37 °C. As shown in
Figure 18, the temperature fluctuated between 35 °C and 40 °C due to the use of an on/off control programmed in PLC1. Although this method can introduce greater variation compared to PID control, it reduces mechanical stress on the pump, the system’s main actuator. According to the data logged in the PLC, the pump was activated 96 times over the 22-day test.
The biogas production was measured continuously using two methods. The first one was an indirect method, calculated through the reactor pressure. This pressure can be transformed to standard volume using the combined gases law. The values of biogas were corrected to standard temperature and pressure (STP) conditions (25 °C and 100 kPa). The second one was a direct method. The level sensor shown in
Figure 19, which uses the ‘tipping bucket’ principle, was used. The liquid is displaced by the biogas in a specially designed chamber. The accumulated biogas production is shown for each reactor in
Figure 19. A similar behaviour of accumulated methane production in the three reactors can be observed. However, after 25,000 min, when the production start to decrease, the three tests show little difference.
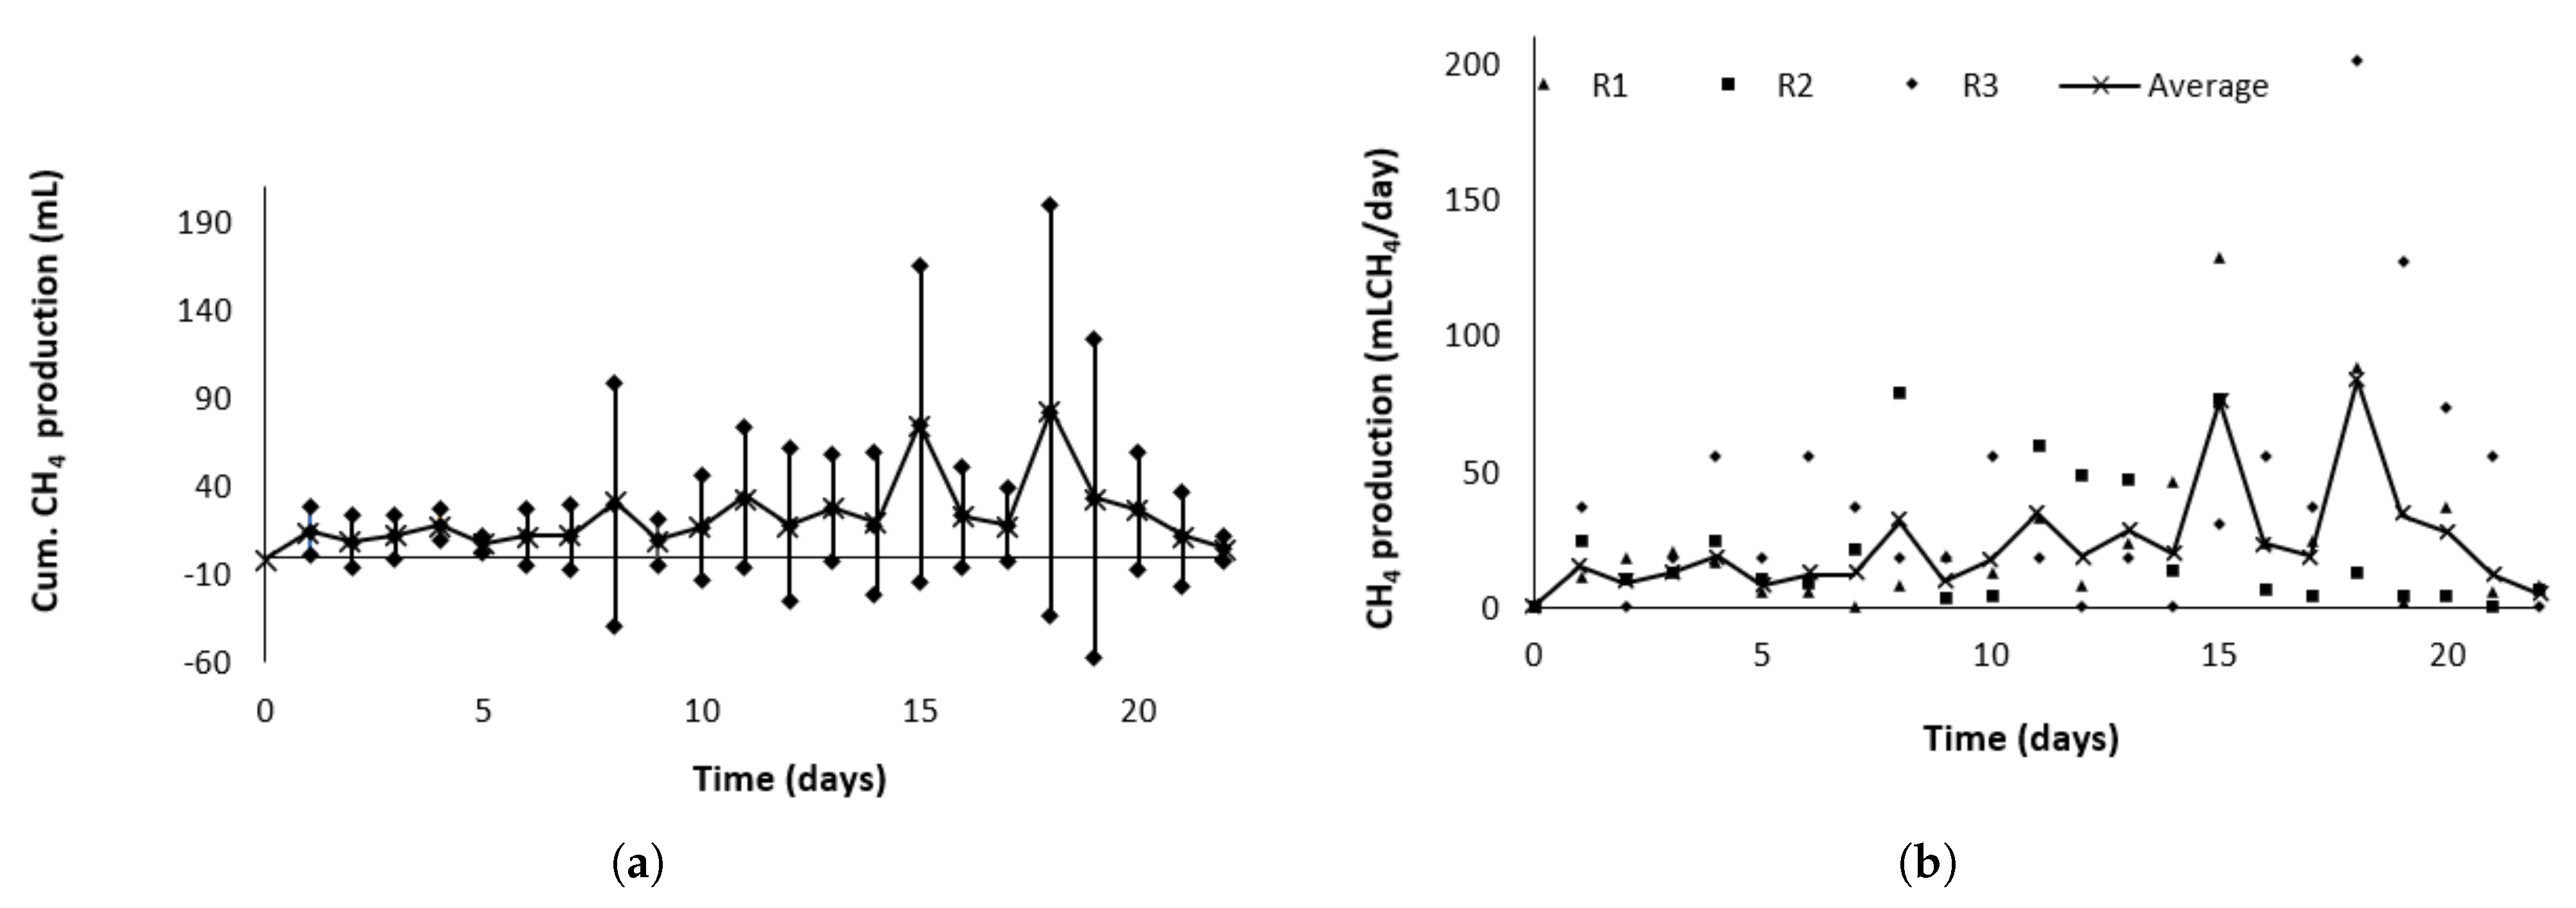
Figure 20a presents the average daily accumulated methane production with a 95% confidence interval, while
Figure 20b shows the daily accumulated methane production for each reactor. The average methane production during the test was 493.49
, with a specific production of 447.16
/kgVS and a standard deviation of 86.23
/kgVS. Compared to the 558
/kg VS reported by Hidalgo et al. for a similar substrate [
5], there is no statistically significant difference at a 5% significance level.
A study carried out in Colombia on pig manure reported values close to 437
/kg VS, almost identical to those obtained with the prototype. This evidence shows that the results are not only statistically robust but also comparable with other studies [
41]. Likewise, another study reported ranges of 0.29–0.53 m
3 /kg VS depending on biomass type and experimental conditions, which further supports the similarity of the study’s results [
42]. We agree that a broader validation against commercial BMP equipment, including multiple substrates, would further strengthen confidence in the system’s performance. In this study, however, validation was carried out for a specific substrate as a first step, which was consider relevant for demonstrating the functionality of the prototype.
Figure 21a shows the average daily methane production with a 95% confidence interval, while
Figure 21b presents the daily methane production for each reactor. A production peak is observed around day 15, followed by a decline attributed to a reduction in methane concentration—from 74% (
v/
v) on day 15 to 55% (
v/
v) by day 20. This drop may result from a decrease in methanogenic bacteria due to substrate depletion [
43]. This trend was used as the criterion to conclude the test, indicating that the peak methane production had been surpassed.
The comparison between the prototype and commercial systems is not straightforward, as it largely depends on the specific operating conditions and, above all, on the characteristics of the biomass being tested. In general terms, however, the prototype shows a more limited scope of use compared to the selected alternatives, mainly due to its simpler system for gas collection, storage and data analysis. Furthermore, while the commercial systems employ sensors specifically designed to ensure high-quality operation under standardized conditions, the prototype relies on more basic and accessible sensors that, although functional, are not necessarily specialized for biogas applications.
In
Table 6 [
44,
45,
46,
47] some differentiating points can be identified regarding the scope of the commercial products compared.
In substrates that are dilute and already well dispersed, mechanical mixing may provide little additional benefit. Rojas et al. [
48] reported that in highly diluted media, the contact between bacteria and substrate was sufficient without mixing, achieving similar yields to agitated systems as long as the inoculum was active and capable.
Although literature indicates that agitation can be omitted in systems with dissolved or well-dispersed biomass, it would still be ideal to compare biogas production with and without mixing in the prototype. This comparison would provide a clearer understanding of the process dynamics and confirm whether the absence of agitation affects performance under the specific operating conditions of the system.
5. Conclusions
The prototype developed enables the standardization of the BMP test for easily biodegradable substrates by ensuring homogeneity in operation through its design, configuration, and layout. It maintains stable critical variables such as temperature (automated) and pH (manual), thanks to a real-time electronic data acquisition and control system. Reactor sizing followed heuristic criteria, resulting in a total volume of 2 L, and construction was achieved using SCH 40 stainless steel commercial pipe sections. The heat exchanger design accurately matched expected behavior, with a standard deviation of 1.8—acceptable for this type of test.
The use of open-source and prototyped electronic devices proved effective for monitoring anaerobic digestion. Sensors for pH and temperature ensured process stability, while pressure and flow sensors enabled biogas quantification. A major advantage is continuous data availability, which facilitates later analysis and opens the possibility for remote monitoring via IoT tools, allowing future scale-up.
During the BMP test, variations in pH (6–7) and temperature (35–40 °C) were monitored in real-time. The system’s temperature control, managed by an Arduino-Raspberry Pi set-up, demonstrated energy efficiency, with only 96 pump activations over 22 days. Biogas production measured both directly (displaced volume) and indirectly (pressure) showed no statistical differences, validating both methods.


