1. Introduction
After cellobiose, starch constitutes the principal heterogeneous polysaccharide in nature and serves as the main energy source for many life forms. Amylase, glucoamylase, and α-glucosidase are the enzyme families that take part in starch degradation.
α-Glucosidase exhibits regioselectivity toward α-1,4-glucosidic linkages, catalyzing the release of glucose from the nonreducing ends of many substrates including α-glucosides, α-glucans, and maltooligosaccharides. Besides the above-mentioned hydrolytic action, α-glucosidase also has transferase activity (transglycosylation reactions), formatting α-glucosylated compounds [
1,
2]. It can be classified into three categories according to its substrate specificity and another two based on its primary structure [
3].
Owing to its hydrolytic activity, α-glucosidase has a diverse array of uses in industrial fields, covering food, feed, beverage, textile, pharmaceutical, and energy domains [
4]. On the other hand, through their transglycosylation action, α-glucosidases can contribute to the enzymatic synthesis of functional isomalto- and maltooligosaccharides, like isomaltose, nigerose, panose, and maltotriose, with some of these exhibiting prebiotic activity [
5]. Furthermore, α-glucosidases are used in medical science for the treatment of specific diseases like Pompe’s disease [
6].
α-Glucosidases can be found in and produced by a plethora of organisms, like plants, mammals, bacteria, fungi, and insects [
1]. Fungi and bacteria represent the most commonly used microbial systems for the production of these enzymes, as they exhibit great variety, grow quickly, and are low in cost [
7]. Moreover, they are capable of producing enzymes with different and unique properties and characteristics, like stability to special pH or temperature conditions, making them well suited for specific industrial or biotechnological uses [
8,
9].
The need for new α-glucosidase producers is imperative because of the importance of enzymes and their industrial uses. A common approach to discovering enzymes with enhanced catalytic features is to identify novel microbial species, as only a limited fraction of the existing strains have been cultured under laboratory conditions. The potential for enzyme production from algal and cyanobacterial strains has already been reported [
10]. Such microbial species demonstrate the ability to grow under a wide range of adverse environmental conditions—autotrophic, heterotrophic, and mixotrophic—and can metabolize diverse organic substrates while producing a wide array of valuable bioproducts, depending on cultural conditions [
11,
12,
13,
14]. Moreover, some cyanobacterial species possess the capability to store significant amounts of starch within their biomass [
15]. Meanwhile, certain filamentous species possess the capacity to metabolize industrial and agricultural residues [
16], reducing the organic load of the wastes and producing high-value molecules in parallel. For instance, the cyanobacterium
Pseudanabaena sp. appears to have high heterotrophic capacity, as it is able to thrive on a wide variety of substrates, yielding biomass of significant value. Furthermore, under cellobiose-supplemented growth conditions, the strain synthesizes β-glucosidase [
17].
Moreover, as enzymes are an important part of industrial processes, their activity and stability characteristics are crucial [
18]. Enthalpy (ΔH
*), entropy (ΔS
*), activation energy (E
a), thermal inactivation energy (E
(a)d), and Gibbs free energy (ΔG
*) [
19] are used for the thermodynamic characterization of enzymes [
18,
20,
21,
22]. These parameters constitute prediction models for enzyme reactions in different circumstances and environments [
23]. Thus, taking into consideration the special characteristics of the enzymes in combination with environmental conditions, the most appropriate enzyme can be selected for a specific application.
This work highlights the capacity of Pseudanabaena sp. cells to produce α-glucosidase, using maltose as an organic source. Initially, the optimization of culture conditions for both biomass growth and enzyme production was performed through the one-factor-at-a-time experimental design. Once the optimal substrate and nitrogen source, concentration, and ideal temperature were determined, cyanobacterium cells were cultivated in a 2 L bioreactor system. Then, the enzyme purification process took place, and the kinetic and biochemical characteristics of the enzyme and the effect of temperature, pH, EDTA, and metal ions on its activity were calculated. Finally, a thermodynamic analysis of the produced α-glucosidase activity and stability was performed. Based on these analyses, Pseudanabaena sp. is proposed as a new candidate for α-glucosidase production.
2. Materials and Methods
2.1. Culture Growth Conditions of Pseudanabaena sp. Cells and α-Glucosidase Production
Cultures of the cyanobacterium Pseudanabaena sp. strain Pamv7 (Taxonomy ID: 2587810 in NCBI website) cells were kept in the autotrophic culture collection of the Department of Biological Applications and Technologies. Cells were cultivated autotrophically in BG-11 medium (Fluka Analytical, Sigma-Aldrich, St. Louis, MO, USA) aerobically at 23 °C ± 1 °C, shaken continuously at 100 rpm. For heterotrophic cultivation, Pseudanabaena sp. cells were collected by centrifugation at 5000 rpm for 10 min, washed twice with distilled water and resuspended in 250 mL Erlenmeyer flasks containing 100 mL of modified BG-11 (-N) medium enriched with yeast extract (1.5 g/L) and D-maltose (20 g/L) as nitrogen and carbon sources. The cultures were kept in darkness at 23 °C ± 1 °C, shaken continuously at 100 rpm. Inoculums from exponentially growing heterotrophic cultures were used for the main cultures.
Cells were cultivated with maltose concentrations ranging from 0 to 25 g/L for carbon source optimization. After selecting the optimal maltose concentration, the next step involved the selection of nitrogen source among 6 organic and inorganic options, followed by determination of the optimal concentration. Continuing with another external factor, growth and enzyme production were assessed across nine temperatures settings.
A 10% inoculum from heterotrophic cultures, following cell density determination, was used in all experiments. Growth, biomass accumulation, enzyme production and sugar utilization were monitored at 24 h intervals.
The optimized conditions were applied in a 2 L bioreactor inoculated with heterotrophically pre-cultured cells. Before sterilization, the pH of the medium was set to 6.5. Cells were collected at the end of cultivation, corresponding to the depletion of carbon sources and the peak of enzyme production, which occurred around 160 h after inoculation.
Cyanobacterial biomass was determined by measuring the dry weight of collected samples. More specifically, samples of known volume were filtered under vacuum with pre-weighed filter WHATMAN membrane with a diameter of 0.45 microns. Samples were incubated at 60 °C overnight, after which the dried biomass was weighed. Cell concentration (mg/L) was determinate from filter weight differences, while growth was assessed by recording the absorbance at 590 nm at 34-h intervals.
The specific growth rate (μ) was determined from consecutive OD
590 measurements during the exponential phase using the formula:
where t is time.
Residual sugar levels during the experiment were measured colorimetrically with dinitrosalicylic acid (DNS) reagent, according to the method of Miller [
24]. Samples were adjusted to 0.25 mL with ultra-pure water 18.2 MOhm, followed by the addition of 0.5 mL of DNS reagent. After boiling for 5 min, the mixure was dilluted with 2 mL of milli-Q water, and the resulting color was recorded at 540 nm. Residual sugar concentrations (mg/mL) were determined based on a calibration equation:
where y was the concentration of maltose (g/L).
For α-glucosidase determination, cells were harvested every 24 h via centrifugation at 4000 rpm for 5 min and washed twice with ultra-pure water 18.2 MOhm. The cells were then resuspended in 10 mM citrate-phosphate buffer (pH 7.0) and disrupted by ultrasonication. To obtain the crude cell extract, cell debris and intact cells were separated by centrifugation at 4000 rpm for 5 min. The α-glucosidase assay is described below.
2.2. α-Glucosidase Activity Assay
The activity of α-glucosidase was assessed by monitoring the hydrolysis of p-nitrophenyl-α-D-glucopyranoside (pNPG). The 1 mL reaction mixture contained 2 mM pNPG in 100 mM citrate-phosphate buffer (pH 7.0) together with the appropriately diluted enzyme extract. Incubation was carried out at 40 °C for 15 min and the reaction was terminated by adding 0.2 mL of 10% Na2CO3. Absorbance at 410 nm was used to determine the released p-nitrophenol. Enzyme activity was expressed as units per ml of culture, with each measurement performed twice. One unit of α-glucosidase activity was defined as the amount of enzyme that liberates 1 μmol of p-nitrophenol per minute under the above assay conditions.
2.3. Enzyme Purification
The cell debris-free supernatant was collected and purified via ammonium sulfate precipitation, first at 0–30% followed by 30–70% saturation, with continuous stirring at 4 °C overnight. The enzyme was collected by centrifugation at 10,000 rpm for 5 min at 4 °C and re-dissolved in a minimal volume of 10 mM citrate-phosphate buffer (pH 7.0). Protein content, enzyme activity, and specific activity were measured in both supernatant and sediment, followed by two chromatographic methods.
The initial chromatographic step consisted of ion exchange chromatography using a custom Q-Sepharose column (Q1126-100 mL, Wet bead size 45–165 μm). The column was equilibrated with 10 mM citrate-phosphate buffer, pH 7.0 at a flow rate of 2 mL/min. After that, 1 M NaCl gradient equilibration buffer was applied at the flow rate. Fractions exhibiting α-glucosidase activity were collected, analyzed for enzyme activity and protein content, concentrated using an Amicon apparatus (Amicon chamber 8400 with membrane, exclusion size 10 kDa) (Merck KGaA, Darmstadt, Germany) and rebuffered into 100 mM citrate-phosphate buffer (pH 7.0). In the second chromatographic step, gel filtration was performed using a Sephacryl 100-HR (S100HR-250 mL, Wet bead diameter 25–75 μm) (Sigma-Aldrich, MerckKGaA, Darmstadt, Germany), equilibrated and eluted with the same buffer at a flow rate of 2 mL/min. Fractions showing enzyme activity were collected, pooled and analyzed.
2.4. Molecular Weight Determination
The enzyme’s molecular weight was estimated by SDS-PAGE using a protein marker of known molecular mass (Blue Easy Prestained Protein Ladder, Nippon Genetics Europe, Düren, Germany). Electrophoresis was performed on a 12% acrylamide separating gel with a 5% acrylamide stacking gel, and staining with Coomassie Brilliant Blue G250. The molecular weight of the purified enzyme was determined by comparing its mobility with that of the markers. Enzyme and markers were loaded and run at 120 V for about 45 min in Tris/glucine running buffer. Enzyme localization was assessed by activity staining. After that, the gel was stained and unstained with appropriate buffers and colored with Coomassie blue. A clear band corresponding to the enzyme was observed, aligned with a marker’s band.
2.5. Determination of Kinetic Parameters
The kinetic parameters Vmax, Km, kcat, and kcat/Km of α-glucosidase were calculated by linear regression analysis of a Lineweaver–Burk plot (double reciprocal plot) using various concentrations ranging from 0 to 25 mM, at 40 °C and pH 7.0, and the enzyme activity was determined under standard assay condition.
2.6. Effect of pH and Temperature on Activity and Stability
The optimum pH and temperature, as well as the stability of the purified enzyme, were assessed using pNPG as substrate. Enzyme activity was measured under standard assay conditions. The effect of pH on enzyme activity was assessed by incubating the enzyme at 4 °C in 100 mM citrate-phosphate buffer (pH 3.0–7.0), 100 mM Tris (hydroxymethyl) aminomethane buffer (pH 8.0–9.0) or 100 mM Glycine-NaOH buffer (pH 10.0), for 15 min. Enzyme stability was determined under the same buffer conditions and after incubation from 15 min to 24 h.
The effect of temperature was evaluated between 20 and 60 °C, specifically at 20, 25, 30, 35, 40, 45, 50, 55 and 60 °C, using 100 mM citrate-phosphate buffer (pH 7.0). Thermal stability was assessed within the same temperature range after incubation ranging from 2 min to 24 h.
Residual enzyme activity was determined under standard enzyme reaction following incubation, allowing evaluation of the enzyme’s activity and stability under varying temperature and pH conditions.
2.7. Effect of Metal Ions and EDTA on α-Glucosidase Activity
The effect of several metal ions, namely Cu2+ (Copper (II) chloride anhydrous, Sigma-Aldrich, Merck KGaA, Darmstadt, Germany), Co2+ (Cobalt (II) chloride ultra dry, 99.9%, Alfa Aesar, Thermo Fisher Scientific, Waltham, MA, USA), Fe2+ (Iron (II) sulfate heptahydrate (*7H2O), Sigma-Aldrich, Merck KGaA, Darmstadt, Germany), Fe3+ (Iron (III) chloride hexahydrate (*6H2O), 97%, I/1020/60, Thermo Fisher Scientific, Waltham, MA, USA), Mg2+ (Magnesium sulfate anhydrous, >99.5%, Sigma-Aldrich, Merck KGaA, Darmstadt, Germany), Mn2+ (Manganese (II) chloride tetrahydrate (*4H2O), 99.99%, Alfa Aesar, Thermo Fisher Scientific, Waltham, MA, USA), Zn2+ (Zinc sulfate heptahydrate (*7H2O), Sigma-Aldrich, Merck KGaA, Darmstadt, Germany), K+ (Potassium chloride, Merck KGaA, Darmstadt, Germany), Ca2+ (Calcium carbonate, >99%, Fluka, Honeywell Research Chemicals, Morris Plains, NJ, USA) and the chelator EDTA, at concentrations 1 mM and 5 mM, on α-glucosidase activity was determined. The purified enzyme was incubated with each metal ion or EDTA for 30 min and 1 h, after which the residual enzymatic activity was determined. The enzyme activity in the absence of any metal ions or EDTA was considered as 100%.
2.8. Determination of Activation Energy and Optimum Temperature
The activation energy (Ea) and the optimum temperature of α-glucosidase were evaluated through standard assays performed across temperatures from 20 to 55 °C, using the Arrhenius plot curve.
2.9. Thermodynamics of Maltose Hydrolysis
The thermodynamic parameters of hydrolysis were determined using Eyring’s absolute rate equation based on transition state theory [
25].
where k is the Boltzmann’s constant (1.38 × 10
−23 J K
−1), T is the absolute temperature (K), k
cat is the turnover number (s
−1), h is the Planck’s constant (6.626 × 10
−34 J s), R is the universal gas constant (8.314 J mol
−1 K
−1), ΔH
* represents the enthalpy of activation (J mol
−1), ΔS
* the entropy of activation (J mol
−1 K
−1), and ΔG
* the free energy of activation. ΔG
*E-S corresponds to the free energy of substrate binding and transition state formation, while ΔG
*E-T is the free energy for transition state formation.
For ΔH
*, ΔG
*, ΔS
* the following equations apply:
The free energy of substrate binding and transition state formation was determined according to the equations below [
26]:
where
. 2.10. Thermodynamics of α-Glucosidase Stability
Isothermal deactivation was evaluated at temperatures ranging from 40 to 55 °C in 100 mM citrate-phosphate buffer (pH 6.0). Aliquots were collected and immediately cooled at various times, after which the residual enzyme activity was determined under standard assay conditions.
Deactivation rate constants (kd values) were estimated using non-linear regression analysis. The thermal deactivation energy was derived from the slope of the Arrhenius plot line, that is, the semi-log plot of lnkd versus 1/T, where kd values represent the deactivation rate constants.
The half-time (t
1/2) (min) of deactivation was defined as the time required for the enzyme to retain 50% of the initial activity at a given temperature. The D-value corresponds to the time needed for the enzyme activity to decrease to 10% of the initial value. These parameters were calculated using the following equations:
The thermodynamics of α-glucosidase deactivation were evaluated using a rearranged form of Eyring’s absolute rate equation, based on transition state theory:
ΔS
*, ΔH
*, ΔG
* were calculated using Equations (4)–(6) with Equation (4) modified by replacing E
a with E
(a)d and k
d was used instead of k
cat [
27].
2.11. Data and Statistical Analysis
Data were analyzed using linear and nonlinear regression in SigmaPlot, version 12.5 for Windows (Copyright 2003–2013, Systat, Inc., San Jose, CA, USA). All experiments in this study were carried out in triplicate. Data were reported as mean ± standard deviation and were analyzed with one-way analysis of variation (ANOVA), with p-values of <0.05 indicating significance.
3. Results and Discussion
3.1. Effect of Maltose Concentration on Biomass and α-Glucosidase Production in Pseudanabaena sp. Cells
Pseudanabaena sp. cells have been observed to grow heterotrophically, utilizing various carbon sources [
17]. Moreover, these cells are capable of producing α-glucosidase, when cultivated heterotrophically, using maltose. Until now, the main α-glucosidase producers were bacteria. This is the first report demonstrating that a cyanobacterial strain can produce α-glucosidase. Therefore, it is essential to determine the optimal conditions for both biomass and α-glucosidase production.
Initially, the effect of maltose concentration as a carbon source on both biomass and enzyme production was investigated, using yeast extract as the nitrogen source at a concentration of 1.5 g/L. So, six different maltose concentrations, starting from 0 g/L (no maltose) to 25 g/L, were evaluated. According to
Figure 1, cell dry weight rose rapidly between 0 and 15 g/L of maltose, while at higher concentration, biomass formation remained stable. Specifically, biomass reached its highest value of 3.36 ± 0.19 g/L at a carbon source concentration of 15 g/L. At higher maltose concentrations up to 25 g/L, no further increase in biomass production was observed.
Meanwhile, a significant increase in α-glucosidase activity was observed with rising maltose levels, reaching a maximum of 1846.03 ± 12.49 U/L at 15 g/L maltose. Over this substrate concentration, enzyme activity declined, decreasing by approximately 11% to 1649.45 ± 14.01 U/L at 20 g/L maltose. At the highest substrate concentration (25 g/L), enzyme production was drastically inhibited.
These findings are consistent with previous reports on heterotrophic microbial growth, which indicated that low carbon availability limited biomass production, whereas high carbon concentration can inhibit product formation [
28]. Furthermore, biomass production by cyanobacteria under heterotrophic conditions is strongly dependent on both the strain and the carbon source used. For example, the cyanobacterium
Nostoc flagelliforme achieved a biomass of 0.41 g/L after 7 days of cultivation using fructose as the carbon source, compared to 10 g/L for
Anabaena variabilis [
16]. Our cyanobacterial strain
Pseudanabaena sp. reached 2.63 g/L using cellobiose [
17], 3.34 g/L using maltose and 7.74 g/L using glucose [
29].
Since cell growth is influenced by the strain as well as the type of and concentration of the carbon source, 15 g/L maltose represents the most favorable condition for Pseudanabaena sp., providing a balance between maximal α-glucosidase activity and near-maximal biomass accumulation.
3.2. Effect of Nitrogen Source on Biomass and α-Glucosidase Production in Pseudanabaena sp. Cells
The next crucial factor, after the carbon source, that plays a key role in cell growth and the production of high-value molecules is the quality and quantity of the nitrogen source [
30]. Maltose concentration was maintained at 15 g/L and the impact of both organic and inorganic nitrogen sources was examined, as microalgal cells are known to assimilate different types of nitrogen [
31].
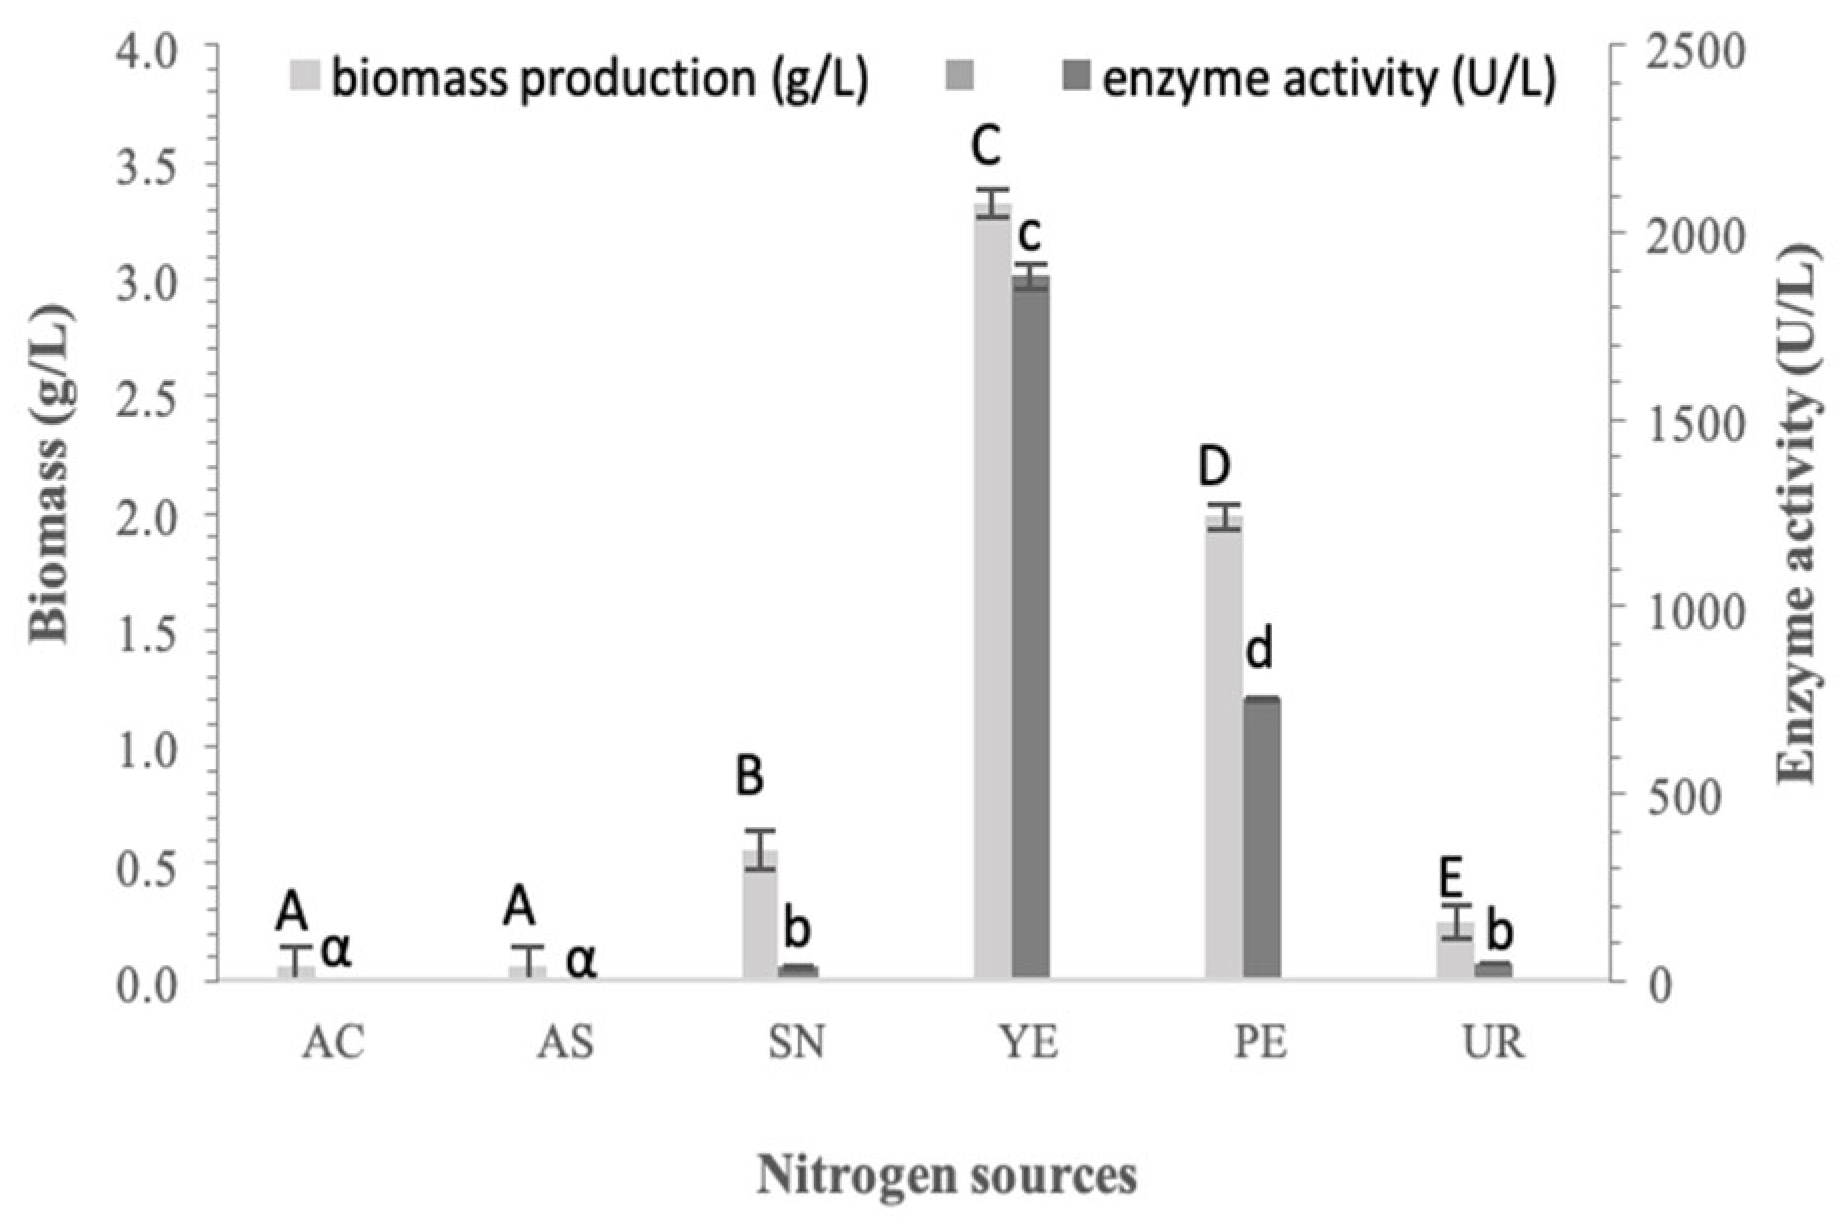
As presented in
Figure 2,
Pseudoanabaena sp. growth was very low when using inorganic nitrogen sources. Under heterotrophic conditions, the cyanobacterium is unable to assimilate nitrogen in the form of ammonium ions, while nitrate ions support limited growth and negligible enzyme production. Urea supported minimum growth and enzyme production, likely because the cyanobacterium has a limited ability to produce urease, which is essential for urea metabolism [
32].
In contrast, organic nitrogen sources such as peptone and yeast extract are assimilated by
Pseudoanabaena sp. cells. Under these conditions, the cells overcome the adaptive phase, continuing their exponential growth and enzyme production. This effect may be related to the presence of vitamins, amino acids and growth factors in complex nitrogen sources [
31]. As shown in
Figure 2, peptone supported biomass production of 1.98 ± 0.05 g/L, with an enzyme activity of 752.12 ± 2.77 U/L. Yeast extract was obviously better assimilated and used by the cells, resulting in a cell dry weight of 3.33 g/L and α-glucosidase activity of 1883.13 ± 31.85 U/L. Consequently, yeast extract as a nitrogen source led to approximately 60% higher enzyme activity and about 40% higher biomass production compared to peptone. Moreover, within the first 24 h of cultivation, cells grown with yeast extract produced more biomass and enzyme than the maximum reached by cells grown with peptone.
The above results are in agreement with previous works, which reported that ammonium sources inhibit cell growth, whereas yeast extract enhanced both growth and protein production [
30]. In addition,
Spirulina platensis and
Anabaena 7120 cells showed comparable results, as ammonium chloride, sulfate and urea caused severe growth inhibition, while sodium nitrate was identified as the most appropriate nitrogen source [
33,
34].
3.3. Effect of Yeast Extract Concentration on Biomass and α-Glucosidase Production
It is well established that both the form and concentration of nutrient factors influence cell growth [
35]. Moreover, depending on the desired bioactive compound to be produced, nutrient limitations may sometimes act in a positive way [
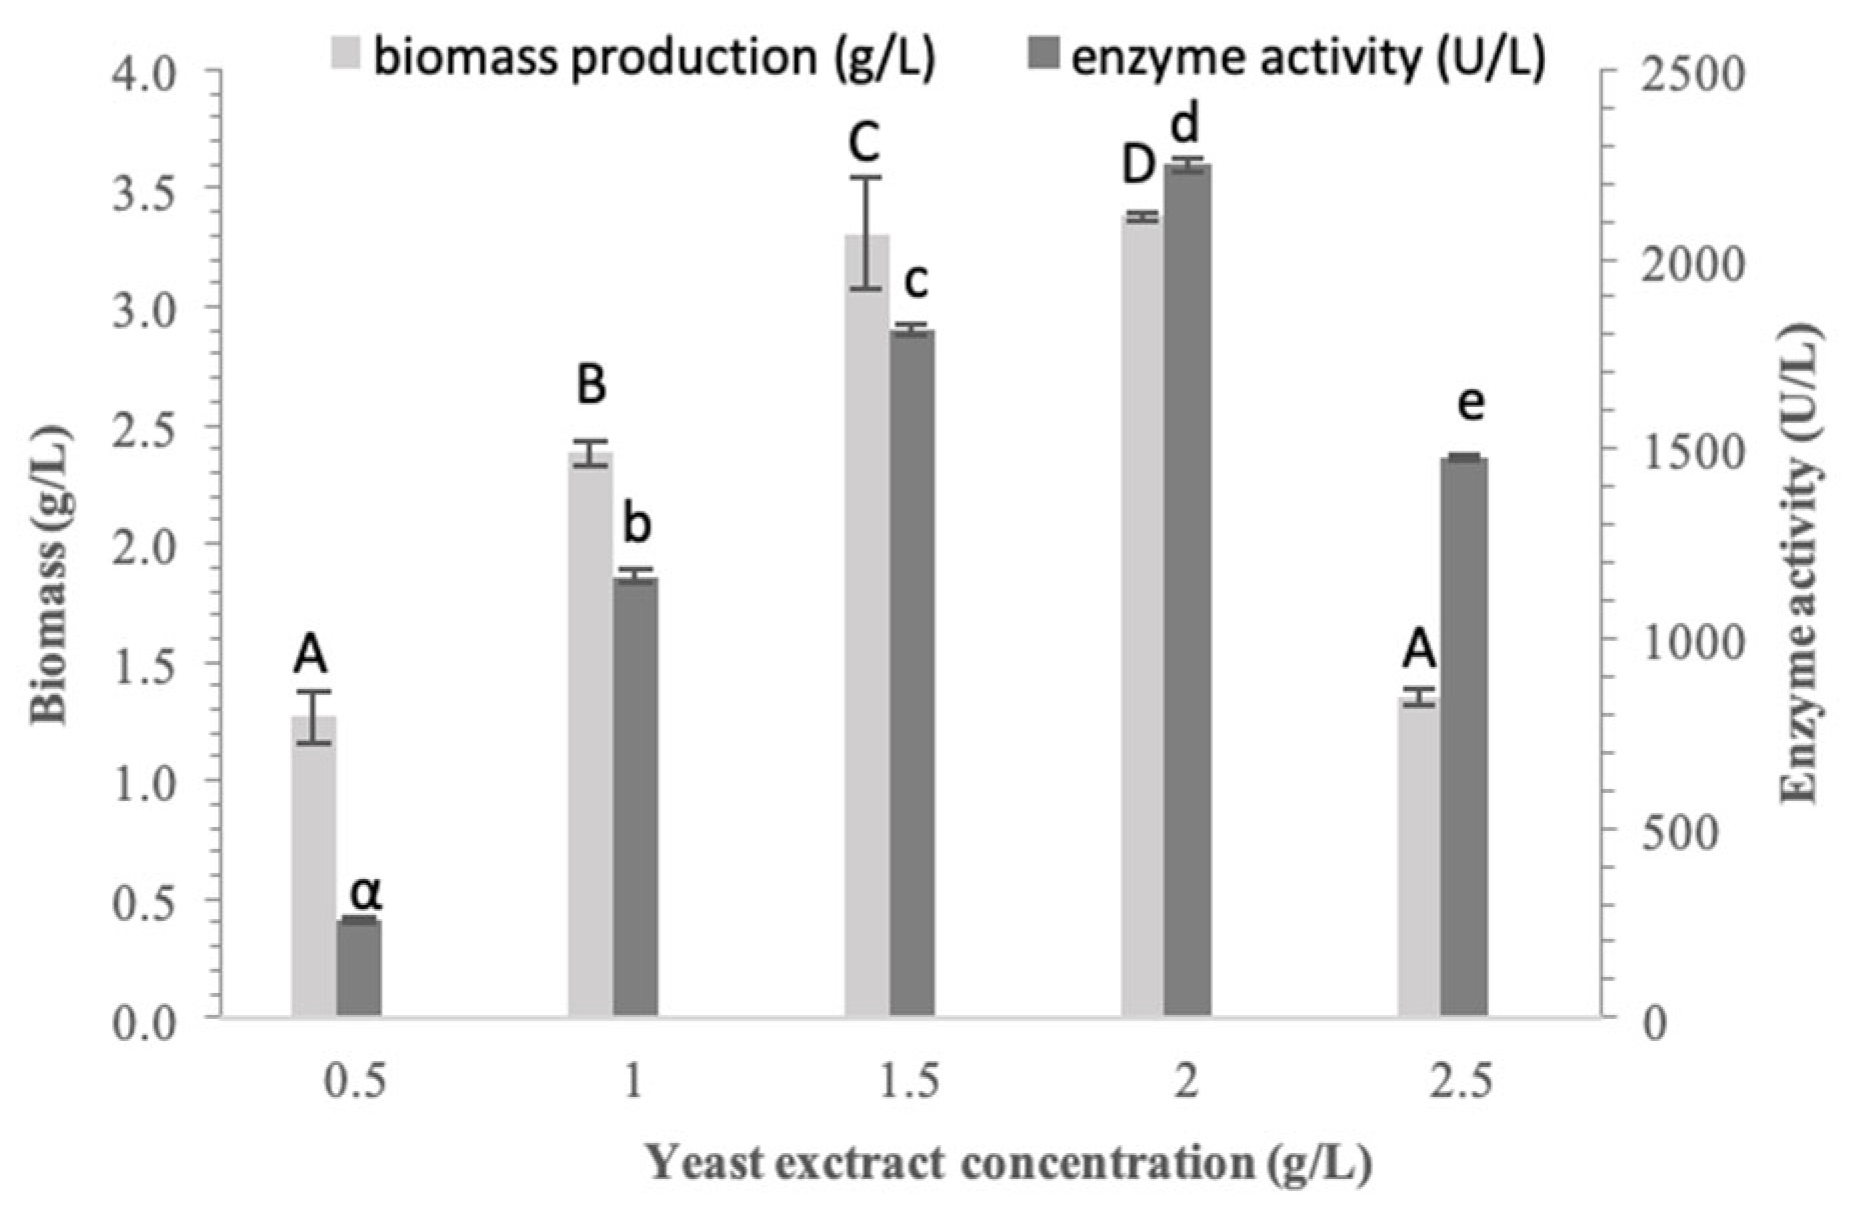
28]. Having identified yeast extract as the most suitable nitrogen source for both biomass and enzyme production, we subsequently evaluated the effect of its concentration. This was assessed by testing four concentrations, ranging from 0.5 to 2.5 g/L.
As demonstrated in
Figure 3, both biomass and enzyme production increased in parallel with yeast extract concentration, reaching their peak at 2.0 g/L yeast extract, corresponding to 3.38 ± 0.02 g/L and 2250.0 ± 17.31 U/L, respectively. Greater yeast extract concentration acted as an inhibitor factor against both biomass and enzyme production. At 1.5 g/L yeast extract, biomass concentration was close to the peak value, while enzyme demonstrated approximately 18% lower activity compared to the peak. Therefore, 2.0 g/L was identified as the optimal yeast extract concentration.
3.4. Optimization of Culture Temperature on Biomass and α-Glucosidase Production
After optimizing the nutrient parameters for cyanobacterial cell cultivation and α-glucosidase production, the effect of temperature was tested, as it constitutes an abiotic factor that plays a crucial role. Previous studies have demonstrated that the majority of microalgal species display optimal growth at temperatures ranging from 20 to 30 °C [
36]. It is commonly reported that temperatures above 35 °C constitute a prohibitive factor for cell survival, except for certain thermostable species [
37]. Conversely, temperature below 15 °C acts as an inhibitory factor, reducing cell growth rates.
As shown in
Figure 4, when evaluating temperatures between 15 °C and 35 °C, both cell biomass and enzyme production displayed a significant rise, as the temperature increased from 18 °C to 20 °C. At 20 °C and 23 °C, biomass production remained at its highest levels, measuring 3.34 ± 0.12 g/L and 3.32 ± 0.01 g/L respectively. Above 25 °C, biomass production followed an opposite trend, decreasing steadily and retaining only 64% of the maximum value at 28–32 °C. Our findings are consistent with earlier reports, in which
Pseudanabaena sp. cells cultivated in the presence of cellobiose showed optimal culture temperature at 23 °C [
17]. Moreover, it is in accordance with the temperature conditions observed in lake Pamvotis, which is the natural habitat of
Pseudanabaena sp. and from which our strain was isolated [
38]. Enzyme production followed the same trend as biomass production, reaching its highest activity at 23 °C. Higher temperatures exhibited an inhibitory effect. The peak α-glucosidase activity was 2186.18 ± 6.93 U/L, followed by activities of 1969.85 ± 13.85 and 1913.71 ± 4.16 U/L at 20 °C and 25 °C, respectively. At 18 °C, enzyme activity was maintained at 56% of the peak levels, whereas at 15 °C and 28 °C it decreased further, retaining only about 40% of the peak enzyme activity.
3.5. Growth of Pseudanabaena sp. Under Optimum Conditions
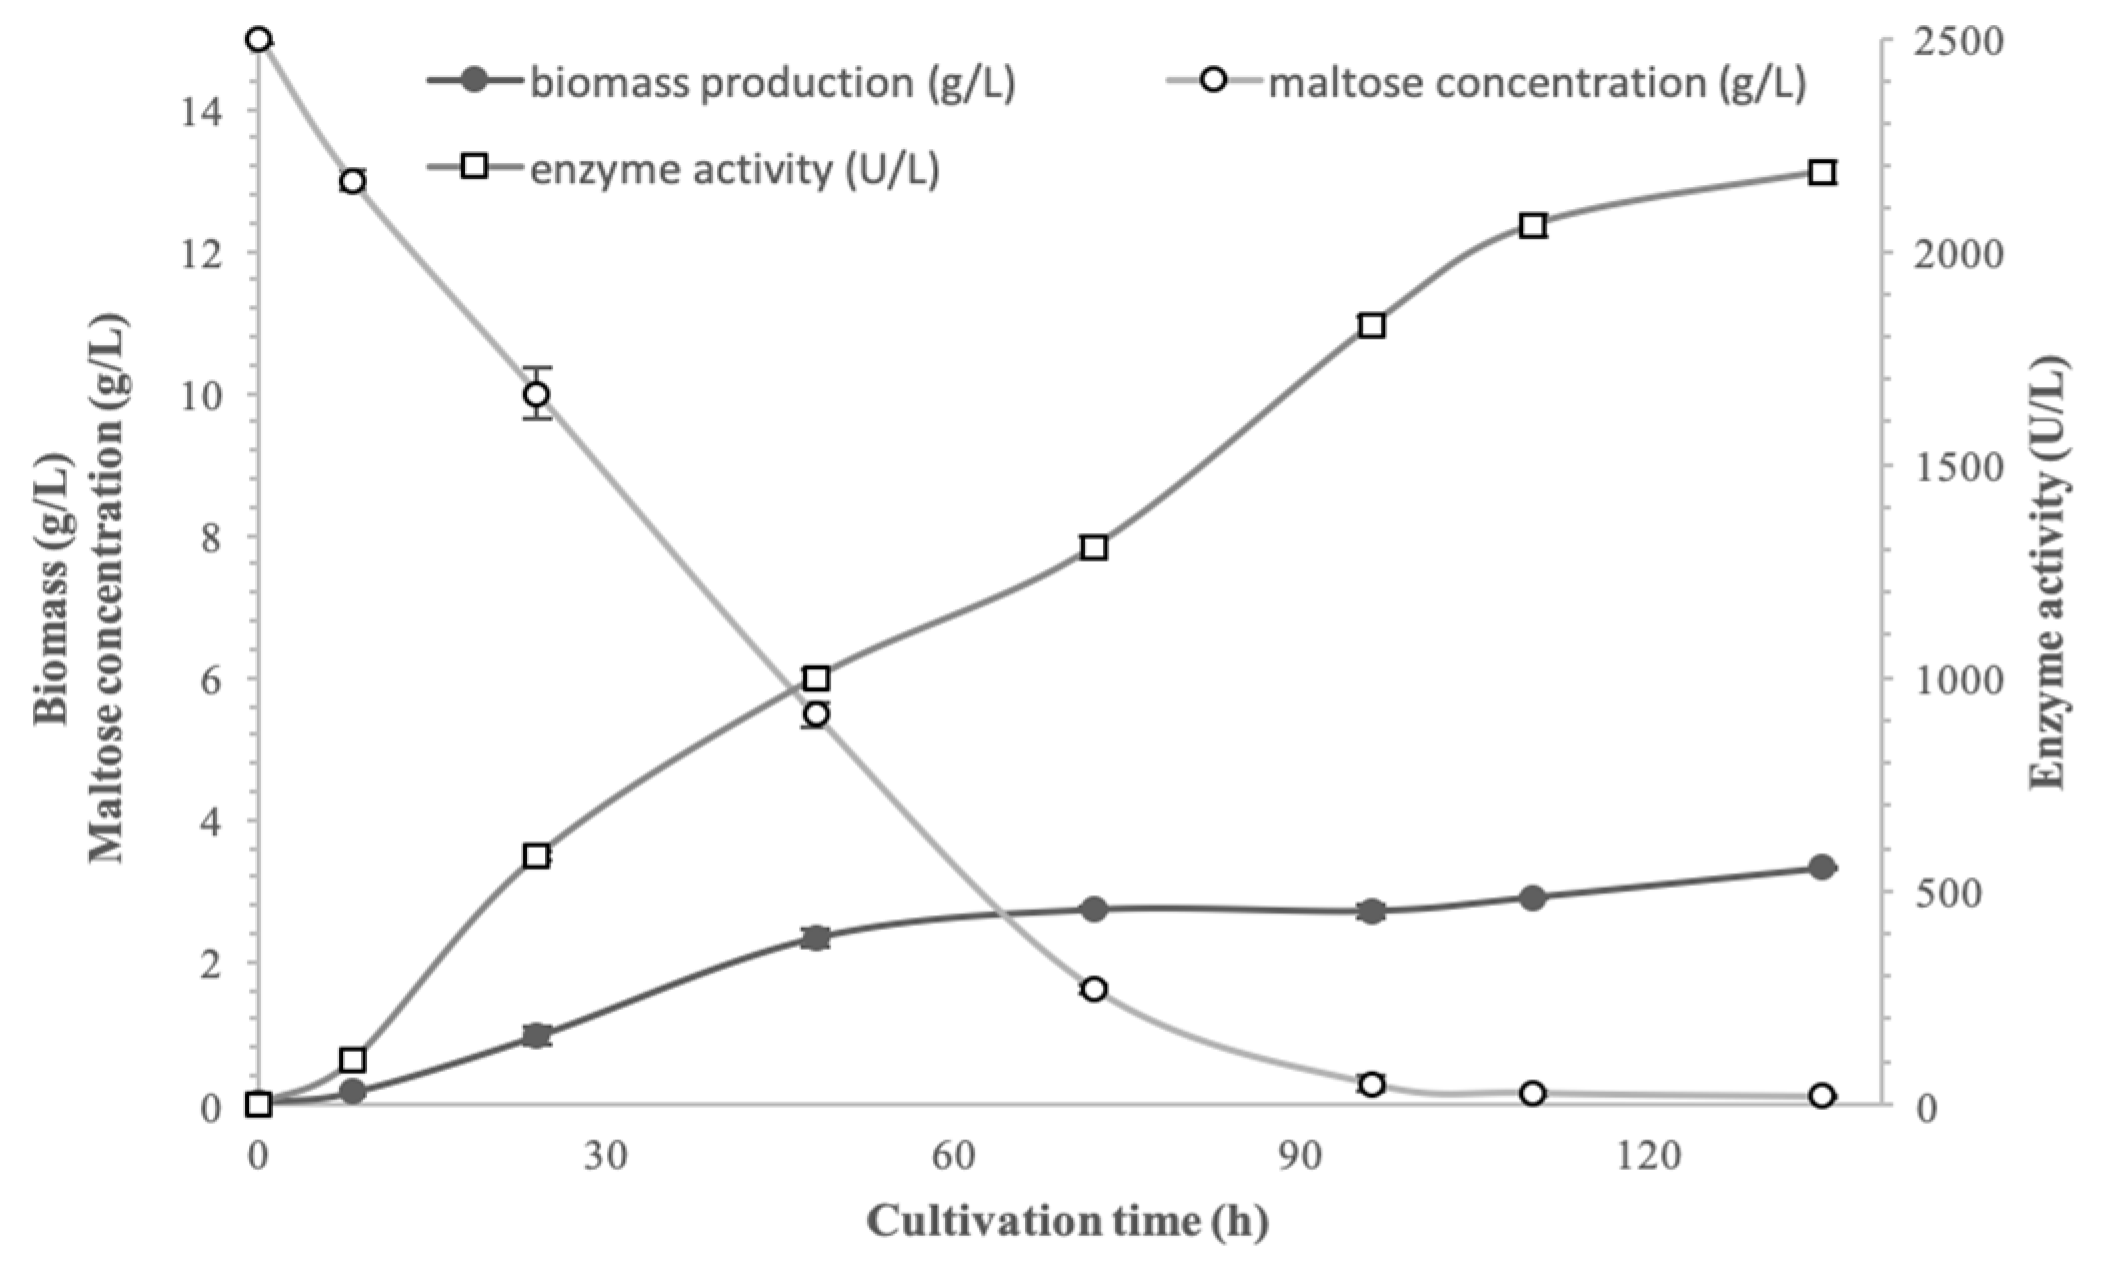
The objective of an enzyme production process is to achieve maximum enzyme activity while minimizing costs. In this study, these two parameters were fitted and the applied parameters were 15 g/L maltose, 2.0 g/L yeast extract and 23 ± 1 °C. The growth, enzyme production and maltose consumption curves of
Pseudanabaena sp. cells cultured in a 2 L bioreactor under the described optimal conditions are shown in
Figure 5. As presented,
Pseudanabaena sp. cells exhibited exponential growth during the initial 24 h of cultivation, while after 72 h, cell growth reached a plateau.
Moreover, enzyme yield is increased markedly at the early stages of cultivation. Specifically, between 8 and 48 h, enzyme activity increased approximately 10 times, paralleling the exponential growth phase of the cells. During the same period (48 h), substrate concentration had already decreased by about 63%. Moreover, after 96 h of cultivation, enzyme activity approached its peak value. So, as shown in
Figure 5,
Pseudanabaena sp. cells produced α-glucosidase mainly during the stationary growth phase, when maltose was already consumed. The maximum α-glucosidase activity remained stable until the end of the culture.
It is well established that biomass production is enhanced under heterotrophic culture conditions compared to autotrophic ones. Furthermore, the produced biomass is absolutely related with nutrient and external abiotic factors [
16]. Last but not least, it should be mentioned that these findings align with previous studies reporting that enzyme production occurs from the early hours of cell cultivation [
17,
39,
40,
41].
3.6. Purification of the Intracellular α-Glucosidase
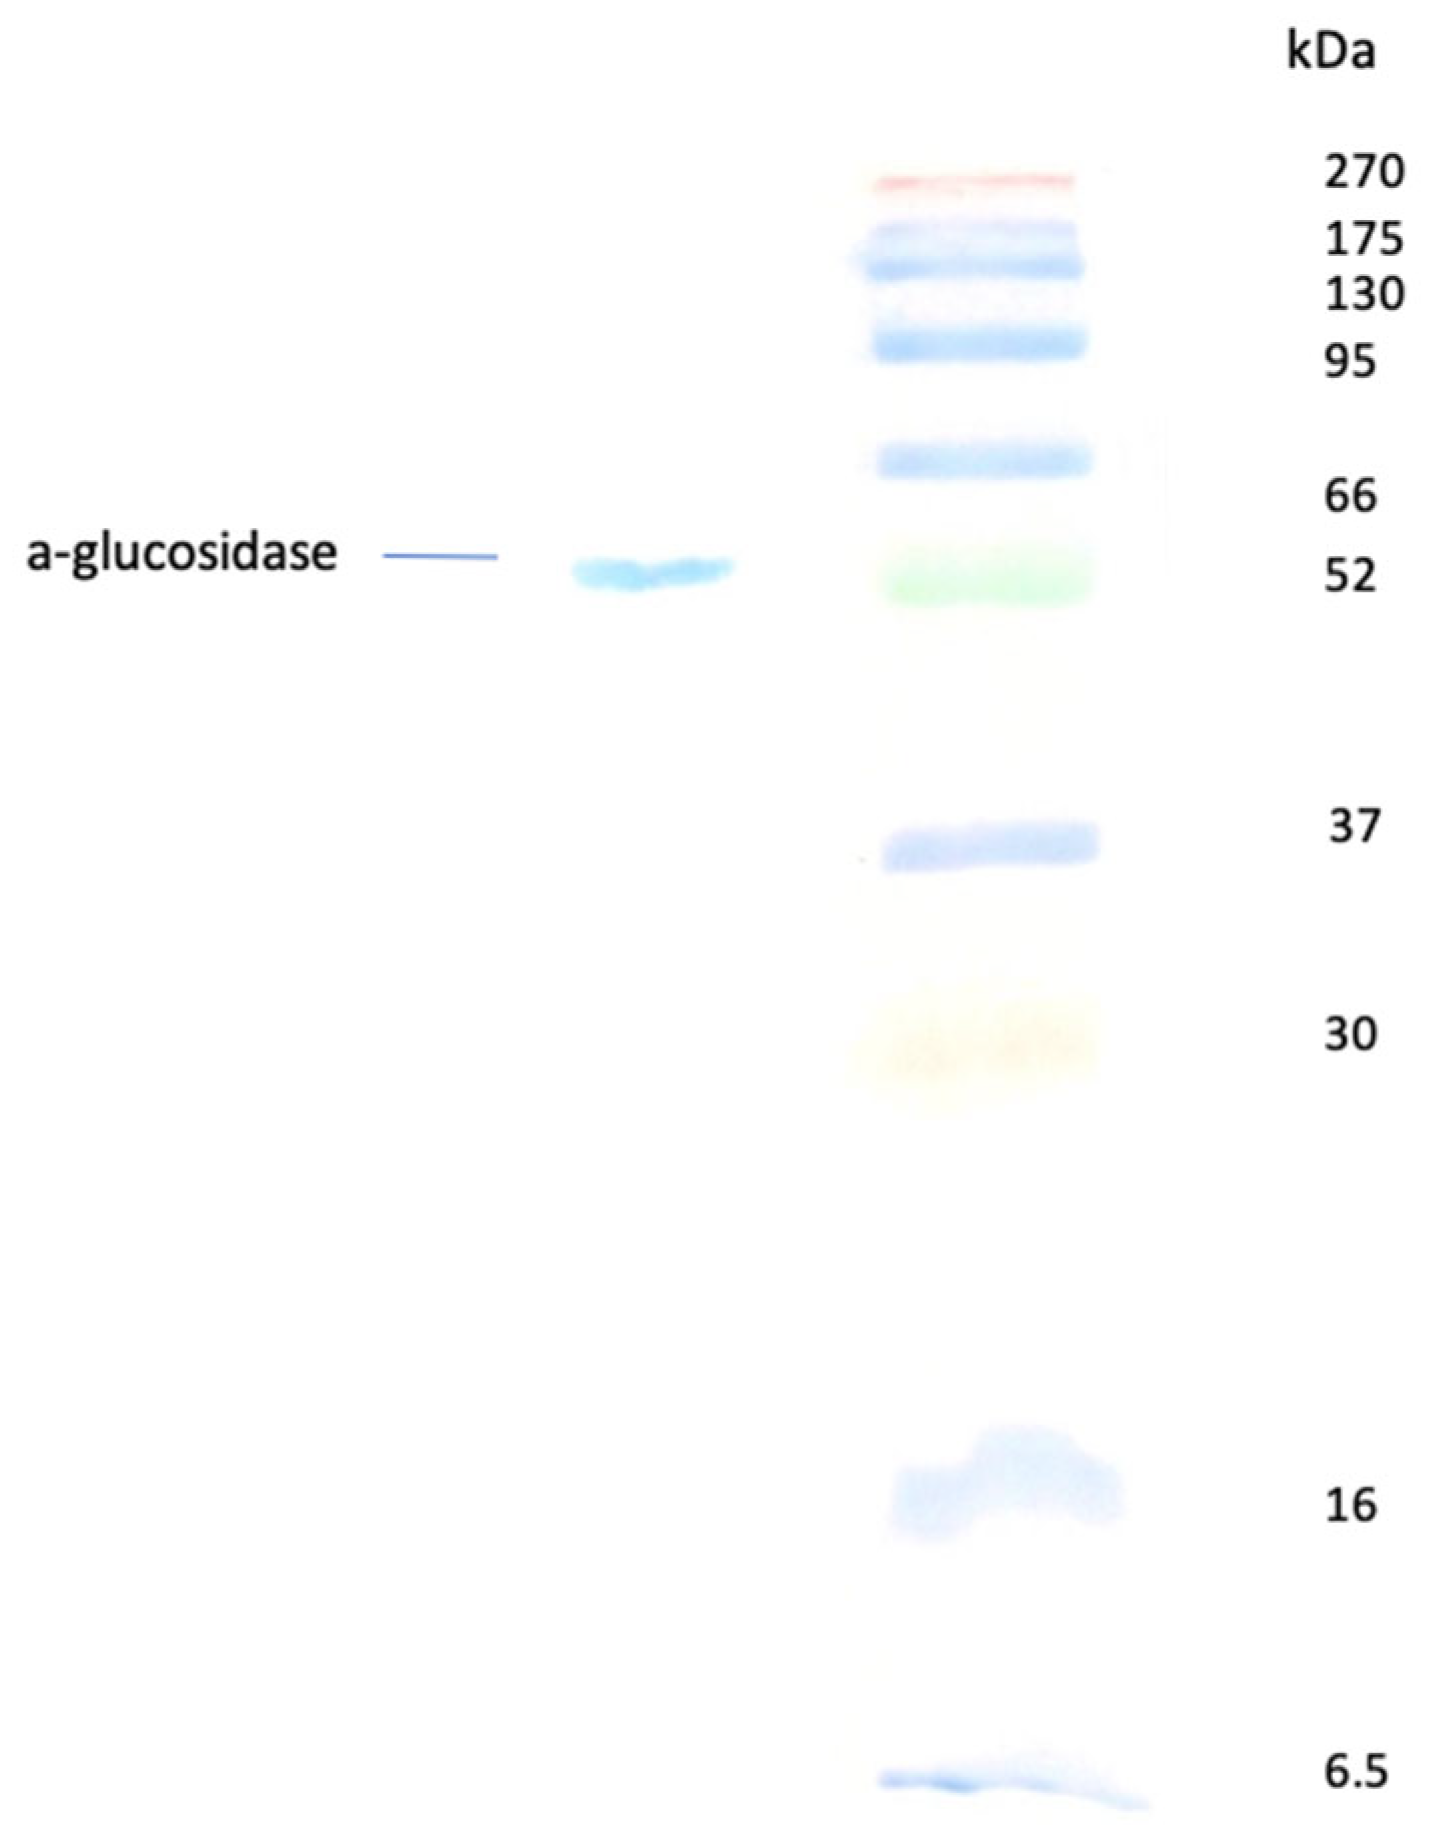
Purification of intracellularα-glucosidase from
Pseudanabaena sp. to homogeneity was confirmed by a single band on SDS-PAGE (
Figure 6) and was achieved through ammonium sulfate fractionation, anion exchange chromatography and gel filtration chromatography. As summarized in
Table 1, the purification process recovered 43% of the total activity, resulting in an 80-fold increase in specific activity.
The molecular mass of the purified α-glucosidase was determined to be 52 kDa (
Figure 6) and it could be classified as a low-sized α-glucosidase. Microorganisms like bacteria and fungus—especially filamentous—are ranked as the most significant enzyme producers. Molecular weights of produced α-glucosidases show a great variety, ranging from low-sized such as the α-glucosidase from
Bacillus cereus (12 kDa), to high-molecular-weight enzymes such as those from yeast
Saccharomyces logos (270 kDa) [
42]. Bacterial strains of
Bacillus species produce α-glucosidases with molecular weights similar to ours. For instance, α-glucosidases from
Lactobacillus brevis have molecular weights of 50–60 kDa [
43], whereas those of
Thermus thermophiles HB8 and
Geobacillus sp. were 67 kDa and 69 kDa, respectively [
44,
45].
3.7. Effect of pH on Enzyme Activity and Stability
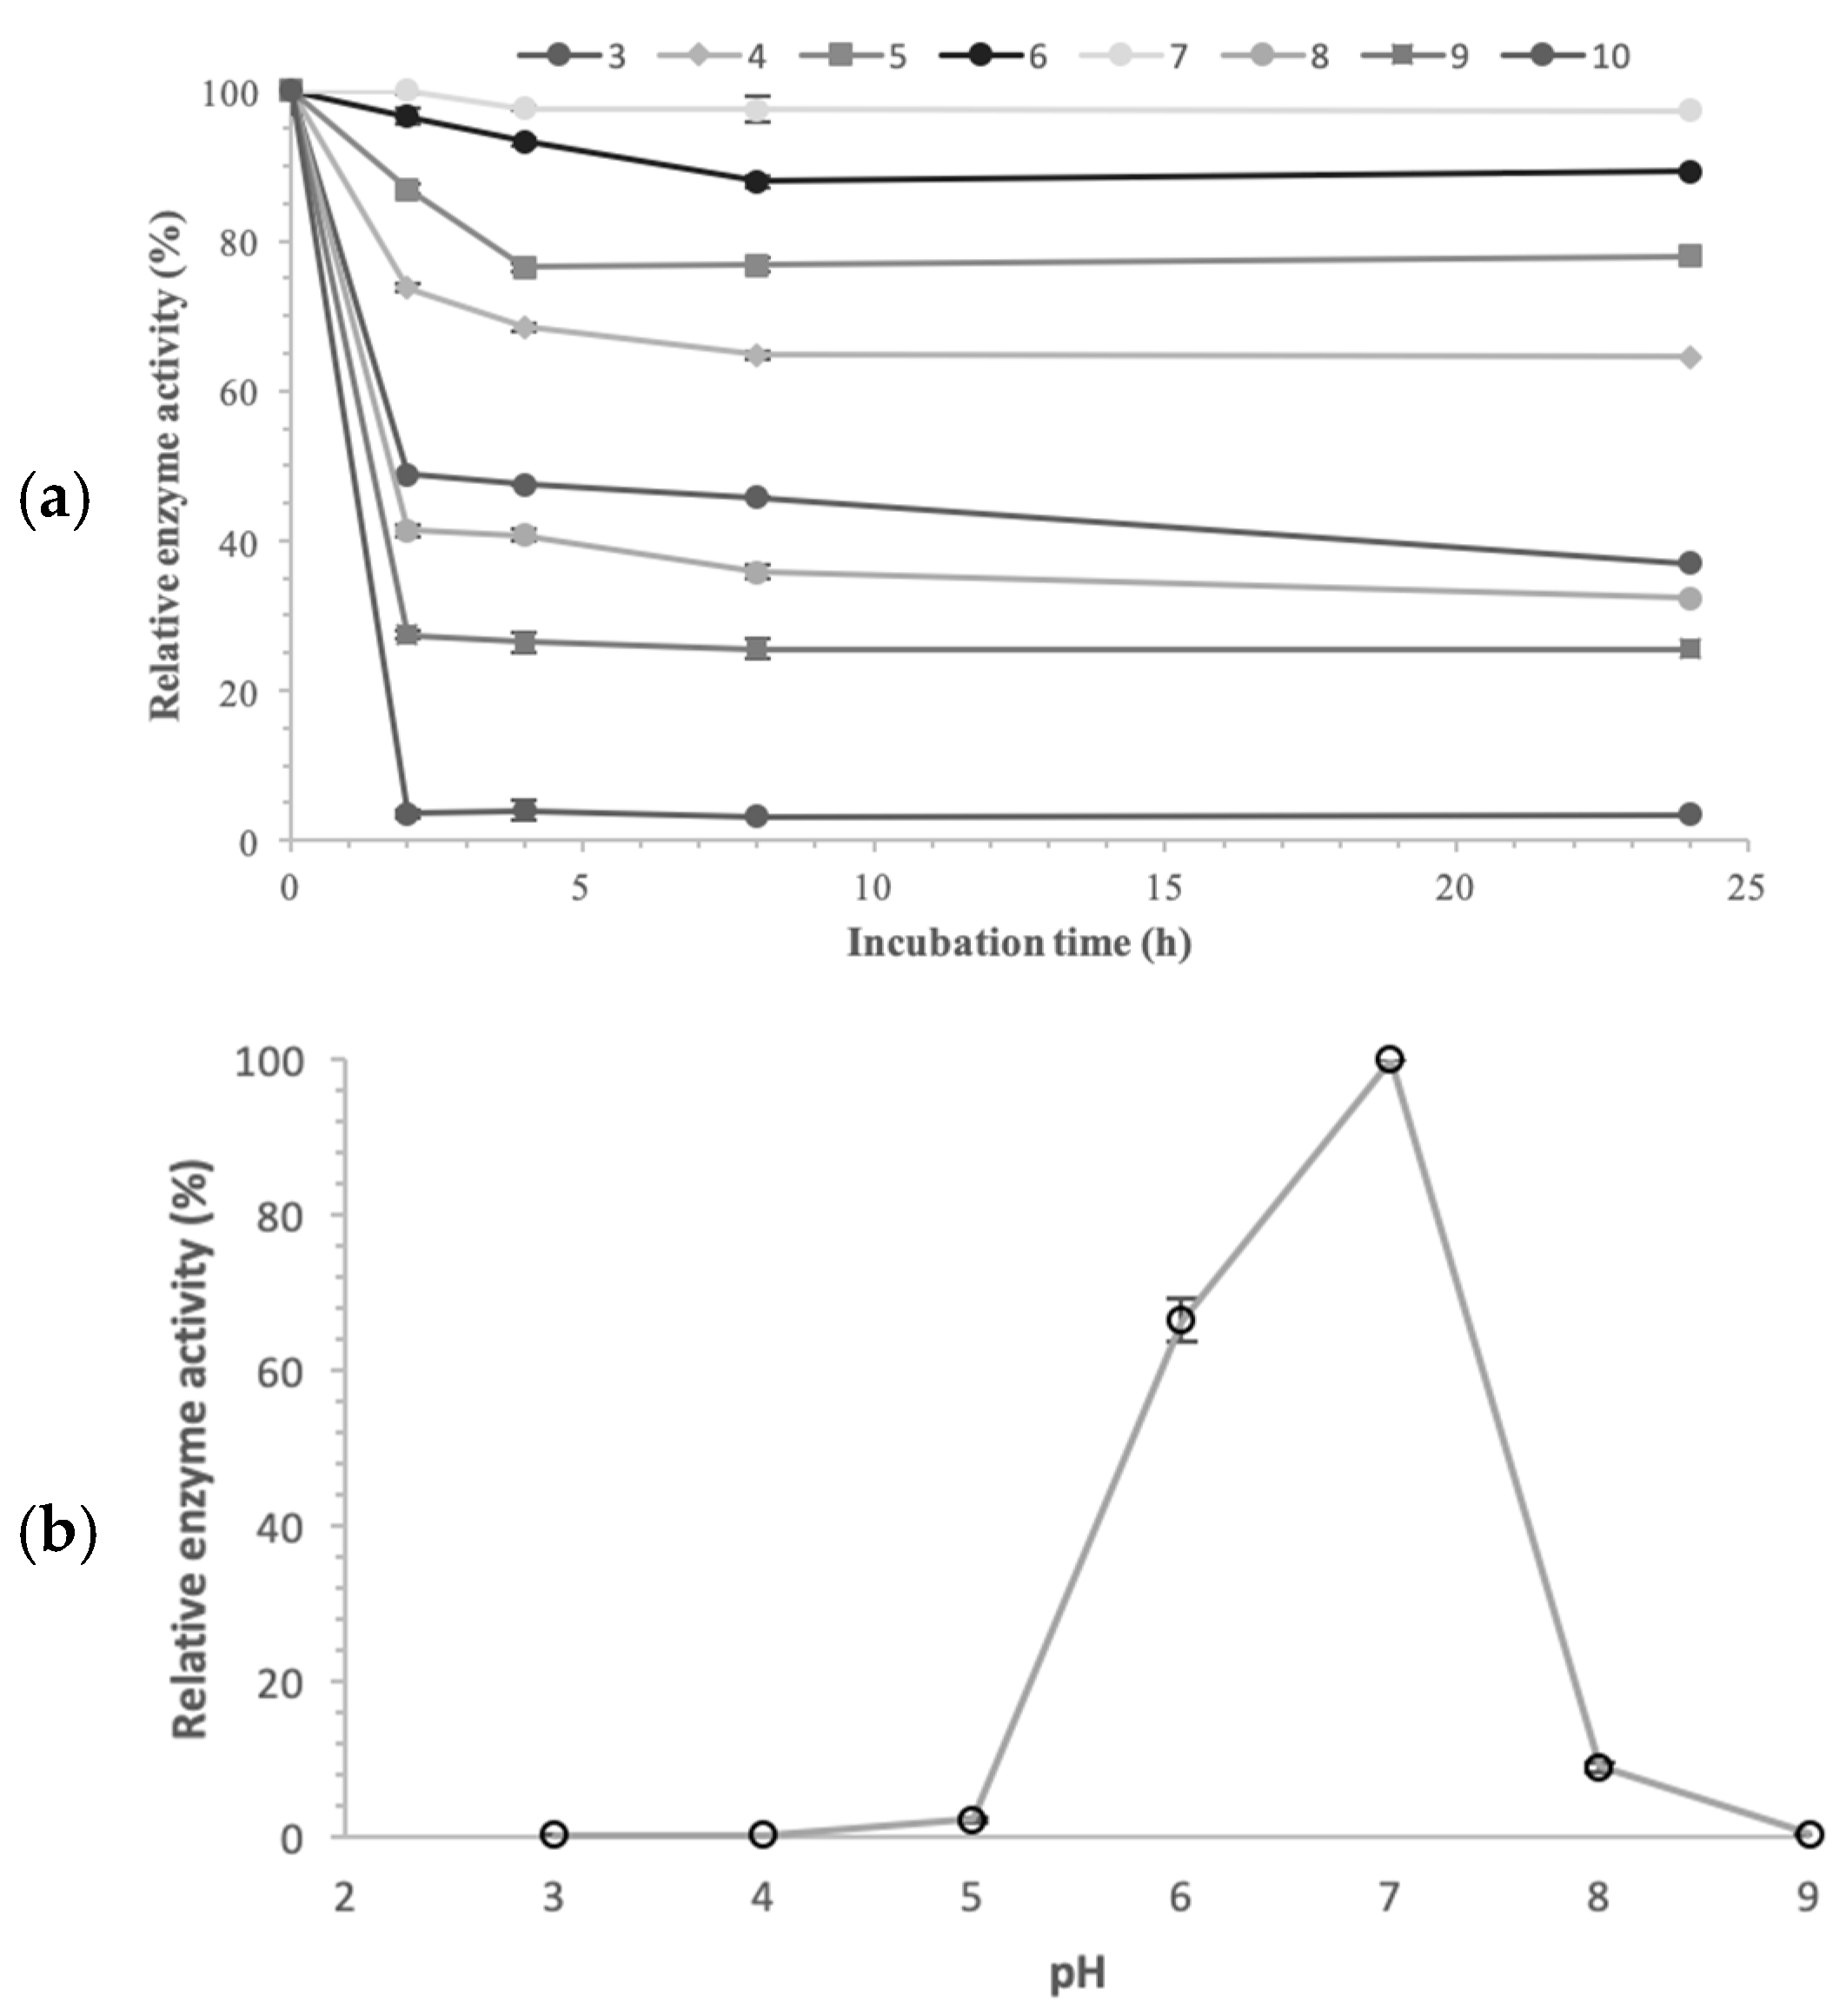
The effect of pH on pNPG hydrolysis by the purified enzyme was assessed over a pH range of 3.0–9.0 through various buffers at 40 °C. The highest α-glucosidase activity was observed at pH 7.0 in citrate-phosphate buffer, as shown in
Figure 7a. At pH 6.0, the enzyme had already lost approximately 34% of its peak activity, while a reduction of over 90% was observed at pHs between 3.0–5.0 and 8.0–9.0. Typically, α-glucosidases exhibit activity across a broad pH range. The most common optimum pH values among α-glucosidases from microorganisms are in the acidic scale of 4.5–7.0. For instance, α-glucosidase from
Lactobacillus brevis shows maximum catalytic activity at pH 6.0 [
43]. Both intracellular and extracellular enzymes from
Brettanomyces lambicus exhibit the same optimum pH [
46], while the optimum pH of α-glucosidase isolated from
S. logos is 4.6–5.0 [
42].
α-Glucosidase stability was assessed over a pH range of 3.0 to 10.0 after incubation for 2 to 24 h at 4 °C, with the results presented in
Figure 7b. Enzyme stability was obviously dependent on both pH and incubation time. The enzyme retained more than 70% and 60% of its optimal activity at acidic pH values, specifically at the range of 4.0–6.0 after 2 h and 24 h of incubation, respectively. At alkaline pH values, particularly at pH of 8.0 and 9.0, the enzyme retained only 25 to 32% of its optimum activity after 24 h of incubation, while at pH 10.0, more than 95% of its activity was lost within the first 2 h of incubation. Under extreme acidic condition (pH 3.0), α-glucosidase retained approximately 48% and 30% of its activity after 2 h and 24 h of incubation, respectively.
α-Glucosidase of
Pseudanabaena sp. cells exhibited stability over an acidic–neutral pH range, maintaining more than 60% of its optimal activity between 4.0 and 7.0. This characteristic makes the enzyme suitable for industrial processes, where acidic conditions are required. Examples included the liquefaction and saccharification steps of scratch-based industries, which are performed at pH levels from 4.0 to 6.2 [
19]. The use of an α-glucosidase that is both active and stable at this pH range is crucial for the efficiency, time and cost of these processes.
3.8. Effect of Temperature on Enzyme Activity and Stability
The temperature dependence of pNPG hydrolysis by purified α-glucosidase from
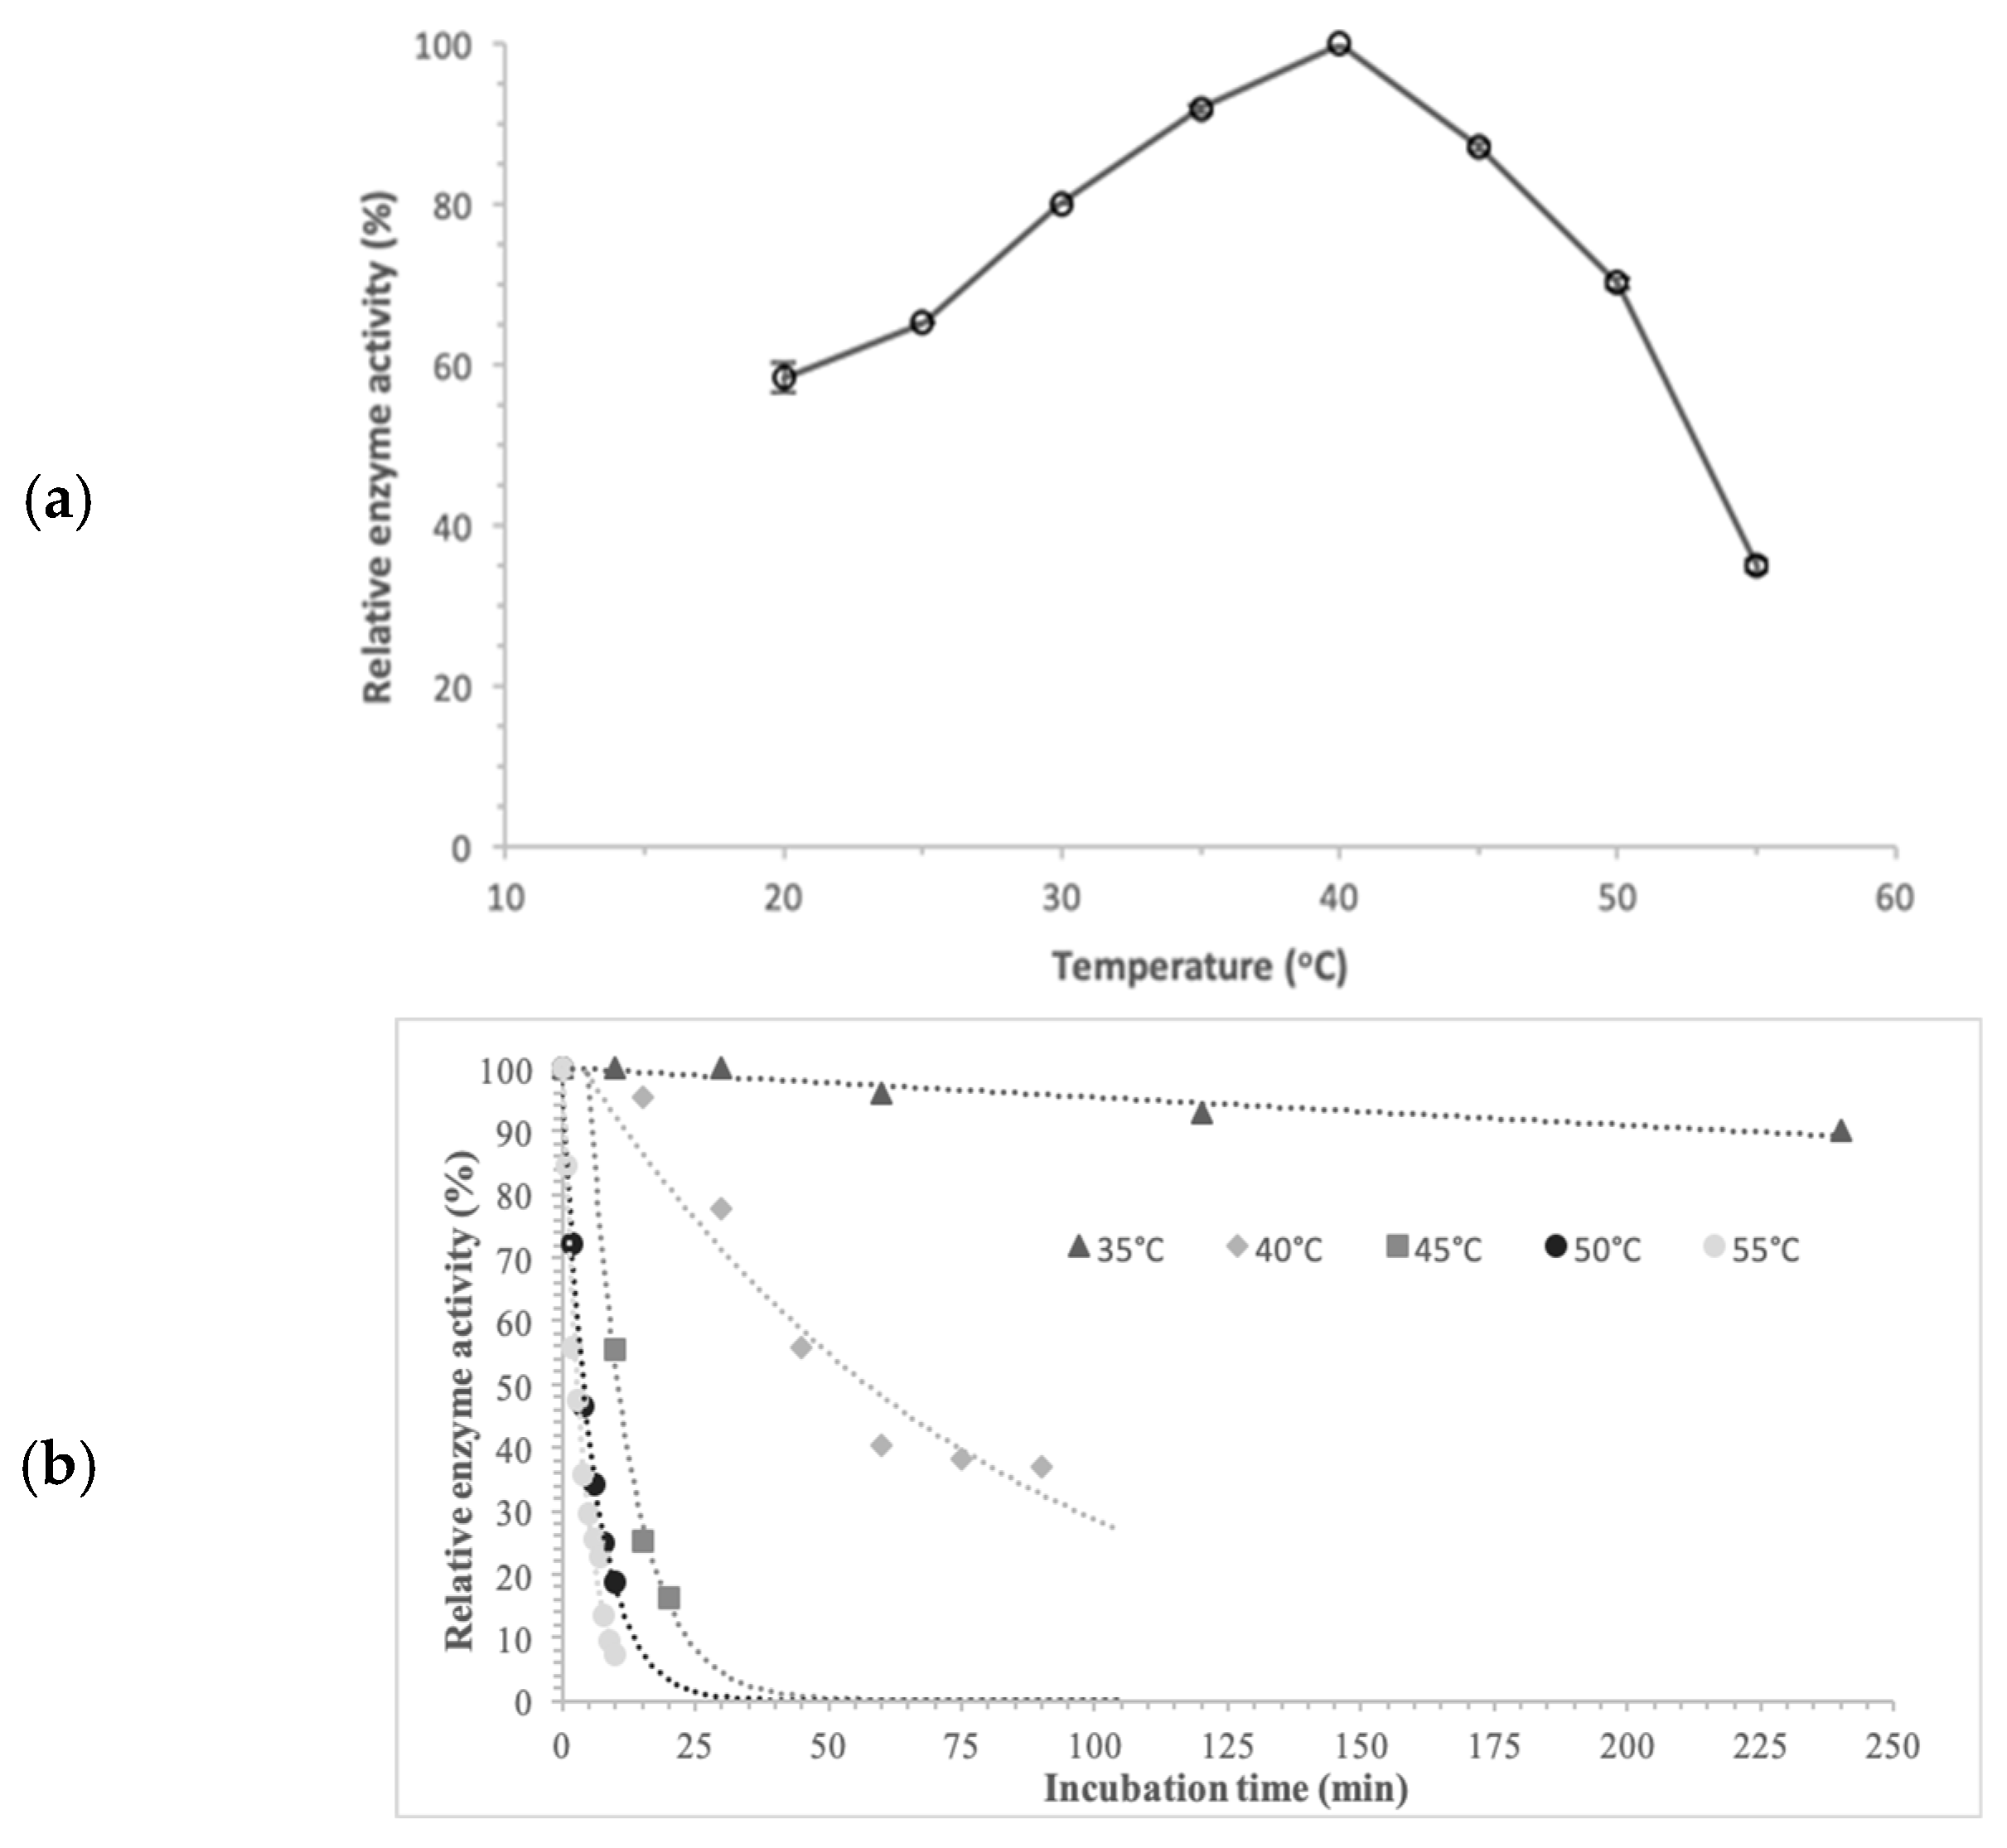
Pseudanabaena sp. was evaluated over a temperature range of 20–60 °C. α-Glucosidase exhibited maximum activity at 40 °C, as shown in
Figure 8. Enzyme activity rose with temperature up to 40 °C, followed by a gradual decrease at higher temperatures. Thus, 40 °C represented both the optimum temperature and a threshold, as α-glucosidase progressively lost activity above this value. Within the temperature ranges of 30–45 °C and 25–55 °C, the enzyme retained more than 80% and 65% of its optimal activity, respectively.
In most microbial α-glucosidases, the optimal temperature ranges from 35 to 50 °C. For instance, α-glucosidase from
Lactobacillus brevis shows maximum catalytic activity at 40 °C [
43]. Both intracellular and extracellular enzymes from
Brettanomyces lambicus exhibit the same optimum temperature [
46]. In contrast, a thermostable α-glucosidase from
Geobaccilus sp. displays an optimal temperature of 65 °C [
45].
The thermal stability of the purified α-glucosidase was evaluated by determining the residual activity after incubation at 35, 40, 45, 50 and 55 °C in the absence of pNPG. Stability reflects the capacity of the enzyme to withstand thermal unfolding without the substrate. The enzyme retained 90% of its initial activity after 240 min of incubation at 35 °C, indicating high thermal stability. At 40 °C, a 55% reduction in enzyme activity was observed after 45 min, while the same loss occurred at 45 °C within the first 10 min. The enzyme was very unstable at temperatures above 50 °C, losing over 65% of its activity at 50 and 55 °C, after 6 and 4 min, respectively.
So, α-Glucosidase from Pseudanabaena sp. remains thermally stable for over 4 h at temperatures up to 35 °C, whereas stability decreases at higher temperatures. At 40 °C, the enzyme maintains over half of its initial activity for 45 min.
Enzyme stability seems to be crucial because most processes take place at temperatures above environmental ones, and the observed thermal properties of this enzyme satisfy the criteria for its potential industrial use.
3.9. Effect of Metal Ions and Chelator on α-Glucosidase Activity
The effect of metal ions (Fe3+, Mg2+, Ca2+, K+, Fe2+, Zn2+, Mn2+, Co2+, Cu2+) and the chelator (EDTA) on enzyme activity were evaluated at two concentrations (1 and 5 mM) and two incubation times (30 min and 1 h).
As shown in
Table 2, metal ions and the chelator exhibited diverse influence on enzyme activity. At 1 mM, Fe
+3 and Fe
+2 caused a loss of approximately 60% and 90% of enzyme activity, respectively, after only 30 min of incubation. At 5 mM and after 1 h of interaction, the inhibition reached 67% and 97% respectively. In contrast, enzymatic activity was partially inhibited by Mg
2+ and Co
2+. α-Glucosidase retained more than 87% of its initial activity in the presence of 1 Mm of these ions, even after 1 h of exposure. Furthermore, in the presence of 5 mM of the above ions, the enzyme lost about 40% and 65% of its initial activity after 1 h of incubation, respectively. Mg
2+, Ca
2+ and K
2+ showed a similar, moderate enzymatic activity loss, starting from about 20% at 1 mM after 30 min and reaching about 40% at 5 mM after 1 h of exposure. Zn
2+ caused a 50% activity loss after 30 min at1 mM, which became more dramatic with increasing ion concentration and incubation time, reaching 80% and 95% loss after 1 h at 1 mM and 5 mM, respectively. Among all tested ions, Cu
2+ exhibited the strongest inhibition, resulting in 97% loss at 1 mM and after 30 min. Finally, EDTA strongly inhibited α-glucosidase activity, particularly at 5 mM, leading to more than 95% loss of activity. Even at 1 mM, EDTA caused great activity decreases of 71% and 78% after 30 min and 1 h of exposure, respectively.
In general, α-glucosidase activity was affected by both the chelator and metal ions, resulting in activity loss depending on their concentration and incubation time.
3.10. Activation Energy and Optimum Temperature
Maximum enzyme activity was observed at 40 °C, as analyzed in paragraph 3.4, while activity decreased at both lower and higher temperatures.
The activation energy (E
a) of the purified α-glucosidase was determined using an Arrhenius plot (
Figure 9), yielding a value of 24.21 kJ mol
−1. E
a values show a great variety, and consequently, the activation energy of the present enzyme is much lower from that of α-glucosidases from
Aspergillus niger, which has an E
a of 178 kJ mol
−1 [
47].
Activation Energy (Ea) indicates the efficiency of a hydrolytic process, representing the minimum energy needed to form the activated complex during pNPG hydrolysis. The low Ea value obtained for Pseudanabaena sp. α-glucosidase highlights an efficient hydrolytic capacity.
3.11. Kinetic Constants and Hydrolysis Thermodynamics
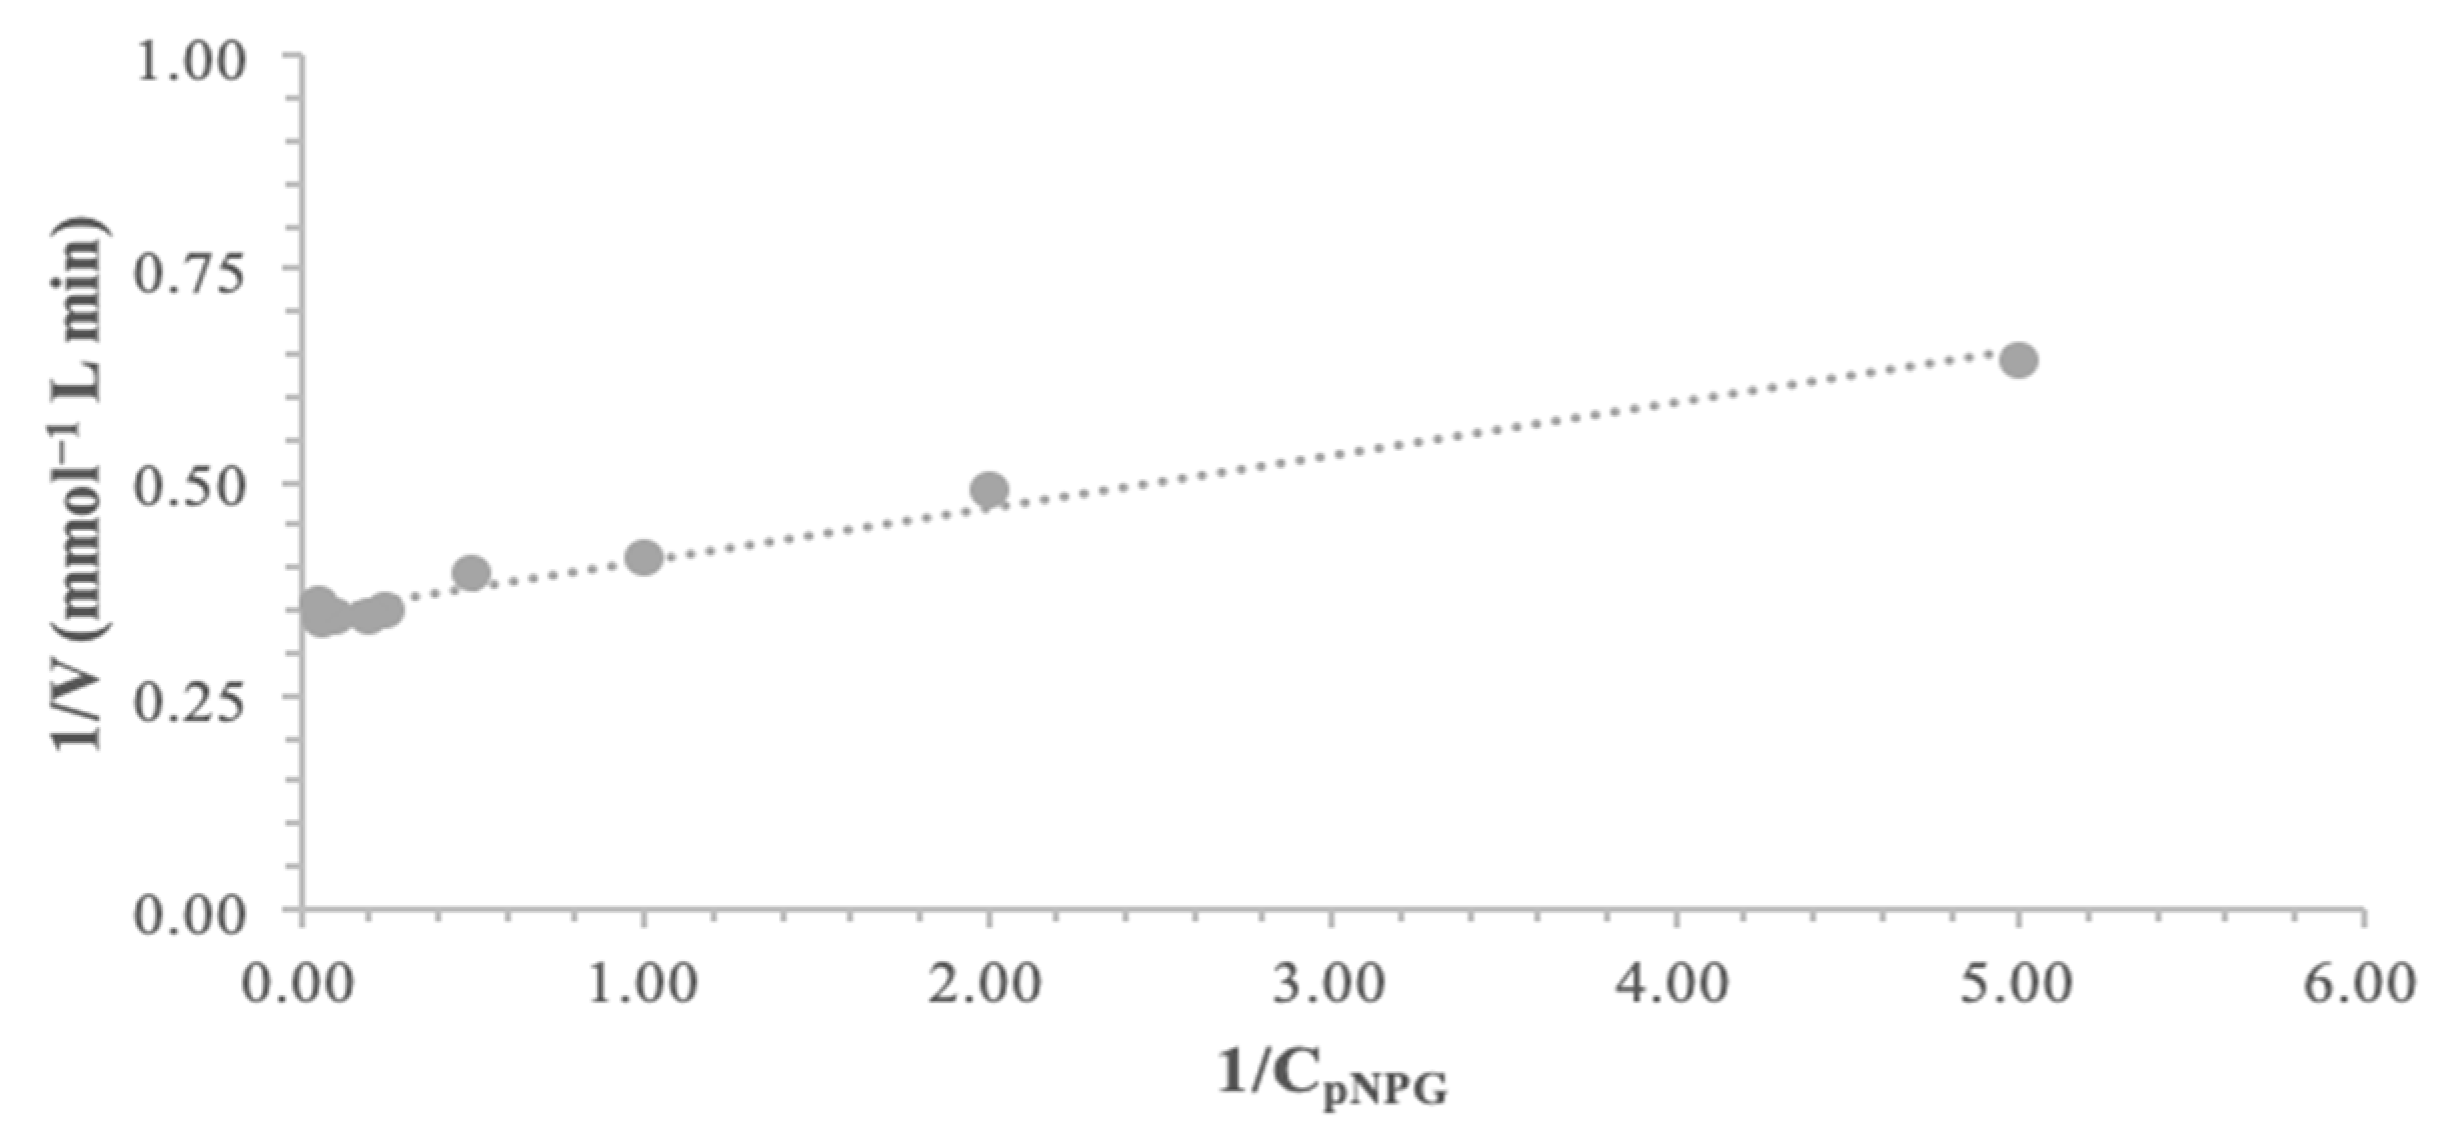
α-Glucosidase exhibited typical Lineweaver–Burk kinetics with pNPG as the substrate, as shown in
Figure 10. The kinetic parameters K
m and V
max were calculated, through linear regression fitting on 1/v (1/velocity) vs. 1/substrate data on the Lineweaver–Burk plot at 40 °C, yielding 2.0 mM and 2.9 μmol min
−1, respectively.
The kinetic and thermodynamic parameters of α-glucosidase from
Pseudanabaena sp. are summarized in
Table 3. As shown, the catalytic efficiency constant (k
cat/K
M) was calculated as 7433 M
−1 s
−1, while the turnover number (k
cat), which reflects the rate at which the enzyme–substrate complex is converted to product, was determined as 14.86 min
−1. This value is extremely high compared with α-glucosidase from
Thermoplasma acidophilum, which has a k
cat of 59.7 s
−1 [
48]. Comparing the k
cat/K
M values of these two α-glucosidases, it is obvious that α-glucosidase from Pamv7 exhibits higher catalytic efficiency than the one from
Thermoplasma acidophilum [
48].
The kinetic values of different α-glucosidases are difficult to compare, as the substrates and reaction parameters show great variety. The differences in these parameters are great even between enzymes from wild type and their recombinants [
49].
For instance, α-glucosidase from
Lactobacillus brevis exhibits similarities with this from
Pseudanabaena sp. considering its optimal pH and temperature, and has a K
m value of 0.51 mM for pNPG substrate [
43]. On the contrary, α-glucosidase from
Lactobacillus acidophilus shows a K
m of 4.31 mM [
6], while that from
Thermoplasma acidophilum has a K
m value of 1.77 mM [
48].
The enthalpy of activation (ΔH*), entropy of activation (ΔS*) and Gibbs free energy (ΔG*) for pNPG hydrolysis catalyzed by purified α-glucosidase from Pseudanabaena sp. were estimated as 21.6 kJ mol−1, −116 kJ mol−1 and 57.8 kJ mol−1, respectively
Low ΔG* values suggest a more spontaneous conversion of the transition state complex to product, whereas negative ΔS* values indicate the formation of a more efficient complex between enzyme and substrate and as a result a more ordered transition state. Thus, ΔG* changes reflect the extent of the enzymatic reaction, with lower ΔG* values indicating a more spontaneous conversion of the transition complex to products.
Furthermore, the low free energy values for substrate binding (ΔG*E-S) and transition state formation (ΔG*E-T) suggest strong α-glucosidase affinity towards pNPG hydrolysis. In the current study, these values were −22.2 kJ mol−1 and −41.2 kJ mol−1, respectively.
3.12. Thermodynamics of α-Glucosidase Stability
The key thermodynamic parameters of purified α-glucosidase stability over the temperature range of 35–55 °C are summarized in
Table 4. The enzyme was inactivated in a way related to the increase in temperature, as reflected by the k
d values. Thermal inactivation rate constants (k
d) increased in parallel with rising temperature, leading to gradual inactivation of α-glucosidase. Enzymes with lower k
d values exhibit greater stability at elevated temperatures.
Two additional key parameters affecting enzyme stability are the half-life (t
1/2) and decimal reduction time (D), which are important for selecting the most suitable use of the enzyme. Higher values of t
1/2 and D correspond to greater thermostability, indicating that the enzyme can be used in industrial applications, where higher temperatures are needed. The t
1/2 and D values for
Pseudanabaena sp. α-glucosidase within the evaluated temperature range are presented in
Table 4. As is obvious, enzyme stability decreased as the temperature increased. Specifically, the enzyme revealed t
1/2 values of 53.3 min, 35.7 min and D values of 177 min and 119 min at 35 °C and 40 °C, respectively.
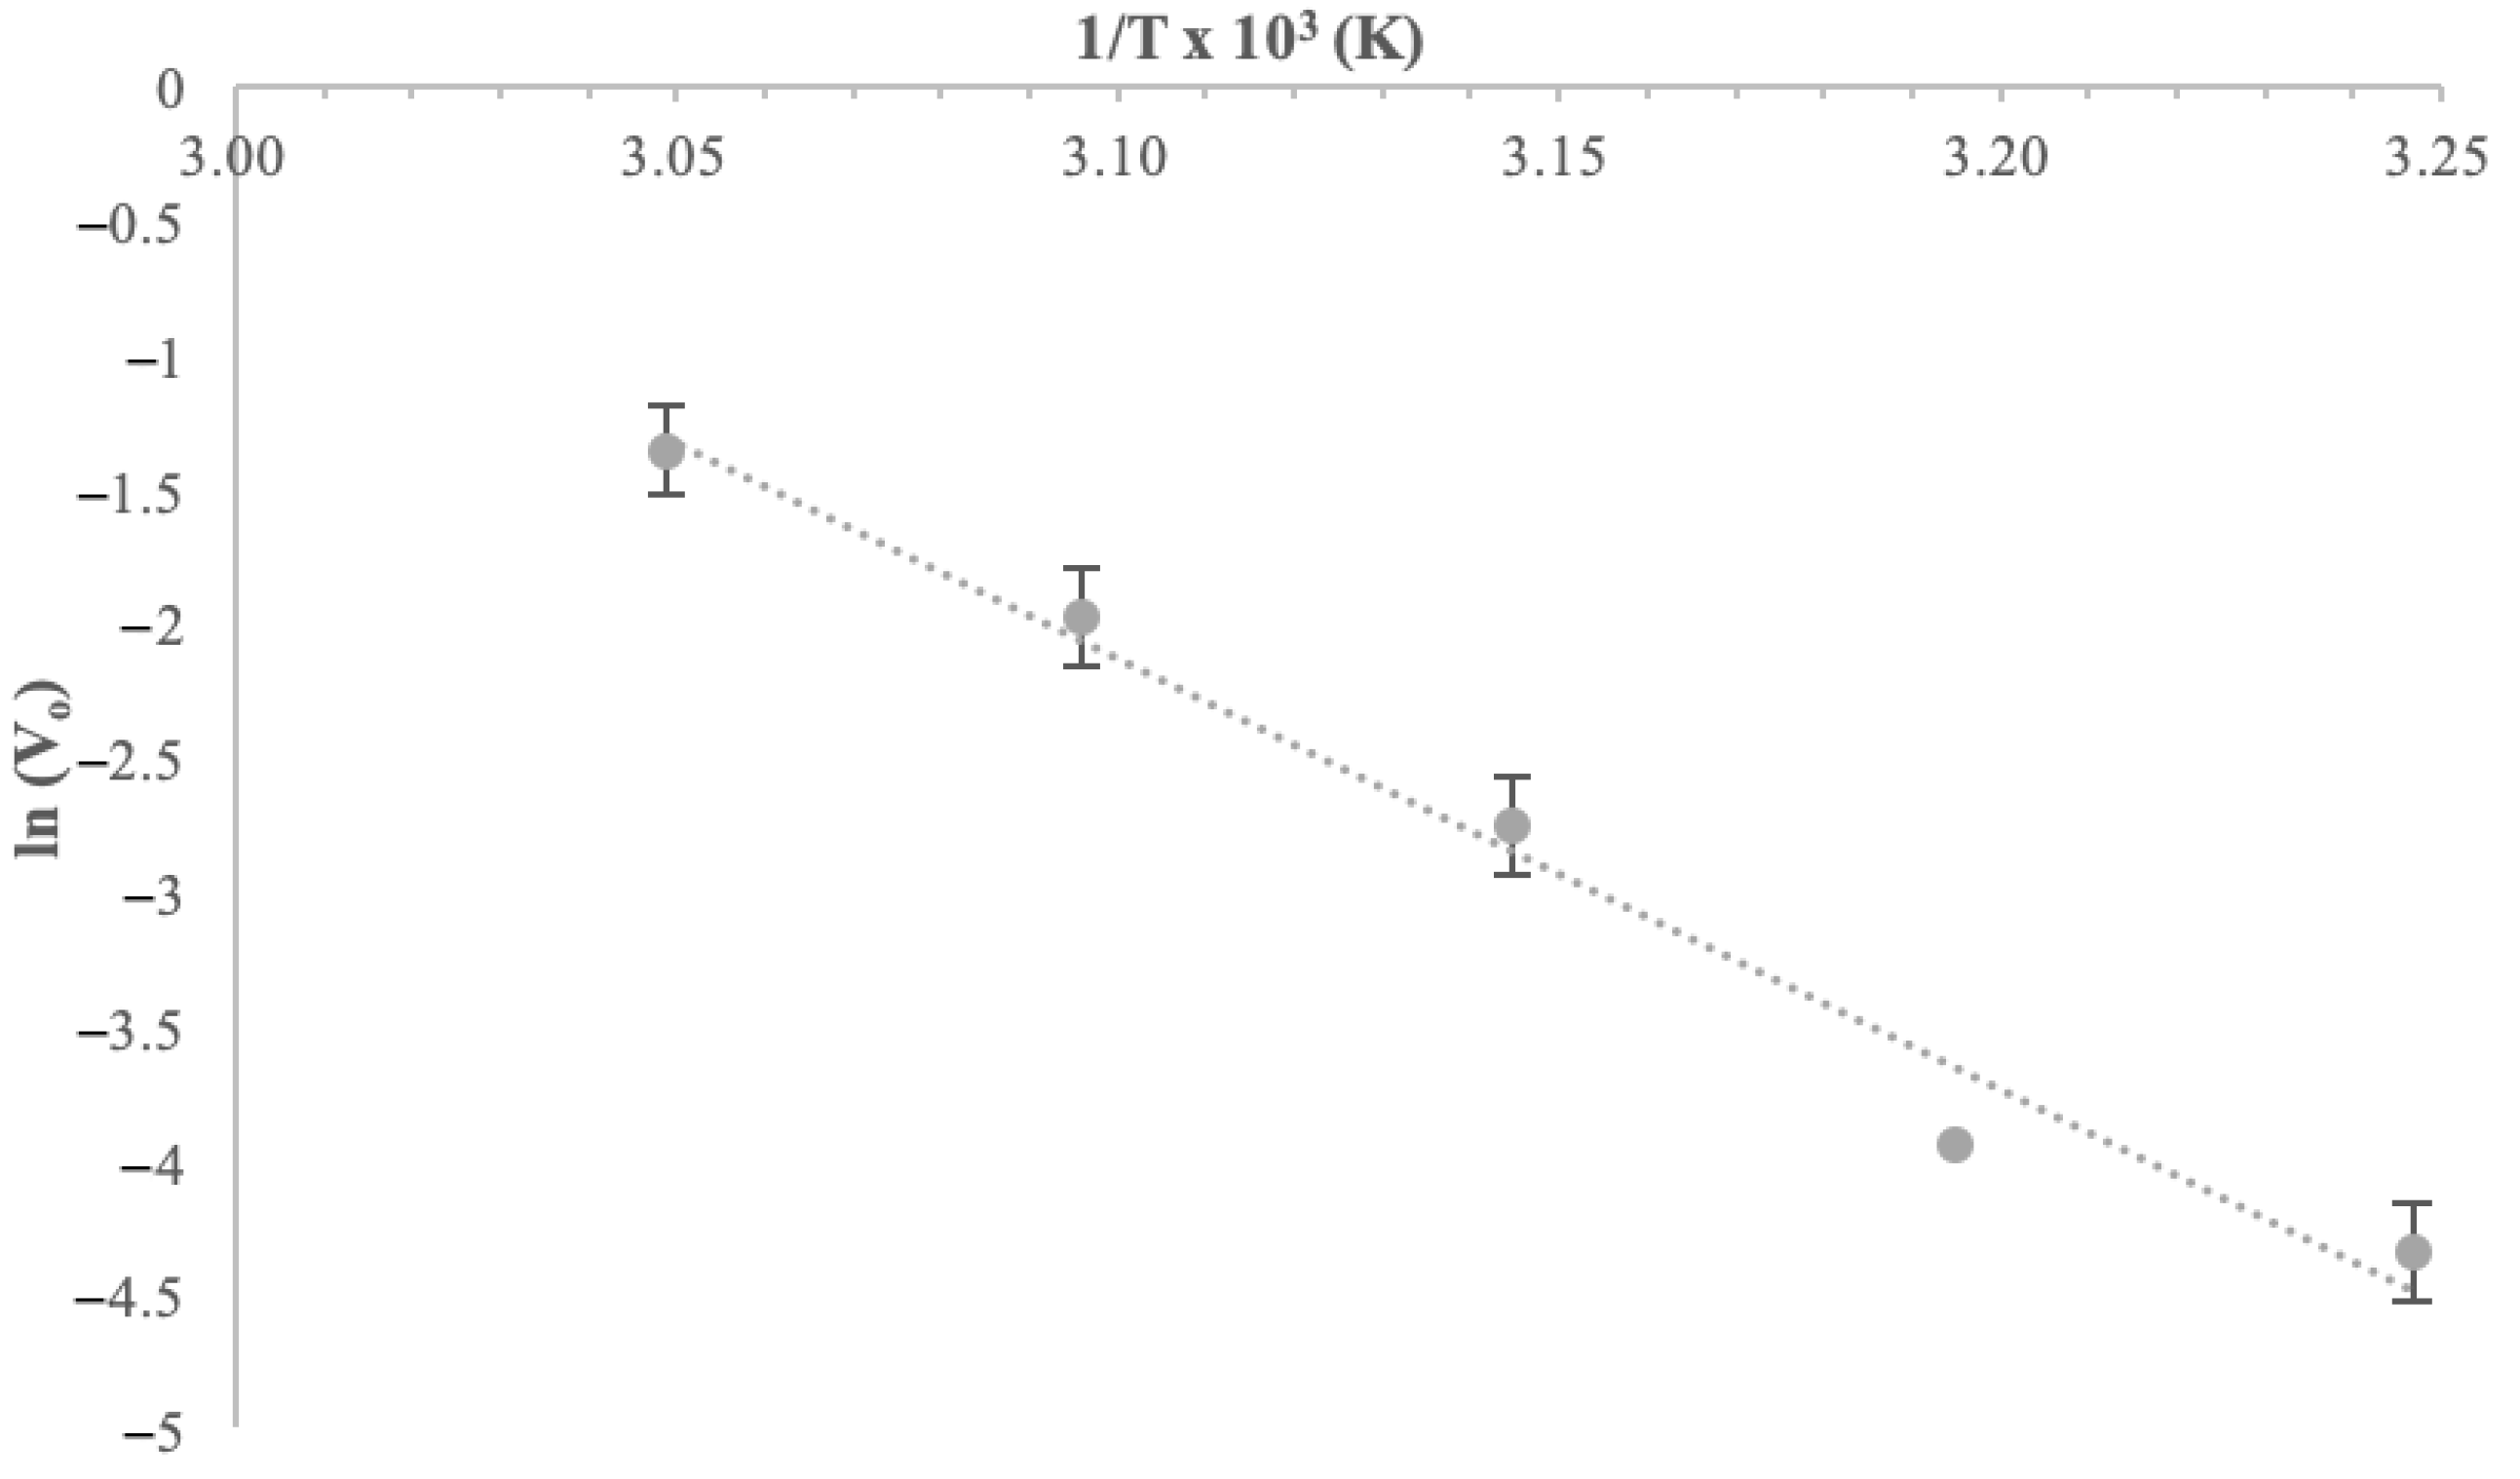
The thermal inactivation energy E
(a)d of α-glucosidase was estimated as 133 kJ mol
−1, representing the minimum energy required for enzyme unfolding, which is quite high. E
(a)d was calculated through a semi-log Arrhenius plot of 1/T vs. ln(V
0), as shown in
Figure 11.
The last three thermodynamic parameters, which are enthalpy, entropy and Gibbs free energy, are associated with the break of non-covalent linkages of the enzyme during the formation of a transition state towards the molecule inactivation.
As presented in
Table 4, ΔH
* values over the temperature range of 35–55 °C (308–328 K) remain about stable (131 ± 1 kJ mol
−1), indicating that a relatively small number of non-covalent linkages—including hydrophobic ones—need to be disrupted to form the transition state. ΔH
* values reflect the extent of disruption of non-covalent interactions during the enzyme inactivation. The ΔH
* values calculated for
Pseudanabaena sp. α-glucosidases deactivation appear to be in the typical range reported for other enzymes such as amylases, which exhibit values from 56 to 150 kJ mol
−1 [
19].
The entropy change (ΔS*) indicates the enzyme disorder due to its disruption, while its values reflect the level of randomness and disorder of the molecule. In the current study, ΔS* values ranged from 105 to 108 kJ mol−1 across all the tested temperatures, indicating high values. Positive and high ΔS* values indicate increased disorder and reduced enzyme stability.
Gibbs free energy (ΔG*), which represents the energetic threshold for enzyme inactivation, is a critical parameter for assessing enzyme stability. ΔG* includes both entropic and enthalpic parameters, constituting a more reliable parameter for enzyme thermal stability determination. While smaller and negative ΔG* values are related with more spontaneous processes, higher values are associated with more stable enzymatic systems. In the present study, α-glucosidase is characterized by a range of ΔG* values from 96 to 98 kJ mol−1 as the temperature is decreased. As the temperature increased, ΔG* values decreased, while remaining positive, corresponding with a non-spontaneous process and better resistance to the unfolding system. The slight decline in ΔG* with increasing temperature is consistent with the reductions in t1/2 and D values.
Summarizing, these values indicate a high resistance to thermal inactivation, reflecting the enzyme’s enhanced ability to prevent its thermal unfolding, making it appropriate for industrial applications.
4. Conclusions
In the present study, Pseudanabaena sp. exhibited rapid growth under heterotrophic conditions when maltose was used as a carbon source, leading to substantial biomass accumulation. Concurrently, the cells produce an intracellular α-glucosidase quantitatively, achieving remarkably high productivity. Optimal culture conditions for achieving maximal and cost-effective enzyme production were established. Subsequent cultivation in a 2 L bioreactor under time-course experiment revealed that α-glucosidase synthesis occurred at the early stage of the cultivation period. Subsequently, the produced enzyme was purified and characterized.
The purification process was carried out in three steps: ammonium sulfate fractionation, ion exchange and gel filtration chromatography. The purified α-glucosidase had a molecular mass of 52 kDa, displayed optimal activity at a neutral pH of 7.0, and remained stable within an acidic to neutral pH range from 4.0 to 7.0. The enzyme activity was influenced by both the concentration of metal ions and the chelator, as well as by the interaction time.
The thermodynamic parameters for pNPG hydrolysis at the optimal temperature of 40 °C were as follows. Enthalpy (ΔH*), entropy of activation (ΔS*), Gibbs free energy (ΔG*), free energy of substrate binding (ΔG*E-S) and transition state formation (ΔG*Ε-Τ) were 21.6 kJ mol−1, −116 kJ mol−1, 57.8 kJ mol−1, −22.2 kJ mol−1, −41.2 kJ mol−1, respectively. These values indicate the formation of an efficient complex between enzyme and substrate and a spontaneous conversion to product, while the low Ea value (24.2 kJ mol−1) highlights the enzyme’s effective hydrolytic capacity.
Moreover, the thermodynamic parameters for the thermal inactivation of the enzyme were as follows. ΔH* was 131 ± 1 kJ mol−1, 105 ≤ ΔS* ≤ 108 kJ mol−1, 96 ≤ ΔG* ≤ 98 kJ mol−1, while the thermal inactivation energy (E(a)d) was calculated to be 133 kJ mol−1. These findings are associated with the enzyme’s better resistance to thermal inactivation.
To conclude, this study provides the first evidence of α-glucosidase production from a cyanobacterial isolate. The nature of the produced α-glucosidase and its thermodynamic properties indicate enhanced resistance of the enzyme to thermal unfolding and high catalytic efficiency. These characteristics make it appropriate for various industrial applications.
Therefore, the above findings obviously suggest that Pseudanabaena sp. can be considered a promising candidate as a novel enzyme-producing microorganism.

