Article

Fuel Properties of Torrefied Pellets from Maize Residues and Cocopeat Byproducts

1
Forest Industrial Materials Division, National Institute of Forest Science, 57, Hoegi-ro, Dongaemungu, Seoul 02455, Republic of Korea
2
Department of Interdisciplinary Program in Smart Agriculture, Kangwon National University, Chuncheon 24341, Republic of Korea
3
Korea Research Institute on Climate Change, 11, Subyeongongwon-gil, Chuncheon 24239, Republic of Korea
4
Agriculture and Life Science Research Institute, Kangwon National University, Chuncheon 24341, Republic of Korea
*
Author to whom correspondence should be addressed.
Biomass 2025, 5(4), 59; https://doi.org/10.3390/biomass5040059
Submission received: 31 August 2025 / Revised: 25 September 2025 / Accepted: 25 September 2025 / Published: 29 September 2025

Abstract

Agricultural residues such as maize byproducts and discarded cocopeat substrates are abundant but underutilised biomass resources. Improving their fuel quality requires densification, such as pelletisation, combined with thermochemical upgrading. In this study, pellets were prepared by blending cocopeat and maize residues at weight ratios of 9:1, 7:3, and 5:5, followed by torrefaction at 220, 250, and 280 °C. Their fuel characteristics were evaluated through mass yield, elemental and proximate analyses, chemical composition, calorific value, combustion indices, and grindability. Results showed that increasing maize residue content reduced ash and fuel ratio but increased volatile matter, while cocopeat-rich pellets provided higher fixed carbon and lignin contents, improving thermal stability. Torrefaction significantly enhanced calorific value (up to 21.83 MJ/kg) and grindability, while increasing aromaticity. However, higher torrefaction severity decreased the combustibility index but improved volatile ignitability, indicating a trade-off between ignition behaviour and stable combustion. An optimal balance was observed at 250 °C, where energy yield and combustion performance were maximised. This study demonstrates the feasibility of valorising discarded cocopeat substrates, blended with maize residues, into renewable solid fuels, and provides practical guidance for optimising blending ratios and torrefaction conditions in waste-to-energy applications.

1. Introduction

With the intensifying global environmental crisis and the depletion of fossil fuel resources are being pointed out as problems. The UN has referred to it as global boiling, not global warming [1]. The demand for clean and renewable energy substitutes has thus grown noticeably. Among various biomass, agricultural residues have been recognised as a viable renewable energy source due to their carbon-neutral potential and the fact that they are produced through sustainable agriculture [2,3,4,5,6,7].
In addition, the food security crisis is being emphasised due to environmental pollution. Accordingly, greenhouse farming, especially hydroponics farming, is on the rise. The global hydroponics market is estimated to be about 5 billion dollars in 2023, as shown in Figure 1 [8]. As hydroponics increases, the use of cocopeat is also increasing. The cocopeat market is estimated to be about 0.38 billion dollars in 2024 and is expected to increase to 0.47 billion dollars by 2032 [9]. However, in the case of cocopeat badge after use, it is being discarded without any specific use.
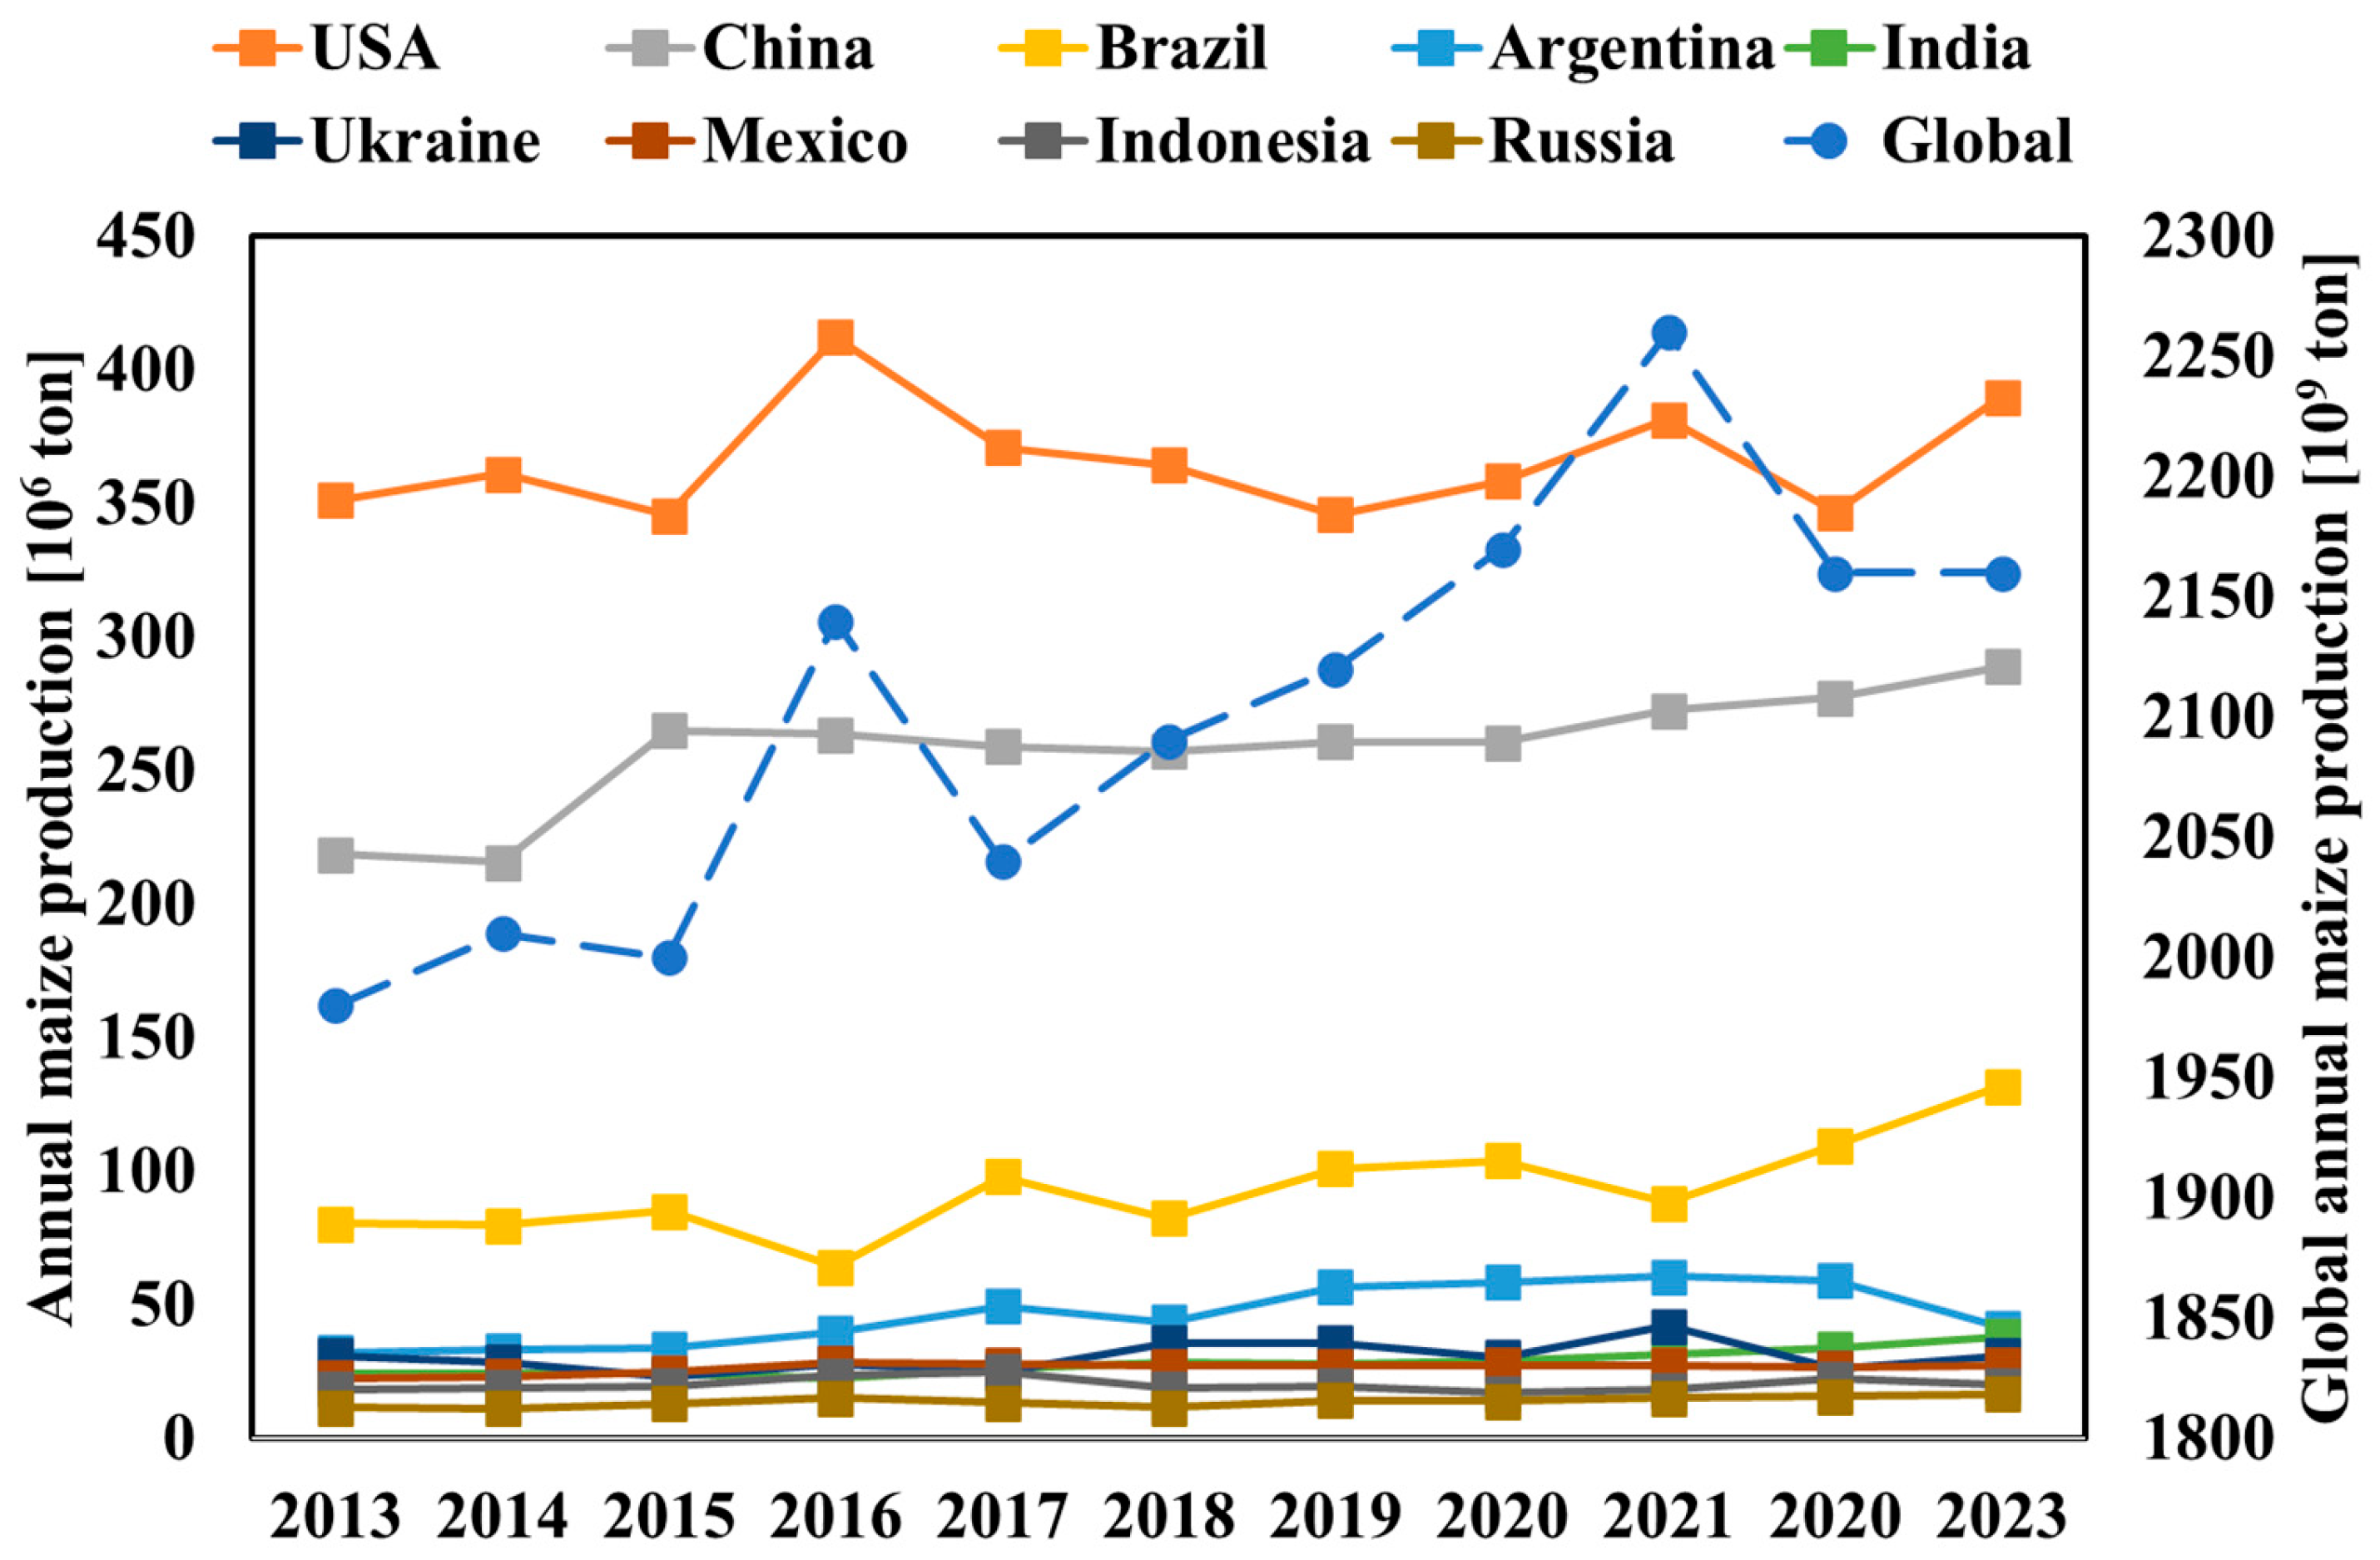
Maize is one of the most important cereal crops worldwide, serving as a staple food for a large portion of the global population (Figure 2), and thus, its cultivation volume is substantial [10]. Global production has steadily increased, from 1.98 Gt in 2013 to a record high of 2.26 Gt in 2021, before slightly declining to 2.16 Gt in 2023. Among this, 31.4% and 23.3% of total production were reported in the United States and China, respectively [11]. It is estimated that more than 60% of the corn produced is used as livestock feed [10,12]. However, only about 30–50% of the grain portion is directly consumed or utilised, while the remaining parts, such as stalks and husks, are occasionally used as animal feed but are largely discarded [13,14,15].
Previous studies have explored the potential of biomass fuels, particularly focusing on commonly used sources such as wood pellets, rice husks, and corn stover. Park et al. (2020) produced pellets using red pepper, perilla, rice husk, and coffee grounds, and mixed the coffee grounds, which had the lowest quality, with other agricultural byproducts [16]. Based on this, they reported that the quality of agricultural byproduct pellets can be improved through mixing [16]. Kaewtrakulchai et al. (2025) reported that torrefaction of brewery waste, palm kernel shell, and water hyacinth improved fuel quality and hydrophobicity, with optimal performance at 180 °C [17]. Kumar et al. (2022) produced five combinations of pellets using pearl millet cob, corn cob, and eucalyptus sawdust and compared their physical, mechanical, and thermal properties [18]. The study reported that the combination of pearl millet cob and corn cob had good combustibility and could be used as a biomass fuel [18]. Stulpinaite et al. (2023) evaluated the feasibility of using hemp residues as fuel by mixing them with various ratios of oak and lignin and forming pellets [19]. They reported that the optimal fuel properties were achieved when 50% hemp, 25% lignin, and 25% oak were mixed. Niedziółka et al. (2015) reported that the physical and energetic properties of pellets produced from agricultural residues varied significantly depending on the type of raw material used [20].
However, limited research has investigated used abandoned cocopeat badge. Wan Ahmad and Nagappan (2024) attempted to find an optimal moisture-retaining mixture using natural reinforcements to improve the performance of electrical grounding systems, using biochar, cocopeat, and palm kernel oil cake [21]. Borres and Virginia Mora (2022) produced biomass briquettes using cocopeat and coffee husk, and analysed the calorific value, combustion rate, and ignition speed [22]. They stated that briquettes mixed with cocopeat and coffee husk had some advantages of the high efficiency of coffee husk briquettes and the fast ignition and strong durability of cocopeat briquettes but had low fuel efficiency. Despite these various studies, low calorific value, energy density, and hygroscopicity are among the several drawbacks of this kind of biomass. The torrefaction process is being put forward as an alternative way to deal with these issues.
To improve these shortcomings, using cocopeat substrate alone has limitations. To overcome these drawbacks, other approaches can be applied, such as physical methods (pelletisation and briquetting) as well as thermochemical processes. Biomass can be densified into pellets (6–12 mm diameter, high density, uniform size; suitable for automated systems) or briquettes (25–100 mm blocks, lower density but larger unit mass; suitable for local or industrial use). Pellets are more standardised for trade and co-firing, while briquettes are often used in rural heating and short-distance applications [23,24]. Agar et al. (2018) systematically studied the ring-die pelletisation of eight forest and agricultural biomasses [25]. They reported that most feedstocks achieved good durability (91–99%) and bulk density (532–714 kg/m3), strongly influenced by moisture content and press channel length [25]. Duca et al. (2022) evaluated pellets from olive and vineyard pruning, pure and blended with spruce sawdust [26]. They found that a 20% pruning addition improved durability from 78.4% (pure sawdust) to over 90%, showing blending valorises low-quality residues [26]. Shuma and Madyira (2017) produced loose briquettes from agricultural and forestry residues without binders [27]. They reported that briquette quality depended strongly on particle size, pressure, and moisture, with optimal conditions improving strength and energy density.
Biomass can be upgraded through thermochemical processes, including pyrolysis, gasification, carbonisation, and torrefaction [28,29]. Among these, torrefaction is a mild thermochemical treatment carried out at 200–300 °C under an inert atmosphere, leading to partial hemicellulose decomposition, a reduction in oxygen content, and enrichment in carbon fractions [30,31,32]. After torrefaction, fuel properties can be improved by reducing oxygen content and increasing energy density [28,33]. Through this, high-quality and uniform solid fuel can be obtained [7,34,35,36]. Kim et al. (2022) showed that mild torrefaction (200–220 °C, 20–30 min) improved kenaf fuel quality, while harsher conditions caused excessive mass loss [37]. Sui et al. (2024) compared oxidative and non-oxidative torrefaction using cotton stems and showed that the calorific value increased up to 21.82 MJ/kg [38]. However, they reported that carbon loss was large, and fuel efficiency decreased when the temperature exceeded 300 °C and oxygen content exceeded 10%.
Previous studies have investigated the use of agricultural residues as fuel, often by blending different byproducts. However, discarded cocopeat substrates have rarely been considered as a potential feedstock, and research on their blending with other residues has been almost non-existent. In this study, torrefied biomass pellets were produced from maize residues blended with discarded cocopeat substrates at varying ratios. The combined effects of blending ratio and torrefaction temperature on mass yield, elemental composition, calorific value, combustion indices, and grindability were systematically examined, whereby the scope of biomass torrefaction research was extended to a rarely utilised agricultural residue and practical insights for waste-to-energy applications were provided.

2. Materials and Methods

The present study utilised discarded cocopeat badge and maize residue as the primary experimental materials. During the manuscript preparation, the authors used QuillBot (https://quillbot.com), a generative AI tool, to improve language clarity and grammar. The final content was thoroughly reviewed and revised by the authors, who take full responsibility for the accuracy and integrity of the published work.

2.1. Pelletisation Process

All biomass samples were oven-dried at 105 °C prior to grinding. The dried samples were ground using a commercial mixer (SMX-R500JS, SHINIL ELECTRONICS Co., Ltd., Seoul, Republic of Korea), equipped with a 3.15 mm sieve. Only particles smaller than 3.15 mm were retained for pelletisation. The maize residues used consisted mainly of stalks and husks, which were classified and homogenised before grinding. The biomass mixtures were homogenised by manual hand mixing for 30 min before palletisation. The mixing ratios of the cocopeat to maize residue were established on a weight percentage basis at three levels (9:1, 7:3, and 5:5, wt%). The prepared mixtures were subsequently pelletised using a pelletiser (FBP-200, Foreco Co., Ltd., Seoul, Republic of Korea). For clarity, the resulting pellets were designated as C91, C73, and C55, corresponding to their respective mixing ratios. Pellet size was 6 mm for diameter and approximately 40 mm for length. Water was added to adjust the final moisture content to 13 wt%. Table 1 showed the properties of each sample.

2.2. Torrefaction Process

An electrical furnace (N 7/H/B410; Nabertherm GmbH, Lilienthal, Germany) and a stainless-steel can (diameter: 75 mm, height: 55 mm) were employed to conduct torrefaction. A total of 40 ± 1 g of each sample was placed in separate cans, and all treatments were performed in triplicate. Due to the low bulk density, the pellets were lightly pressed into the can, which consequently reduced the tendency for interaction with the oxygen inside the can. Before torrefaction process, samples were dried for more than 24 h under 105 °C to prevent the effect of moisture content. The torrefaction process was performed with a lid on the can to inhibit quick reaction with oxygen. The process temperature was 220, 250, and 280 °C. Based on preliminary experiments, it was determined that approximately one hour was necessary to achieve uniform heat distribution. Therefore, the process was carried out for a duration of one hour. The samples were put into ambient conditions for 30 min after the experiments to prevent the rapid reaction between the activated samples and oxygen. The subsequent mass reduction was then quantified [37]. The mass yield was calculated using Equation (1), which is predicated on mass reduction.
M Y   % = M B M T × 100
where MY is the mass yield (%), and MB and MR are the mass of biomass after and before pyrolysis (g), respectively.

2.3. Fuel Characteristics Evaluation

2.3.1. Elemental Composition Changes

In order to characterise the fuel-relevant elemental profile of the biomass samples, concentrations of C, H, N, and S were quantified using an elemental analyser (FlashSmart, Thermo Fisher Scientific, Waltham, MA, USA). Equation (2) was utilised to determine the oxygen concentration by difference on a dry and ash-free basis [36].
O % = 100 ( C + H + N + S )
Although the hydrogen and oxygen contents tended to reduce, the carbon composition tended to increase as the severity of torrefaction (i.e., process temperature or duration) increased. To find how much devolatilisation happened during the torrefaction process, elements in the samples are tested for their decarbonisation (DC), dehydrogenation (DH), and deoxygenation (DO) concentrations [39,40].
The carbon content of untreated biomass (OC) can be expressed as follows [41]:
O C [ % ] = W o × 100 M C o A s h o × 10 2 × Y C , O
where WO represents the initial sample weight in grammes, MC denotes the moisture content in percentages, and YC denotes the mass fraction of carbon in percentages. “O” in the subscript denotes primordial matter or unprocessed matter.
The residual carbon content (RC) in the torrefied biomass, denoted as RC with the subscript “t,” was calculated to quantify the amount of carbon retained after thermal treatment. This calculation assumed that the biomass samples were completely bone-dry, with a moisture content (MC) of zero.
R C [ % ] = W O × M Y × 100 M C t A s h t × 10 2 × Y C , t
To quantify carbon loss induced by torrefaction, decarbonisation (DC) was defined as the percentage of initial biomass carbon that was not retained after treatment.
D C   [ % ] = 1 R C O C × 100
DH and DO were defined analogously to DC, representing the percentage loss of hydrogen and oxygen, respectively. Their definitions are structurally equivalent.

2.3.2. Proximate Analysis Changes

Biomass samples were oven-dried at 105 °C, ground to <1 mm, and approximately 1 g of each sample was analysed to determine volatile matter (VM), fixed carbon (FC), and ash contents using a proximate analyser (Prep229, Dietikon, Precisa, Switzerland) in accordance with ASTM D1762-84 standards [42]. As the samples were pre-dried before analysis, the influence of moisture was disregarded.
The fuel ratio (FR), defined as the ratio of FCdb to VMdb, is a widely used indicator of combustion characteristics, particularly in coal-fired power plants. Typically ranging from 0.5 to 3.0, FR provides insight into ignition behaviour and flame stability. However, when the FR exceeds 2.0, it may lead to poor ignition and unstable flame propagation, thereby hindering efficient combustion [43,44]. In this study, FR was calculated using Equation (6) [43,45], based on the previously obtained proximate analysis results.
F R = F C d b V M d b
where the subscript db represents the dry-based method.

2.3.3. Chemical Composition Changes

Chemical composition changes were calculated using the following equations [46]:
C e l l   [ % ] = 152.237 + 0.838 C 10.405 H + 3.3091 O 37.061 H C 2 + 177.211 H C + 20.086 O C 2 136.126 O C + 0.151 V M + 0.391 F C 4.52 F C V M ,
H e m i   [ % ] = 1465.909 + 0.212 C 2 + 0.66 H 2 + 0.101 O 2 33.374 C 49.249 H + 10.983 O 66.583 H C 2 + 363.635 H C + 209.649 O C 2 1329.208 O C 0.376 V M 0.673 F C
L i g   [ % ] = 121.824 + 39.757 H C 2 128.192 H C + 23.719 O C 2 56.877 O C 0.042 V M 2 + 6.932 V M + 0.000473 F C 2 2.954 F C 45.172 F C V M 2 + 239.132 F C V M
Cell refers to cellulose, Hemi stands for hemicellulose, and Lig refers to lignin.

2.3.4. Calorific Value and Energy Yield Changes

To evaluate the energy performance of the torrefied biomass, the energy yield was calculated using Equation (10), which incorporates both the calorific value and the corresponding mass yield. Calorific values were experimentally determined using a bomb calorimeter (CAL-3K, DDS Calorimeters, Randburg, South Africa), based on the average of three replicate measurements.
E Y [ % ] = H H V T H H V R × M Y
Energy yield (EY) [%] was defined using the gross calorific value (CV, in MJ/kg), with subscripts “T” and “R” indicating torrefied and raw biomass, respectively.

2.3.5. Combustion Indices

To evaluate torrefaction efficiency and fuel quality, combustion-related parameters including the combustibility index (CI), volatile ignitability (VI), and CV were analysed [34,35]. Biomass combustion performance was assessed in the context of coal co-firing, which is generally considered feasible when the CV exceeds 8.37 MJ/kg. The CI, a widely used parameter in thermal power plants—particularly for coal blending—was employed to characterise combustion behaviour, with values outside the range of 12.56–23.02 MJ/kg regarded as suboptimal for stable combustion. In addition, the VI was defined to estimate the energy contribution from volatile matter, under the assumption that FC consists entirely of pure carbon. For effective ignition, a minimum specific CV of 14 MJ/kg for the volatile matter is recommended. CI and VI were calculated according to Equations (11) and (12), respectively.
C I   [ M J / k g ] = C V F R × 115 A s h × 1 105
V I   [ M J / k g ] = C V d b 0.338 F C d b V M d b + M × 100
where VI denotes the volatile ignitability (MJ/kg), and db represents the dry-based method. In this study, the MC was considered, as the proximate composition was determined on a dry basis.

2.3.6. Physical Indices

Aromaticity is an assessment utilised to gauge the chemical stability of this reaction [47]. Aromaticity was evaluated using Equation (13) to characterise the degree of structural transformation during torrefaction. This parameter reliably reflects the transition from maceral to char, serving as a consistent indicator of coalification due to progressive rearrangement of carbon structures [48].
f a = 0.967 F C d a f C d a f
where fa refers aromaticity, and daf stands for dry and ash free.
As a standard measure of coal quality, the Hardgrove Grindability Index (HGI) is widely used to assess the ease of grinding coal. It plays a critical role across various stages of coal handling, including mining, beneficiation, and utilisation [49].
In the subject of biomass, in the absence of a criterion to ascertain particular pulverisation, the HGI is employed as is. Furthermore, torrefaction resembles coal; thus, it is often employed in its unaltered state [50,51,52]. To evaluate the grindability of torrefied biomass, the HGI was calculated using the following equations. [53]:
H G I   [ ] = 77.162 + 3.994 ln S 10.920 H + 1.904 M 0.424 A s h 11.765 ln O + N C
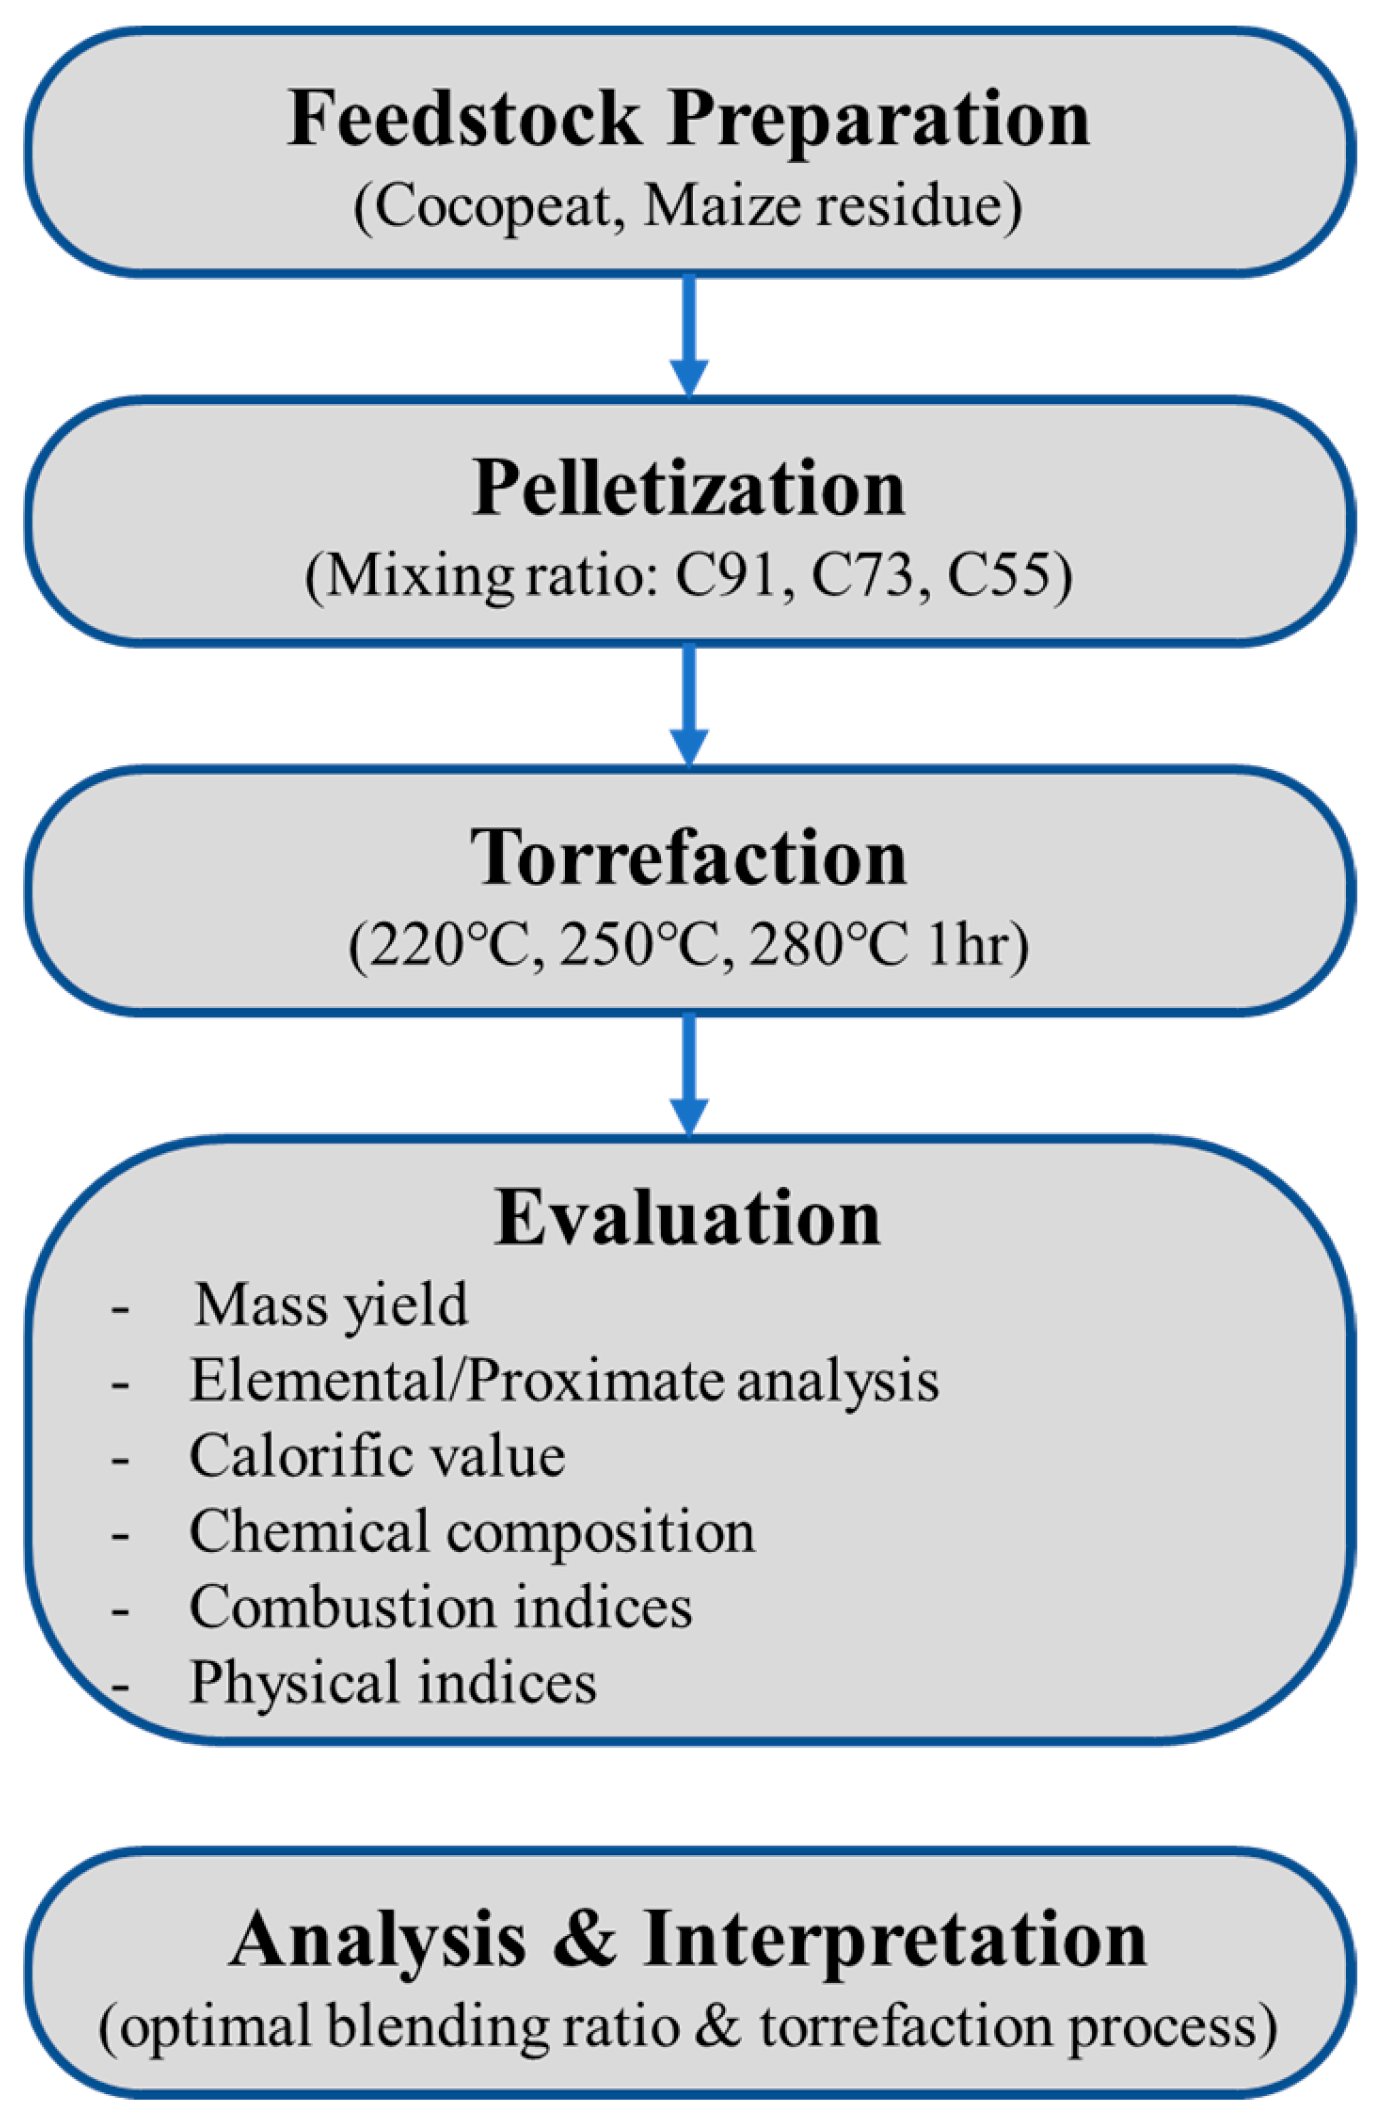
The overall workflow of the study is summarised in Figure 3.

3. Results and Discussion

3.1. Effect of Torrefaction Temperature on Mass Yield

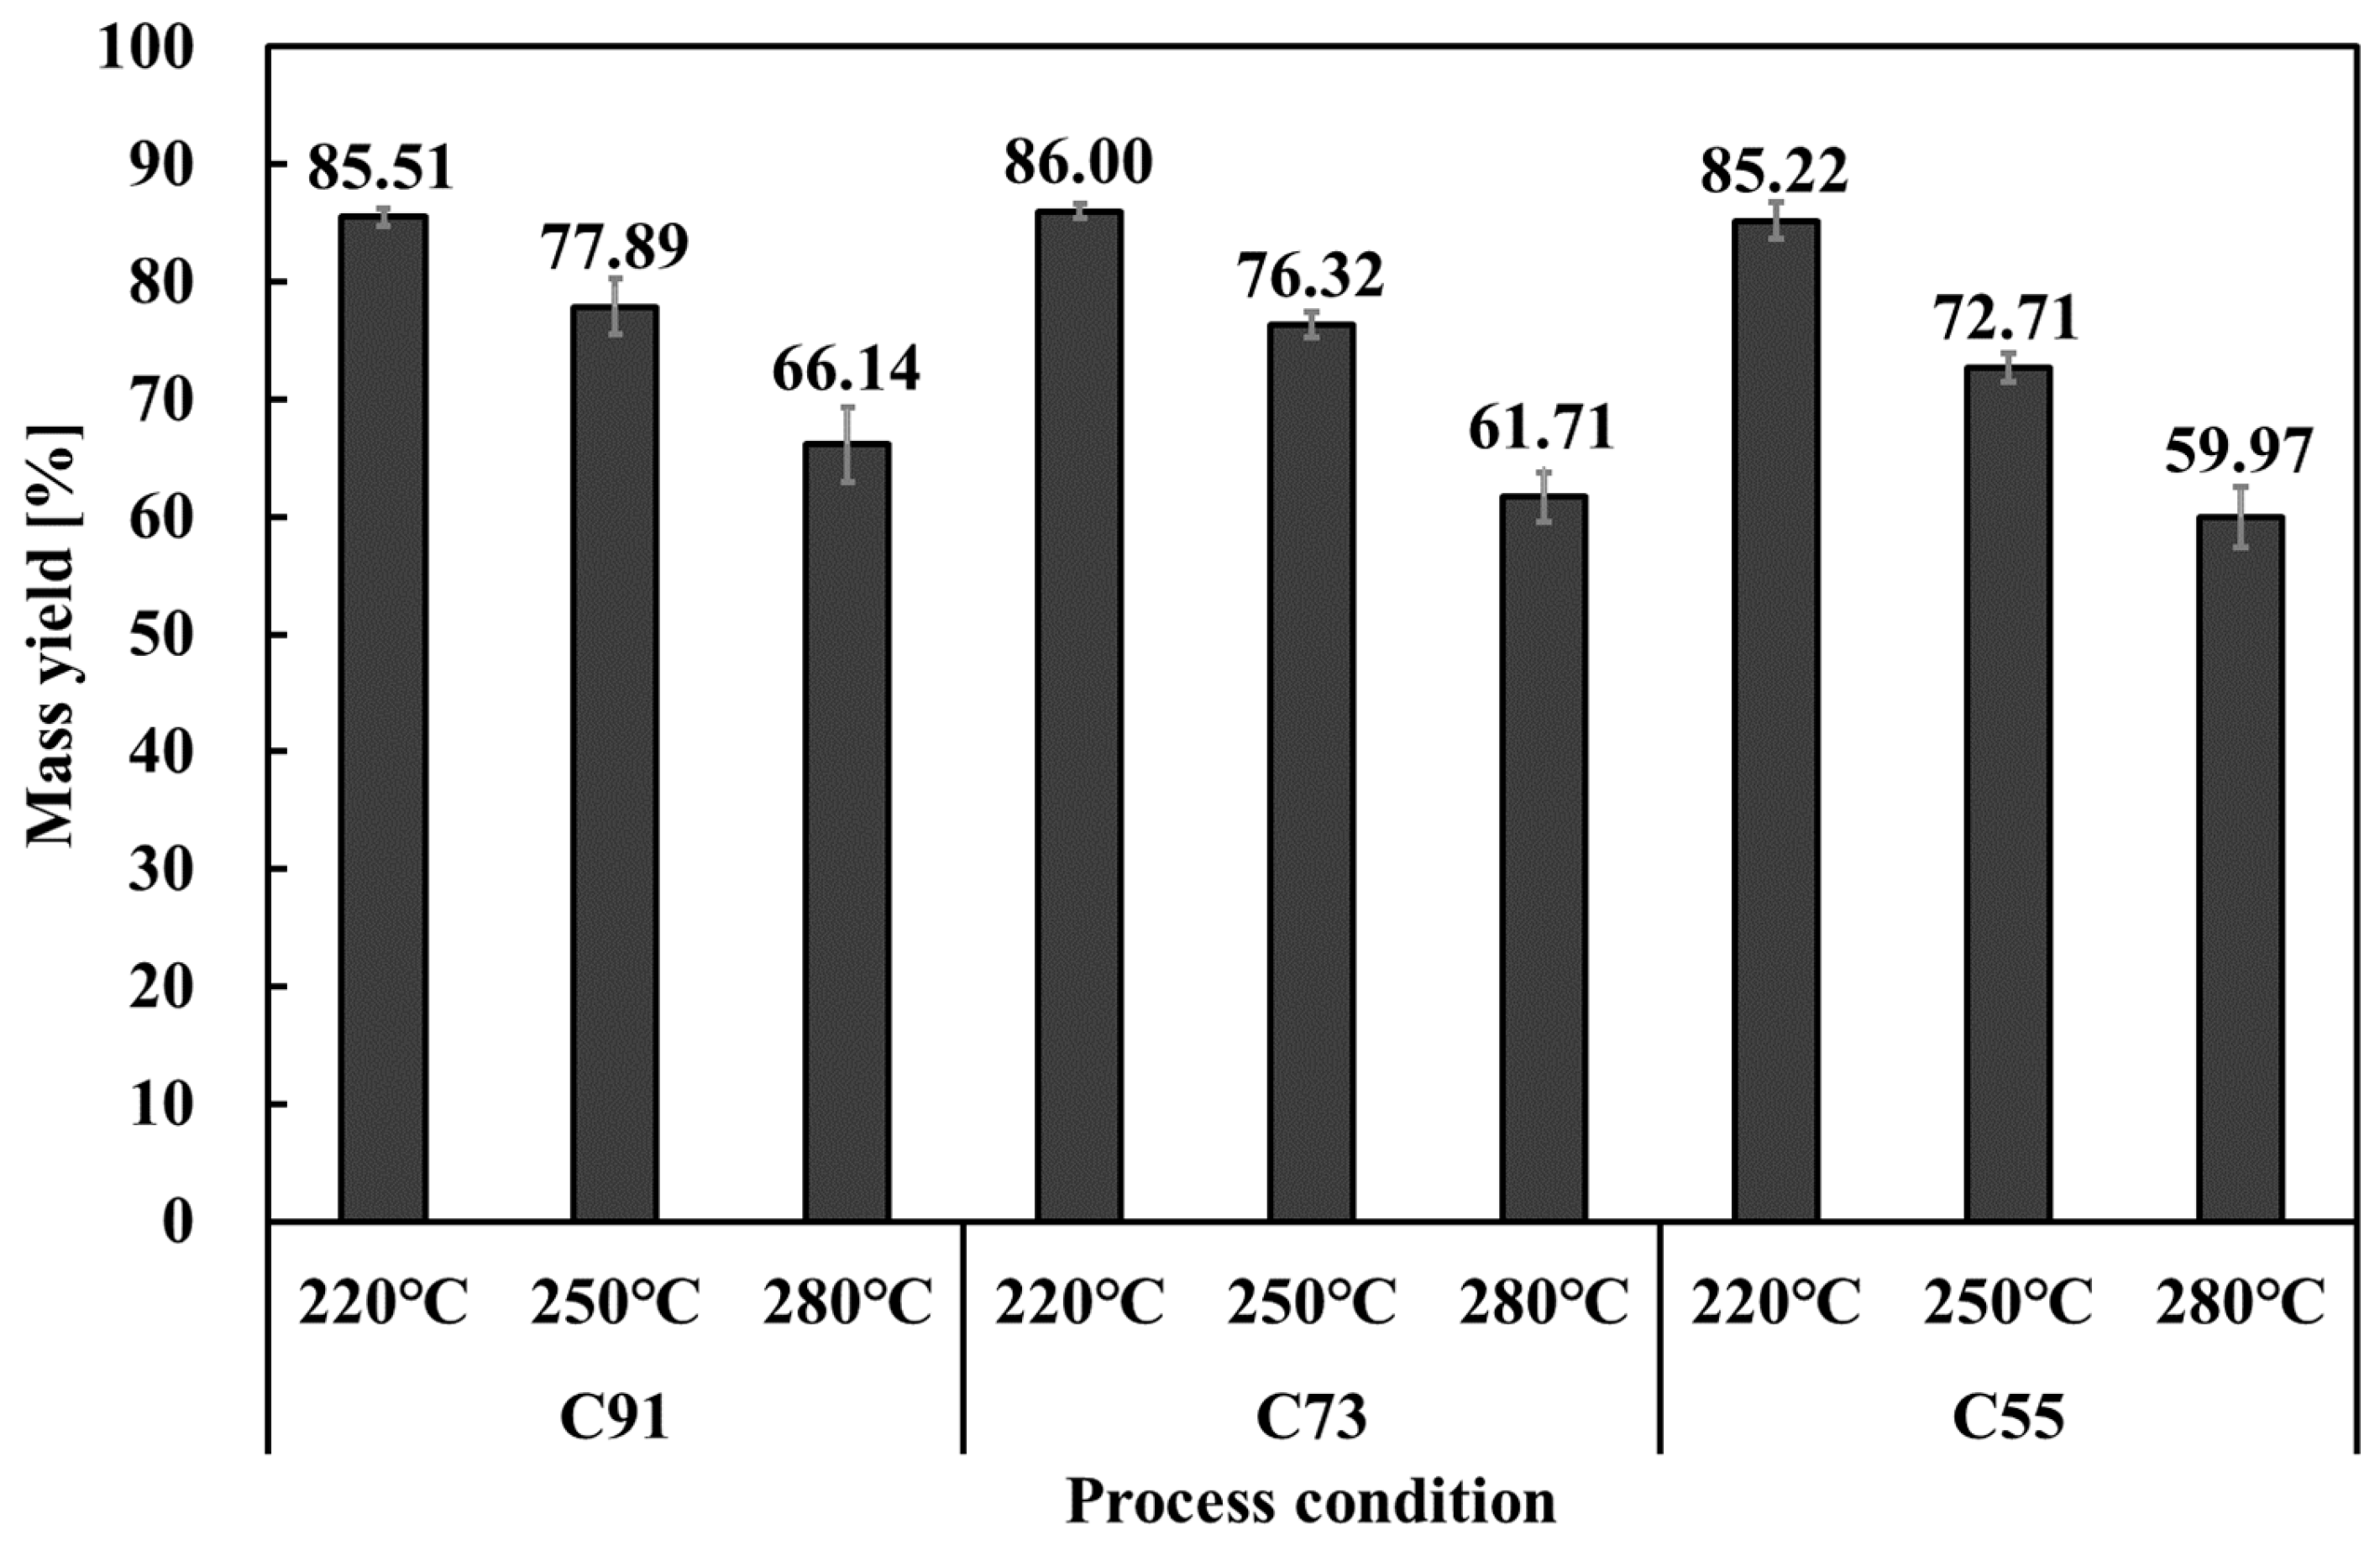
Figure 4 illustrated the mass yield according to the mixture ratio and torrefaction process. The effect of torrefaction temperature on mass yield was evident, as higher torrefaction temperatures led to a progressive decrease in the mass yield. Due to the increase in the maize residue ratio, the mass yield under 220 °C ranged from 85.22% to 86.00%. Although the values were relatively close, statistical analysis (ANOVA with Tukey’s test) revealed that C55 exhibited a significantly lower mass yield compared with C73 and C91, while no significant difference was observed between C91 and C73. Although C73 showed the highest mass yield under 220 °C, C91 showed the highest mass yield under 250 °C and 280 °C. Under 250 °C, there was no significant difference between C91 and C73, showing 77.89% and 76.32% of mass yield, respectively. Also, C73 and C55 under 280 °C showed no significant difference. This seemed to be because the higher the maize byproduct content, the higher the thermal decomposition property. Cocopeat contains coconut husk, which can contribute to mass loss. But, since most of cocopeat was composed of peat, it showed relatively low thermal degradability. In contrast, maize byproduct, as an agricultural byproduct, shows relatively high thermal degradability, which can influence the mass yield.
These trends can be attributed to the rapid decomposition of hemicellulose in maize residues at 200–260 °C, whereas lignin-rich fractions in cocopeat degrade more slowly. As a result, blends with higher maize content showed greater mass loss at 250–280 °C, while cocopeat addition buffered this effect by providing thermal stability. Practically, this highlights the importance of optimising blend ratios to balance mass yield and fuel quality in waste-to-energy applications.

3.2. Dependence of Elemental Composition on Biomass Blend Ratio

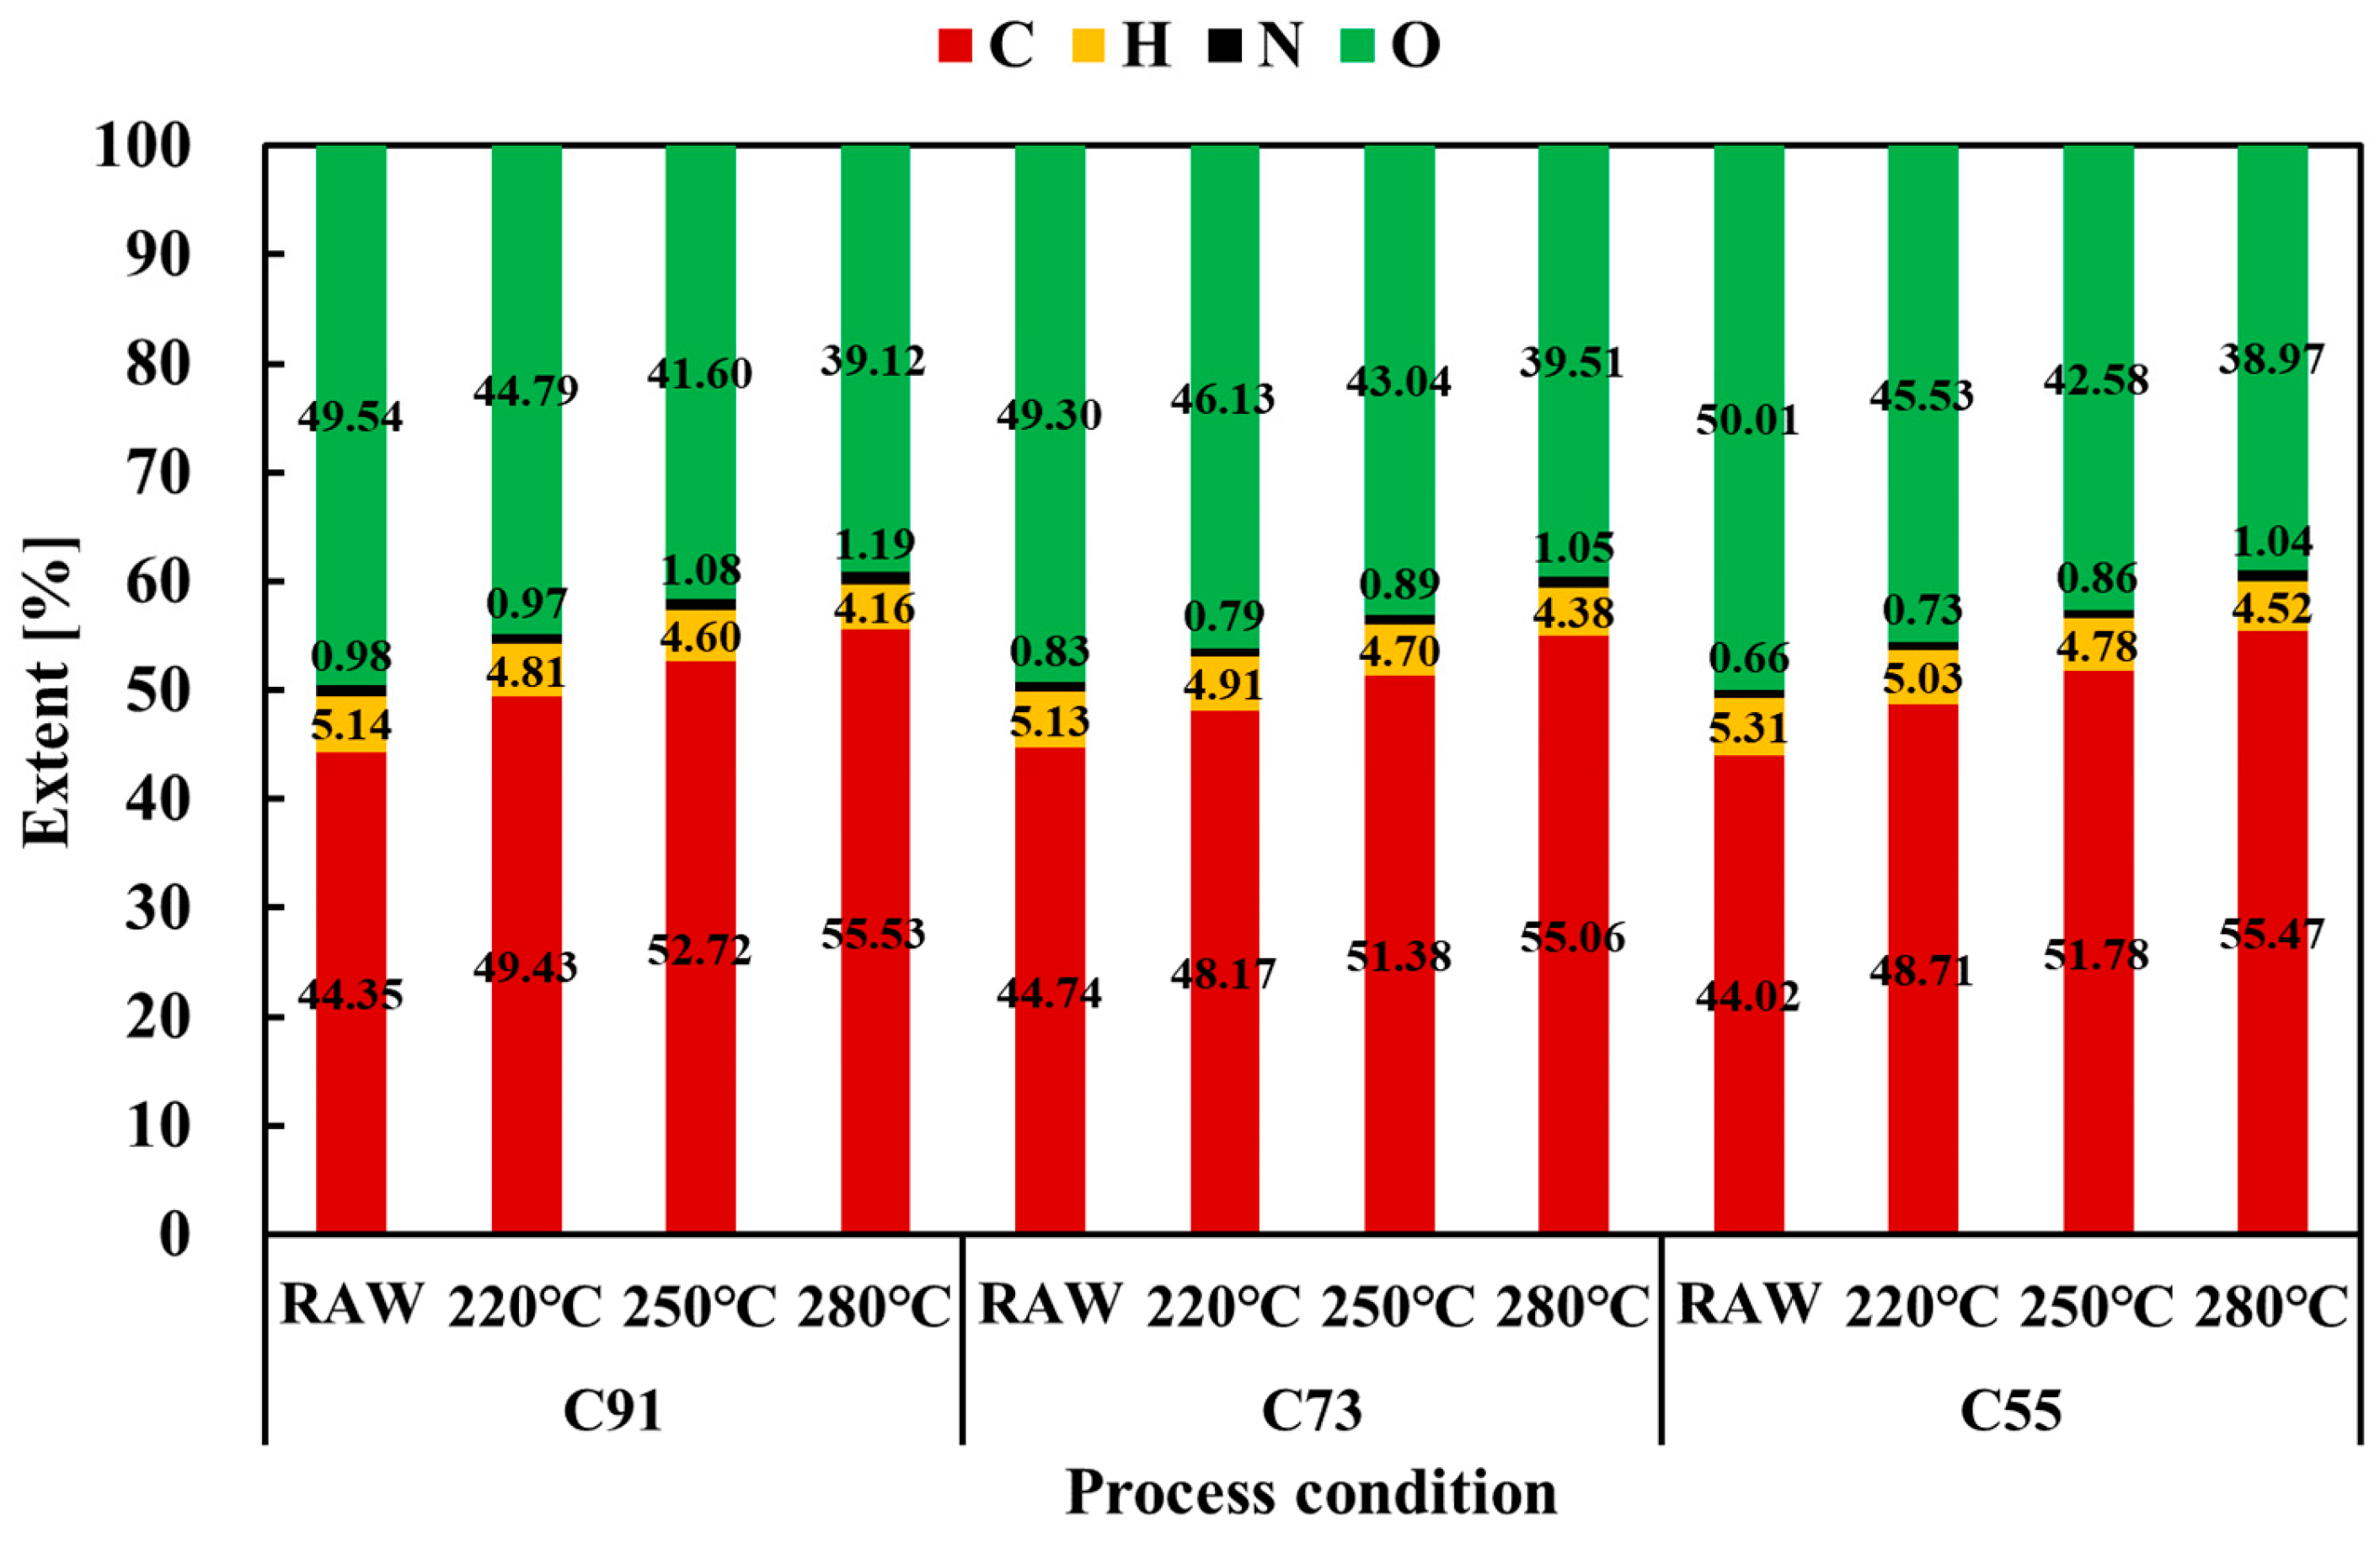
Elemental analysis results were summarised as Figure 5. In carbon, it increased and decreased as the content of maize byproduct increased. In the case of C91, the carbon content increased slightly to 44.35%, C73 to 44.74%, but it decreased to 44.02% in C55. There was no significant difference in the nitrogen and hydrogen contents. As the temperature increased, carbon increased, and oxygen and hydrogen decreased. With the exception of Untreated, C73 consistently exhibited slightly lower carbon content and higher oxygen content compared with C91 and C55 at the same temperature. This tendency can be attributed to its higher proportion of maize residues, which contain more oxygen-rich hemicellulose, rather than to biomass non-uniformity. Although the carbon content of untreated C55 was comparable to that of C73, it increased with torrefaction temperature in all cases. It was concluded that a higher cocopeat content is advantageous for increasing the carbon content, and the dependence of elemental composition on the biomass blend ratio was also confirmed. In particular, as the proportion of maize residues increased, the carbon content rose, while the oxygen content decreased.
As shown in Figure 6, DC, DH and DO was increased as temperature increased. Nevertheless, in the sample, DO and DH are larger than DC. Notably, C73 showed the highest DC and the lowest DH and DO under 220 °C, showing 7.42%, 17.60, and 19.52%, respectively. Otherwise, C55 showed the highest DC, DH, and DO under other temperatures. This helped to verify that devolatilisation occurred less at a higher cocopeat content. It seems that peat is an immature coal, which can be attributed to its relatively low organic matter content, compared with maize residue. Nonetheless, the calorific value was expected to be lower the devolatilisation happened, based on the findings of other studies showing this.

3.3. Effect of Blending Ratio and Torrefaction Severity on Fuel Ratio

Results of proximate analysis were depicted as Figure 7. As maize residue ratio increased, ash content decreased. Overall, VM increased, while FC showed a tendency to decrease. Notably, C91 exhibited the highest FC and FR values, while C55 showed the highest VM. C73 consistently presented the lowest VM and FC, which also resulted in the lowest FR across all temperatures. As process temperature increased, VM decreased, while FC and ash content increased. With this increase in FC, FR also increased with higher temperatures. At the same temperature, however, FR showed a decreasing tendency with higher maize residue ratio, which was attributed to the high volatile content of maize byproducts.
Given that the FR did not exceed 2, there would be no issue with ignition or flame stability. On the other hand, FR was less than 0.5 in untreated and 220 °C samples excluding C91, suggesting risks of overheating or incomplete combustion. Thus, stable fuel properties were considered to require torrefaction at 250 °C or above.
Based on the results of elemental analysis and proximate analysis, the chemical composition analysis was predicted, and the results are shown in Figure 8. Untreated samples were composed of 30.94–33.89% cellulose, 23.48–27.63% hemicellulose, and 32.79–34.75% lignin. As the torrefaction temperature increased, both cellulose and hemicellulose contents decreased, whereas lignin content increased significantly, reaching 56.95–60.79% at 280 °C. Compared with similar temperature processes, increasing the proportion of maize residue resulted in higher hemicellulose content and lower cellulose and lignin contents. This was attributed to the maize residue, which contained relatively less cellulose and lignin and more hemicellulose compared with unused cocopeat badge. These results indicate that the blending ratio strongly influences the balance between volatile matter and fixed carbon. The higher ash and lignin contents in cocopeat contributed to greater thermal stability, while the hemicellulose-rich maize residues promoted higher devolatilisation and reduced the fuel ratio. Similar tendencies have been reported in torrefaction studies of agricultural residues, where hemicellulose-rich fractions decomposed more rapidly, the higher FR values [54]. From a practical perspective, the results suggest that a minimum torrefaction severity (≥250 °C) is required to maintain stable ignition conditions, especially when maize residues are used in higher proportions.

3.4. Effect of Torrefaction Conditions on Energy Yield

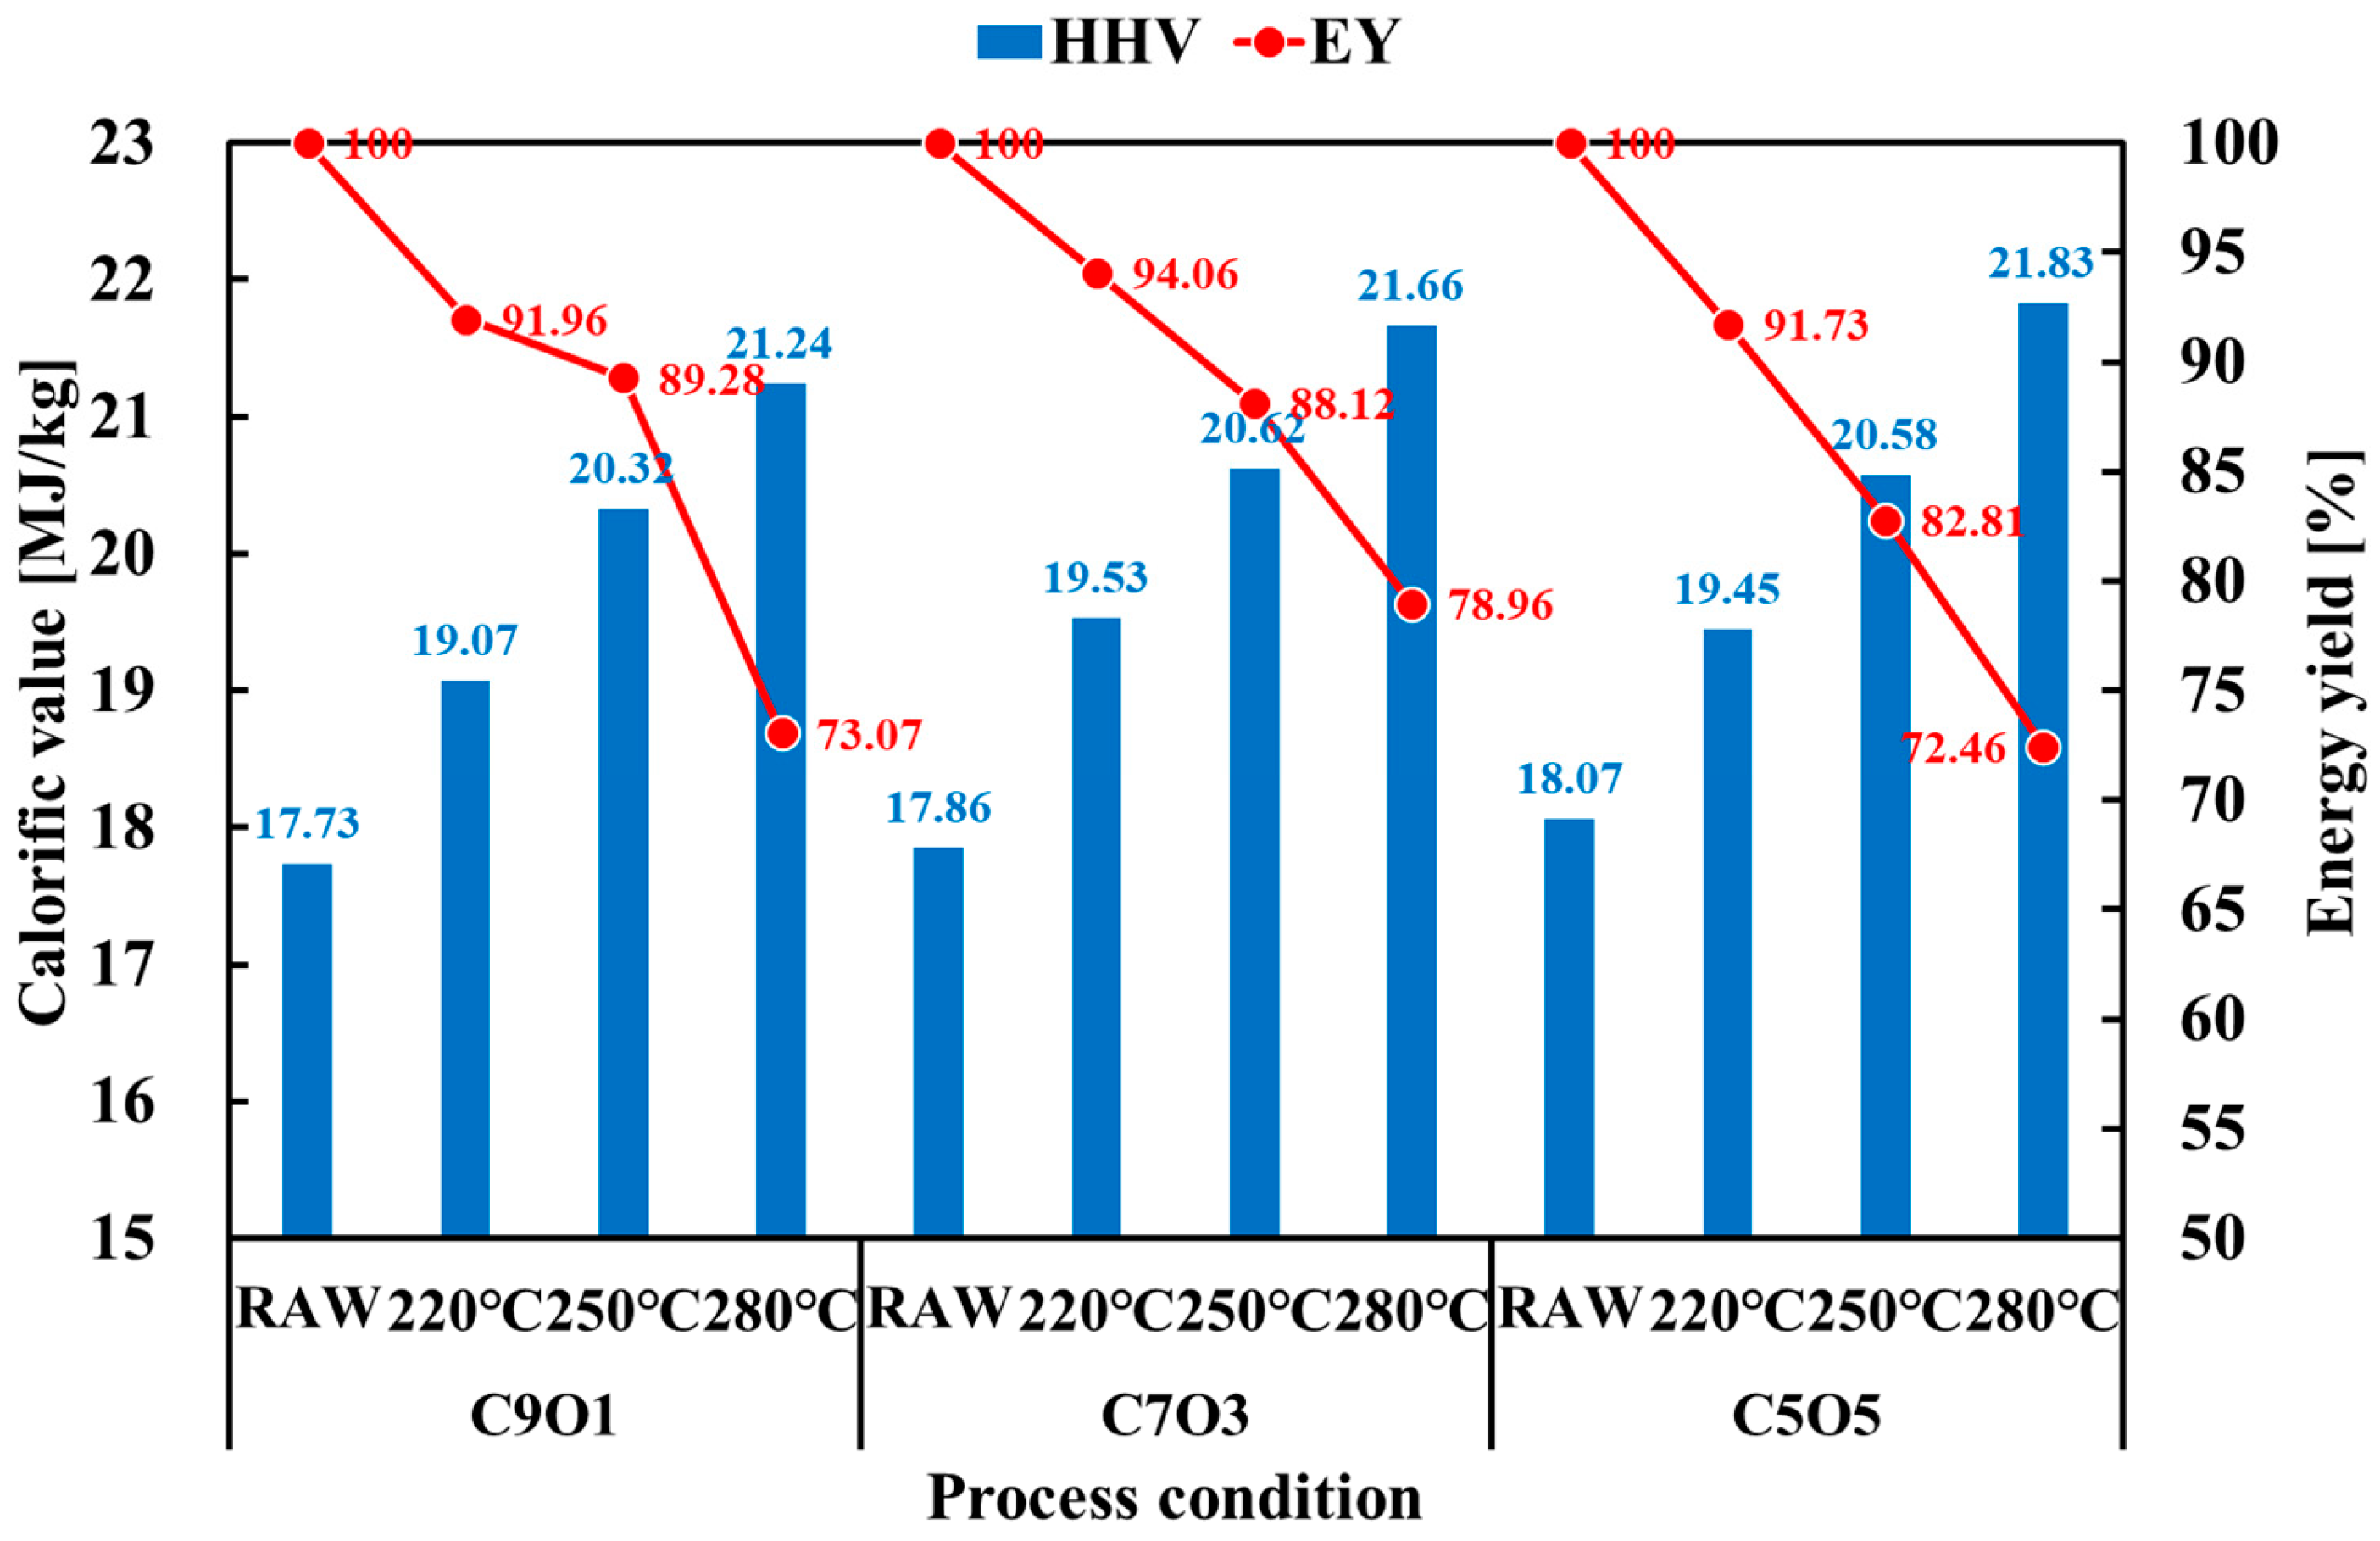
Changes in calorific value and energy yield according to mixing ratio were summarised as Figure 9. Calorific value showed a decrease as maize ratio increased. The calorific value of untreated C91 was 17.73 MJ/kg. The calorific value of C55 increased to 18.07 MJ/kg. This was considered to result from the relatively higher ash content of cocopeat than that of the maize residue. As the process temperature increased, the calorific value significantly increased, showing 19.07–21.83 MJ/kg.
For energy yield, linear tendency was observed as cocopeat ratio increased. Notably C91, energy yield difference between under 220 °C and 250 °C was low at 2.68%p. It was determined that the calorific value increase was large compared with the mass yield. C73 showed the highest energy yield was observed at 220 °C due to the highest calorific value increase. Under 250 °C, energy yield of C73 was slightly less than C91, showing 88.12% and 89.28%, respectively. But C73 was higher than C55, which was 82.81%. This was because the decomposition of hemicellulose, which had the lowest thermal decomposition, was actively carried out. This increase in calorific value can be attributed to the progressive thermal degradation of hemicellulose and cellulose, which are thermally less stable components. As torrefaction temperature rises, hemicellulose decomposes first (typically between 200 and 260 °C), followed by the partial degradation of cellulose. Meanwhile, lignin—a thermally more stable and aromatic macromolecule—undergoes structural condensation and becomes more concentrated, reaching 58.53–63.57% of the remaining mass. These physicochemical transformations result in an increased fixed carbon content and reduced oxygen content, which collectively enhance the energy density and combustion performance of the torrefied biomass.
The increase in calorific value with torrefaction temperature can be attributed to the preferential degradation of hemicellulose and cellulose, leading to oxygen removal and the enrichment of lignin-derived carbon. Previous studies have also highlighted 250 °C as a threshold for achieving a favourable balance between mass yield and calorific improvement [55]. This suggests that the choice of blending ratio and torrefaction severity should be carefully optimised: lower temperatures preserve yield but compromise energy density, while higher temperatures improve fuel quality at the expense of yield. Thus, 250 °C appears to offer a practical compromise for energy recovery from mixed residues.

3.5. Influence of Torrefaction Temperature on Combustion Properties

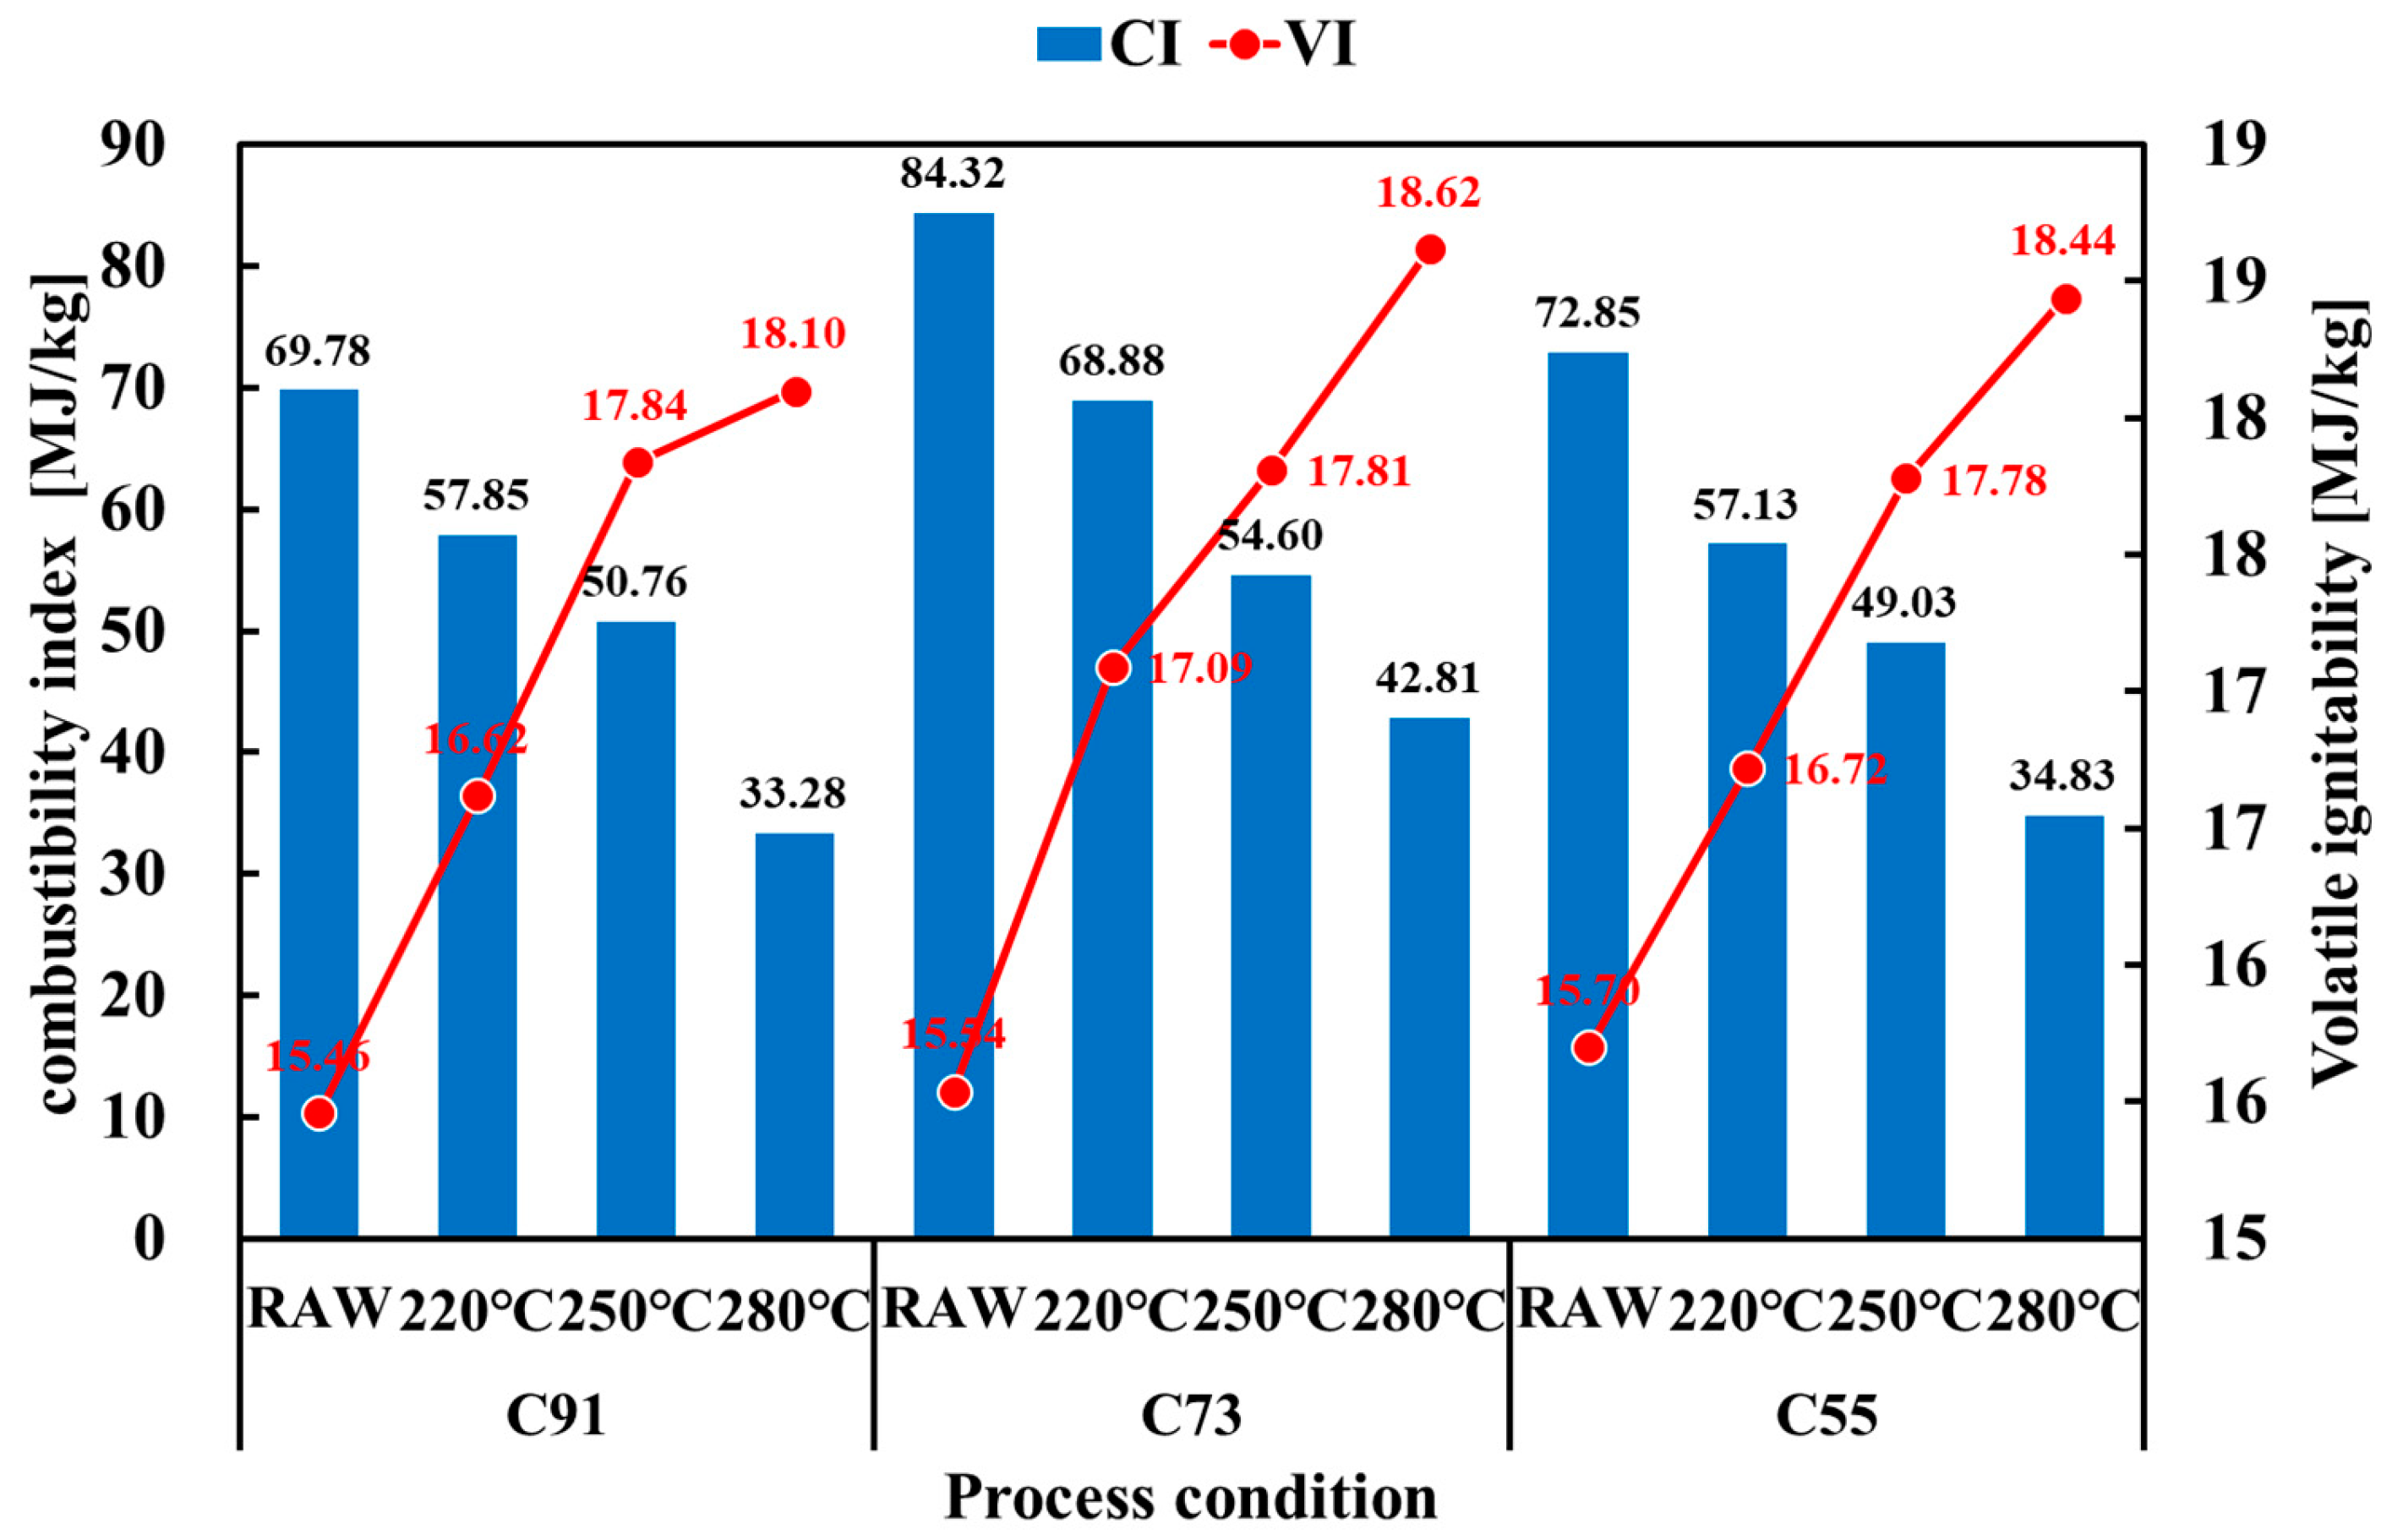
Combustion characteristics were stated in two ways: CI and VI, which were used to determine whether the fuel was difficult to burn. Figure 10 shows the changes in CI and VI. In the case of CI, untreated samples ranged from 69.78 to 84.32 MJ/kg. It was highest in C73, followed by C55, while C91 showed the lowest value. As the process temperature increased, CI decreased significantly, reaching 33.28–42.81 MJ/kg at 280 °C. At the same temperature, CI tended to be higher with a greater proportion of maize residue, although C73 consistently maintained the highest value among all samples. In all cases, the CI was greater than 23 MJ/kg, indicating that co-combustion would be challenging.
VI tended to increase overall as the process temperature increased. Untreated samples started from 15.36 to 15.70 MJ/kg and increased to 18.10–18.62 MJ/kg at 280 °C. C91 showed a slight increase at 220 °C compared with its untreated state (16.92 vs. 15.36). All samples exhibited VI values above 15 MJ/kg, and particularly C55 maintained values above 16.7 MJ/kg under all conditions, indicating that there would be no combustion failure. These results indicated that as the proportion of cocopeat increased compared with maize residues, the risk of combustion failure decreased.
The decrease in CI with increasing torrefaction severity reflects the reduction in oxygenated volatiles and the concurrent rise in fixed carbon content. In contrast, the rise in VI suggests enhanced ignition behaviour, as more energy is derived from volatile matter. This pattern is consistent with coal co-firing studies, which report that VI values above 14 MJ/kg are sufficient for stable ignition [43,56]. Accordingly, although higher maize ratios improve ignition stability through elevated VI, they may simultaneously hinder stable combustion due to the reduction in CI, underscoring the importance of maintaining an appropriate blending balance.

3.6. Influence of Torrefaction Temperature on Physical Indices

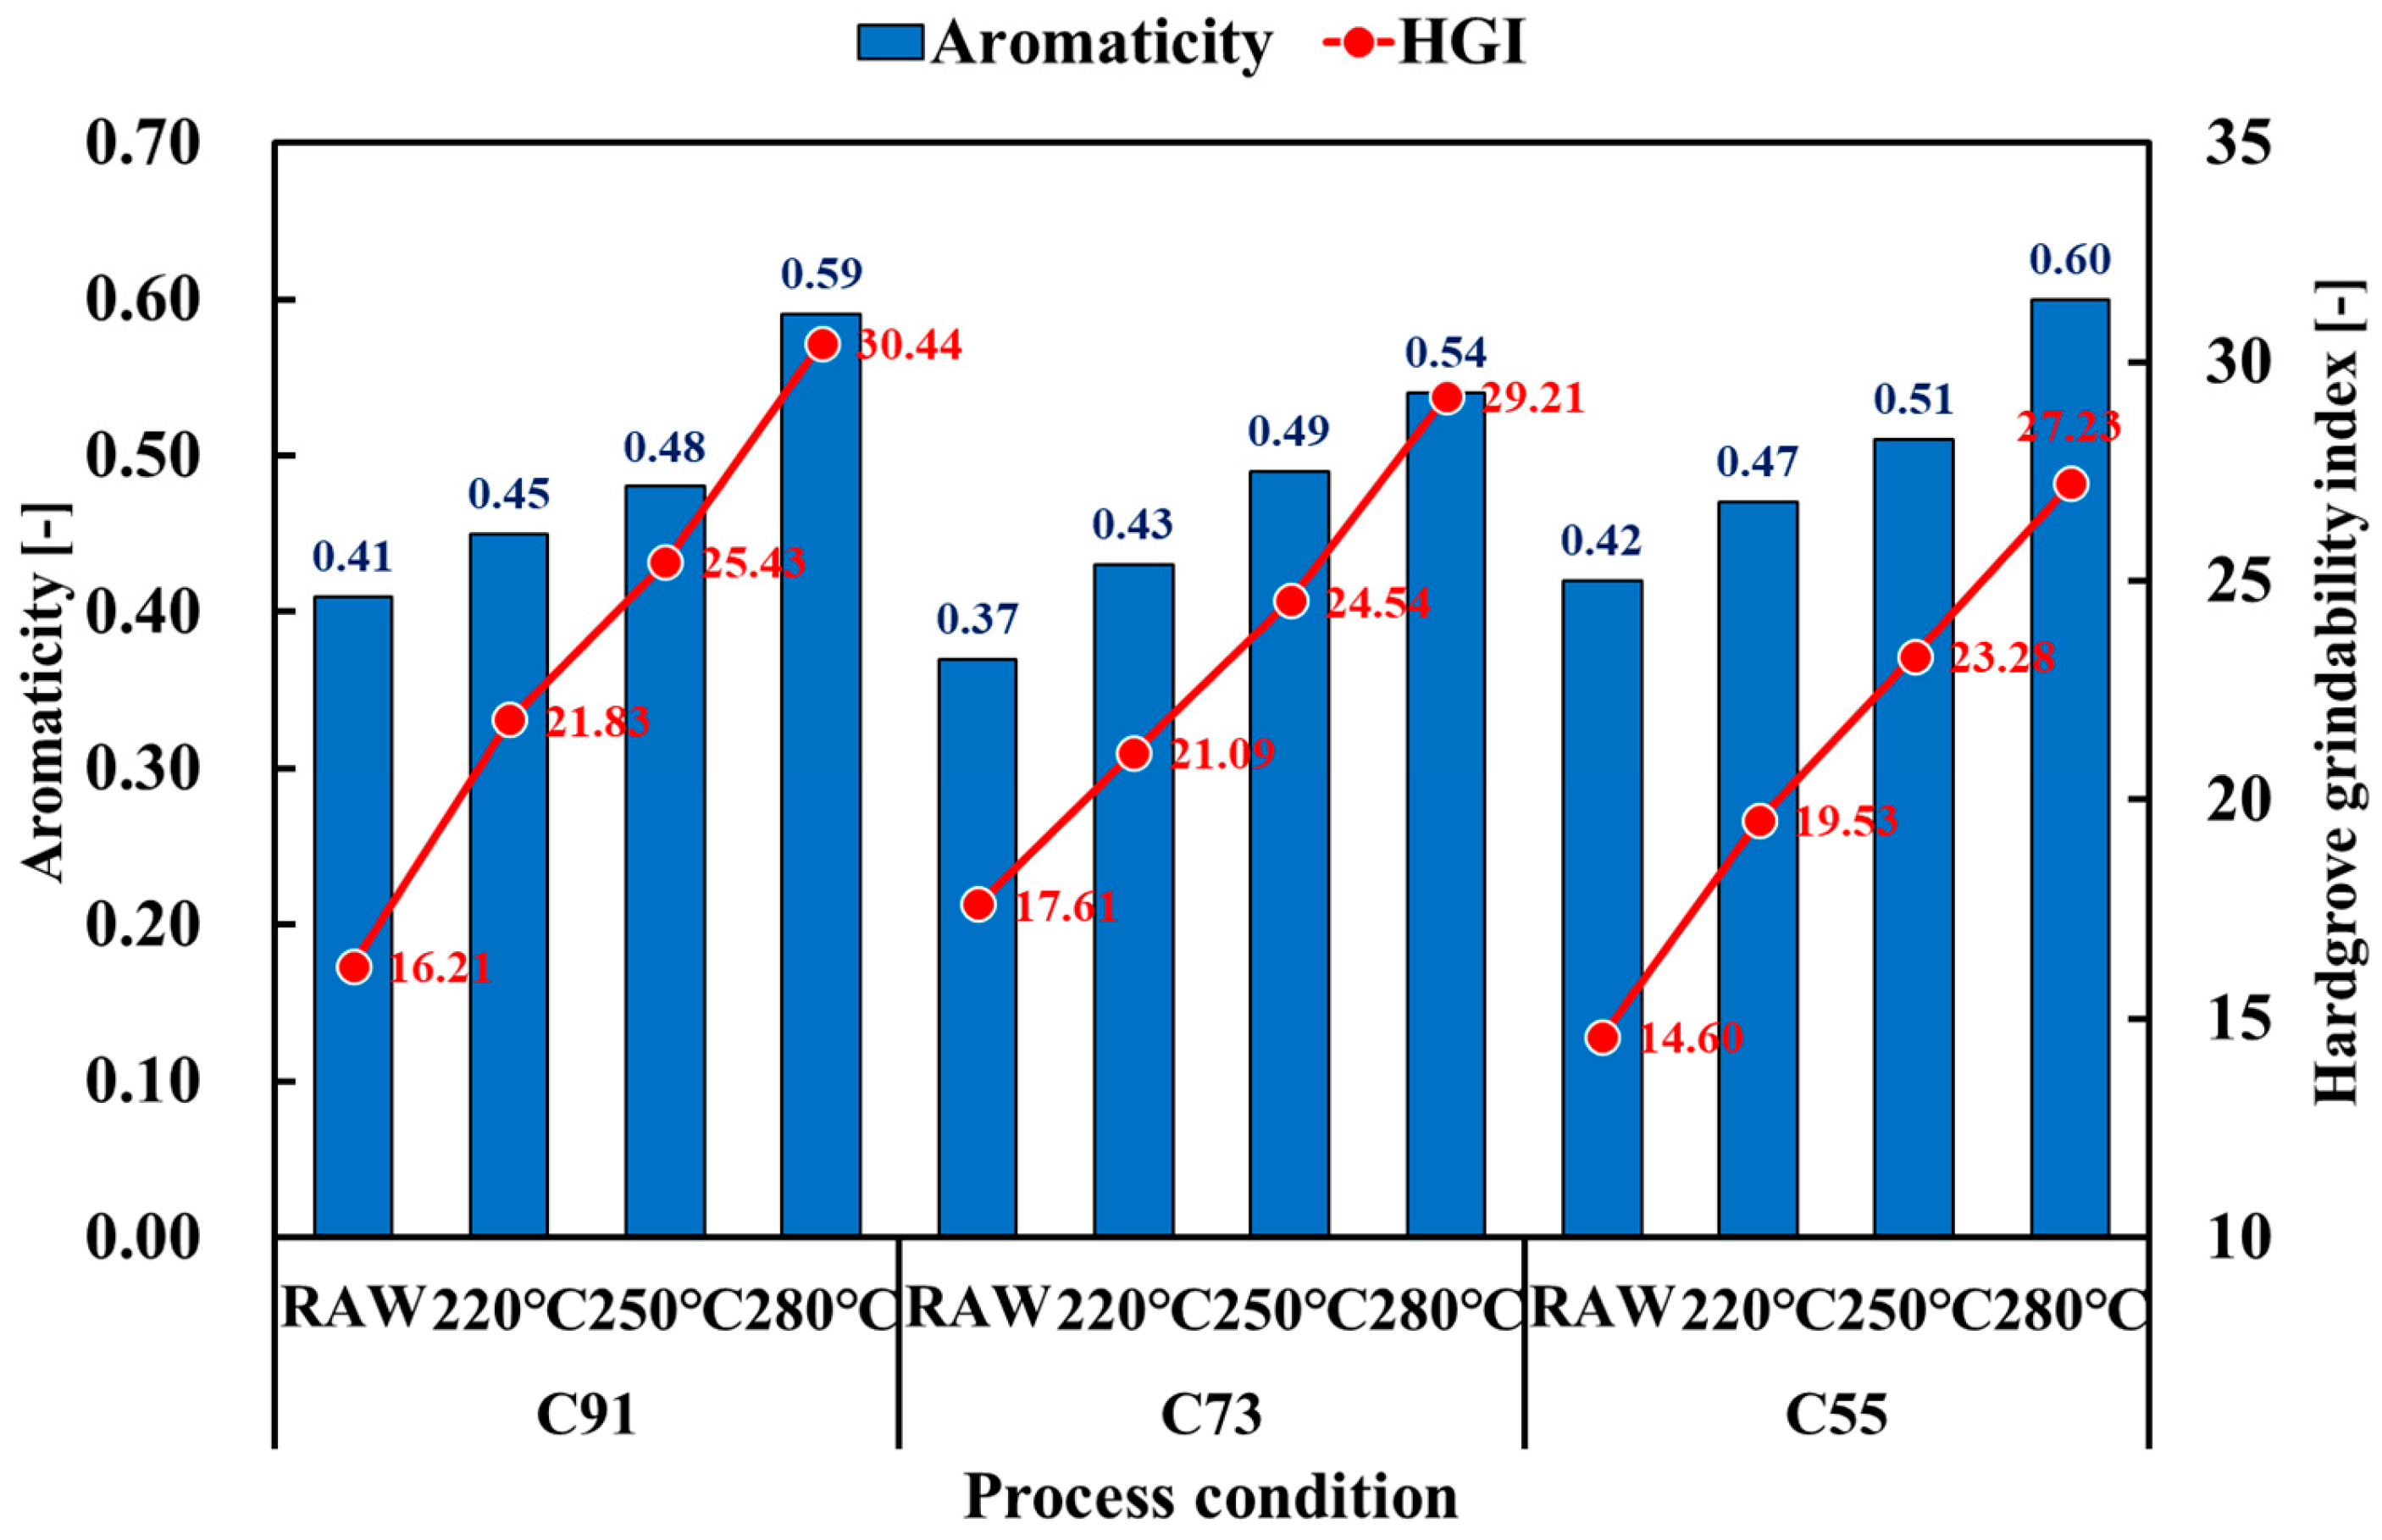
Physical features such as aromaticity and HGI were confirmed and are depicted in Figure 11. In the case of untreated samples, aromaticity ranged from 0.37 to 0.42, with C91 showing the highest and C73 the lowest. Aromaticity increased proportionally with torrefaction temperature, reaching 0.59–0.60 at 280 °C. Among the samples, C91 and C55 exhibited stronger aromaticity compared with C73, which was attributed to the lower thermal decomposition of cocopeat, resulting in frequent devolatilisation and higher FC content.
The HGI also increased with torrefaction temperature, indicating enhanced grindability at higher thermal conditions. For untreated samples, C73 showed the highest HGI (17.61), followed by C91 (16.21) and C55 (14.60). As temperature increased, C91 reached the highest HGI value of 30.44 at 280 °C, while C73 and C55 also increased but remained lower than C91. The relatively greater hydrogen content in maize residues was considered to reduce grindability, and additionally, the coarse fibre structure of maize residue suggested that actual grinding experiments would be more difficult compared with cocopeat.
The progressive increase in aromaticity reflects the structural condensation of lignin, which enhances the carbon-rich, coal-like character of the biomass. Similarly, the improvement in HGI with torrefaction severity demonstrates enhanced grindability, which is advantageous for pulverised fuel applications. Prior studies have shown that higher HGI values reduce milling energy requirements, improving the economic feasibility of biomass utilisation in thermal power plants [57,58]. The results further suggest that blending cocopeat, with its inherently higher grindability compared with maize residues, may reduce handling costs in large-scale applications.

4. Conclusions

This study comprehensively evaluated the potential of discarded cocopeat substrates and maize residues for use as renewable solid fuels through co-pelletisation and torrefaction. The findings confirmed that both the blending ratio and the torrefaction severity exerted significant influences on the physicochemical, combustion, and mechanical properties of the resulting pellets. Specifically, pellets with higher cocopeat content exhibited increased fixed carbon, greater lignin concentration, and enhanced grindability, which are desirable for fuel stability and handling. By contrast, pellets with higher maize residue content demonstrated elevated volatile matter and volatile ignitability, thereby improving ignition behaviour but at the expense of reduced combustibility stability. These results highlight the complementary characteristics of the two residues: cocopeat contributes to thermal stability and higher carbon retention, while maize residues promote rapid ignition and higher initial reactivity.
The role of torrefaction temperature was also critical. At 220 °C, only partial hemicellulose decomposition was achieved, resulting in relatively high mass yield but limited calorific enhancement. At higher temperatures of 250–280 °C, extensive thermal degradation of hemicellulose and cellulose occurred, accompanied by progressive enrichment of lignin. This transformation increased calorific value and energy density, but also led to greater mass loss and reduced combustibility index, particularly at 280 °C. Among the tested conditions, torrefaction at 250 °C was identified as the most effective compromise, balancing energy yield, ignition reliability, and combustion stability. This temperature enabled significant improvement in calorific value and grindability without excessive reduction in mass yield, making it a practical target for industrial application.
The study also demonstrated the value of employing multiple analytical perspectives—including elemental, proximate, and chemical composition analyses, alongside combustion indices (CI, VI) and physical indices (aromaticity, HGI)—to obtain an integrated understanding of fuel behaviour. Such a multi-parameter assessment is essential when dealing with heterogeneous agricultural residues, as it allows identification of both advantages and trade-offs associated with blending and thermal upgrading. The observed trends were consistent with literature reports on hemicellulose decomposition, cellulose degradation, and lignin condensation, supporting the reliability of the findings while also extending them by applying the methodology to cocopeat, an agricultural byproduct rarely considered in previous torrefaction studies.
From a practical standpoint, the results suggest that blending ratios and torrefaction conditions can be optimised to tailor pellet properties for specific energy applications, such as co-firing in thermal power plants or renewable heating in agricultural facilities. The incorporation of cocopeat into maize-based pellets not only enhances thermal stability but also contributes to waste valorisation and sustainable resource management, reducing the environmental burden associated with discarded greenhouse substrates. At the same time, the use of maize residues ensures sufficient volatile content for ignition, minimising risks of incomplete combustion. Together, these synergies demonstrate that co-pelletisation and torrefaction represent a viable pathway for transforming underutilised residues into efficient, high-quality biofuels.
In conclusion, this work contributes to both scientific understanding and practical application by clarifying the interactions between feedstock composition and torrefaction severity in determining fuel performance. By systematically evaluating mass yield, chemical composition, calorific value, combustion indices, and physical properties, the study provides robust evidence that discarded cocopeat substrates can be effectively valorised in combination with maize residues. The results offer clear guidance for optimising waste-to-energy strategies, highlighting the potential of such blended and torrefied pellets to support sustainable energy transitions and circular bioeconomy initiatives.

Author Contributions

Conceptualisation, S.P., K.C.O. and S.J.K.; methodology, S.P. and P.P.P.; software, S.P. and D.S.P.; validation, S.P., S.Y.K. and K.S.K.; formal analysis, S.P., K.C.O. and D.S.P.; investigation, S.P. and K.S.K.; resources, S.P.; data curation, S.P. and S.J.K.; writing—original draft preparation, S.P., S.H.R. and D.H.K.; writing—review and editing, S.P., S.H.R. and D.H.K.; supervision, D.H.K.; funding acquisition, D.H.K. and S.H.R. All authors have read and agreed to the published version of the manuscript.

Funding

This work was supported by the MSIT (Ministry of Science and ICT), Korea, under the Innovative Human Resource Development for Local Intellectualization support programme (IITP-2023-RS-2023-00260267) supervised by the IITP (Institute for Information & Communications Technology Planning & Evaluation) and supported by the National Institute of Forest Science (grant number: FP0700-2022-01-2025).

Data Availability Statement

All data supporting the findings of this study are contained within the article. No additional data are available.

Acknowledgments

During the preparation of this work, the authors used QuillBot to improve language clarity and readability. After using this tool, the authors reviewed and edited the content as needed and take full responsibility for the content of the published article.

Conflicts of Interest

The authors declare no conflicts of interest.

Abbreviations

The following abbreviations are used in this manuscript:
MYMass yield
EYEnergy yield
DCDecarbonisation
DHDehydrogenation
DODeoxygenation
FRFuel ratio
VMVolatile matter
FCFixed carbon
HGIHardgrove Grindability Index

References

  1. Victoria, B. The U.N. Warns ‘an Era of Global Boiling’ Has Started. What Does That Mean? The Washington Post, 29 July 2023. Available online: https://www.washingtonpost.com/climate-environment/2023/07/29/un-what-is-global-boiling/ (accessed on 4 August 2024).
  2. Akhtar, J.; Imran, M.; Ali, A.M.; Nawaz, Z.; Muhammad, A.; Butt, R.K.; Jillani, M.S.; Naeem, H.A. Torrefaction and Thermochemical Properties of Agriculture Residues. Energies 2021, 14, 4218. [Google Scholar] [CrossRef]
  3. Cardoen, D.; Joshi, P.; Diels, L.; Sarma, P.M.; Pant, D. Agriculture Biomass in India: Part 1. Estimation and Characterization. Resour. Conserv. Recycl. 2015, 102, 39–48. [Google Scholar] [CrossRef]
  4. Raj, T.; Kapoor, M.; Gaur, R.; Christopher, J.; Lamba, B.; Tuli, D.K.; Kumar, R. Physical and Chemical Characterization of Various Indian Agriculture Residues for Biofuels Production. Energy Fuels 2015, 29, 3111–3118. [Google Scholar] [CrossRef]
  5. Park, S.; Kim, S.J.; Oh, K.C.; Paudel, P.P.; Kim, S.Y.; Kim, H.E.; Shin, J.Y.; Kim, D.H. Confirmation of the Feasibility of Using Agrobyproduct Biochar in Thermal Power Plants through Oxygen Pyrolysis and Conventional Pyrolysis. J. Anal. Appl. Pyrolysis 2024, 183, 106791. [Google Scholar] [CrossRef]
  6. Hu, J.; Song, Y.; Liu, J.; Evrendilek, F.; Buyukada, M.; Yan, Y.; Li, L. Combustions of Torrefaction-Pretreated Bamboo Forest Residues: Physicochemical Properties, Evolved Gases, and Kinetic Mechanisms. Bioresour. Technol. 2020, 304, 122960. [Google Scholar] [CrossRef]
  7. Chen, D.; Chen, F.; Cen, K.; Cao, X.; Zhang, J.; Zhou, J. Upgrading Rice Husk via Oxidative Torrefaction: Characterization of Solid, Liquid, Gaseous Products and a Comparison with Non-Oxidative Torrefaction. Fuel 2020, 275, 117936. [Google Scholar] [CrossRef]
  8. Grand View Research Hydroponics Market Size, Share & Trends Analysis Report by Type, by Crop Type (Tomatoes, Lettuce, Peppers, Cucumbers, Herbs, and Others), by Crop Area, by Region, and Segment Forecasts, 2024–2030. Available online: https://www.grandviewresearch.com/industry-analysis/hydroponics-market# (accessed on 19 March 2025).
  9. Business Research Insight Coco Peat Market Size, Share, Growth, and Industry Analysis, by Type (Brown Fibre, White Fibre, Others) Market Segment by Application (Packaging, Bedding and Flooring), and Regional Insight and Forecast to 2032. Available online: https://www.businessresearchinsights.com/market-reports/coco-peat-market-118120 (accessed on 19 March 2025).
  10. Ranum, P.; Peña-Rosas, J.P.; Garcia-Casal, M.N. Global Maize Production, Utilization, and Consumption. Ann. N. Y. Acad. Sci. 2014, 1312, 105–112. [Google Scholar] [CrossRef]
  11. Tridge. Maize Production and Major Producing Countries. Available online: https://www.tridge.com/ko/intelligences/corn (accessed on 23 September 2025).
  12. Erenstein, O.; Jaleta, M.; Sonder, K.; Mottaleb, K.; Prasanna, B.M. Global Maize Production, Consumption and Trade: Trends and R&D Implications. Food Secur. 2022, 14, 1295–1319. [Google Scholar] [CrossRef]
  13. Urban Cordeiro, E.; Samaddar, A.; Munshi, S.; Ajay, A.; Rossiter, D.G.; Sohane, R.K.; Malik, R.; Craufurd, P.; Pingali, P.; McDonald, A.J. Transitions to Crop Residue Burning Have Multiple Antecedents in Eastern India. Agron. Sustain. Dev. 2024, 44, 59. [Google Scholar] [CrossRef]
  14. Korczyk-Szabó, J.; Macák, M.; Jarecki, W.; Sterczyńska, M.; Jug, D.; Pużyńska, K.; Hromadová, Ľ.; Habán, M. Influence of Crop Residue Management on Maize Production Potential. Agronomy 2024, 14, 2610. [Google Scholar] [CrossRef]
  15. Ingwersen, J.; Poyda, A.; Kremer, P.; Streck, T. Harvest Residues: A Relevant Term in the Carbon Balance of Croplands? Agric. For. Meteorol. 2024, 349, 109935. [Google Scholar] [CrossRef]
  16. Park, S.; Kim, S.J.; Oh, K.C.; Cho, L.; Kim, M.J.; Jeong, I.S.; Lee, C.G.; Kim, D.H. Investigation of Agro-Byproduct Pellet Properties and Improvement in Pellet Quality through Mixing. Energy 2020, 190, 116380. [Google Scholar] [CrossRef]
  17. Kaewtrakulchai, N.; Wongrerkdee, S.; Chalermsinsuwan, B.; Samsalee, N.; Huang, C.-W.; Manatura, K. Hydrophobicity and Performance Analysis of Beverage and Agricultural Waste Torrefaction for High-Grade Bio-Circular Solid Fuel. Carbon Resour. Convers. 2025, 8, 100243. [Google Scholar] [CrossRef]
  18. Kumar, P.; Subbarao, P.M.V.; Kala, L.; Vijay, V.K. Influence of Physical, Mechanical, and Thermal Properties of Biomass Pellets from Agriculture Residue: Pearl Millet Cob and Mix. Bioresour. Technol. Rep. 2022, 20, 101278. [Google Scholar] [CrossRef]
  19. Stulpinaite, U.; Tilvikiene, V.; Zvicevicius, E. Co-Pelletization of Hemp Residues and Agricultural Biomass: Effect on Pellet Quality and Stability. Energies 2023, 16, 5900. [Google Scholar] [CrossRef]
  20. Niedziółka, I.; Szpryngiel, M.; Kachel-Jakubowska, M.; Kraszkiewicz, A.; Zawiślak, K.; Sobczak, P.; Nadulski, R. Assessment of the Energetic and Mechanical Properties of Pellets Produced from Agricultural Biomass. Renew. Energy 2015, 76, 312–317. [Google Scholar] [CrossRef]
  21. Wan Ahmad, W.F.H.; Nagappan, Y. Moisture Retaining Test of Biochar, Coco Coir Peat, Palm Kernel Oil Cake and Charcoal Dust Mixtures for Grounding System Purposes. In Proceedings of the 2024 IEEE Sustainable Power and Energy Conference (iSPEC), Putrajaya, Malaysia, 24 November 2024; IEEE: Piscataway, NJ, USA, 2024; pp. 445–450. [Google Scholar]
  22. Borres, E.C.; Virginia Mora, L.B. Evaluation and Analysis of Coffee Husk and Coco Peat Briquettes as Biomass Fuel. Eur. Online J. Nat. Soc. Sci. 2022, 11, 604. [Google Scholar]
  23. Dinesha, P.; Kumar, S.; Rosen, M.A. Biomass Briquettes as an Alternative Fuel: A Comprehensive Review. Energy Technol. 2019, 7, 1801011. [Google Scholar] [CrossRef]
  24. Kaliyan, N.; Vance Morey, R. Factors Affecting Strength and Durability of Densified Biomass Products. Biomass Bioenergy 2009, 33, 337–359. [Google Scholar] [CrossRef]
  25. Agar, D.A.; Rudolfsson, M.; Kalén, G.; Campargue, M.; Da Silva Perez, D.; Larsson, S.H. A Systematic Study of Ring-Die Pellet Production from Forest and Agricultural Biomass. Fuel Process. Technol. 2018, 180, 47–55. [Google Scholar] [CrossRef]
  26. Duca, D.; Maceratesi, V.; Fabrizi, S.; Toscano, G. Valorising Agricultural Residues through Pelletisation. Processes 2022, 10, 232. [Google Scholar] [CrossRef]
  27. Shuma, R.; Madyira, D.M. Production of loose biomass briquettes from agricultural and forestry residues. In Proceedings of the Procedia Manufacturing, Nairobi, Kenya, 3–5 August 2017; Elsevier B.V.: Amsterdam, The Netherlands, 2017; Volume 7, pp. 98–105. [Google Scholar]
  28. Basu, P. Biomass Gasification, Pyrolysis and Torrefaction: Practical Design and Theory, 2nd ed.; Academic Press: Cambridge, MA, USA, 2018. [Google Scholar]
  29. Li, H.; Chen, J.; Zhang, W.; Zhan, H.; He, C.; Yang, Z.; Peng, H.; Leng, L. Machine-Learning-Aided Thermochemical Treatment of Biomass: A Review. Biofuel Res. J. 2023, 10, 1786–1809. [Google Scholar] [CrossRef]
  30. Prins, M.J.; Ptasinski, K.J.; Janssen, F.J.J.G. Torrefaction of Wood. Part 2. Analysis of Products. J. Anal. Appl. Pyrolysis 2006, 77, 35–40. [Google Scholar] [CrossRef]
  31. Prins, M.J.; Ptasinski, K.J.; Janssen, F.J.J.G. Torrefaction of Wood. Part 1. Weight Loss Kinetics. J. Anal. Appl. Pyrolysis 2006, 77, 28–34. [Google Scholar] [CrossRef]
  32. Bridgeman, T.G.; Jones, J.M.; Shield, I.; Williams, P.T. Torrefaction of Reed Canary Grass, Wheat Straw and Willow to Enhance Solid Fuel Qualities and Combustion Properties. Fuel 2008, 87, 844–856. [Google Scholar] [CrossRef]
  33. Basu, P.; Kulshreshtha, A.; Acharya, B. An Index for Quantifying the Degree of Torrefaction. Bioresources 2017, 12, 1749. [Google Scholar] [CrossRef]
  34. Bach, Q.V.; Skreiberg, O. Upgrading Biomass Fuels via Wet Torrefaction: A Review and Comparison with Dry Torrefaction. Renew. Sustain. Energy Rev. 2016, 54, 665–677. [Google Scholar] [CrossRef]
  35. Joshi, Y.; Di Marcello, M.; De Jong, W. Torrefaction: Mechanistic Study of Constituent Transformations in Herbaceous Biomass. J. Anal. Appl. Pyrolysis 2015, 115, 353–361. [Google Scholar] [CrossRef]
  36. Zhang, Z.; Duan, H.; Zhang, Y.; Guo, X.; Yu, X.; Zhang, X.; Rahman, M.M.; Cai, J. Investigation of Kinetic Compensation Effect in Lignocellulosic Biomass Torrefaction: Kinetic and Thermodynamic Analyses. Energy 2020, 207, 118290. [Google Scholar] [CrossRef]
  37. Kim, S.J.; Park, S.; Cho, L.; Oh, K.; Jeon, Y.G.; Lee, C.; Kim, D. Evaluation of Fuel Characteristics of Kenaf for Energy Source Utilization and Fuel Quality Improvement through Torrefaction. J. Agric. Life Sci. 2022, 56, 119–127. [Google Scholar] [CrossRef]
  38. Sui, H.; Chen, J.; Cheng, W.; Zhu, Y.; Zhang, W.; Hu, J.; Jiang, H.; Shao, J.; Chen, H. Effect of Oxidative Torrefaction on Fuel and Pelletizing Properties of Agricultural Biomass in Comparison with Non-Oxidative Torrefaction. Renew. Energy 2024, 226, 120423. [Google Scholar] [CrossRef]
  39. Kostyniuk, A.; Likozar, B. Dry Torrefaction of Biomass Waste into High-Energy Biochar and Selective Formation of Levoglucosenone and 1,4:3,6-Dianhydro-α-D-Glucopyranose. Renew. Energy 2025, 252, 123547. [Google Scholar] [CrossRef]
  40. Chen, W.H.; Lin, B.J.; Lin, Y.Y.; Chu, Y.S.; Ubando, A.T.; Show, P.L.; Ong, H.C.; Chang, J.S.; Ho, S.H.; Culaba, A.B.; et al. Progress in Biomass Torrefaction: Principles, Applications and Challenges. Prog. Energy Combust. Sci. 2021, 82, 100887. [Google Scholar] [CrossRef]
  41. Chen, D.; Cen, K.; Cao, X.; Li, Y.; Zhang, Y.; Ma, H. Restudy on Torrefaction of Corn Stalk from the Point of View of Deoxygenation and Decarbonization. J. Anal. Appl. Pyrolysis 2018, 135, 85–93. [Google Scholar] [CrossRef]
  42. ASTM D1762-84; Standard Test Method for Chemical Analysis of Wood Charcoal. American Society for Testing and Materials: West Conshohocken, PA, USA, 2021.
  43. Singh, S.; Chakraborty, J.P.; Mondal, M.K. Torrefaction of Woody Biomass (Acacia Nilotica): Investigation of Fuel and Flow Properties to Study Its Suitability as a Good Quality Solid Fuel. Renew. Energy 2020, 153, 711–724. [Google Scholar] [CrossRef]
  44. Park, S.-W.; Jang, C.-H. Carbonization of Mechanically Pre-Treated Waste: Investigation of Fuel Characteristics of The Products. J. Korea Soc. Waste Manag. 2013, 30, 383–389. [Google Scholar] [CrossRef]
  45. Park, S.-W.; Yang, J.-K.; Baek, K.-R. Fuel Ratio and Combustion Characteristics of Torrefied Biomass. J. Korea Soc. Waste Manag. 2013, 30, 376–382. [Google Scholar] [CrossRef]
  46. Park, S.Y.; Oh, K.C.; Kim, S.J.; Cho, L.H.; Jeon, Y.K.; Kim, D.H. Development of a Biomass Component Prediction Model Based on Elemental and Proximate Analyses. Energies 2023, 16, 5341. [Google Scholar] [CrossRef]
  47. Singh, K.P.; Kakati, M.C. Comprehensive Models for Predicting Aromaticity of Coals. Chem. Eng. Commun. 2003, 190, 1335–1347. [Google Scholar] [CrossRef]
  48. Wang, T.; Camps-Arbestain, M.; Hedley, M. Predicting C Aromaticity of Biochars Based on Their Elemental Composition. Org. Geochem. 2013, 62, 1–6. [Google Scholar] [CrossRef]
  49. Venkoba Rao, B.; Gopalakrishna, S.J. Hardgrove Grindability Index Prediction Using Support Vector Regression. Int. J. Miner. Process. 2009, 91, 55–59. [Google Scholar] [CrossRef]
  50. Khalsa, J.H.A.; Leistner, D.; Weller, N.; Darvell, L.I.; Dooley, B. Torrefied Biomass Pellets—Comparing Grindability in Different Laboratory Mills. Energies 2016, 9, 794. [Google Scholar] [CrossRef]
  51. Głód, K.; Lasek, J.A.; Supernok, K.; Pawłowski, P.; Fryza, R.; Zuwała, J. Torrefaction as a Way to Increase the Waste Energy Potential. Energy 2023, 285, 128606. [Google Scholar] [CrossRef]
  52. Williams, O.; Eastwick, C.; Kingman, S.; Giddings, D.; Lormor, S.; Lester, E. Investigation into the Applicability of Bond Work Index (BWI) and Hardgrove Grindability Index (HGI) Tests for Several Biomasses Compared to Colombian La Loma Coal. Fuel 2015, 158, 379–387. [Google Scholar] [CrossRef]
  53. Chelgani, S.C.; Hower, J.C.; Jorjani, E.; Mesroghli, S.; Bagherieh, A.H. Prediction of Coal Grindability Based on Petrography, Proximate and Ultimate Analysis Using Multiple Regression and Artificial Neural Network Models. Fuel Process. Technol. 2008, 89, 13–20. [Google Scholar] [CrossRef]
  54. Adeleke, A.A.; Odusote, J.K.; Ikubanni, P.P.; Lasode, O.A.; Malathi, M.; Paswan, D. The Ignitability, Fuel Ratio and Ash Fusion Temperatures of Torrefied Woody Biomass. Heliyon 2020, 6, e03582. [Google Scholar] [CrossRef]
  55. Ivanovski, M.; Petrovič, A.; Goričanec, D.; Urbancl, D.; Simonič, M. Exploring the Properties of the Torrefaction Process and Its Prospective in Treating Lignocellulosic Material. Energies 2023, 16, 6521. [Google Scholar] [CrossRef]
  56. Conag, A.T.; Villahermosa, J.E.R.; Cabatingan, L.K.; Go, A.W. Energy Densification of Sugarcane Bagasse through Torrefaction under Minimized Oxidative Atmosphere. J. Environ. Chem. Eng. 2017, 5, 5411–5419. [Google Scholar] [CrossRef]
  57. Bridgeman, T.G.; Jones, J.M.; Williams, A.; Waldron, D.J. An Investigation of the Grindability of Two Torrefied Energy Crops. Fuel 2010, 89, 3911–3918. [Google Scholar] [CrossRef]
  58. Tymoszuk, M.; Wnorowska, J.; Kalisz, S. Grindability Features of Torrefied Biomass. Energies 2025, 18, 1824. [Google Scholar] [CrossRef]
Figure 1. Global hydroponics market changes (green: measured, blue: prediction) [8].
Biomass 05 00059 g001
Figure 2. Global annual maize production from 2013 to 2023 [11].
Biomass 05 00059 g002
Figure 3. Block diagram of the experimental procedure.
Biomass 05 00059 g003
Figure 4. Mass yield changes according to mixing ratio and process temperature.
Biomass 05 00059 g004
Figure 5. Elemental composition according to mixing ratio and process temperature.
Biomass 05 00059 g005
Figure 6. Decarbonisation, dehydrogenation, and deoxygenation according to mixing ratio and process temperature.
Biomass 05 00059 g006
Figure 7. Summary of proximate composition and fuel ratio according to mixing ratio and process temperature.
Biomass 05 00059 g007
Figure 8. Chemical composition results according to mixing ratio and process temperature.
Biomass 05 00059 g008
Figure 9. Changes in calorific value and energy yield according to mixing ratio and process temperature.
Biomass 05 00059 g009
Figure 10. Changes in combustibility index and volatile ignitability according to mixing ratio and process temperature.
Biomass 05 00059 g010
Figure 11. Changes in aromaticity and Hargrove grindability index according to mixing ratio and process temperature.
Biomass 05 00059 g011
Table 1. Fuel characteristics of each untreated sample.
Mixing Ratio (wt%)Elemental Analysis (wt%, daf)Proximate Analysis (wt%, d)Chemical Composition Ratio (wt%, d) *Calorific Value
[MJ/kg]
CocopeatMaizeCHNSOVMFCAshCellHemiLig
Cocopeat100041.635.181.140.0052.0572.8819.217.9043.7026.7331.6318.35
C91901044.355.140.980.0049.5473.2018.997.8133.8927.5434.5317.73
C73703044.745.130.830.0049.3077.5717.175.2533.4427.3334.7517.86
C55505044.025.310.660.0050.0174.2318.976.8030.9428.1532.7918.07
Maize010044.065.401.210.0049.3376.1420.063.8025.3926.0131.9518.44
* Chemical composition ratio was calculated, where daf stands for dry-ash-free basis and d refers for dry basis.
Disclaimer/Publisher’s Note: The statements, opinions and data contained in all publications are solely those of the individual author(s) and contributor(s) and not of MDPI and/or the editor(s). MDPI and/or the editor(s) disclaim responsibility for any injury to people or property resulting from any ideas, methods, instructions or products referred to in the content.