Article

Food Waste Assessment and Household Biowaste Management in Latvia: Towards a Circular Economy

1
Department of Management Studies, BA School of Business and Finance of the University of Latvia, LV-1013 Riga, Latvia
2
Institute of Physical Energetics, LV-1006 Riga, Latvia
3
Public Utilities Commission, LV-1013 Riga, Latvia
4
Waste Management Association of Latvia, LV-1009 Riga, Latvia
*
Author to whom correspondence should be addressed.
Biomass 2025, 5(4), 58; https://doi.org/10.3390/biomass5040058
Submission received: 25 August 2025 / Revised: 18 September 2025 / Accepted: 24 September 2025 / Published: 25 September 2025

Abstract

The transition to a circular economy requires effective food waste (FW) collection and recycling systems. This study aims to evaluate general public attitudes, behaviours, and systemic challenges related to FW sorting in Latvia, in light of the recent mandate for separate biowaste collection. The study covers two important sections—assessment of the amount of FW generated in primary production sectors, and a pilot case study of biodegradable waste sorting in selected households in Latvia. A mixed-methods approach was used, combining a nationwide survey of 458 entities involved in primary food production and 115 households, followed by 99 households with backyards voluntarily participating in a pilot case study to evaluate their BW management practices. The research findings reveal that there is a need to establish a precise/specific framework for the evaluation of FW for each sector; the development of appropriate coefficients would facilitate the process of estimating waste generated by primary production in the future. Research findings revealed that inhabitants are interested in home composting; however, the implementation of home composting requires active support from project implementers, including increasing environmental awareness and providing financial incentives. These results offer practical insights for municipalities and national stakeholders aiming to increase biowaste collection rates and support country-level broader sustainability goals. The research results have practical application with the possibility to replicate the best practices and recommendations to other countries or regions within the EU and beyond.

1. Introduction

FW has been identified by scientists, policy makers, and industry as one of the most acute sustainability challenges of the 21st century [1], as it impacts substantial environmental, economic, and social dimensions. When assessed on the global scale, food systems are responsible for approximately 26% of greenhouse gas emissions [2], and out of this, FW has a very significant contribution through both upstream production losses and downstream disposal practices [3]. In addition to already identified climate impacts, FW highlights issues such as an inefficient use of land, water, energy, and labour resources, thereby undermining efforts to achieve sustainable food systems [4]. Simultaneously, when turning to United Nations (UN) Sustainable Development Goals (SDGs), reducing FW directly contributes to several SDGs, in particular, to SDG 12.3, which aims to halve global FW per capita at retail and consumer levels by 2030 [5].
Scientific discussions within the FW topic, including a variety of existing approaches to measurement and overall assessment, highlight the complexity of defining, measuring, and comparing food loss across regions and economic sectors. Although some institutions such as FAO have developed standardised methodologies, the researchers have identified a range of methodological inconsistencies, ranging from differences in waste classification to variations in system boundaries, leading to a conclusion that in many aspects, also for this waste stream, there is no one-size-fits-all approach and specific nuances need to be considered on a country-to country basis [6]. All of these still remain as substantial challenges for researchers and policymakers [7]. This lack of harmonisation and unified approaches limits the comparability of statistics at national and sometimes even at the regional level, which results in critical limitations for evaluating progress towards EU and global UN targets. In this respect, the establishment of the EU has developed a pathway for standardised methodologies and reliable reporting mechanisms, as it sees this approach to be an essential precondition for evidence-based policy and effective waste prevention strategies [8]. At the time of the study, Latvia did not yet have its own coefficients for estimating the amount of primary food waste. In applying the coefficient method, the calculations were based on yield indicators obtained from central statistical databases for specific sectors (grain production, milk production, meat production, fruit and berry production, and vegetable production) in given years. A literature review of international scientific studies on methods for assessing primary production waste provided the coefficients used for these calculations. The study report includes results derived from these calculations, expressed as percentages of food waste and surplus. To obtain these proportions, the authors of the referenced literature employed both direct weighing and survey methods. The study report includes results expressed as percentages of food losses and surpluses.
Across global food systems, food loss and waste (FLW) is a widespread issue, posing a challenge to food security, food safety, the economy, and environmental sustainability. No accurate estimates of the extent of FLW are available, but studies indicate that FLW is roughly 30 per cent of all food globally [9]. This amounts to 1.3 billion tonnes per year. FLW represents wastage of resources, including the land, water, labour, and energy used to produce food. It strongly contributes to climate change because greenhouse gases are emitted during food production and distribution activities, and methane is released during the decay of wasted food. FLW also affects food supply chains by lowering income for food producers, increasing costs for food consumers, and reducing access to food. Minimising FLW could lead to substantial food security and environmental gains [10].
The European Commission (EC) has elaborated a common methodology (Laid down in Commission delegated decision (EU) 2019/1597 of 3 May 2019 supplementing Directive 2008/98/EC) to measure food loss, based on a common methodology by measuring the FW at the different stages of the food supply chain, i.e., primary production, processing and manufacturing, retail, and other distribution of food, restaurant and food services, and households [11]; in turn, the reporting format is defined in the Commission Implementing Decision 2019/2000 [12]. The aim of the reporting is to monitor and assess the implementation of the FW prevention programmes in the European Union (EU) Member States (MS). As the assessment of FW is a new approach in many of the EU MS, the EU Platform on Food Losses and FW provides several suggestions and case studies on how to measure FW more correctly [13]. Many researchers in various studies have recognised the importance of reducing food losses in all food value chains, as globally, approximately a third of all food produced for human consumption is lost or wasted. In addition, FAO’s Food Loss Index (FLI) estimates that globally, around 14% of all food produced is lost from the post-harvest stage up to, but excluding, the retail stage [14,15,16,17]. When turning to the EU, around 88 million tonnes of food are wasted annually in the EU, with associated costs estimated at 143 billion euros [9].
Tourism influences municipal solid waste management, particularly FW in metropolitan and recreational areas, and five best practices for FW minimisation and prevention have been identified in Portugal, the UK, and international hotel chains (Carlson, Radisson, Marriott, and Fairmont). These best practices include:
  • Actions to prevent food waste at buffets and restaurants.
  • Collection points for used cooking oils.
  • Selective collection of bio-waste from restaurants and hotels.
  • Food tracking device.
  • Food donation from restaurants and hotels to charities [18].
An assessment of food losses in Switzerland at the various stages of the food value chain (agricultural production, postharvest handling and trade, processing, food service industry, retail, and households) used combined methods: a mass and energy flow analysis, based on data from 31 companies, public institutions, associations, and from the literature [19]. To continue this research direction, another scientific team measured food losses in the non-commercial food service industry in Switzerland, which can be split into four sectors: health, education, care, and business [20]. The food losses were classified into four categories: storage losses, preparation losses, serving losses, and plate waste, and seven food classes were identified and weighed for a period of five days. The results in two food service companies showed that 10.73% and 7.69% of total food delivered was lost over the value-added chain. A questionnaire survey was used to investigate consumer behaviour related to food supply and waste in Greece [21]. It was concluded that the prevention of FW is facilitated by the respondent’s involvement in food preparation, irritation towards the occurrence of FW and the level of education. After comparing the available data on FW generation in the EU-27 countries with the results of the model calculations, it is concluded that the results differ significantly, and further research is needed to improve the data collection [22]. Researchers studying consumer behaviour and the implementation of energy efficiency projects in Latvia conclude that society, as a whole, is not ready to invest in maintaining energy efficiency and change its customs [23]. The goal of this research is to determine the amount of generated FW at the different stages of the food supply chain and to assess one case study of FW sorting at household level.
Given the aforementioned challenges in measuring food waste and managing biowaste, this study pursues three objectives:
  • To determine the volume of food waste in Latvia at all stages of the food supply chain using statistical data, surveys, and coefficient calculations.
  • To conduct a pilot study on household biowaste sorting and home composting practices, analysing residents’ motivations, habits, and practical challenges.
  • To develop practical and policy recommendations for reducing food and biowaste that would facilitate Latvia’s transition to a circular economy and compliance with the European Union and UN Sustainable Development Goals.

1.1. Broadening the Scope to BIOWASTE

BW, according to the definition in the Waste Framework Directive (WFD) 2008/98/EC, includes food and kitchen waste (FW) such as from food supply chains: processing and manufacturing, retail and other distribution of food, restaurants and food services, households [11], and garden and park waste [24,25].
The European Compost Network survey data related to the year 2019/2020 (Table 1) refer to separately collected BW and exclude mixed waste treatment, sewage sludges, and agricultural waste unless specifically stated. BW treatment by countries and by technologies varies, with composting ranging from 29 to 151 kg capita−1 annum−1, and anaerobic digestion (AD) from 2 to 232 kg capita−1 annum−1 [26]. In Latvia, the treatment of BW was distributed as: composting—14 kg capita−1 annum−1, AD—25 kg capita−1 annum−1, and use as a fuel (other than direct incineration) or blending for use as a fuel—3 kg capita−1 annum−1.
Apart from industrial composting and anaerobic digestion, home composting has been used for BW treatment. The importance of home composting is also emphasised by WFD 2008/98/EC, which determines home composting as an alternative to the separate collection of BW. By managing BW composting in the household, the BW closes the circular economy cycle in one’s own garden or land [31]. It allows for reducing the MW amount, waste management costs, and avoiding waste disposal at landfills. Furthermore, at the end of the composting process, valuable compost has been obtained for improving the soil. Accordingly, home composting is a waste prevention measure related to the management of the household’s FW, garden trimmings, and other smaller organic household waste streams, and home composting is environmentally preferable for Greece [32]. It may be concluded that effective source separation of biowaste is a prerequisite for good quality production and marketing of compost. Properly conducted home composting can achieve good compost quality results [33]. There were no significant differences between home compost and industrial compost in chemical parameters like organic matter and nutrient content. Home composts have a higher level of moisture, but the amount of heavy metals was higher in industrial compost than in home compost [34,35]. As BW is generated for a whole year, it is necessary to ensure continuous home composting throughout the year. Experimental results showed that BW small-scale composting (average production rate 7 kg d−1) was also viable under cold weather conditions, as the thermophilic sanitation temperature (>55 °C) was maintained for three consecutive days in the composting mass. However, the composting process was not homogeneous throughout the compost bin [36].

1.2. Assessment of FW Across Different Sectors in EU and in Latvia

The primary food production sectors are very different in terms of the resources used, technologies, production organisation, products obtained, and FW and leftovers generated. Agricultural practices and conditions vary considerably between different regions of the world. The main sectors that generate FW are cereals, vegetables, the dairy industry, meat, eggs, and fish. This case study does not evaluate the cause of the generated FW.
The amount of FW in the cereals sector can vary greatly from year to year, and from country to country. The main causes are harvesting technologies, weather conditions, pest and disease damage, product quality problems, and losses after harvest, e.g., sorting and storing the products. A range of researchers concluded that wheat food loss is such: Finland—5%, Norway—6.6%, and Sweden—23%, whereas rye FW—Finland—4.9%, but rape FW—France—3 to 4.5% of total yield [37,38]. The amount of FW in the Swedish grain crops sector is significantly higher than in other countries and studies, as this also includes wildlife damage. The share of FW in the vegetable sector varies, e.g., carrots—11 to 28%, white cabbage—5 to 10%, food potatoes—1 to 4%, and strawberries—2 to 14%. To compare the share of FW, different definitions of FW should be considered. For example, damaged and spoiled food should not be counted as FW, because the damage, especially weather damage, is impossible to avoid [39].
The dairy industry generates relatively small waste amounts and leftovers, an average of 1.14% [40] to 1.4% [41] of the total milk produced. The main reasons for FW in the dairy sector were determined as rejection due to antibiotic residues, loss in technological processes of milk transfusion, and a further rejection by the processor. The meat and egg sectors that generated FW are poultry—3.5%, pigs—2.7%, and sheep—4.1% [42]. The fish sector is small, and the reasons for fish waste flow are mainly diseases and predators [37].
The processing and manufacturing sectors are different in terms of the used resources and technologies. The results of a study on the amount of FW generated in the sector in EU-28 in 2012 show that 33 ± 25 kg of FW is generated per person per year [43] and it is estimated that the sector generates 19% of the total amount of FW. Latvia is dominated by the production of meat, fish and other animal food products, fruits, vegetables, cereals, edible oils, canned food, dairy products, and alcoholic and non-alcoholic beverages. Merchants submitted statistical reports on waste generated.
The combined wholesale, retail, and markets sector generated 9 ± 2 kg FW per capita in 2012 in the EU, and the sector generates 5% of the total amount of FW. The retail and other distribution of the food sector includes the 7885 food wholesale and retail businesses in Latvia [43].
The food service sector generated 12% of the total amount of FW, and it is estimated that the sector generated 21 ± 3 kg per person per year of FW in EU-28 during 2012 [43]. The restaurant and food services sector includes the 5892 accommodation and catering establishments in Latvia.
Most commonly in research studies on the amount of FW at the household level, statistics are determined by theoretical means, using a combination of national waste and socio-economic statistics, and findings from selected research studies, e.g., morphological content of mixed solid waste. Viewed data from case studies showed similar results of household FW—the EU-funded project FUSIONS finds an EU-28 average of 92 ± 9 kg per capita (10), but Bio-based Industries Consortium research shows an EU-27+ average of 116.7 kg per capita, including Latvia at 107 kg per capita [44].
The practical measurements at the source of FW generation allow for the estimation of the waste amount more precisely, and it shows how much the FW contributes to the municipal waste stream, sewage (mostly liquid), home composting, etc., [43]. Much more accurate and detailed data can be obtained by surveying the population and measuring FW daily. To obtain the most accurate data, the generated FW is divided into groups, such as dairy products, cereals, vegetables, fruits, sweets, and the cause of FW generation, e.g., completely unused food products, partially used food products, leftovers from a meal, leftovers after storage, and products damaged during cooking. It allows for determining the composition of avoidable FW by product groups, reasons for the generation of avoidable FW, parts of inedible food, disposal routes, etc., [45,46,47]. However, the application of these research methods requires the active participation of the organisers to support the respondents and provide informative assistance throughout the research, as well as different motivation options for private households involved in the research.
Overall, based on the statistical data reported for Latvia, there is a trend of relatively low rates of municipal BW recycling. Despite the fact that the municipalities do support home composting, separate collection coverage remains an area for improvement. Peer-reviewed scientific studies with a focus on the EU show that:
  • financial incentives (waste-fee reductions for either FW or BW),
  • easy access to composters,
  • municipal leadership and education, and
  • community/shared composting
Provide quite a strong correlation with high household participation and diversion of BW from the unsorted waste stream. Pilot evaluations (e.g., municipal incentive programmes in Poland, Austria case studies) quantify economic and environmental benefits [48,49].
Successes in leading EU countries such as Austria, Germany, and Slovenia demonstrate that combining mandatory separate collection of biowaste with widespread distribution of composters, reduced waste fees, and the promotion of public composting centres leads to consistently higher rates of biowaste recycling and greater citizen participation [50,51]. These examples demonstrate that Latvia can accelerate progress by adapting such integrated strategies to the local context.

1.3. Municipal Waste Management System in Latvia

Latvia is a country in the Baltic region of Northern Europe. The country has 1.88 million inhabitants and a territory of 64.6 thousand km2. The government system is decentralised; there are 43 local governments (7 cities and 36 counties). During the first waste management planning period, all the territory of Latvia was divided into ten waste management regions (WMR) according to the state waste management plan (SWMP) 2006–2012, but in order to improve and manage the centralised waste management system in Latvia, during the current, third waste management period 2021−2028, the ten WMR reduced to five WMR (Figure 1).
The Cabinet of Ministers of the Republic of Latvia adopted The National Waste Management Plan 2021−2028 (NWMP2028) [52] on 22 January 2021, developed in accordance with the WFD 2008/98 [25]. NWMP2028 aims to reduce the generation of waste and its landfilling (10% landfilling target in 2035) by introducing measures to support material and goods circularity and ultimately reduce the environmental and carbon footprint of the economy, thus facilitating climate neutrality. At the national level, one of the most ambitious steps towards the fulfilment of the EU waste management goals is to reduce BW disposal at landfills. Currently, the majority of BW are sorted out from the MW stream, which are received at the landfill for disposal in the mechanical pre-treatment process. The mechanically segregated BW fraction contains many other waste admixtures (e.g., glass, plastic, metal, hazardous waste), and after the stabilisation process, it can be used only as waste cover material at landfills. From 2024, all BW in the EU must be treated at source or collected separately. Therefore, the BW separate collection system and treatment facilities had to be completed by the end of 2023 (Pieriga region started it already in 2022), and it will ensure that BW are either separated and recycled at source or collected separately and not mixed with other types of waste. Many municipalities are currently still improving their waste management systems, looking for the best solution in BW management. Because of the low population density of 31 capita km−2 [53], this is a challenge for Latvia. Therefore, home composting and other small local BW composting technologies in the regions is one of the options to reduce the amount of BW in the MW stream.

2. Materials and Methods

The amount of generated food waste of each food supply chain in 2019 and 2020 was set using data from the national statistic sources, e.g., the national statistics review ‘3-Waste’ (NSR) maintained by the Environment, Geology and Meteorology Centre (LEGMC), Central Statistical Bureau (CSB), Food and Veterinary Service (FVS), Register of Enterprises (RE) of the Republic of Latvia by a combination of coefficients and production statistics, questionnaires, interviews, waste composition analysis, and other parameters (Table 2). Regional aspects were considered when choosing the sample group survey participants.
To estimate the amount of food waste and residues in primary production, agricultural sectors are considered separately by type of output in waste classes according to the EU waste classification: 02 01 02 animal-tissue waste (production of meat, eggs, and milk) and 02 01 03 plant-tissue waste (production of cereals, potatoes, vegetables, fruits, and berries) [37]. Information on the amount of generated food waste by primary production companies is available on the LEGMC NSR database [29]. Using the Lursoft RE database [52], the industry of the company has been specified according to the NACE code (Table 2). This allows for selection from the group of primary production companies that are involved in food processing or whose activities do not generate food waste; for instance, meat processing companies and fur farms. Information on primary production enterprises has also been obtained from the CSB [53] to find the link between production volumes (t), production areas (ha), production herd sizes, and reported food waste amount in the NSR LEGMC to determine coefficients for the estimation of generated food waste in this stage. In addition, information has been obtained by interviews with primary production companies, NGOs of the industry, annual reports of the Agricultural Data Centre, the Ministry of Agriculture, etc. This case study in the primary production food chain has collected statistical information on an average of 40 companies and interviewed 14 companies, selected by annual incomes (large/small) and by sub-sector (crop/livestock) production. For the determination of food waste and residues in primary production, considering the limited availability of accumulated information in Latvia, the limits of the most appropriate system for determining the amount of primary waste generated are applied to each primary production sub-sector. In the future study, the boundaries of this evaluation system will be aligned with other stages of the food supply chains and generated food waste so as not to create significant overlaps or shortages. Given the potentially small proportion of fish sector food waste in the total and the lack of detailed information, it was decided not to consider the evaluation of aquaculture in more detail in this study.
The total number of enterprises in processing and manufacturing sector in Latvia is 158. The analysis includes 100 active enterprises that have received category A and B permits, with 9808 employees in 2019 and 9963 employees in 2020. The number of employees in each of the companies in the year under review was determined using the LURSOFT database. Compared to the number of employees reported by the Central Statistical Bureau (19,576 employees in 2019 and 20,157 employees in 2020) with the respective NACE 2 codes C10 (food producing enterprises) and C11 (beverage producing enterprises), the number of employees of the surveyed enterprises in the respective years is ~50% of all employees in the respective sector.
The evaluation of the data for retail and other distribution of food in 2019 and 2020 was carried out using a survey of both food waste generators and waste management companies with questionnaires (alternative approach) and, if necessary, to update the data in the form of telephone interviews. The total number of enterprises in the sector in Latvia is 7885. The analysis includes 197 active enterprises. The retail and other distribution of food sector include mixed municipal waste (waste code: 20 03 01), waste from markets (20 03 02), edible oil and fat (20 01 25), organic wastes other than those mentioned in 16 03 05 (16 03 06), biodegradable kitchen and canteen waste (20 01 08); household, restaurant and catering establishments food waste from retail premises and other food waste (20 01 09). At the end of 2019, a total of 127,821 employees worked in subdivision G46 “Wholesale trade, except for motor vehicles and motorcycles” and G47 “Retail trade, except for motor vehicles and motorcycles”, but at the end of 2020, there were 122,851 employees.
Data evaluation for restaurants and food services was performed in the same way as in the retail and other food distribution sectors. The total number of enterprises in the sector in Latvia is 5892. The analysis includes 147 active enterprises. The restaurant and food services sector includes mixed municipal waste (waste code: 20 03 01), edible oil and fat (20 01 25), biodegradable kitchen and canteen waste (20 01 08); household, restaurant and catering establishments’ food waste from retail premises and other food waste (20 01 09). At the end of 2019, there were 35,222 employees in NACE2 Division I (Accommodation and food services) and 24,226 employees at the end of 2020.
The amount of generated household food waste is not listed separately in the national statistics so far, therefore food waste in this supply chain is characterised by the LEGMC NSR database [29] and aggregated based on the waste classes according to the EU waste classification: 20 03 01, mixed municipal waste, 20 01 25 edible oils and fats, and 20 01 08 biodegradable kitchen waste. To support the statistics data evaluation and to estimate the generated food waste at the household level, CSB data sets were used: the number of capita, number of households, number of persons living in the household, income per household member, the structure of household consumption, and place of residence (apartment/house) [54].
This research for practical data acquisition was conducted by survey, identified as the best practice methodology for the measurement of household-level food waste [46]. This was slightly adjusted for the consumption of Latvian households, and questions were added about the non-edible amount of food waste and further ways of management. Based on the structure of this survey to verify quantitative results of the survey, a diary was developed for an individual household or group of individuals to keep a record of food waste information on a two-week basis. 115 households (number of persons in households—327, average family size—2.8 persons) participated in the survey, but the practical measurements in the diary were filled out by 21 households. The practical results were compared with the public statistics data, considering other food supply chains (processing and manufacturing; retail and other distribution of food; restaurants and food services) and the generated food waste in these waste flows.
When turning to the pilot case study provided within the research paper’s discussion section, during data collection using sociological research methods (household surveys and diary-based measurements), several factors were observed that could affect the reliability of the results, including differences in households’ understanding of what constitutes food waste and the need for prior respondent training. Additional challenges included the limitations of short-term data collection, seasonality effects, limited participant motivation to perform daily measurements, and the lack of educational materials and informational support on proper measurement procedures.
To obtain robust and representative data, it is necessary to include households with diverse socio-demographic and structural characteristics (e.g., household size, housing type, income level per household member) and to implement repeated measurements, preferably within the same households, to enhance comparability and reliability over time.
Food waste measurement data categorised by housing type or household size provide a basis for methodological extrapolation to broader scales. When integrated with socioeconomic statistical data, such measurements enable more robust estimations at the municipal or national level, thereby enhancing the validity and applicability of the results.

3. Results

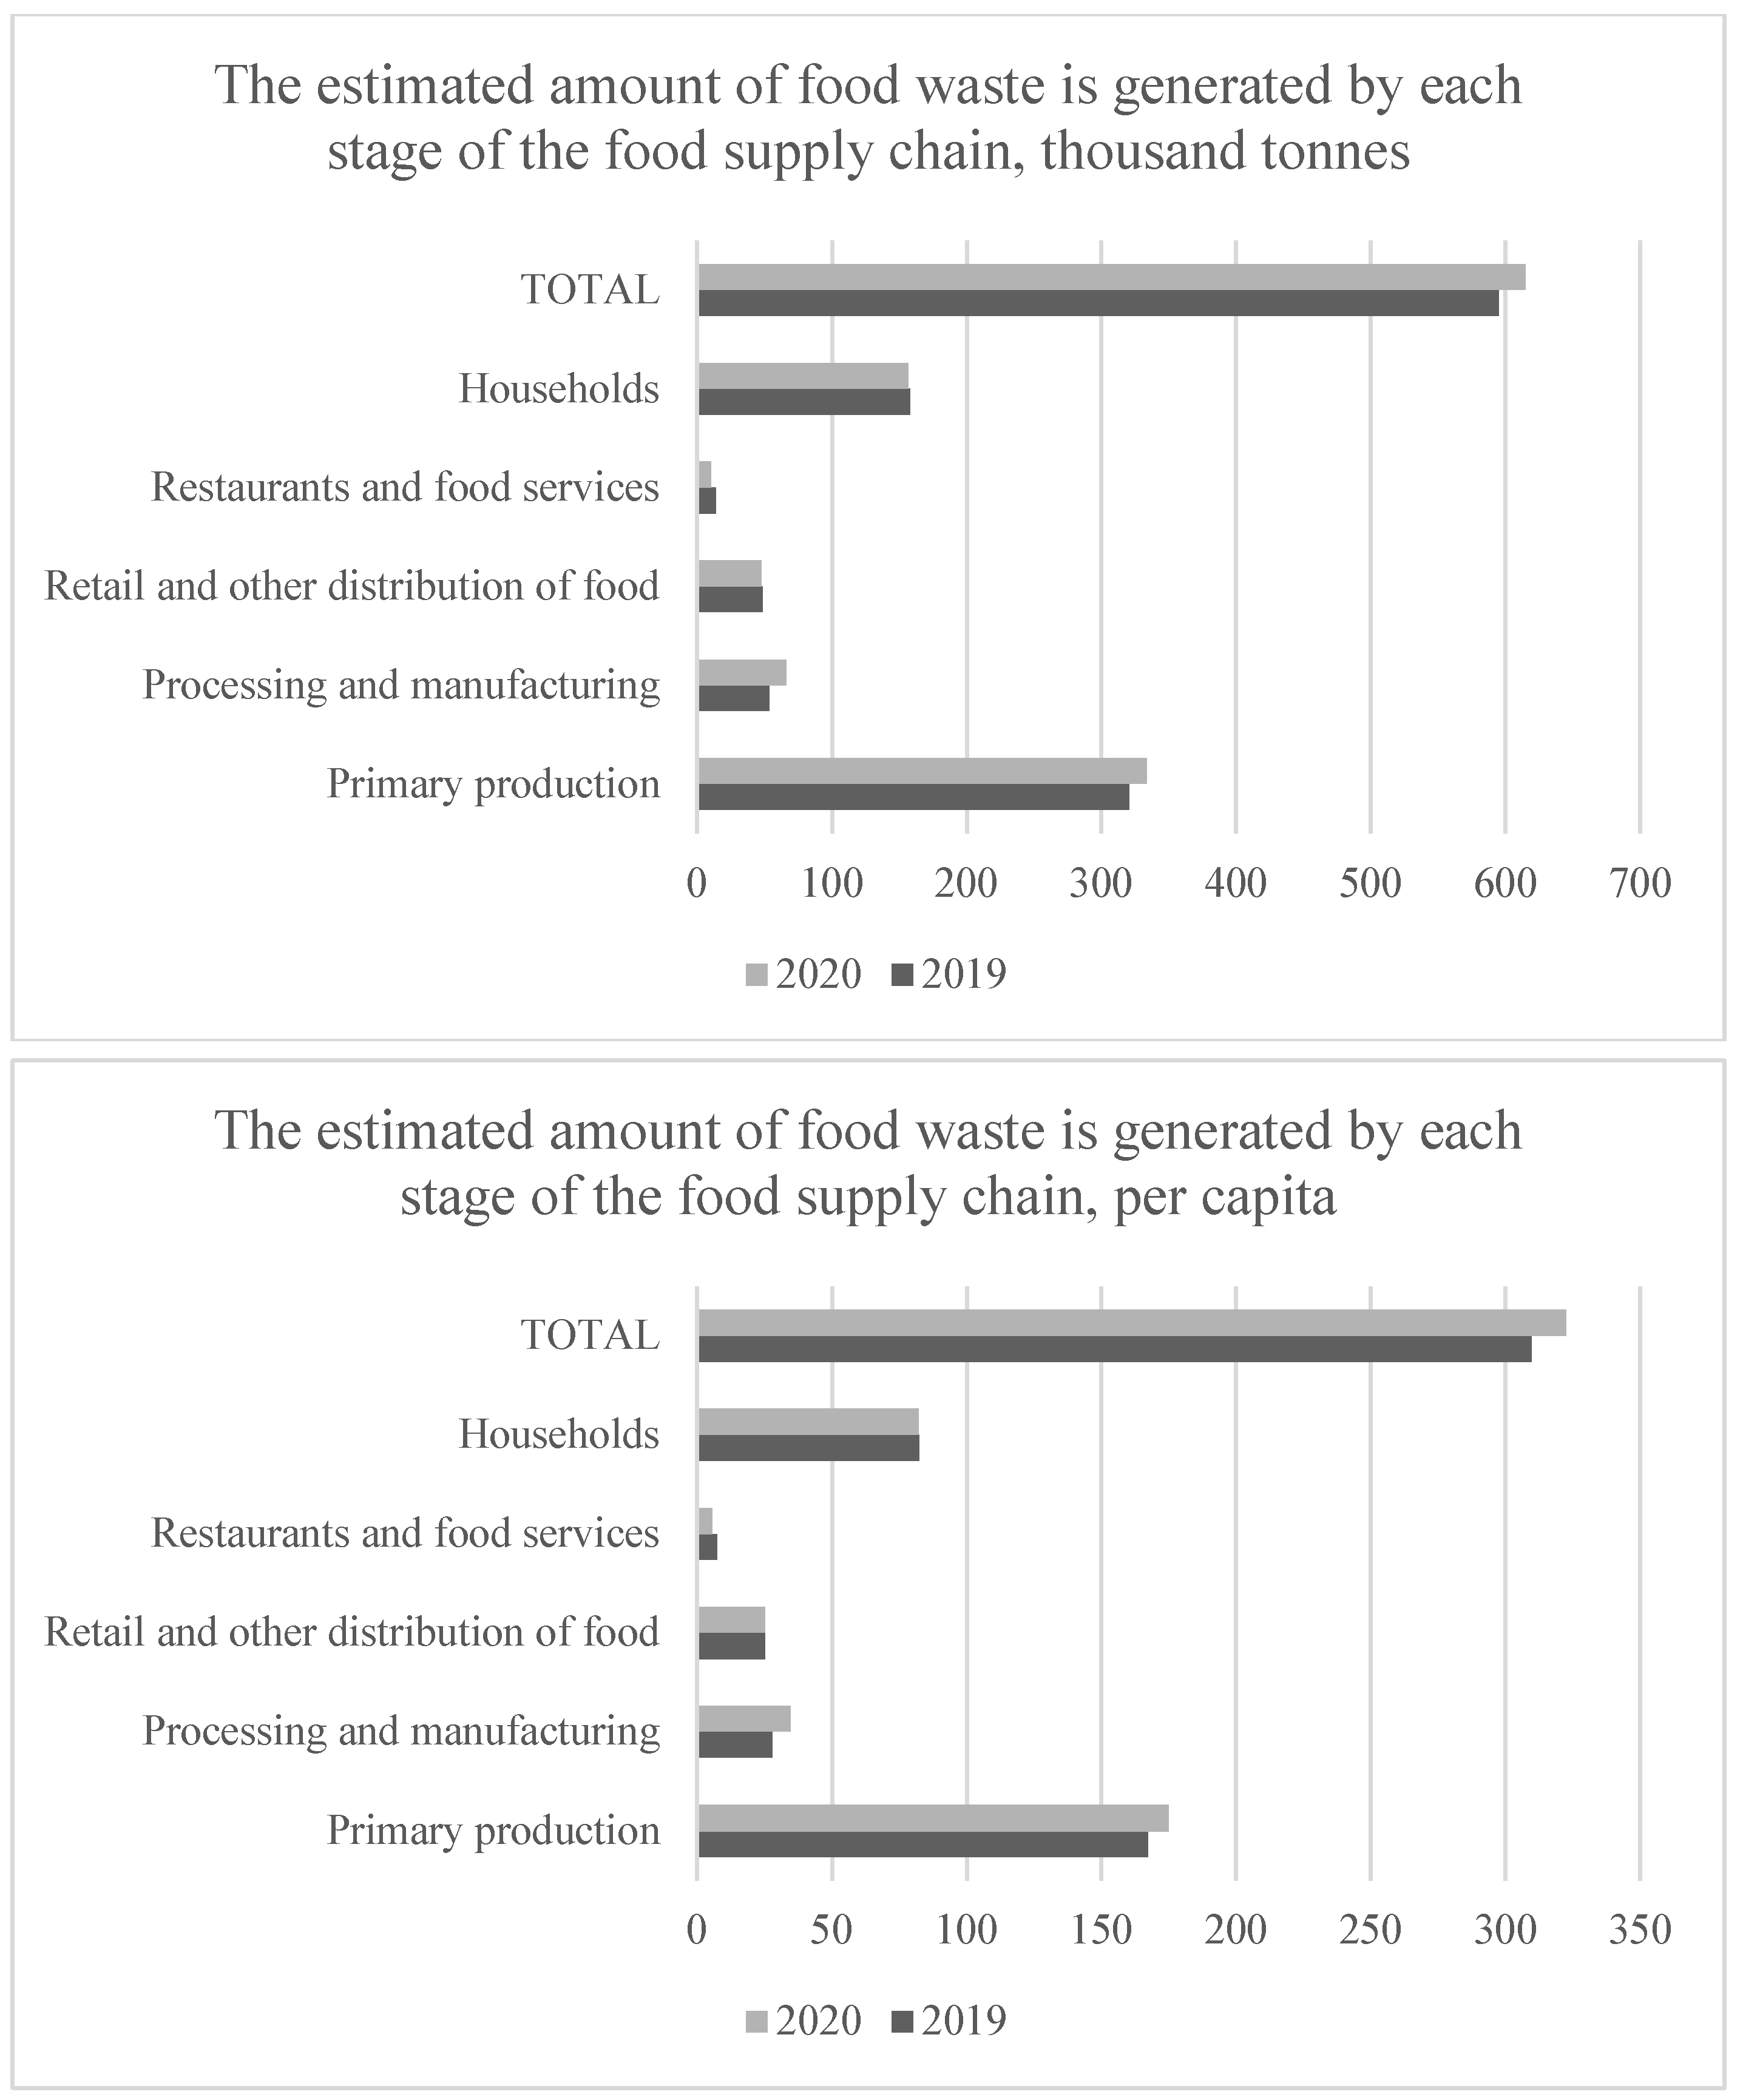
The measurements show that in total at all stages of the food supply chain, 595 thousand tonnes or 310 kg per capita of food waste was generated in 2019, and 615 thousand tonnes or 322 kg per capita was generated in 2020. The distribution by stages of each food chain is shown in Figure 2.
A comparative analysis of the data in Figure 2 and Table 3 highlights notable differences, primarily due to the state database not fully capturing food waste from primary production. This waste, which represents a significant share of the total food waste stream, is often managed on-site or redistributed to other farms. Additionally, enterprises below regulatory thresholds are not required to report detailed waste data, so some food waste is reflected only in mixed municipal waste stream.
According to the data of the CSB, the agricultural (primary production) sector in Latvia is the largest sector of production in tonnes (Table 4) and generated food waste (Figure 2). The volume of meat production (pig farming, cattle breeding, poultry farming) was 91.9 thousand tonnes in 2020, of which 43% was pig production, 38% poultry production, 17% cattle production, and 2% other production, and the volume of milk was 990 thousand tonnes generated in 2020. The fruit and berry production sector generated 19.5 thousand tonnes in 2020, of which 74% were apples and pears, 5% strawberries, and 2% other fruits and berries. In the vegetables and potatoes production sector, 524 thousand tonnes were generated in 2020, of which 72% were potatoes, 8% cabbage, 7% carrots, and 13% other crops. The cereals sector is the largest sector in agriculture, 3479 thousand tonnes in 2020, of which 70% were winter crops and 30% were summer crops. As can be shown in Figure 2, only 6% in 2019 and 14% in 2020 of generated food waste were entered into the common waste management system.
Based on the calculations for the processing and manufacturing sector, it can be concluded that the total amount of food waste generated by food production companies in 2019 was 53.48 thousand tonnes, of which 50.29 thousand tonnes were separated and recycled, while 3.19 thousand tonnes were landfilled. Respectively, in 2020, there were 66.11 thousand tonnes, of which 61.89 thousand tonnes were separated and recycled, while 4.22 thousand tonnes were landfilled. Assessing the data, most of the generated food waste was separated and recycled, but compared to 2019, the amount of unsorted waste increased rapidly in 2020. This can be partly explained by the increase in production intensity, but the main reasons, based on surveys, are:
  • The company’s inability or unwillingness to find a recycler for the appropriate type of waste.
  • It is not profitable for a waste management company to separately collect and recycle a small number of certain types of waste.
  • The waste management company does not have a permit for certain types of waste management.
  • There are no recyclers for this type of waste.
  • Recycling opportunities are limited by waste packaging.
In the retail and other distribution of food sector, it is estimated that 48.37 thousand tonnes of food waste were generated in 2019 and 47.85 thousand tonnes in 2020. Estimating the number of employees at the stage of the food supply chain—one employee generated 0.38 tonnes per year of food waste in 2019 and 0.39 tonnes per year in 2020.
In the restaurants and food services, as, it is estimated that 13.99 thousand tonnes of food waste were generated in 2019 and 10.63 thousand tonnes in 2020 at the stage of the Restaurants and food services. Estimating the number of employees at this stage of the food supply chain—one employee generated 0.40 tonnes per year of food waste in 2019 and 0.44 tonnes per year in 2020.
Municipal waste is mainly generated by households, and it is also the largest producer of food waste in this waste flow (Figure 2). However, it also includes the commercial enterprises described in the previous chapters, and the stages of the food supply chain–restaurants and catering services, as well as food retailing and other distribution. Data on the amount of waste generated by households is currently not available, as such statistics are not collected. Therefore, the amount of household waste generated has been accepted as the amount of household waste collected in the waste management statistics.
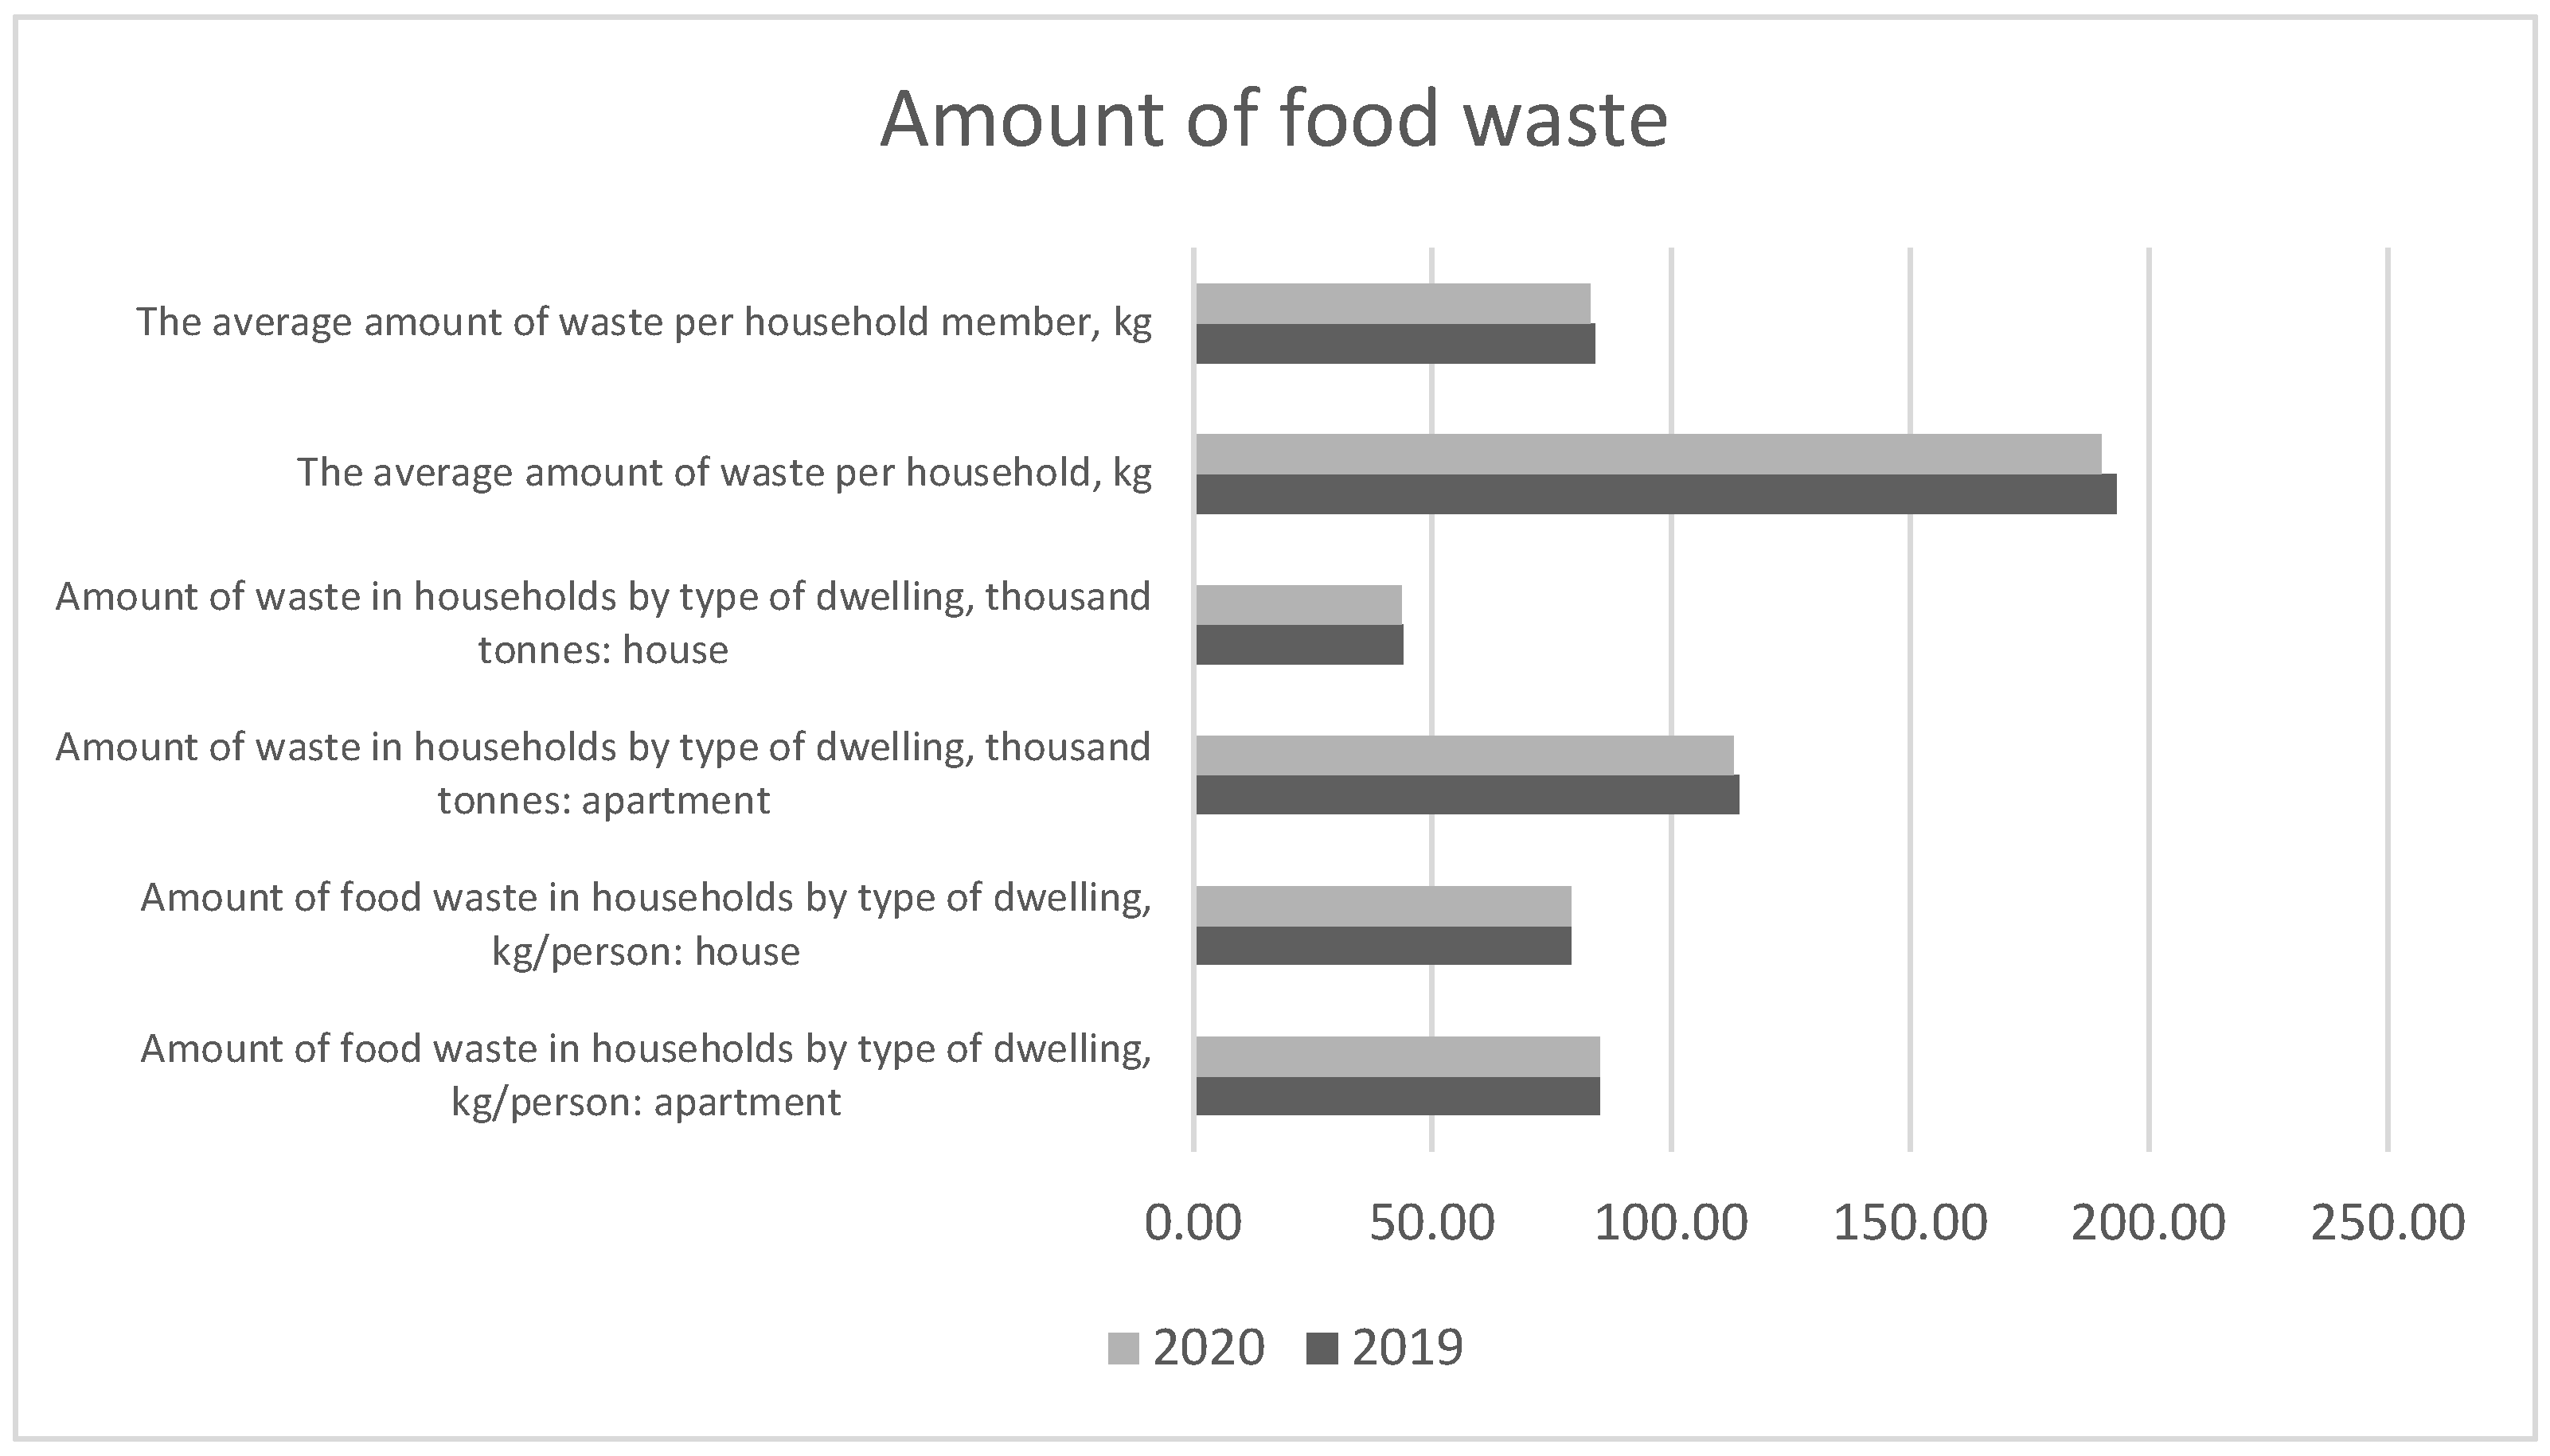
According to the data of the LEGMC (Figure 2), 580 thousand tonnes of mixed municipal waste were collected in 2019, and 564 thousand tonnes in 2020. The amount of food waste is estimated according to the average morphological composition in the country, which is 31.6% of the total amount of mixed municipal waste [53]. According to the calculation, the amount of food waste in the mixed municipal waste stream was 183 thousand tonnes in 2019 and 178 thousand tonnes in 2020 (Table 3). In turn, the total estimated amount of food waste (including 20 01 25 edible oil and fat, 20 01 08 biodegradable kitchens, and canteen waste flow) was 185 thousand tonnes in 2019 and 181 thousand tonnes in 2020 (Table 3). According to the calculations, the amount of food waste generated per capita in 2019 was 96 kg and 95 kg in 2020 (Table 3). However, it should be noted here that the population of the country is larger than the population living in private households. For example, 1908 thousand people were registered in the country in 2020, but only 1880 thousand people were living in private households (Table 5 and Figure 3).
After the survey results, it was estimated that each member in a household produces 79 kg living in a house and 85 kg living in an apartment. More than half, 64%, of food waste are inedible parts of the food, e.g., bark, eggshells, bones, etc., and the edible share of food waste is only 36%. After answers to the survey about further food waste management at the household level, the calculation assumes that 24% of the total amount of food waste generated by households is reduced at the source by composting, feeding to pets, or discharging into the sewer. As in 2019 and 2020, separately collected waste 20 01 08 biodegradable kitchen waste was only 0.34 thousand tonnes (Figure 3), and it is assumed that all household food waste went into the mixed municipal waste stream. According to the calculation (Table 5), household-generated food waste was 157.87 thousand tonnes in 2019, and 156.53 thousand tonnes in 2020, but as assessed by the survey, 24% of generated food waste was reduced at the source, therefore only 119.67 thousand tonnes in 2019 and 118.65 thousand tonnes in 2020 went into the mixed municipal waste stream.

4. Discussion

In this section, the authors provide a pilot case study to verify the aforementioned methodology and also to test home composting in practice. The EU LIFE Integrated Project “Waste To Resources Latvia–boosting regional sustainability and circularity” (LIFE Waste To Resources IP, LIFE20 IPE/LV/000014) focuses on the introduction of the NWMP2028 activities in practice. This paper reflects on one of the sub-actions of the LIFE Waste To Resources IP Project—the demonstration of solutions for the reduction in biological and food waste management and improving food waste measurements. The main goals of the sub-activity are:
  • to establish and introduce a system for separate collection and management of BW, including FW at three municipalities in Latvia.
  • to elaborate recommendations for accounting and integration of BW recycling results from home composting in official waste statistics.
After aggregating data by the Central Statistical Bureau (CSB), most Latvian residents live in apartment buildings–63%, but in individual detached and semi-detached houses–37% of the total [53]. At the pilot site, three cases were examined and possible solutions for achieving quality results at the municipal level were suggested (Table 6, Figure 1).
As part of a project to promote home composting, 99 households with backyards voluntarily participated in an evaluation of their BW management practices. Of these households, 67 were in Liepaja city and 32 were in Preili County. Two seminars were held to educate residents on the benefits of segregating BW and starting home composting. The first seminar took place on 8 December 2022, at Liepajas RAS, Ltd. in Grobina Parish, with 68 attendees. The second seminar was held on 10 December 2022, in Preili County with 25 participants. At the end of the seminars, the participants received a home composting container. Those who were unable to attend the seminars received their containers and informative material later.
Biowaste collection from a multi-apartment house: to start the sorted collection of FW from households in apartment buildings, specialised biological waste collection containers (120 L and 240 L) were purchased and small 6- and 10-litre containers were distributed to residents to put FW in the kitchen. FW is collected once a week. Waste collection method: replacing the full container with a clean one. The contents of the container are transported to a pre-treatment centre and then further to a BW processing plant to produce methane gas.
Measurements of the amount and content of waste take place from November 2022 to December 2023. The waste was weighed, the density of the waste was determined, and the amount of waste collected per inhabitant was calculated.
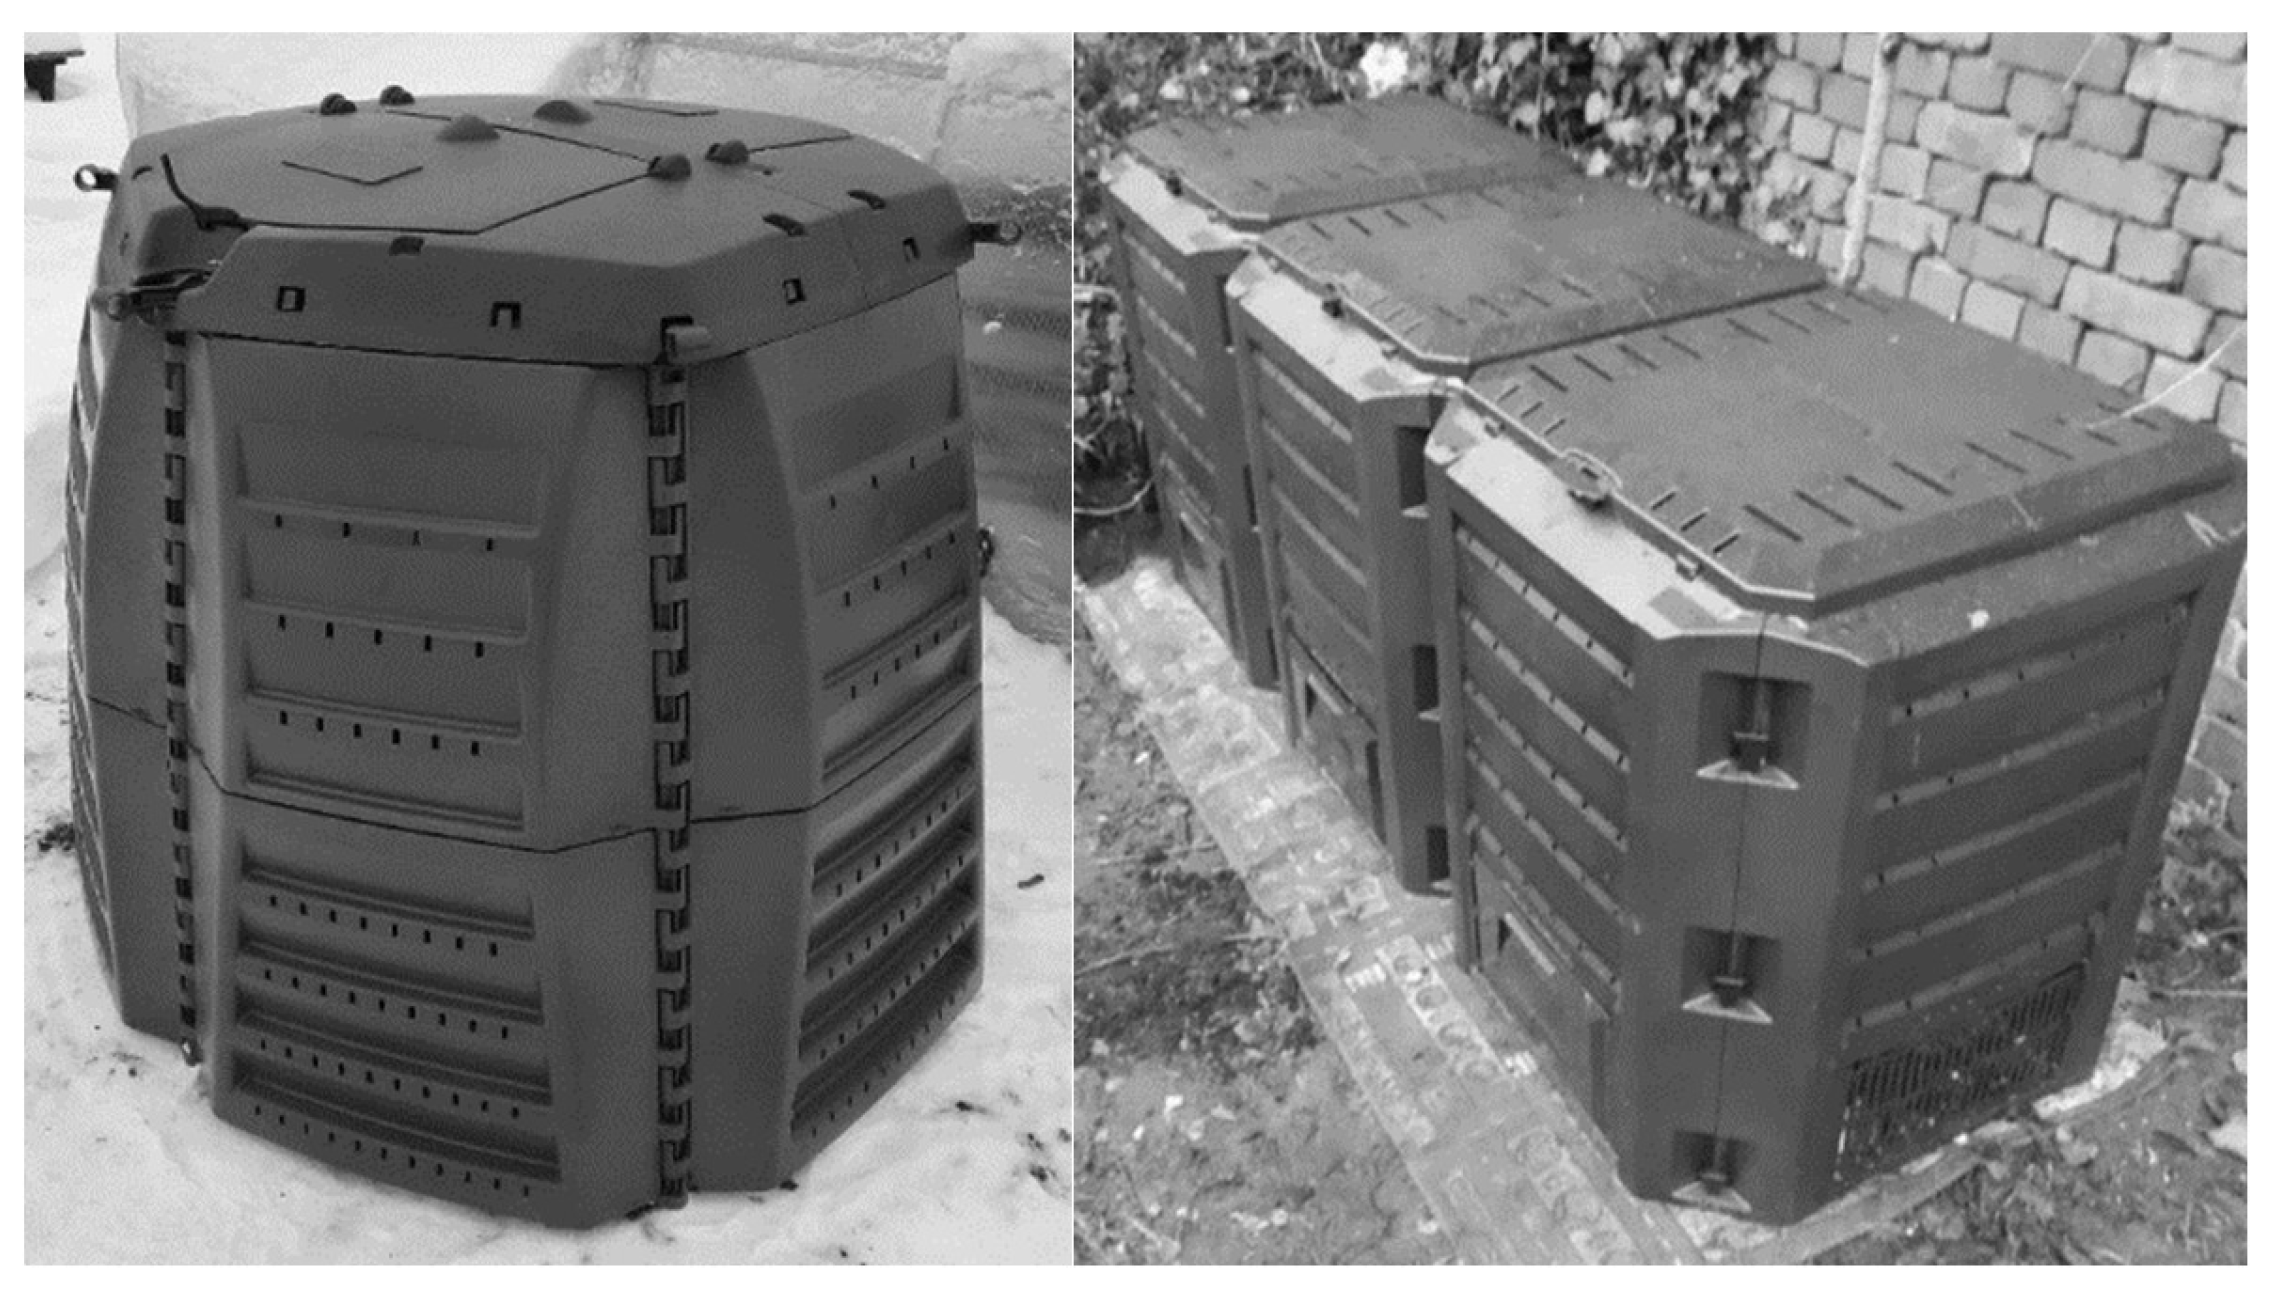
Home composting: Starting from January 2023 to December 2023, households were asked to keep a diary of the amount of BW they generated, including garden waste (GW) from April to October. The data were submitted each month. As part of the project, households were given access to static composting containers (1000 L and 1200 L) (Figure 4) for private use to encourage them to provide data on the waste generated. The data for household waste was measured in litres, while BW data were converted to mass units (kg) using a density of 380 kg m−3, and FW by density 340 kg m−3 [55,56,57,58].
As a part of the project, the authors visited 18 households to ensure that the process of home composting is clear. After these visits, we shared informative materials through local media to raise awareness about the advantages of home composting in the local municipality.
To ensure the responsible involvement of residents in the collection of FW, within the framework of the LIFE project, information was provided to the residents of the apartment buildings involved in the project. This was achieved by organising meetings for the residents of the house with the help of the house manager, explaining the need to separate food waste. Although widely advertised, the meetings were poorly attended. Initiating the project gave results by personally informing the residents of each apartment. In these actions, the residents received specialised buckets for separating FW with a lid, explanatory stickers that must be separated, and a contract with the project organisers for participation in separating FW. This individual approach to each apartment gave good results, because the residents felt a certain responsibility, explanations were given in a text they could understand, and in an appropriate language.
By signing the agreement, each family undertook not only to collect FW separately and place it in a bio-waste container without packaging but also to provide data on the amount of waste collected per family member. Practically, it also helped to assess the real involvement of citizens in the collection of sorted FW. Studies of the composition of the collected food waste show that the amount of impurities in the mass is 0–0.1% (as received). The impurities found are plastic bags. In the period from November 2022 to October 2023, the food waste collected per one inhabitant per year varies from 18 to 87 kg (average 52 kg person−1 year−1; median 49 kg person−1 year−1).
Home composting in Preili County: the Preili municipality generated a total of 2875 tonnes of Municipal Solid Waste (MSW) in 2021, according to data from LEGMC. This amounts to an average of 190 kg per capita. Out of the total MSW generated, 2094 t (138 kg capita−1) was mixed MSW, while 781 t (52 kg capita−1) of MSW was collected separately for recycling, which accounts for 27% of the total MSW generated. As of now, BW has not been collected separately. It was assumed that all household BW was included in the mixed MSW. The amount of BW was estimated based on the average morphological composition of MSW in the country, which is 35.1% of the total amount of mixed MSW. This proportion was determined through a survey of mixed municipal waste conducted at municipal landfill sites in 2019 [59].
On average, one resident generates 49 kg of BW per year. Table 7 provides the characteristics of household waste and the distribution of practical measurements of FW and BW.
In the first eight months from January to August, 16 tonnes of BW were composted. Based on practical household-level measurements, Figure 2 illustrates the projected amounts of FW and BW per year. The estimated average generated FW data ranged from 116 to 124 kg household−1 year−1, and from 35 to 41 kg household person−1 year−1. The amount of FW generated depends on a household’s lifestyle and consumption patterns, including eating habits and seasonality. For instance, if a family eats outside of the home, the amount of FW generated is less. However, if they consume a lot of fruits and vegetables, the amount of FW generated is greater, mostly due to the unavoidable part of FW. The estimated generated BW at that time was from 841 to 848 kg household−1 year−1, and from 178 to 232 kg household person−1 year−1. In the first eight months from January to August, about 16 t of BW were reduced in home composting.
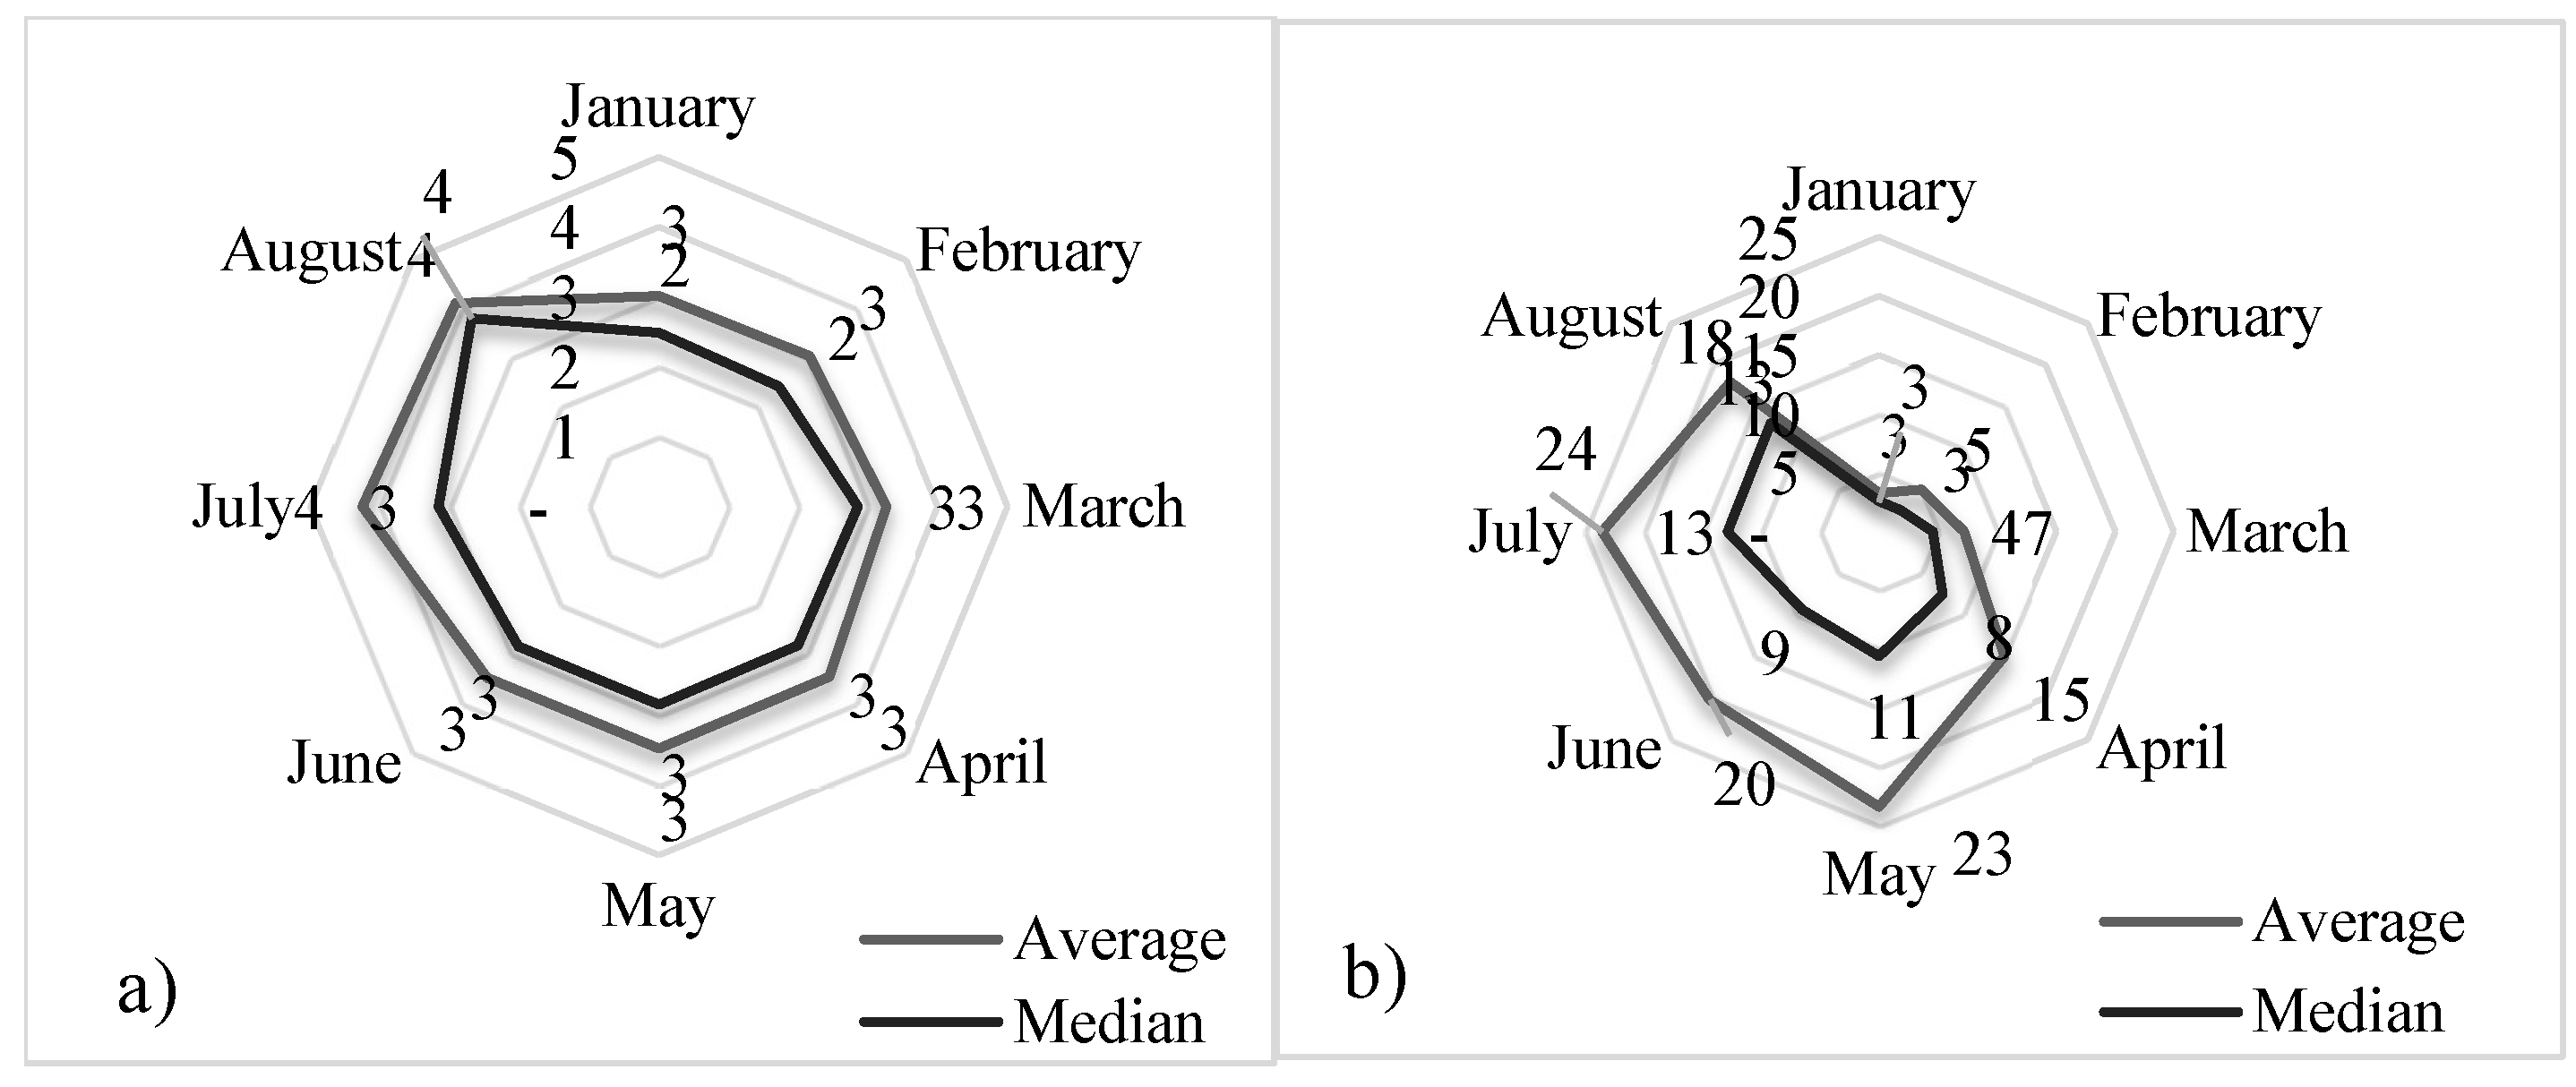
Figure 5 provides an overview of the amount of (a) generated FW and (b) generated BW per household person monthly. A one-person household on average generates between 3 and 4 kg of FW every month. From April onwards, the overall quantity of generated BW, which includes GW, has been measured. The highest amount of BW per household person was generated during July and August, with a range of 16 to 47 kg per household−1 person−1 during this period.
Home composting in Liepaja City: according to the data of the new Dienvidkurzeme WMR plan 2023–2027, in the municipality of Liepaja City, the total amount of MSW was 22,405 t (331 kg capita−1) in 2021, including mixed MSW—19,782 t (292 kg capita−1), and 2623 t (39 kg capita−1) or 12% of total MSW was collected separately for recycling On average, each inhabitant produces 24 kg per month of mixed MSW. As in Preili County, the separate FW was not collected separately in Liepaja City; therefore, it is assumed that all household BW was included in the mixed MSW. The amount of BW is estimated according to the average morphological composition of mixed MSW, annually measured at the regional landfill ‘Ķīvītes’, which is 42.09% of the total amount of mixed MSW—on average, one resident generates BW 139 kg year−1. During the project, 67 households received new composting containers and started to sort BW from produced MSW. The characteristics of the household and the distribution of practical measurements of FW by month in the first quarter of 2023 are shown in Table 8.
Table 8 represents projected FW and BW, based on practical measurements from January to August 2023. Based on average figures generated, FW ranged between 113 and 143 kg household−1 year−1, and for a person, from 35 to 42 kg household person−1 year−1. Meanwhile, generated BW ranged from 327 to 503 kg household−1 year−1, and from 95 to 173 kg household person−1 year−1. In the first eight months from January to August, about 20 t of BW were composted in home composting.
Figure 6 provides an overview of the amount of (a) generated FW and (b) generated BW per household person monthly. Like Preiļi County, on average, a one-person household generates between 3 and 4 kg of FW every month. The overall quantity of generated BW, which includes GW, has been measured since January. The highest amount of BW per household person was generated during May and July, respectively, 23 to 24 kg per household−1 person−1 during this period.
The results obtained at the local level in this study, both household surveys and diary records, as well as pilot projects in Liepaja and Preili, serve as an important methodological basis for calculations at the national level. To ensure reliable extrapolation, local data were linked to the Central Statistical Office and LEGMC databases taking into account, among other factors, population size, household size, housing types, and income levels in the regions. This approach allows for the transfer of data on small-scale trade and households to a broader population level, reflecting both the diversity of consumer habits and regional differences. Consequently, the findings of the pilot studies are not only descriptive at the local level but also serve as a practical basis for national planning and policy development, including progress towards achieving EU waste management targets and the UN Sustainable Development Goals.

5. Conclusions

The results of the current research provide a substantial contribution to the comprehension of the importance of FW assessment volumes and assessment of BW sorting practices. At the same time, this research highlights challenges that are closely linked to the transition towards the circular economy. The assessed case study from Latvia has identified that:
  • Primary food production is an important stage in the generation of food waste but obtaining accurate data are difficult due to the lack of different methodological approaches and coefficients. In order to ensure reliable statistics and international comparability, it is necessary to develop standardised assessment tools that would be adapted to the specifics of Latvia.
  • The household behaviour study shows that residents demonstrate a willingness to engage in biowaste sorting; however, practical implementation is still fragmentary. The results of the research show the critical need for infrastructure development (e.g., availability of appropriate containers, logistical solutions) and the importance of information and educational campaigns that would promote both understanding and long-term behaviour change for the society.
  • The policy dimension emerges as the main condition for effective food waste reduction. Although EU regulation establishes mandatory BW sorting measures, the study results show a lack of a unified one-size-fits-all approach and highlight that the implementation of these requirements in Latvia requires closer coordination between state institutions, municipalities, and waste management companies.
  • Public education and motivational tools (e.g., economic incentives, educational initiatives and examples of good practices) are critical factors that could contribute to strengthening the culture of food waste sorting and recycling.
The results of the research confirm that management of BW and FW is not only a technical issue, but a multi-dimensional challenge, covering economic, social and environmental aspects. Most important implications cover:
Policy planning: the obtained results and data may contribute to the development of scientifically grounded regulatory and policy planning documents, thus fostering a decrease in FW and boosting resource efficiency.
Implementation of systemic solutions: a coordinated development of the infrastructure is required, which would allow accessible and sustainable solutions for sorting of BW both in urban and rural territories.
International dimension: the results obtained in the research provide a possibility to compare Latvia’s situation with other EU Member States, thus fostering knowledge transfer and implementation of best practices.
Achievement of SDGs: the research provides a substantial contribution to the achievement of SDG No. 12, “Sustainable consumption and production” in the Latvian context.
Overall, it may be concluded that the research highlights the necessity of integrating scientific research, practical solutions, and policy planning instruments to ensure a decrease in BW and FW and efficient use of biological resources. This lays a basis for further discussion between scientists, policy planners, and society with respect to the best solutions for moving Latvia forward to the implementation of circular economy principles.

Author Contributions

Conceptualisation, R.B., N.C.-P. and D.A.; methodology, D.A., I.T. and Z.M.; software, D.A.; validation, D.A., I.T., Z.M. and L.J.; formal analysis, N.C.-P.; investigation, D.A., R.B. and I.T.; resources, D.A. and N.C.-P.; data curation, D.A.; writing—original draft preparation, D.A. and I.T.; writing—review and editing, N.C.-P.; visualisation, Z.M., L.J. and Z.R.; supervision, N.C.-P.; project administration, R.B. All authors have read and agreed to the published version of the manuscript.

Funding

This research received no external funding for publication. The authors disclose receipt of the financial support for the research carried out in the empirical part of the paper: the Latvian Environmental Protection Fund within project No. 1-08/202/2020 supported this project (programme No. 21.13.00; agreement No. IL/78/2021).

Institutional Review Board Statement

Specific ethical approval was not required for this type of study as it is part of LIFE Programme of the European Union and Latvian State Regional Development Agency within the Integrated Project “Waste To Resources Latvia–boosting regional sustainability and circularity”, LIFE20IPE/LV/000014 Activity C8 “Demonstration of solutions for reduction of biological and food waste and improving food waste measurements” and is linked to a Deliverable “Report on an operational scheme for local–close to the biological waste producer–management of bio-waste based on pilot experience”. The Privacy Policy set out in the Project was followed for the collection and processing of data necessary for the implementation of the Project.

Informed Consent Statement

Informed consent was obtained from all subjects involved in the study.

Data Availability Statement

The data presented in this study are available on request from the corresponding author because they have not been openly published in repositories.

Acknowledgments

The authors disclosed receipt of the following financial support for the research and authorship of this article: LIFE Programme of the European Union and Latvian State Regional Development Agency within the Integrated Project “Waste To Resources Latvia–boosting regional sustainability and circularity” (LIFE Waste To Resources IP, LIFE20 IPE/LV/000014).

Conflicts of Interest

The authors declare no conflicts of interest.

References

  1. Gustavsson, J.; Cederberg, C.; Sonesson, U.; van Otterdijk, R.; Meybeck, A. Global Food Losses and Food Waste: Extent, Causes and Prevention; Food and Agriculture Organization of the United Nations: Rome, Italy, 2011. [Google Scholar]
  2. Crippa, M.; Solazzo, E.; Guizzardi, D.; Monforti-Ferrario, F.; Tubiello, F.N.; Leip, A. Food Systems Are Responsible for a Third of Global Anthropogenic GHG Emissions. Nat. Food 2021, 2, 198–209. [Google Scholar] [CrossRef] [PubMed]
  3. Poore, J.; Nemecek, T. Reducing Food’s Environmental Impacts through Producers and Consumers. Science 2018, 360, 987–992. [Google Scholar] [CrossRef] [PubMed]
  4. Porter, S.D.; Reay, D.S.; Higgins, P.; Bomberg, E. A Half-Century of Production-Phase Greenhouse Gas Emissions from Food Loss & Waste in the Global Food Supply Chain. Nat. Food 2016, 571, 721–729. [Google Scholar] [CrossRef]
  5. United Nations. Transforming Our World: The 2030 Agenda for Sustainable Development; Resolution Adopted by the General Assembly on 25 September 2015, A/RES/70/1; United Nations: New York, NY, USA, 2015; Available online: https://digitallibrary.un.org/record/3923923 (accessed on 3 August 2025).
  6. Xue, L.; Liu, G.; Parfitt, J.; Liu, X.; Van Herpen, E.; Stenmarck, Å.; O’Connor, C.; Östergren, K.; Cheng, S. Missing Food, Missing Data? A Critical Review of Global Food Losses and Food Waste Data. Environ. Sci. Technol. 2017, 51, 6618–6633. [Google Scholar] [CrossRef]
  7. Caldeira, C.; De Laurentiis, V.; Corrado, S.; van Holsteijn, F.; Sala, S. Quantification of Food Waste per Product Group along the Food Supply Chain in the European Union: A Mass Flow Analysis. Resour. Conserv. Recycl. 2019, 149, 479–488. [Google Scholar] [CrossRef]
  8. Corrado, S.; Sala, S. Food Waste Accounting along Global and European Food Supply Chains: State of the Art and Outlook. Waste Manag. 2018, 79, 120–131. [Google Scholar] [CrossRef]
  9. FAO. Food Loss and Waste and the Right to Adequate Food: Making the Connection; Right to Food Discussion Paper; FAO: Rome, Italy, 2018; Available online: www.fao.org/publications (accessed on 13 November 2024).
  10. Silpa, K.; Yao, L.C.; Perinaz, B.-T.; Frank, V.W. What a Waste 2.0: A Global Snapshot of Solid Waste Management to 2050; Urban Development; World Bank: Washington, DC, USA, 2018; Available online: http://hdl.handle.net/10986/30317 (accessed on 12 August 2025).
  11. European Commission. Commission Delegated Decision (EU) 2019/1597 of 3 May 2019 supplementing Directive 2008/98/EC of the European Parliament and of the Council as Regards a Common Methodology and Minimum Quality Requirements for the Uniform Measurement of Levels of Food Waste; European Commission: Brussels, Belgium, 2019; Available online: https://eur-lex.europa.eu/eli/dec_del/2019/1597/oj/eng#:~:text=Commission%20Delegated%20Decision%20%28EU%29%202019%2F1597%20of%203%20May,of%20food%20waste%20%28Text%20with%20EEA%20relevance.%29%20C%2F2019%2F3211 (accessed on 12 August 2025).
  12. European Commission. Commission Implementing Decision (EU) 2019/2000 of 28 November 2019 Laying Down a Format for Reporting of Data on Food Waste and for Submission of the Quality Check Report in Accordance with Directive 2008/98/EC of the European Parliament and of the Council (Notified Under Document C(2019) 8577); European Commission: Brussels, Belgium, 2019; Available online: https://eur-lex.europa.eu/eli/dec_impl/2019/2000/oj/eng#:~:text=Commission%20Implementing%20Decision%20%28EU%29%202019%2F2000%20of%2028%20November,document%20C%20%282019%29%208577%29%20%28Text%20with%20EEA%20relevance%29 (accessed on 22 August 2025).
  13. EU Platform on Food Losses and Food Waste. Recommendations for Action in Food Waste Prevention; EU Platform on Food Losses and Food Waste: Brussels, Belgium, 2019. [Google Scholar]
  14. Pretty, J.N.; Ball, A.S.; Lang, T.; Morison, J.I.L. Farm costs and food miles: An assessment of the full cost of the UK weekly food basket. Food Policy 2005, 30, 1–19. [Google Scholar] [CrossRef]
  15. Gilland, B. World population and food supply: Can food production keep pace with population growth in the next half-century? Food Policy 2002, 27, 47–63. [Google Scholar] [CrossRef]
  16. Engström, R.; Carlsson-Kanyama, A. Food losses in food service institutions: Examples from Sweden. Food Policy 2004, 29, 203–213. [Google Scholar] [CrossRef]
  17. Kumar, K.; Yadav, A.N.; Kumar, V.; Vyas, P.; Dhaliwal, H.S. Food waste: A potential bioresource for extraction of nutraceuticals and bioactive compounds. Bioresour. Bioprocess. 2017, 4, 18. [Google Scholar] [CrossRef]
  18. Burlakovs, J.; Jani, Y.; Kriipsalu, M.; Grinfelde, I.; Pilecka, J.; Hogland, W. Implementation of new concepts in waste management in tourist metropolitan areas. IOP Conf. Ser. Earth Environ. Sci. 2020, 471, 012017. [Google Scholar] [CrossRef]
  19. Beretta, C.; Stoessel, F.; Baier, U.; Hellweg, S. Quantifying food losses and the potential for reduction in Switzerland. Waste Manag. 2013, 33, 764–773. [Google Scholar] [CrossRef]
  20. Betz, A.; Buchli, J.; Göbel, C.; Müller, C. Food waste in the Swiss food service industry—Magnitude and potential for reduction. Waste Manag. 2015, 35, 218–226. [Google Scholar] [CrossRef]
  21. Abeliotis, K.; Lasaridi, K.; Chroni, C. Food waste prevention in Athens, Greece: The effect of family characteristics. Waste Manag. Res. J. A Sustain. Circ. Econ. 2016, 34, 1210–1216. [Google Scholar] [CrossRef] [PubMed]
  22. Bräutigam, K.R.; Jörissen, J.; Priefer, C. The extent of food waste generation across EU-27: Different calculation methods and the reliability of their results. Waste Manag. Res. 2014, 32, 683–694. [Google Scholar] [CrossRef] [PubMed]
  23. Makijenko, J.; Burlakovs, J.; Brizga, J.; Klavins, M. Energy efficiency and behavioral patterns in Latvia. Manag. Environ. Qual. 2016, 27, 695–707. [Google Scholar] [CrossRef]
  24. European Commission. Directive 2008/98/EC of the European Parliament and of the Council of 19 November 2008 on Waste and Repealing Certain Directives; European Commission: Brussels, Belgium, 2008; Available online: https://eur-lex.europa.eu/legal-content/EN/TXT/?uri=CELEX%3A02008L0098-20180705 (accessed on 22 August 2025).
  25. European Compost Network. Bio-Waste: The Valuable Organic Resource in a Circular Economy. 2016. Available online: https://www.compostnetwork.info/wordpress/wp-content/uploads/ECN_Factsheet_A3_CircularEconomy_NR01_pages-1.pdf (accessed on 12 August 2025).
  26. European Compost Network (2022) ECN Data Report 2022. Available online: https://www.compostnetwork.info/ (accessed on 15 August 2025).
  27. Eurostat. Municipal Waste by Waste Management Operations. Online Data Code: ENV_WASMUN. Available online: https://ec.europa.eu/eurostat/databrowser/view/env_wasmun/default/table?lang=en (accessed on 15 June 2025).
  28. Eurostat. Food Waste and Food Waste Prevention by NACE Rev. 2 Activity—Tonnes of Fresh Mass. Online Data Code: ENV_WASFW. Available online: https://ec.europa.eu/eurostat/databrowser/view/env_wasfw/default/table?lang=en (accessed on 15 June 2025).
  29. Latvian Environment, Geology and Meteorology Centre (LEGMC), SLLC. National Statistics Review. Available online: https://parskati.lvgmc.lv/ (accessed on 15 June 2025).
  30. Eurostat. Municipal Waste Landfilled, Incinerated, Recycled and Composted, EU, 1995–2021. Online Data Code: ENV_WASMUN. Available online: https://ec.europa.eu/eurostat/statistics-explained/index.php?title=Municipal_waste_statistics (accessed on 15 June 2025).
  31. Tatàno, F.; Pagliaro, G.; Di Giovanni, P.; Floriani, E.; Mangani, F. Biowaste home composting: Experimental process monitoring and quality control. Waste Manag. 2015, 38, 72–85. [Google Scholar] [CrossRef]
  32. Abeliotis, K.; Lasaridi, K.; Chroni, C. Life cycle assessment of food waste home composting in Greece. Toxicol. Environ. Chem. 2015, 98, 1200–1210. [Google Scholar] [CrossRef]
  33. Malamis, D.; Bourka, A.; Stamatopoulou, E.; Moustakas, K.; Skiadi, O.; Loizidou, M. Study and assessment of segregated biowaste composting: The case study of Attica municipalities. J. Environ. Manag. 2016, 203, 664–669. [Google Scholar] [CrossRef]
  34. Barrena, R.; Font, X.; Gabarrell, X.; Sánchez, A. Home composting versus industrial composting: Influence of composting system on compost quality with focus on compost stability. Waste Manag. 2014, 34, 1109–1116. [Google Scholar] [CrossRef]
  35. Vázquez, M.; Soto, M. The efficiency of home composting programmes and compost quality. Waste Manag. 2017, 64, 39–50. [Google Scholar] [CrossRef]
  36. Arrigoni, J.P.; Paladino, G.; Garibaldi, L.A.; Laos, F. Inside the small-scale composting of kitchen and garden wastes: Thermal performance and stratification effect in vertical compost bins. Waste Manag. 2018, 76, 284–293. [Google Scholar] [CrossRef]
  37. Hartikainen, H.; Svanes, E.; Franke, U.; Mogensen, L.; Andersson, S.; Bond, R.; Burman, C.; Einarsson, E.; Eklöf, P.; Joensuu, K.; et al. Food Losses and Waste in Primary Production. Case Studies on Carrots, Onions, Peas, Cereals and Farmed Fish. Nordic Council of Ministers. Available online: https://norsus.no/wp-content/uploads/food-losses-and-waste-in-primary-production-final-report-summer-2016.pdf (accessed on 26 February 2022).
  38. Redlingshöfer, B.; Coudurier, B.; Georget, M. Quantifying food loss during primary production and processing in France. J. Clean. Prod. 2017, 164, 703–714. [Google Scholar] [CrossRef]
  39. Joensuu, K.; Hartikainen, H.; Karppinen, S.; Jaakkonen, A.-K.; Kuoppa-aho, M. Developing Statistical Food Waste Data Collection on the Primary Production of Fruit and Vegetables. 2019. Available online: http://uest.ntua.gr/heraklion2019/proceedings/pdf/HERAKLION2019_Hartikainen_etal.pdf (accessed on 15 August 2025).
  40. March, M.D.; Toma, L.; Thompson, B.; Haskell, M.J. Food waste in primary production: Milk loss with mitigation potentials. Front. Nutr. 2019, 6, 37. [Google Scholar] [CrossRef] [PubMed]
  41. Bajzelj, B.; McManus, W.; Parry, A. Food Waste in Primary Production in the UK. WRAP Report. 2019. Available online: https://wrap.org.uk/sites/default/files/2020-07/WRAP-food-waste-in-primary-production-in-the-UK.pdf (accessed on 22 August 2025).
  42. Hartikainen, H.; Mogensen, L.; Svanes, E.; Franke, U. Food waste quantification in primary production—The Nordic countries as a case study. Waste Manag. 2018, 71, 502–511. [Google Scholar] [CrossRef] [PubMed]
  43. Stenmarck, Å.; Jensen, C.; Quested, T.; Moates, G. Estimates of European Food Waste Levels. FUSIONS Report. 2016. Available online: https://www.researchgate.net/publication/301216380_Estimates_of_European_food_waste_levels (accessed on 3 August 2025).
  44. Favoino, E.; Giavini, M. Bio-Waste Generation in the EU: Current Capture Levels and Future Potential. Zero Waste Europe. 2020. Available online: https://zerowasteeurope.eu/wp-content/uploads/2020/07/2020_07_06_bic_zwe_report_bio_waste_en.pdf (accessed on 15 August 2025).
  45. Van Herpen, E.; Van Geffen, L.; Nijenhuis-de Vries, M.; Holthuysen, N.; Van der Lans, I.; Quested, T. A validated survey to measure household food waste. MethodsX 2019, 6, 2767–2775. [Google Scholar] [CrossRef]
  46. Schmidt, T.; Schneider, F.; Claupein, E. Food Waste in Private Households in Germany-Analysis of Findings of a Representative Survey Conducted by GfK SE in 2016/2017, 2019. Available online: https://www.bmel.de/SharedDocs/Downloads/DE/_Ernaehrung/Lebensmittelverschwendung/GfK-Analyse_TI_englisch.pdf?__blob=publicationFile&v=2 (accessed on 2 August 2025).
  47. Waste & Resources Action Programme (WRAP). Down the Drain Quantification and Exploration of Food and Drink Waste Disposed of to the Sewer by Households in the UK. 2009. Available online: https://wrap.org.uk/sites/default/files/2020-12/Down-the-drain.pdf (accessed on 22 August 2025).
  48. Sulewski, P.; Kais, K.; Gołaś, M.; Rawa, G.; Urbańska, K.; Wąs, A. Home Bio-Waste Composting for the Circular Economy. Energies 2021, 14, 6164. [Google Scholar] [CrossRef]
  49. Kircher, M.; Aranda, E.; Athanasios, P.; Radojcic-Rednovnikov, I.; Romantschuk, M.; Ryberg, M.; Schock, G.; Shilev, S.; Stanescu, M.D.; Stankeviciute, J.; et al. Treatment and valorization of bio-waste in the EU. EFB Bioeconomy J. 2023, 3, 100051. [Google Scholar] [CrossRef]
  50. De Boni, A.; Melucci, F.A.; Acciani, C.; Roma, R. Community composting: A multidisciplinary evaluation of an inclusive, participative, and eco-friendly approach to biowaste management. Clean. Environ. Syst. 2022, 6, 100092. [Google Scholar] [CrossRef]
  51. European Environment Agency. Bio-Waste in Europe–Turning Challenges Into Opportunities; EEA Report No 4/2020; European Environment Agency: Copenhagen, Denmark, 2020; Available online: https://www.eea.europa.eu/en/analysis/publications/bio-waste-in-europe (accessed on 18 August 2025).
  52. National Waste Management Plan 2021–2028. (Latvian Edition). Available online: https://likumi.lv/ta/id/320476 (accessed on 18 August 2025).
  53. The Central Statistical Bureau (CSB). Official Statistics Portal. Available online: https://www.csp.gov.lv/en (accessed on 15 June 2025).
  54. Lursoft IT, Llc. Register of Enterprises of the Republic of Latvia. Available online: https://www.lursoft.lv/en (accessed on 15 June 2025).
  55. Kamaruddin, M.A.; Jantira, N.N.; Alrozi, R. Food waste quantification and characterization as a measure towards effective food waste management in university. IOP Conf. Ser. Mater. Sci. Eng. 2019, 743, 012041. [Google Scholar] [CrossRef]
  56. Ricci-Jürgensen, M. How to Plan a Separate Collection for Biowaste in an Urban and Rural Situation; ECN-ISWA Seminar: Sofia, Bulgaria, 2013. [Google Scholar]
  57. Liu, X.; Xie, Y.; Sheng, H. Green waste characteristics and sustainable recycling options. Resour. Environ. Sustain. 2023, 11, 100083. [Google Scholar] [CrossRef]
  58. Āriņa, D.; Teibe, I.; Bendere, R.; Melnalksne, Z. Food waste estimation in Latvia. In Proceedings of the 9th International Conference on Sustainable Solid Waste Management, Corfu, Greece, 15–18 June 2022; Available online: http://corfu2022.uest.gr/proceedings.html (accessed on 15 August 2025).
  59. Geo Consultants. Investment Needs Assessment for the Development of the National Waste Management Plan for 2021–2028 (IL/57/2020). 2020. Available online: https://www.varam.gov.lv/sites/varam/files/content/investiciju-vajadzibu-izvertejums-aavp-2021_2028-geoconsultants-2020.pdf (accessed on 15 June 2025).
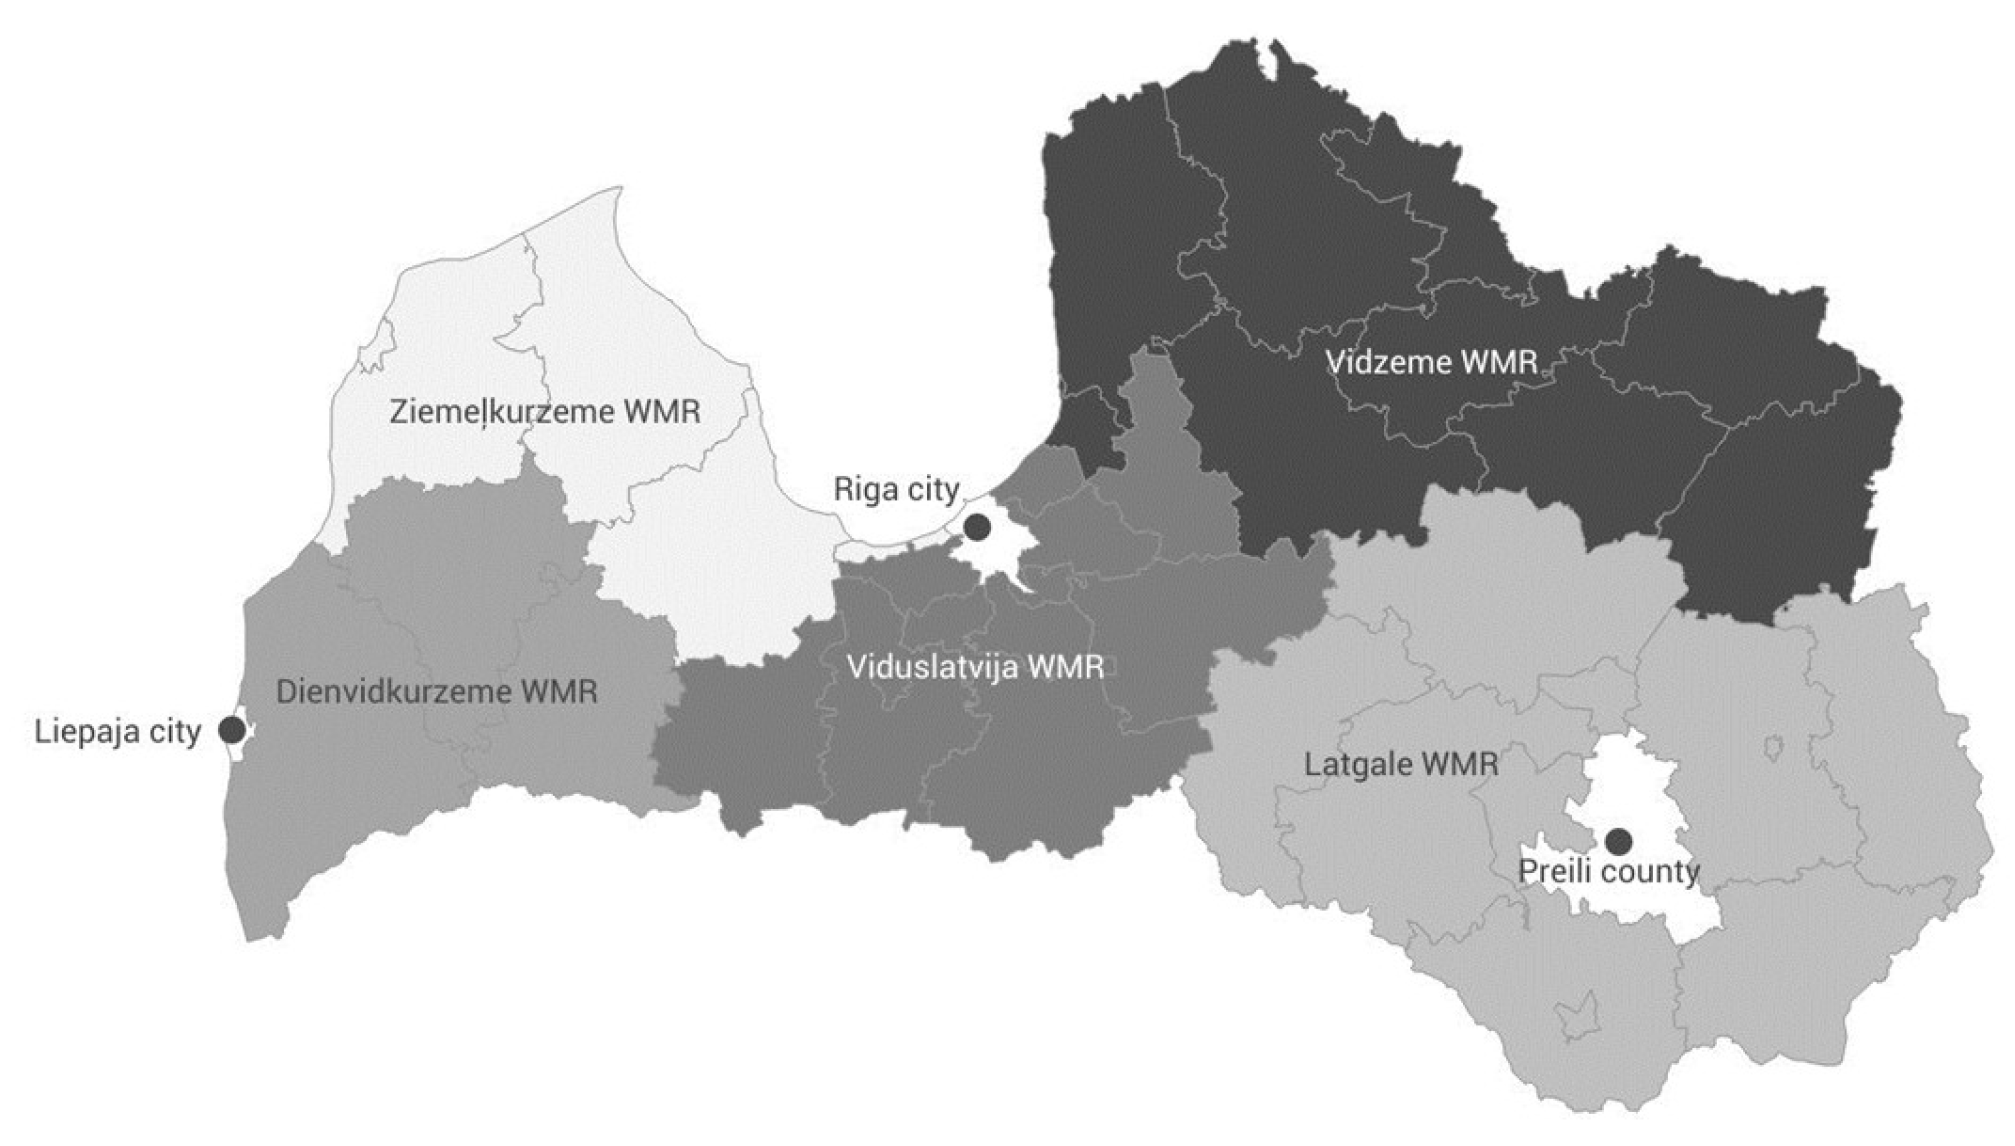
Figure 1. Waste management system of Latvia and project areas. Source: [52].
Biomass 05 00058 g001
Figure 2. The estimated amount of food waste generated by each stage of the food supply chain. Source: developed by authors.
Biomass 05 00058 g002
Figure 3. The estimated amount of food waste generated by households. Source: developed by authors.
Biomass 05 00058 g003
Figure 4. Home composting containers (composters).
Biomass 05 00058 g004
Figure 5. (a) Generated food waste, kg household person−1 month−1; (b) generated biowaste, kg household person−1 month−1 in the Preiļi County monthly. Source: developed by the authors.
Biomass 05 00058 g005
Figure 6. (a) Generated food waste, kg household person−1 month−1; (b) generated biowaste, kg household person−1 month−1 in Liepaja City monthly. Source: developed by the authors.
Biomass 05 00058 g006
Table 1. Generated municipal waste (MW), generated FW (FW), and treatment of separately collected biowaste (BW) (municipal and commercial/industrial) in Europe, kg capita−1 annum−1. Source: developed by the authors, based on [26,27,28,29,30].
CountryGenerated
MW in 2021
Generated
FW in 2020 *
CompostingAnaerobic DigestionUse as a Fuel
Belgium755246151
(Flanders)
232
(Flanders)
-
Austria83513414680-
Italy4951251127-
Denmark76920910855-
Netherlands 51513510831-
United Kingdom--8352-
Luxembourg79313673121-
Switzerland704-7295-
Spain472714414-
Finland6301064324-
Lithuania480108412-
Norway799n/a3750-
Ireland-1423116-
Sweden418862956-
Czechia570-028-
Latvia46112814253
European Union-27 countries52711895--
* excl. primary production of food—agriculture, fishing, and aquaculture.
Table 2. Methodology for the measurement of food waste at each stage of the food supply chain. Source: developed by the authors, based on [29,37,52,53].
Stage of the Food Supply ChainRelevant NACE Rev. 2 CodeMethodology for Measurement of Food Waste (Number of Participants)
Primary productionSection A
Division 01
Division 03
Questionnaires and interviews (14 enterprises and 8 societies)
Coefficients and production statistics
Processing and manufacturingSection C
Division 10
Division 11
Questionnaires and interviews (100 enterprises)
Coefficients and production statistics
Direct measurement
Retail and other distribution of foodSection G
Division 46
Division 47
Questionnaires and interviews (197 enterprises)
Coefficients and production statistics
Direct measurement
Restaurants and food servicesSection I
Division 55
Division 56 Sections N, O, P, Q, R, S
Questionnaires and interviews (147 enterprises)
Coefficients and production statistics
Direct measurement
Households‘Households’ as referred to in Annex I Section 8 point 1.2 to
Regulation (EC) No 2150/2002 on waste statistics
Questionnaires (115 households)
Coefficients and production statistics
Diaries (21 respondents)
Table 3. Reported food waste amount by each stage of the food supply chain. Source: developed by authors.
FW in 2019FW in 202020192020
Number of Capita/Stage of the Food Supply Chain, Waste FlowThousand Tonnes%Thousand Tonnes%kg/Capitakg/Capita
Number of capita (thousand) 19201908
Primary production:14.48638.63140.010.02
02 01 02 animal-tissue waste12.01 13.89
02 01 03 plant-tissue waste2.48 24.74 *
Processing and manufacturing:50.292061.89220.030.03
02 02 02 animal-tissue waste11.16 13.13
02 03 04 materials unsuitable for consumption or processing1.83 2.09
02 02 03 materials unsuitable for consumption or processing (meat, fish)1.70 2.70
02 07 04 materials unsuitable for consumption or processing (alcohol)0.93 0.85
02 03 99 other wastes of this group (fruits, vegetables)2.99 3.15
02 02 99 other wastes of this group (meat, fish)0.24 0.19
02 07 99 other wastes of this group (beverage)4.16 10.97
02 05 99 other wastes of this group (milk)18.54 22.06
02 05 01 waste unusable for consumption or processing (milk)0.64 9.90
02 03 04 waste unusable for consumption or processing (fruit, vegetables)1.83 2.09
02 07 02 wastes from spirit distillation6.26 0.30
Retail and other distribution of food185.1174180.536496.4194.63
Restaurants and food services
Households
20 03 01 mixed municipal waste
(incl. biodegradable kitchens and canteen waste)
580.10
(183.30)
564.13
(178.26)
20 01 25 edible oil and fat1.54 1.93
20 01 08 biodegradable kitchens and canteen waste0.26 0.34
TOTAL249.88100281.05100
* 24.01 thousand tonnes were reported by one company, and it is not typical for annual statistics data.
Table 4. Reported primary production yield and estimated generated food waste by sectors. Source: developed by authors.
Primary ProductionTotal Yield
(Thousand Tonnes)
Average Applicable Coefficient (%)FW
2019
(Thousand Tonnes)
2020
(Thousand Tonnes)
2019
(Thousand Tonnes)
Each Sector (%)2020
(Thousand Tonnes)
Each Sector (%)
Cereals3163.203497.106.50219.9069243.1173
Milk981.40990.101.2812.725412.844
Potatoes501.80377.508.2041.151330.969
Vegetables, total 161.60147.10 32.311029.029
Cabbage53.2043.0012.306.54 5.29
Carrots37.0039.3024.108.92 9.47
Onions22.6024.8014.943.38 3.71
Beets28.5019.6033.009.41 6.47
Other20.3020.4020.004.06 4.08
Fruits and berries, total 14.6219.53 2.8913.891
Apples10.3913.9320.302.11 2.83
Pears0.700.5620.300.14 0.11
Strawberry1.141.0414.000.16 0.15
Other2.394.0120.000.48 0.80
Meat94.0091.903.9512.00413.894
TOTAL4916.625123.23 320.97100333.70100
Table 5. The estimated amount of food waste generated by households. Source: developed by authors.
Parameters20192020
The number of households, thousand817.90825.40
Household size, persons2.312.28
Population in private households, thousand1896.421880.40
Type of dwelling, %:
apartment70.8070.70
house29.2029.30
Population in private households by type of dwelling, thousand:
apartment1342.661329.44
house553.75550.96
Table 6. Territories for the implementation of the project activities. Source: developed by the authors based on [53].
ActivityMunicipalityNumber of Capita (in 2021), ThousandArea, km2Household Income Per Person in 2021, €/monthWaste Management Region (WMR)
BW collection from a multi-apartment house with 100 apartmentsRiga city (capital of Latvia),605 304791Viduslatvija
BW home compostingLiepaja city6860613Dienvidkurzeme
BW home compostingPreili county171413504Latgale
Table 7. Characteristics of households and projected FW and BW amounts in Preiļi County. Source: developed by the authors.
ParameterAverageMinMaxMedian
Size of household, household persons3154
Size of backyard garden, m21272810,000400
Projected FW amount:
kg household−1 year−112418369116
kg household person−1 year−141514035
Projected BW amount:
Litre household−1 year−124931472712473
Litre m−2 year−144417038
kg household−1 year−184852472841
kg household person−1 year−12321762178
Table 8. Characteristics of households and projected FW and BW amount in Liepaja City. Source: developed by the authors.
ParameterAverageMinMaxMedian
Size of household, household persons3.5184
Size of backyard garden, m29073020,000550
Projected FW amount:
kg household−1 year−114311504113
kg household person−1 year−142317035
Projected BW amount:
Litre household−1 year−114801378939961
Litre m−2 year−16<1622
kg household−1 year−1503 463039327
kg household person−1 year−1173 12123395
Disclaimer/Publisher’s Note: The statements, opinions and data contained in all publications are solely those of the individual author(s) and contributor(s) and not of MDPI and/or the editor(s). MDPI and/or the editor(s) disclaim responsibility for any injury to people or property resulting from any ideas, methods, instructions or products referred to in the content.