Article

Biogas and Hydrogen Production from Waste Biomass via Dark Fermentation Evaluating VFAs, COD, and HRT for Process Optimization

by
Hoe-Gil Lee
* and
Zachary Dulany
Department of Mechanical, Environmental, and Civil Engineering, Tarleton State University, Stephenville, TX 76401, USA
*
Author to whom correspondence should be addressed.
Biomass 2025, 5(3), 57; https://doi.org/10.3390/biomass5030057
Submission received: 3 August 2025 / Revised: 9 September 2025 / Accepted: 16 September 2025 / Published: 18 September 2025
(This article belongs to the Topic Advanced Bioenergy and Biofuel Technologies)

Abstract

Biomass energy transforms waste into biofuels and supports water purification. This study examines enhanced hydrogen production via dark fermentation, tracking volatile fatty acids (VFAs), chemical oxygen demand (COD), carbohydrates, and hydraulic retention time (HRT) to optimize biogas yield and quality. Investigations into acidogenesis and acetogenesis explore methods for breaking down long-chain VFAs into short-chain VFAs, which are critical for efficient hydrogen generation. Testing and analysis of VFAs, carbonates, COD, and HRT provide insights into bacterial activity that drives hydrogen production. The main VFAs produced were acetic, propionic, and butyric acids. DF1 and DF2 primarily generated acetic acid, consistent with cheese whey (CW)-based fermentations. DF1.1, using 5× diluted CW and a 30:70 inoculum-to-substrate ratio (I2SR), exhibited elevated butyric acid levels, similar to those observed with food waste. The first dark fermentation process (DF1) initially showed effective carbohydrate metabolism but later experienced spikes in succinic and lactic acids, which reduced hydrogen production. In contrast, the second dark fermentation process (DF2) maintained low lactic acid levels and increased acetate concentrations, indicating improved system performance. DF1.1 also demonstrated stable VFA production and lactic acid reduction. Greater CW dilution, higher initial pH, and increased HRT were key factors in minimizing acidification and enhancing hydrogen-producing pathways.

1. Introduction

Wastewater is classified into (1) rainfall (runoff from impermeable surfaces), (2) residential wastewater, industrial wastewater and agricultural wastewater. Erath County, Texas (the area of service for this project) is a prime example of a rural dairy farming area that has been compelled into social, economic, demographic, and environmental changes over the past three to four decades. This area of Texas is facing severe water pollution and soil contamination [1]. Meanwhile, there is an overproduction of dairy manure and problems with disposal. In 2004, eight large dairies in Central Texas were accused of polluting the North Bosque River, causing taste and odor problems with the city of Waco’s drinking water. A debate exists in Erath County, TX in determining how the dairy industry can continue to thrive without violating the integrity of local air and water resources [2]. This is in contrast to many other states that provide similar quantitative odor limits in dairy farming. A potential solution to these problems is to convert manure into bioenergy or power generation while purifying wastewater. Dairy manure has a complex composition with various nutrient components like nitrogen, phosphorous, and potassium. Manure from different animals varies in density, water content, and nutrient contents. Dairy farms conventionally store the manure for months and apply it to land as fertilizer [3,4,5]. This practice results in emissions into air and water caused by microbial decomposition of the organic matter in manure.
Biohydrogen is on the rise to becoming one of the most useful renewable energy sources [6,7,8,9]. Like methane, hydrogen can be produced as a byproduct of a series of biochemical reactions under anaerobic, mesophilic conditions [10,11]. Hydrogen has a wide range of uses regarding energy [12]. Two of the biggest and most popular uses of hydrogen are transportation and electricity generation. Hydrogen powered fuel cell vehicles have grown in interest due to their low costs and energy efficiency. Due to its molecular structure consisting of two hydrogen atoms, hydrogen possesses high energy potential. When combusted, hydrogen releases a large amount of energy in the form of heat and kinetic energy. When hydrogen is combusted, an exothermic reaction occurs releasing heat and energy, making it an ideal energy source to be used in combustion engines, turbine powered generators and, when in liquid form, it is used as a fuel source for spacecrafts in the aerospace industry. Equations (1) and (2) show the theoretical process of determining the enthalpy of reaction for hydrogen combustion [13].
2 H 2   ( g ) + O 2                   2 H 2 O
H = H p r o d u c t s H r e a c t a n t s = 484     kJ/mol
Hydrogen is also known for its clean combustion potential, meaning it produces no harmful byproducts, such as carbon monoxide or carbon dioxide, but only water vapor during the combustion process. This property makes hydrogen a more versatile energy source, allowing it to be used in a multitude of applications where the production of harmful emissions is prohibited or minimized. Hydrogen can also be stored in various ways due to its simple molecular structure, including as a compressed gas, liquid or as a chemical compound such as a powder to be used in research or scientific procedures [14,15]. The versatility of storage for hydrogen makes it an ideal fuel source for transportation due to the flexibility of its storage requirements. There are many applications that produce hydrogen with a vast amount of research going into finding new ways and procedures to make already existing ways more efficient. Steam methane reforming (SMR) dominates global hydrogen production, responsible for around 70–75%, while coal gasification contributes approximately 20–30%. Electrolysis accounts for less than 3%, and dry reforming of methane (DRM) remains a nascent technology with negligible share [16]. One of the most common methods is known as steam methane reforming (SMR) [17,18]. SMR is the process where methane gas reacts with steam in the presence of a catalyst to produce hydrogen and carbon dioxide. Since carbon dioxide is produced along with hydrogen, SMR applications are considered environmentally unfriendly. For dry reforming of methane (DRM), methane and carbon dioxide are synthesized ( H 2 and CO) through a catalytic process and provide a pathway for hydrogen from light hydrocarbons [19]. Electrolysis is another method that is used to produce hydrogen that involves using an electric current to split water atoms into hydrogen and oxygen. For electrolysis to be successful, the electricity needs to be supplied from what is considered a green source, such as a wind turbine, to not produce greenhouse emissions. If the electricity supplied to the applications is from a combustion generator, this will produce carbon dioxide, making it unfavorable to companies that deal with specific emission standards. Other hydrogen-producing applications include coal gasification, thermochemical processing, photoelectrochemical water splitting, and biological chemical reaction applications. Biological applications are particularly relevant in communities with strong agricultural activity. To mitigate CO2 emissions from dark fermentation, researchers focus on optimizing fermentation conditions to enhance H2 selectivity and incorporate second-stage processes that convert CO2 and VFAs into additional hydrogen or other valuable products [20]. Certain anaerobic bacteria, fungi, and micro algae can produce hydrogen as a byproduct of their metabolic pathways and nutrients consumed. Biomass hydrogen production is particularly interesting with respect to dairy farms due to the abundance of an ideal substrate to be used for fermentation by anaerobic bacteria. Certain anaerobic and facultative anaerobic bacteria use organic compounds to produce hydrogen, alcohols and organic acids to be further used to produce other biogas such as methane. Substances with high organic concentrations, such as CW, dairy manure and dairy water runoff waste, are ideal for fermentation processes that produce hydrogen.
Volatile fatty acids (VFAs) provide a necessary organic carbon source for producing biofuels, and biodegradable synthetic plastics [21,22]. However, VFAs from dark fermentation broths are challenging due to the complex composition of these suspension [23,24]. The electrogenic utilization and hydrogen conversion of dark fermentation products, such as acetate, propionate, butyrate, lactate, and ethanol, derived from agricultural wastes can be supplied to a MEC dual chamber to produce hydrogen and biofuels [25]. Organic waste itself presents a varied composition, which includes crop residues, livestock, and poultry manure, dairy manure, food waste, high-strength organic wastewater, and municipal sludge. To produce the VFAs using a bioreactor through a dark fermentation process, appropriate substrate and inoculum materials are required with an optimal substrate-to-inoculum ratio to evaluate effective microbial activity. CW can be as the substrate because it can provide a nutrient-rich environment for microbial metabolism [26,27,28]. A mesophilic inoculum introduces essential microorganisms to start the breakdown of the substrate. This inoculum can be derived from various organic sources, including digested cattle manure, sewage sludge, food waste, and swine manure, as well as from fresh cattle manure or cattle rumen. Each option has a diverse microbial community, which contributes to efficient substate degradation under mesophilic conditions in the dark fermentation.
This study investigated the influence of main operational parameters on dark fermentation (DF) processes for biohydrogen and biogas production. It evaluated the efficiency of cheese whey as a substrate and lagoon-derived microbial inoculum in enhancing VFAs and hydrogen production, and determined optimal conditions (pH, dilution, and inoculum-to-substrate ratio) for maximizing microbial activity and biofuel yields in batch-mode fermentation systems. To achieve the goal of optimizing hydrogen and VFA production from dairy waste, the plan involved inoculum preparation and activation. Lagoon inoculum was collected from the Texas AgriLife Dairy Center, pretreated, and activated under anaerobic conditions using glucose feeding to stimulate microbial communities. Raw cheese whey from Cheese Farm in Dublin, TX, USA, was used as the substrate at multiple dilution levels. Substrate quality was assessed through analyses of total COD (TCOD), soluble COD (SCOD), total solids (TS), volatile solids (VS), total suspended solids (TSS), and volatile suspended solids (VSS) [29]. Batch fermentation experiments will be conducted in 250 mL and 1 L vessels to investigate the effects of varying pH levels, dilution ratios, and inoculum-to-substrate ratios with the goal of identifying optimal conditions for hydrogen and VFA production. Fermentation outputs were quantitatively analyzed by measuring volatile fatty acid (VFA) profiles using high-performance liquid chromatography (HPLC), a technique that provides precise separation and quantification of compounds in liquid samples. Carbohydrate concentrations were determined via spectrophotometry using glucose standards, and total and soluble chemical oxygen demand (TCOD and SCOD) were measured using Hach TNTplus vials Hach Company P.O. Box 389 Loveland, Colorado 80539. VFA concentrations were analyzed using HPLC equipped with a reversed-phase column. Samples were filtered through membranes, and a gradient elution of water and acetonitrile was applied at 1 mL/min. Detection was performed using a UV detector, and concentrations were quantified against external VFA standards. COD removal efficiency was calculated to assess performance. Hydraulic retention time (HRT) for DF1 and DF2 systems was tested at different days, and organic loading rate (OLR) was estimated based on TCOD and HRT to optimize substrate input and microbial processing. Dilution strategies were applied to adjust substrate concentration and maintain system stability. Gas production was monitored in batch systems and correlated with microbial activity, VFA yields, and COD removal data to guide the design of future continuous systems, including microbial electrolysis cells (MECs) and membrane-based technologies.

2. Materials and Methods

In the anaerobic degradation of complex substrates during fermentation, various groups of microorganisms break down organic matter through a series of metabolic stages, which involve specific compounds and microbial actions [30,31,32]. For complex polymers, organic matter in the waste is initially broken down by fermentative bacteria into simpler, soluble molecules in the hydrolysis. This is the first stage, where complex polymers are broken down. In this stage, biopolymers, such as carbohydrates, proteins, and lipids, are hydrolyzed into smaller compounds and result in sugars, amino acids, a glycerol, and long-chain fatty acids in the acidogenesis stage as shown in Figure 1.
Both anaerobic digestion and dark fermentation are biological processes that produce biogas and hydrogen in the absence of oxygen. Both processes are anaerobic. However, they are different: Anaerobic digestion (AD) produces methane ( C H 4 ) with a longer retention time, whereas dark fermentation (DF) is based on generating hydrogen gas ( H 2 ) with a shorter retention time.

2.1. Anaerobic Digestion, Dark Fermentation, and VFA Production

Clostridium butyricum is a Gram-positive, facultative anaerobic bacterium from the phylum Firmicutes that plays a vital role in producing hydrogen and methane through VFA generation [33,34]. It is found in soil, rumen, and animal intestines, and it ferments organic compounds into butyrate, acetate, and propionate. Under anaerobic conditions, C. butyricum uses glycolysis to convert sugars like glucose into pyruvate, producing biohydrogen as a byproduct. It also contains hydrogenase enzymes that catalyze the reversible conversion of fermentation cofactors such as NADH into hydrogen gas. These features make C. butyricum essential in biohydrogen and methane production pathways through anaerobic fermentation. This catalyzed reversible reduction can be theoretically modeled and represented in Equation (3):
N A D H + H + H 2 + N A D +
Balancing reducing equivalents and regenerating oxidized cofactors help guide Clostridium butyricum through the glycolysis pathway. During dark fermentation, it metabolizes sugars like glucose, fructose, and lactose into pyruvate, butyric acid, acetate, and hydrogen gas via enzymatic reactions. Lactose-rich substrates, such as raw cheese whey, provide an ideal environment for biohydrogen production. Lactose, a disaccharide composed of glucose and galactose, is broken down during glycolysis, leading to the formation of alcohols and various VFAs. The equations below represent the theoretical yields of hydrogen and byproducts of anaerobic lactose fermentation by C. butyricum as follows in Equation (4):
Carbohydrates   +   Proteins   +   Lipids   + H 2 O Sugars + Amino   acids + Triglycerides C 12 H 22 O 11 ( Lactose ) + H 2 O C 6 H 12 O 6   ( G l u c o s e ) + C 6 H 12 O 6   ( Galactose )
After lactose is enzymatically broken down into the simple sugars glucose and galactose, C. butyricum begins fermentation by metabolizing these sugars into VFAs and alcohols, such as butyric acid, pyruvate, acetate, and hydrogen [35,36,37,38,39]. Equations (5)–(9) explain the possible enzymatic reductions and metabolic fermentation pathways for glucose.
C 6 H 12 O 6 2 C 4 H 8 O 2   b u t y r i c   a c i d + C O 2 + 2 H 2
C 6 H 12 O 6 3 C 2 H 4 O 2   a c e t i c   a c i d + 3 C O 2
C 6 H 12 O 6 2 C 3 H 6 O 3   ( lactic   acid )
C 6 H 12 O 6 3 C H 3 C O O H a c e t i c   a c i d + 2 H 2
C 6 H 12 O 6 2 C 3 H 4 O 3   ( pyruvate )
Ammonium chloride ( N H 4 C l ) is chosen to serve as the nitrogen source during C. butyricum biohydrogen analysis trials. N H 4 C l is categorized as a salt composed of ammonium ions ( N H 4 + ), and chloride ions ( C l ), making it an ionic compound. Ionic compounds are easily dissociated into their simple ionic forms to then act as electron donors in microbial fermentation. Being in a chemically reduced form, ammonium ions ( N H 4 + ) are readily available to be used by microorganisms during fermentation processes such as glycolysis by C. butyricum. N H 4 C l is highly soluble in water, making it useful for fermentation processes for mediums in a liquid state. Chloride ions ( C l ) act as a counterion to the positively charged ammonium ion ( N H 4 + ) minimizing drastic changes in the overall pH level during fermentation. Below is a representation of N H 4 C l dissociating into simple ionic compounds to serve as a nutrition and energy source in a solution as follows in Equation (10):
N H 4 C l + S o l u t i o n           N H 4 + + C l
Sodium hydroxide (NaOH) is implemented as an alkaline solution to maintain an optimal pH level of 6.8–7.2 during the enzymatic breakdown and fermentation of lactose by C. butyricum within cheese whey [40,41]. Sodium hydroxide (NaOH) is a strong base and, like ( N H 4 C l ), is highly soluble in water. When mixed with a solution, NaOH dissociates immediately and completely into hydroxide ions ( O H ) and sodium ions ( N A + ) which allows the hydroxide ions to react with hydrogen ions ( H + ) to produce water ( H 2 O ), which results in a more neutral solution, effectively raising the pH level of the system. The following Equations (11)–(14) represent the stoichiometric approach to the acid neutralization of NaOH with lactic acid, butyric acid, acetate, acetic acid, and pyruvate:
N a O H + C 3 H 6 O 3   l a c t i c   a c i d N a C 3 H 5 O 3 + H 2 O
N a O H + C 4 H 8 O 2   ( b u t y r i c   a c i d ) N a C 4 H 7 O 2 + H 2 O
N a O H + C 2 H 4 O 2 a c e t i c   a c i d N a C 2 H 3 O 2 + H 2 O
N a O H + C 3 H 3 O 3   p y r u v a t e N a C 3 H 3 O 3 + H 2 O
To produce VFAs using a bioreactor, there are four dark fermentation processes. The first stage is known as hydrolysis, marking the beginning of the anaerobic digestive process shown in Figure 1. Inside the biomass, complex polymers need to be broken down by hydrolytic bacteria into smaller components that can then be used by acidogenic bacteria. Hydrolytic bacteria release enzymes that convert carbohydrates, lipids, and proteins into sugars, long-chain fatty acids, and amino acids, which are absorbed by the acidogenic bacteria. Hydrolysis operates optimally at a temperature between 30 and 50 °C with a pH level between 5 and 7. The second stage is a much quicker process and begins when the products from hydrolysis are absorbed into the cell membranes of acidogenic bacteria. These enzymes enable the acidogenic bacteria to produce intermediate volatile fatty acids (VFAs). VFAs are classified as organic acids, such as acetates, and larger organic acids like propionates and butyrate. The third stage builds upon the VFAs produced during acidogenesis. While VFAs that are already acetate are ready to be used by methanogenic bacteria to produce methane, the higher VFAs still need to be broken down and converted into acetate. During this biochemical reaction, acetogens help break down the larger VFAs and produce acetates, hydrogen, and carbon dioxide. This stage is known as acetogenesis and specifically aims at the breakdown of higher VFAs. The fourth and final stage is called methanogenesis. This stage begins as soon as acetogens break down the higher VFAs into acetates, hydrogen, and carbon dioxide. Hydrogenotrophic methanogens absorb the hydrogen and produce methane.

2.2. Preparation and Activation of Anaerobic Inoculum and Substrates

The inoculum used in this study was collected from the runoff lagoon at the Texas AgriLife Dairy Center. A makeshift dipping rod (MDR), constructed from a broom handle and a cylindrical plastic bottle, was used to collect samples from approximately 6 to 12 inches below the lagoon surface. Figure 2 explains the collection of inoculums from a dairy lagoon, followed by its pretreatment and activation processes.
A total of 6 to 9 L of lagoon water was retrieved and transported to the Texas AgriLife Center for further processing. Upon arrival at the laboratory, the inoculum was filtered using a X-µm mesh Tisch Scientific 201 S. Miami Ave Cleves, OH 45002 US to remove large debris and suspended solids. From the filtered sample, 400 mL was transferred into a 2-L Erlenmeyer flask, designated as the Inoculum Vessel (IV). An additional 200 mL of deionized (DI) water was added to dilute the sample. Anaerobic conditions within the IV were established by purging with nitrogen gas to eliminate residual oxygen. To activate and stimulate microbial activity, 3 g of glucose were added to the vessel twice weekly. At the end of each week, 400 mL of DI water was added to the IV to gradually increase the working volume. This procedure was continued until the IV reached a final working volume of 1500 mL. The stepwise acclimation with glucose feeding and volume adjustment under strict anaerobic conditions helped promote a stable and active microbial community. This prepared inoculum was then used for further experimental procedures involving anaerobic digestion and biohydrogen production.
Cheese whey from Veldhuizen Cheese Farm located in Dublin TX was chosen to provide insight into the effects of critical operating parameters on the system using raw organic cheese whey. Table 1 provides the substrate properties:
The organic loading rate (OLR) for experiments depends on the substrate concentrations of cheese whey waste and the hydraulic retention time (HRT), which is a critical factor for anaerobic digestion (AD) and dark fermentation (DF). The HRT is a key parameter that affects microbial activity, substrate breakdown, and biogas and hydrogen production. The organic loading rate (OLR) is defined as the ratio of the total chemical oxygen demand (TCOD) to the hydraulic retention time (HRT). HRT is a key operational parameter in biogas production. It refers to the average amount of time that a substrate remains in a bioreactor. This is an important measurement of how long the organic material stays in the system to be processed by microorganisms before being discharged. HRT is calculated by dividing the volume of the bioreactor (L) by the influent flow rate (L/day). The reactor volume refers to the total capacity of the bioreactor, while the influent flow rate indicates the rate at which substrate is fed into the reactor. HRT determines how long microbes have to break down organic matter and ensure that anaerobic bacteria complete the digestion process. Evaluating an optimal HRT is essential for fully digesting the organic material and maximizing biogas yield. A longer HRT can improve the conversion of organic matter into biogas, which influences the necessary size of the bioreactor. For substrates that are more difficult to degrade, larger bioreactors with extended HRTs are required, whereas smaller systems with shorter HRTs may be adequate for easily degradable materials.
For the DF1 and DF2 system processes, HRT parameters of 5, 3, and 2 days were applied. A TCOD value of 87.5 g/L and an HRT of 5 days yields an OLR of 17.5 (g∙TCOD)/(L∙Day). Total solids (TS), volatile solids (VS), total suspended solids (TSS) and volatile suspended solids (VSS) were tested using the U.S. Environmental Protection Agency Office of Water Office of Science and Technology Engineering and Analysis Division (4303) as follows [42]:
  • Sample aliquots of 25–50 g are dried at 103 °C to 105 °C to drive off water in the sample;
  • The residue from step 1 is cooled, weighed, and dried again at 550 °C to drive off volatile solids in the sample;
  • The total, fixed, and volatile solids are determined by comparing the mass of the sample before and after each drying step.
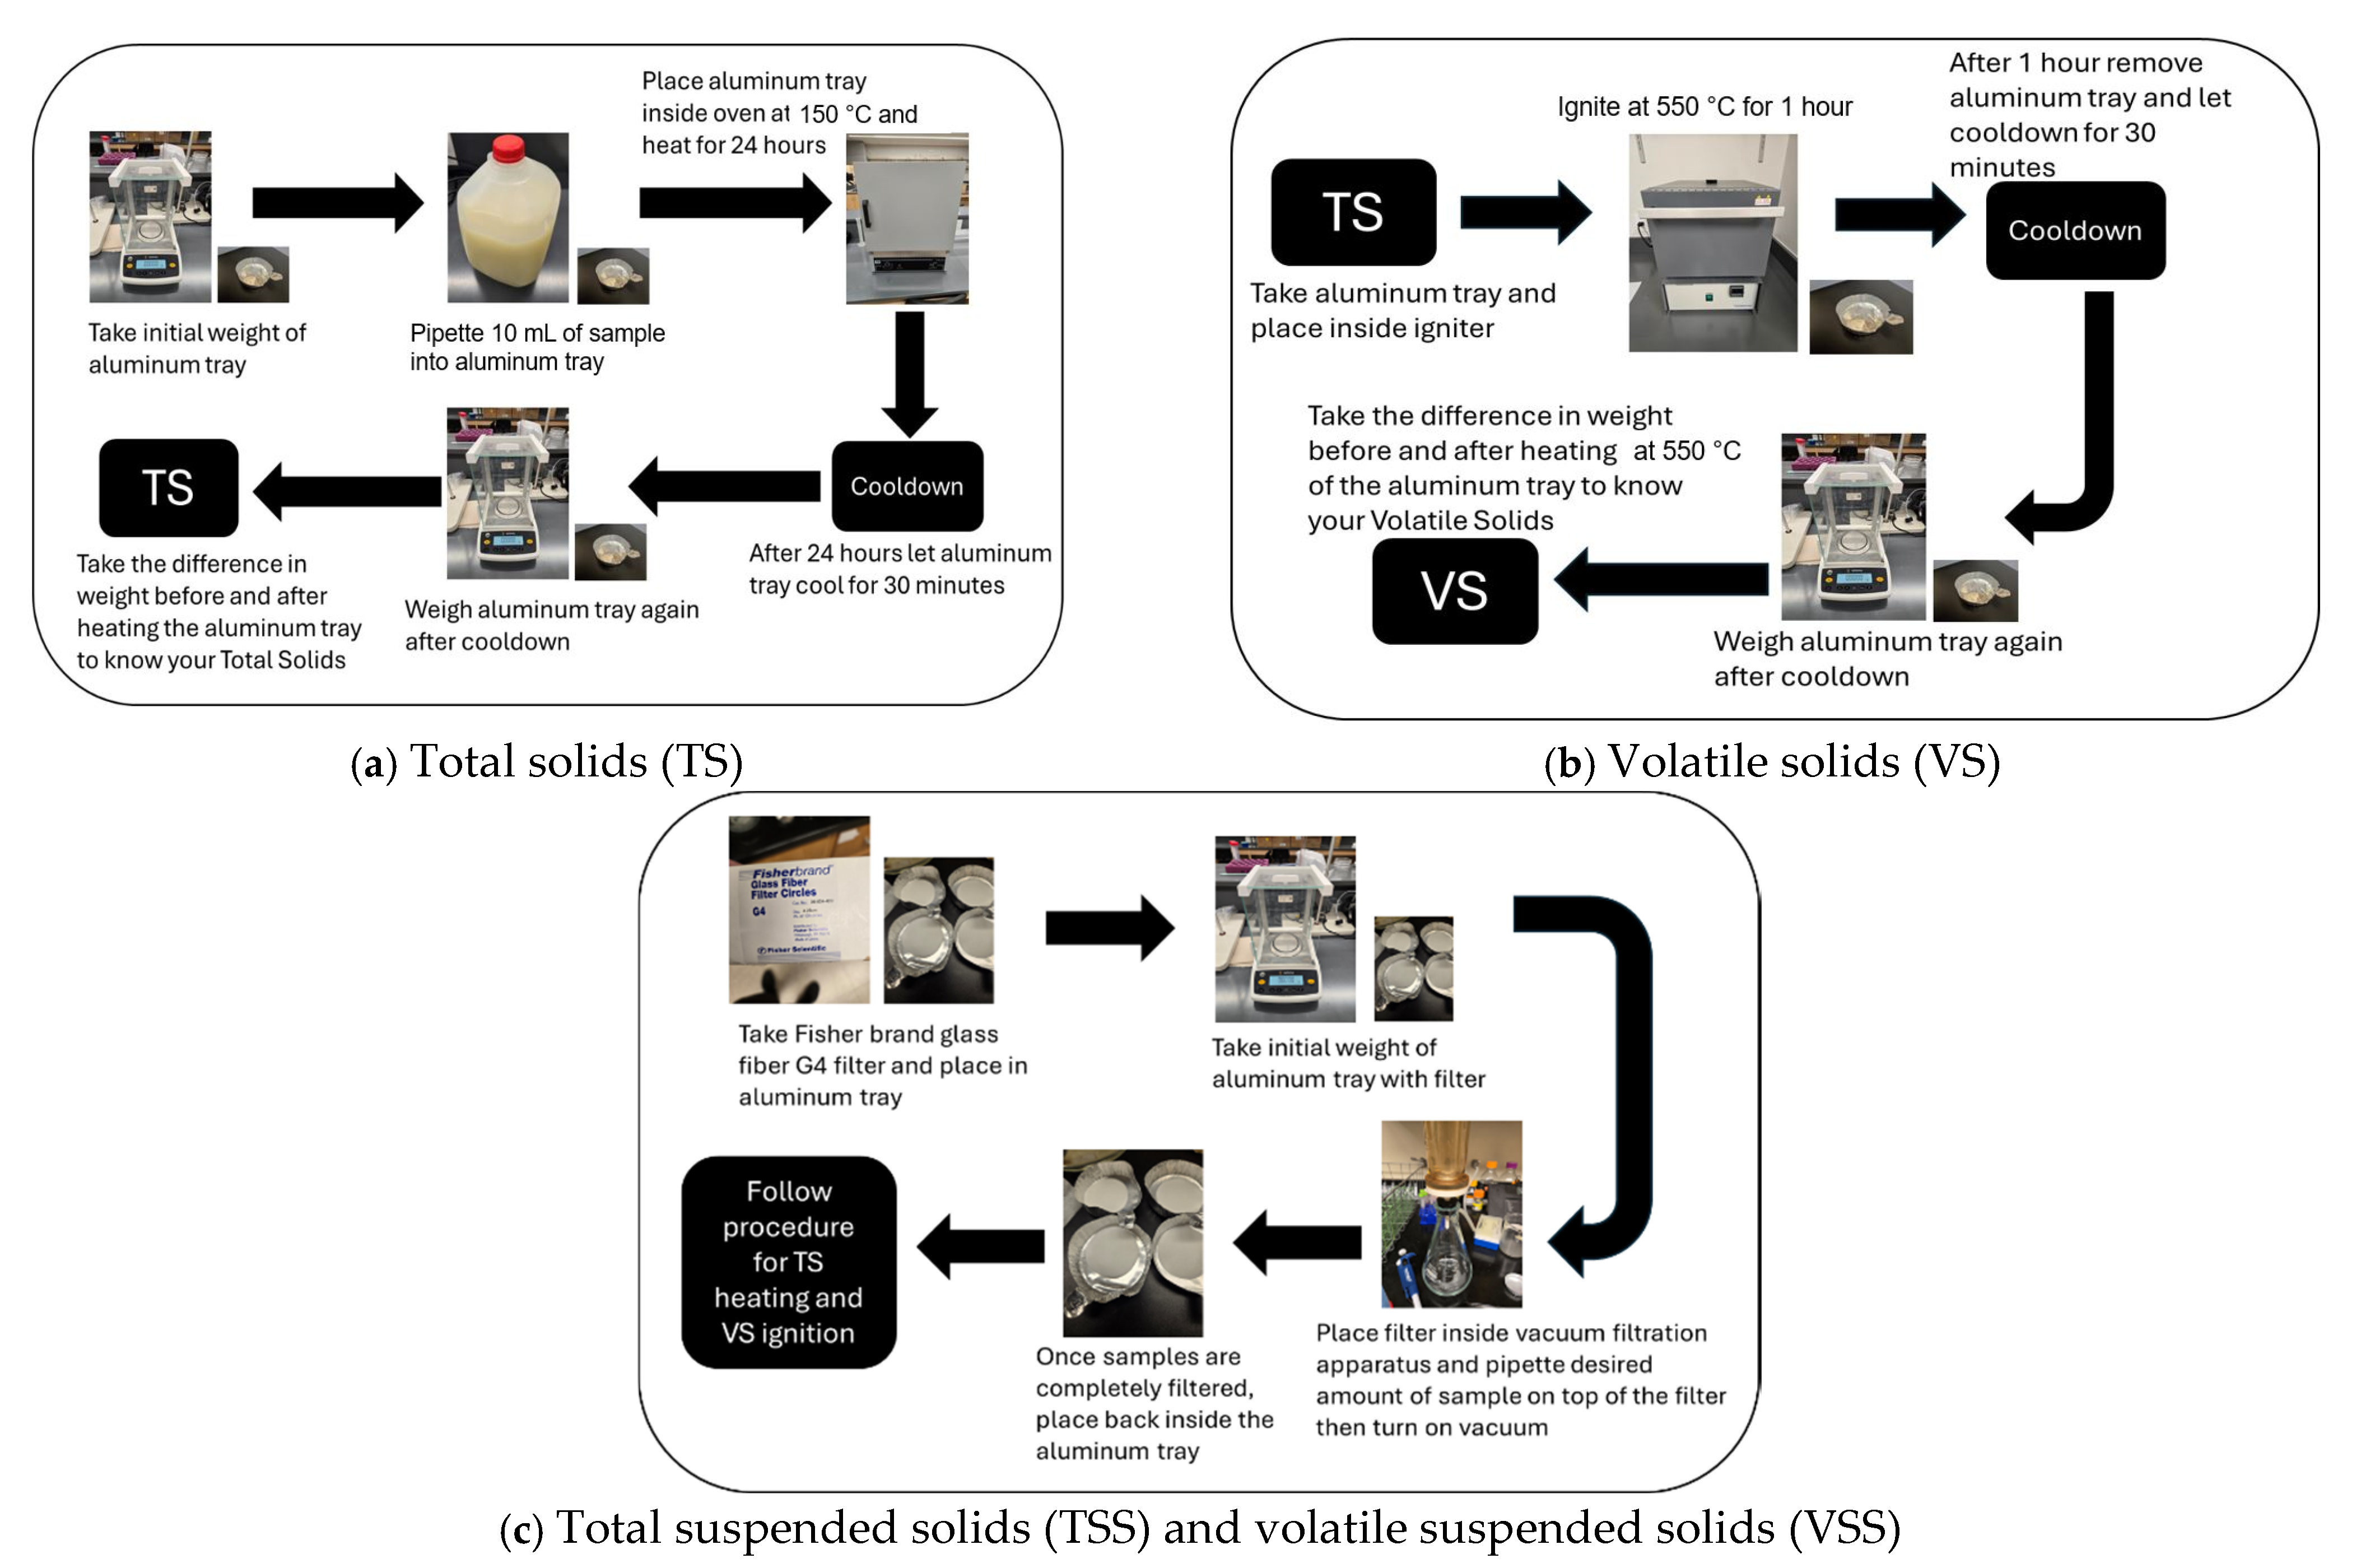
An amount of 10 mL of raw cheese whey (CW) and the chosen inoculum was weighed out and placed into an oven and dried at 105 °C for 24 h to remove all water or until a constant weight had been reached. The dried samples were then placed into a furnace at the Texas A&M AgriLife center at 550 °C for 1–2 h; then, the sample weights were compared to determine the TS and VS. For TSS and VSS, samples are filtered using a Choice 25 mm, 0.45 μm PVDF Hydrophilic filter purchased from Thermo Fisher Scientific 168 Third Avenue Waltham, MA USA 02451 before the drying process was applied. Three different dilution levels were applied to reduce the concentration of cheese whey by adding deionized water. This dilution process was used in biological systems to control substrate concentration, microbial load, and nutrient levels, which are critical for the production of VFAs and gas. In anaerobic digestion or dark fermentation, dilution also helped optimize HRT and OLR.

2.3. Batch Experimental Design for Dark Fermentation Processes: DF 1 and DF 2

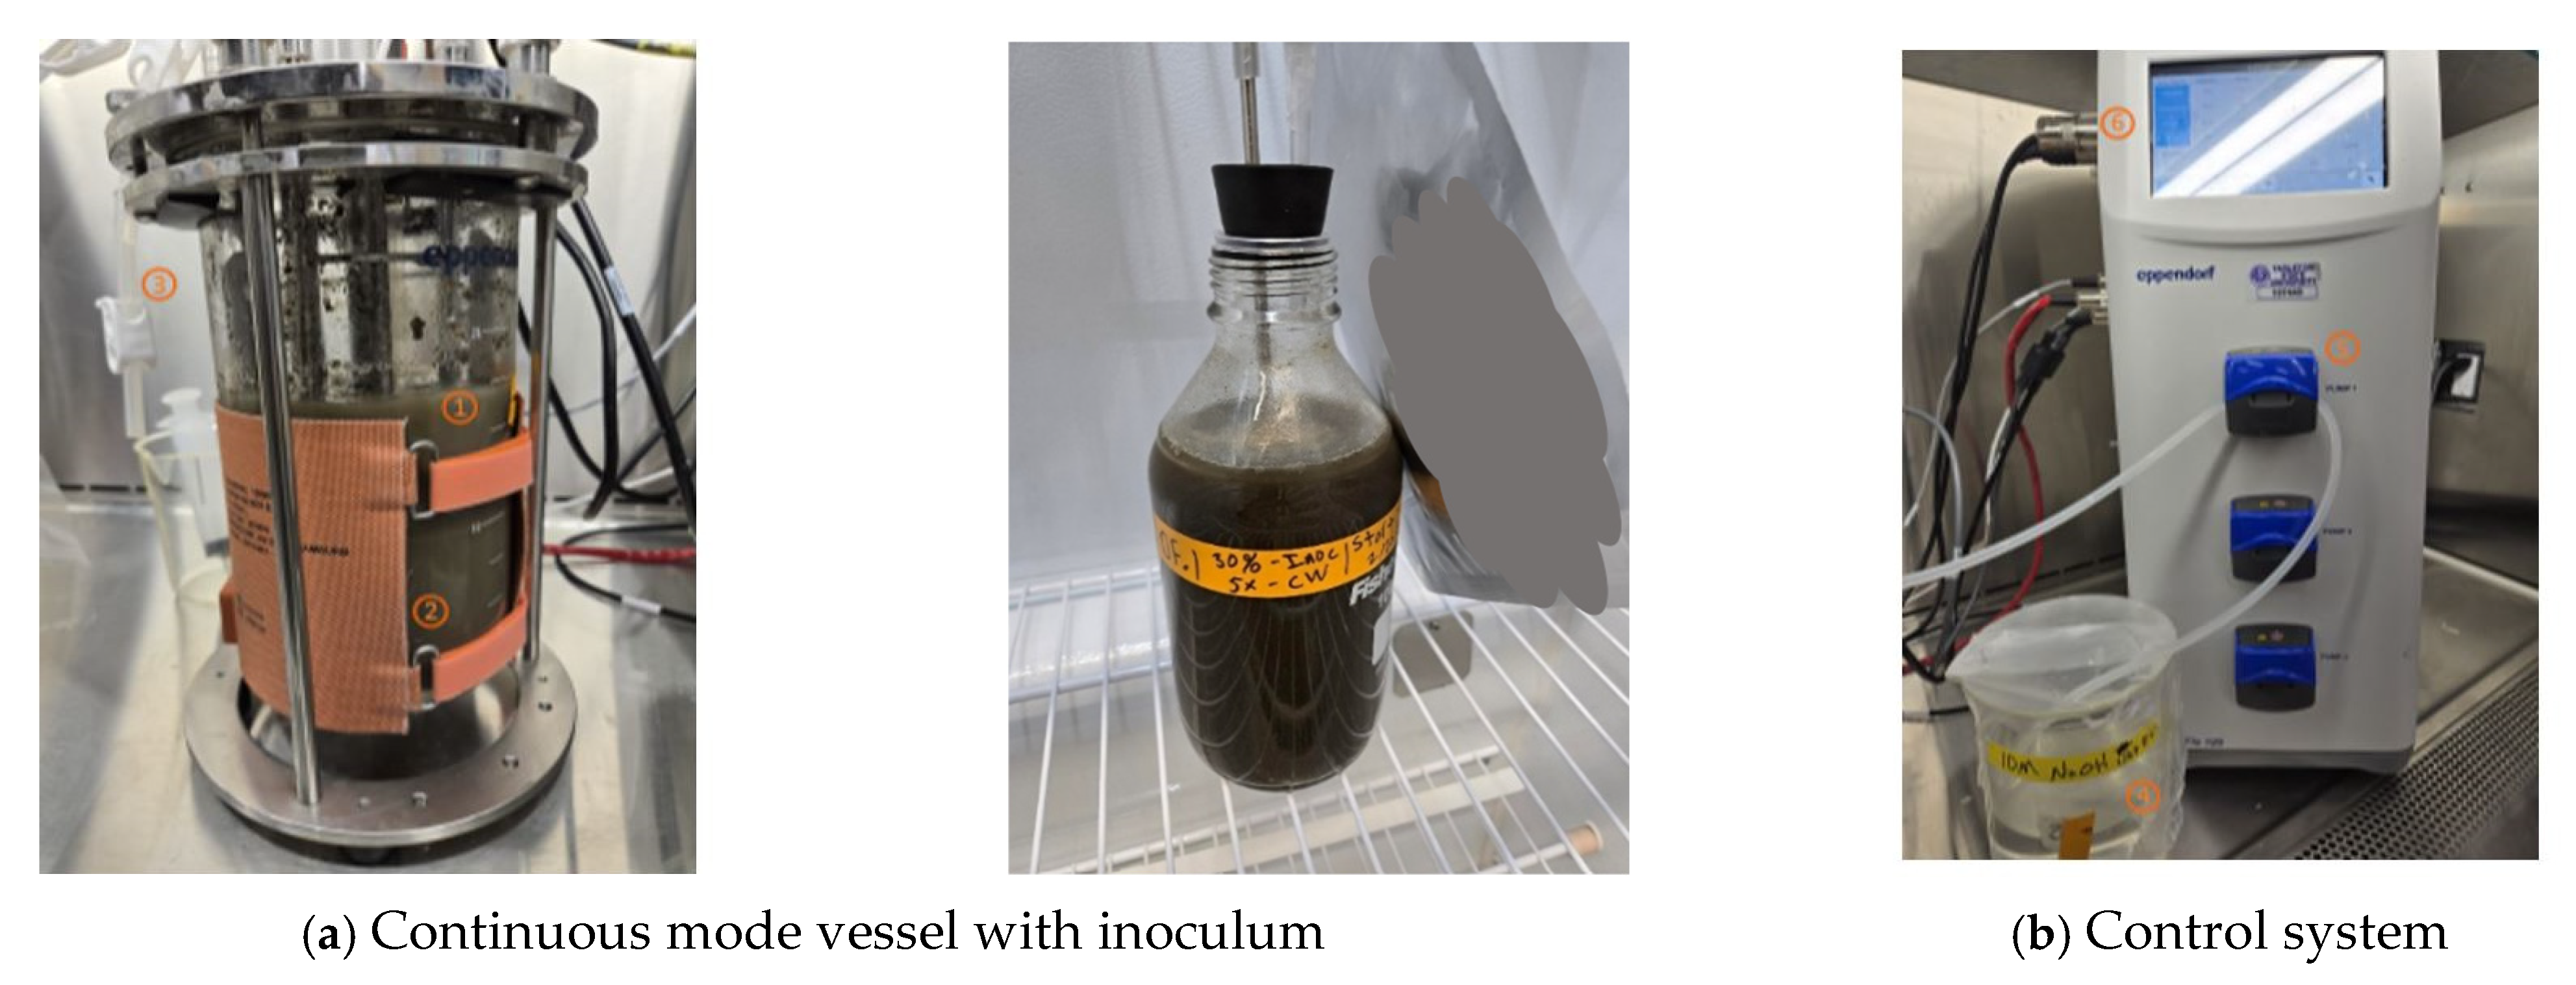
The BioFlo 120 eppendorf bioreactor Eppendorf North America 175 Freshwater Blvd Enfield, CT 06082 was used in continuous vessel mode for the dark fermentation process. This bioreactor is a versatile and user-friendly system designed to support bioprocess research and development. It is compatible with both autoclavable glass vessels and single-use vessels, providing flexibility in experimental setups. With scalability ranging from 250 mL to 40 L, it is suitable for various stages of process development. Figure 3 depicts the continuous mode vessel setup with integrated control systems for regulating pH, temperature, and agitation speed.
The total volume of the vessel is 3 L and provides the working volume for trials to be 1.5 L. Ultra-high purity (UHP) nitrogen is selected to act as the gas purge and supplied to the system for 15 min at the beginning of each trial. Continuous DF trials were denoted as DF1 and DF2. Pump 1 is chosen to supply the NaOH. Factory heating blanket for the BioFlo 120 is used as the heat source. To analyze hydrogen production, testing for VFAs, carbonate, COD, and HRT is essential for optimizing MECs. These factors impact bacterial activity in the metabolic processes that generate hydrogen. The results from these tests help adjust bioreactor and MEC operating conditions, improving hydrogen production and enabling the development of efficient, sustainable biofuel production processes. For analyzing VFAs, high-performance liquid chromatography (HPLC) was used to separate, identify, and quantify compounds in a mixture based on their interactions with a stationary phase and a mobile phase. It relies on detectors like UV–Vis, fluorescence, or refractive index for analysis. HPLC provides high resolution and sensitivity for separation of complex mixtures and allows fast separation times for analysis and efficiency. HPLC does not require the sample to be vaporized, making it ideal for thermally unstable compounds. Carbohydrates C x ( H 2 O y ) are necessary in fermentation as they serve as the primary energy source for microorganisms involved in the process [3]. In biogas production, carburates in substrates are fermented by bacteria, which produce volatile fatty acids and other intermediates. Samples are tested for total carbohydrates in the range of 0–200 mg/L. Reagent A: phenol (5% w/v); reagent B: concentrated sulfuric acid (>95%); glucose standard solution: 200 mg glucose/L (0.2 g glucose/L). A total of 1 mL of the diluted sample is transferred to a test tube. Then, 1 mL of reagent A and 5 mL reagent B are added to sample test tubes. Test tubes are tightly sealed and vortexed for 1 min then set out to cool to room temperature for 30 min. The absorbance is measured at 470 nm using a spectrophotometer and zeroed with DI water. A standard curve was drawn using glucose ( C 6 H 12 O 6 ) to calculate the total sugar content of the sample by relating the measured absorbance by the sample. Table 2 provides the preparation of carbohydrate standards at varying concentrations for spectrophotometric calibration, using specific volumes of distilled water, standard solution, reagent A, and reagent B for each concentration level.
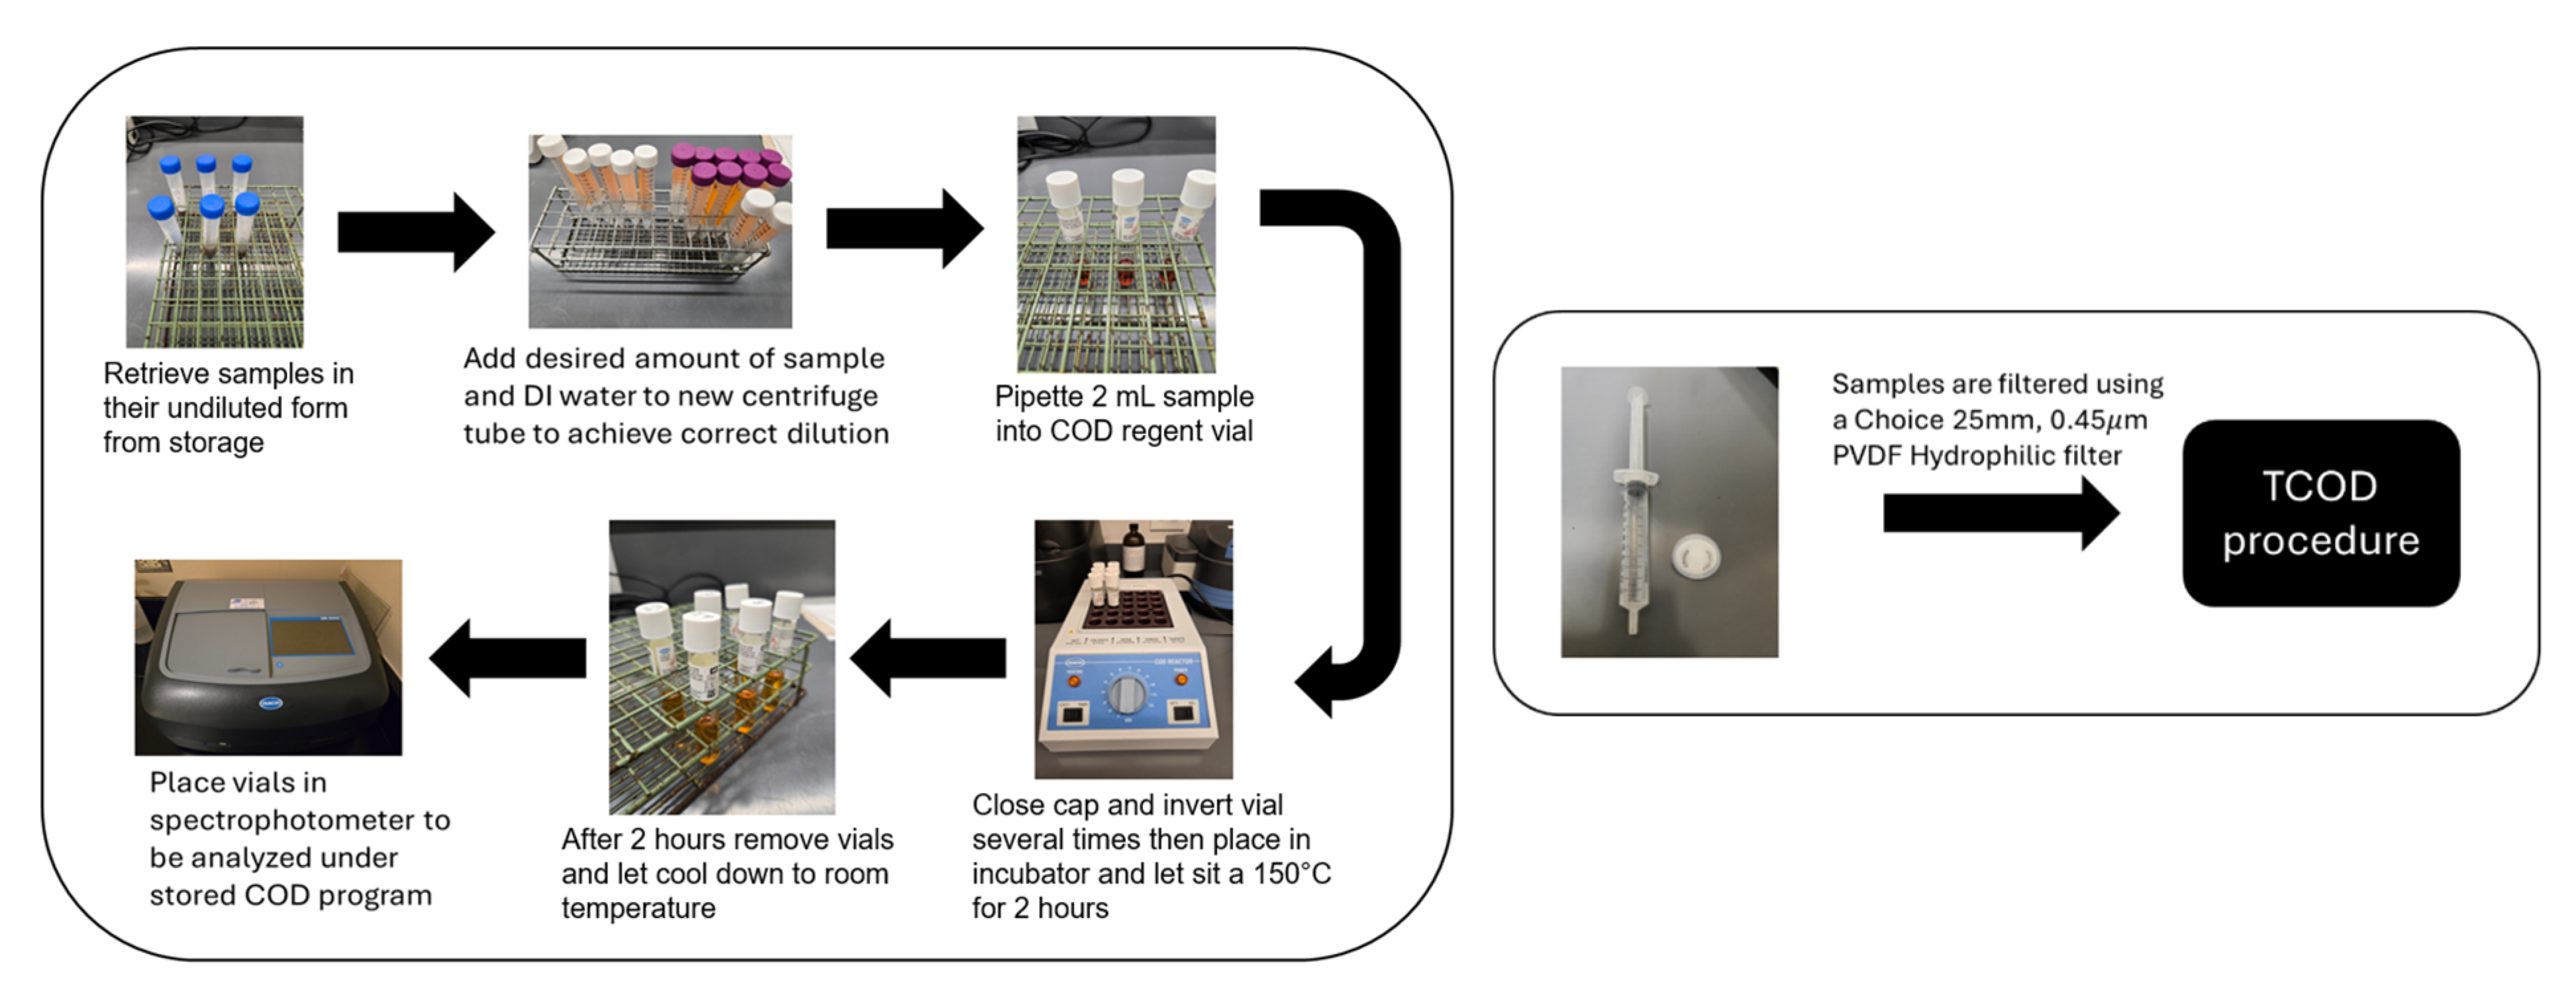
Chemical oxygen demand (COD) plays a key role in biogas production because it provides valuable information about the amount of organic material present in the substrate, which directly influences the potential for biogas generation. Hach TNTplus COD vial test reagents are used to measure the values of COD, which provides results in the range of 20–1500 mg/L COD in bioreactor and MECs. Figure 4 explains the experimental setup and procedures used for COD analysis, including sample preparation, handling, and the steps followed to ensure accurate COD measurements.
The samples were analyzed photometrically using a spectrophotometer. A 2-mL sample was added to the COD testing vials, which were then inverted. The vials were wiped clean and placed in an incubator (Hach DRB200 Hach Company P.O. Box 389 (Loveland, Colorado 80539) where they were heated for 2 h at 150 °C. After incubation, the incubator was powered down, and the samples were allowed to cool for 20 min or until they reached 120 °C. While still warm, the samples were inverted several times, then placed in a tube rack to cool to room temperature. Finally, the samples were tested individually using the pre-programmed software in the spectrophotometer for high-range COD reagents. There are two types of COD efficiency: total COD and soluble COD. Both COD values are used to assess the overall performance of anaerobic digestions, including the hydrolysis process, which breaks down particulate COD into soluble COD. Soluble COD values are used to evaluate how quickly organic matter is degraded in dark fermentation and MECs systems to gain insights into microbial activities for optimizing biohydrogen production. The total COD values are investigated to evaluate the overall performance of the system. COD is directly related to the amount of organic material that can be converted into biogas and can estimate the potential biogas yield, which optimizes feedstock selection and control loading rates. COD measures influent and effluent COD for the efficiency of organic matter degradation. COD removal efficiency can be calculated by Equation (15).
Efficiency   ( % ) = I n f l u e n c e   C O D E f f l u e n t   C O D I n f l u e n t   C O D × 100
Equation (15) is based on the COD measured data, HRT, feeding strategies, and operational parameters, including pH, temperature, microbial activity, and VFAs, as well as hydrogen production methods, such as anaerobic digestion and dark fermentation, and systems which include bioreactors, MECs and membrane-based setups. For optimizing substrate feeding rates, organic loading rate (OLR) needs to be investigated as follows in Equation (16).
OLR = C O D   m g L × F l o w   r a t e   L d a y R e a c t o r   v o u m e   L
The results of OLR indicate underloading or overloading of substrate load for microbial activities to produce hydrogen. To improve COD efficiency, co-digestion with substrates like food waste, agricultural residues, and industrial wastes can be applied to improve nutrient balance and microbial diversity. COD values were conducted via digestion solution (Hach HR COD reagents 20–1500 mg/L) and photometrically analyzed using a spectrophotometer. A 2-mL sample was added to the COD testing vials, then inverted. The vials were then wiped down and placed into an incubator (Hach DRB200) and heated for 2 h at 150 °C. Once 2 h elapses, the incubator is then powered down and the samples are left to cool for 20 min or until reaching a temperature of 120 °C. The samples are then inverted several times while still warm, then placed in a tube rack to reach room temperature. Lastly, the samples are tested individually using the pre-programmed software within the spectrophotometer for high-range COD reagents. Samples were filtered using a Choice 25 mm, 0.45 μm PVDF Hydrophilic filter purchased from Thermo Scientific (Waltham, MA, USA).
Figure 5 shows the experimental setup and procedures for solids characterization and includes the determination of total solids (TS), volatile solids (VS), total suspended solids (TSS), and volatile suspended solids (VSS).
Analyzing and evaluating TS, VS, TSS, and VSS is important for biogas and hydrogen production from waste biomass via dark fermentation because these data analyses can provide the quality and quantity of organic material for microbial digestion, which affects the efficiency of the fermentation process. TS indicates the total amount of solid material in the sample, including both organic and inorganic matter. VS represents the portion of solids that can be biodegraded by microorganisms. TSS includes both organic and inorganic suspended solids in the liquid, which can impact the overall efficiency of the digestion process and microbial growth. Lastly, VSS refers to the biodegradable organic fraction of the suspended solids

3. Results and Discussion

The pH for optimal VFA production and biohydrogen yield is maintained between 5.5 and 6.5 using a sodium hydroxide (NaOH) buffer solution. The bioreactor operates under mesophilic conditions at a controlled temperature of 37 °C. Agitation is set at 125 rpm to ensure proper mixing and microbial activity. The HRT is fixed at 5 days to allow sufficient digestion and VFA accumulation. Biogas emissions are collected using 2-L gas collection bags purchased from OHEM, which allows for measurement and analysis of gas production. To monitor the process, liquid samples are drawn every other day using a 50-mL syringe and then refrigerated to preserve their composition for later analysis. Two different inoculum-to-substrate ratios (I2SR) are used to evaluate their effect on process efficiency: DF1 uses an I2SR of 20:80, while DF2 uses an I2SR of 30:70. These parameters support consistent monitoring and optimization of hydrogen production.

3.1. Carbohydrates, TCOD, and SCOD

The experimental results for the 1× and 5× cheese whey as substrate provides insights into microbial process optimization. In the 1× cheese whey medium, the TCOD is 87.5 g/L, SCOD is 78.5 g/L, and carbohydrates are 78.4 g/L, indicating that nearly all the organic content is soluble and composed of carbohydrates like lactose, which are highly available for microbial metabolism. The SCOD closely matches the TCOD, suggesting that most of the organic material is readily available for microbial consumption. In contrast, the 5× cheese whey medium shows a SCOD of 14.746 g/L, with carbohydrates not listed but presumed lower. The lower SCOD indicates that a smaller proportion of the organic material is dissolved and available for microbial consumption, possibly due to a reduced concentration of sugars or an increase in insoluble organic matter. Carbohydrates are a crucial component of the medium and provide the primary energy source for microbial growth and fermentation, which drives biogas and biofuel production. While high carbohydrate content enhances microbial activity and fermentation efficiency, it is important to recognize that other factors such as temperature, pH, and microbial diversity also play vital roles in determining overall fermentation performance. TCOD provides a measure of total organic material, while SCOD indicates the portion that is readily accessible for microbial consumption. A higher SCOD-to-TCOD ratio suggests better biodegradability and greater availability of soluble organic material for microbial processes. From an experimental perspective, the 1× cheese whey medium contains a high proportion of soluble organic material, ideal for microbial processes. However, the 5× concentration’s reduction in SCOD may hinder microbial fermentation, potentially lowering biogas or biofuel production due to decreased availability of soluble substrates. Understanding these parameters allows for better optimization of bioreactor operations, including feeding strategies, microbial inoculation, and system conditions, to suit the feedstock characteristics. Table 3 shows the properties of diluted cheese whey medium, including total COD, soluble COD, and carbohydrate concentrations for 1× and 5× dilution levels used in fermentation experiments.
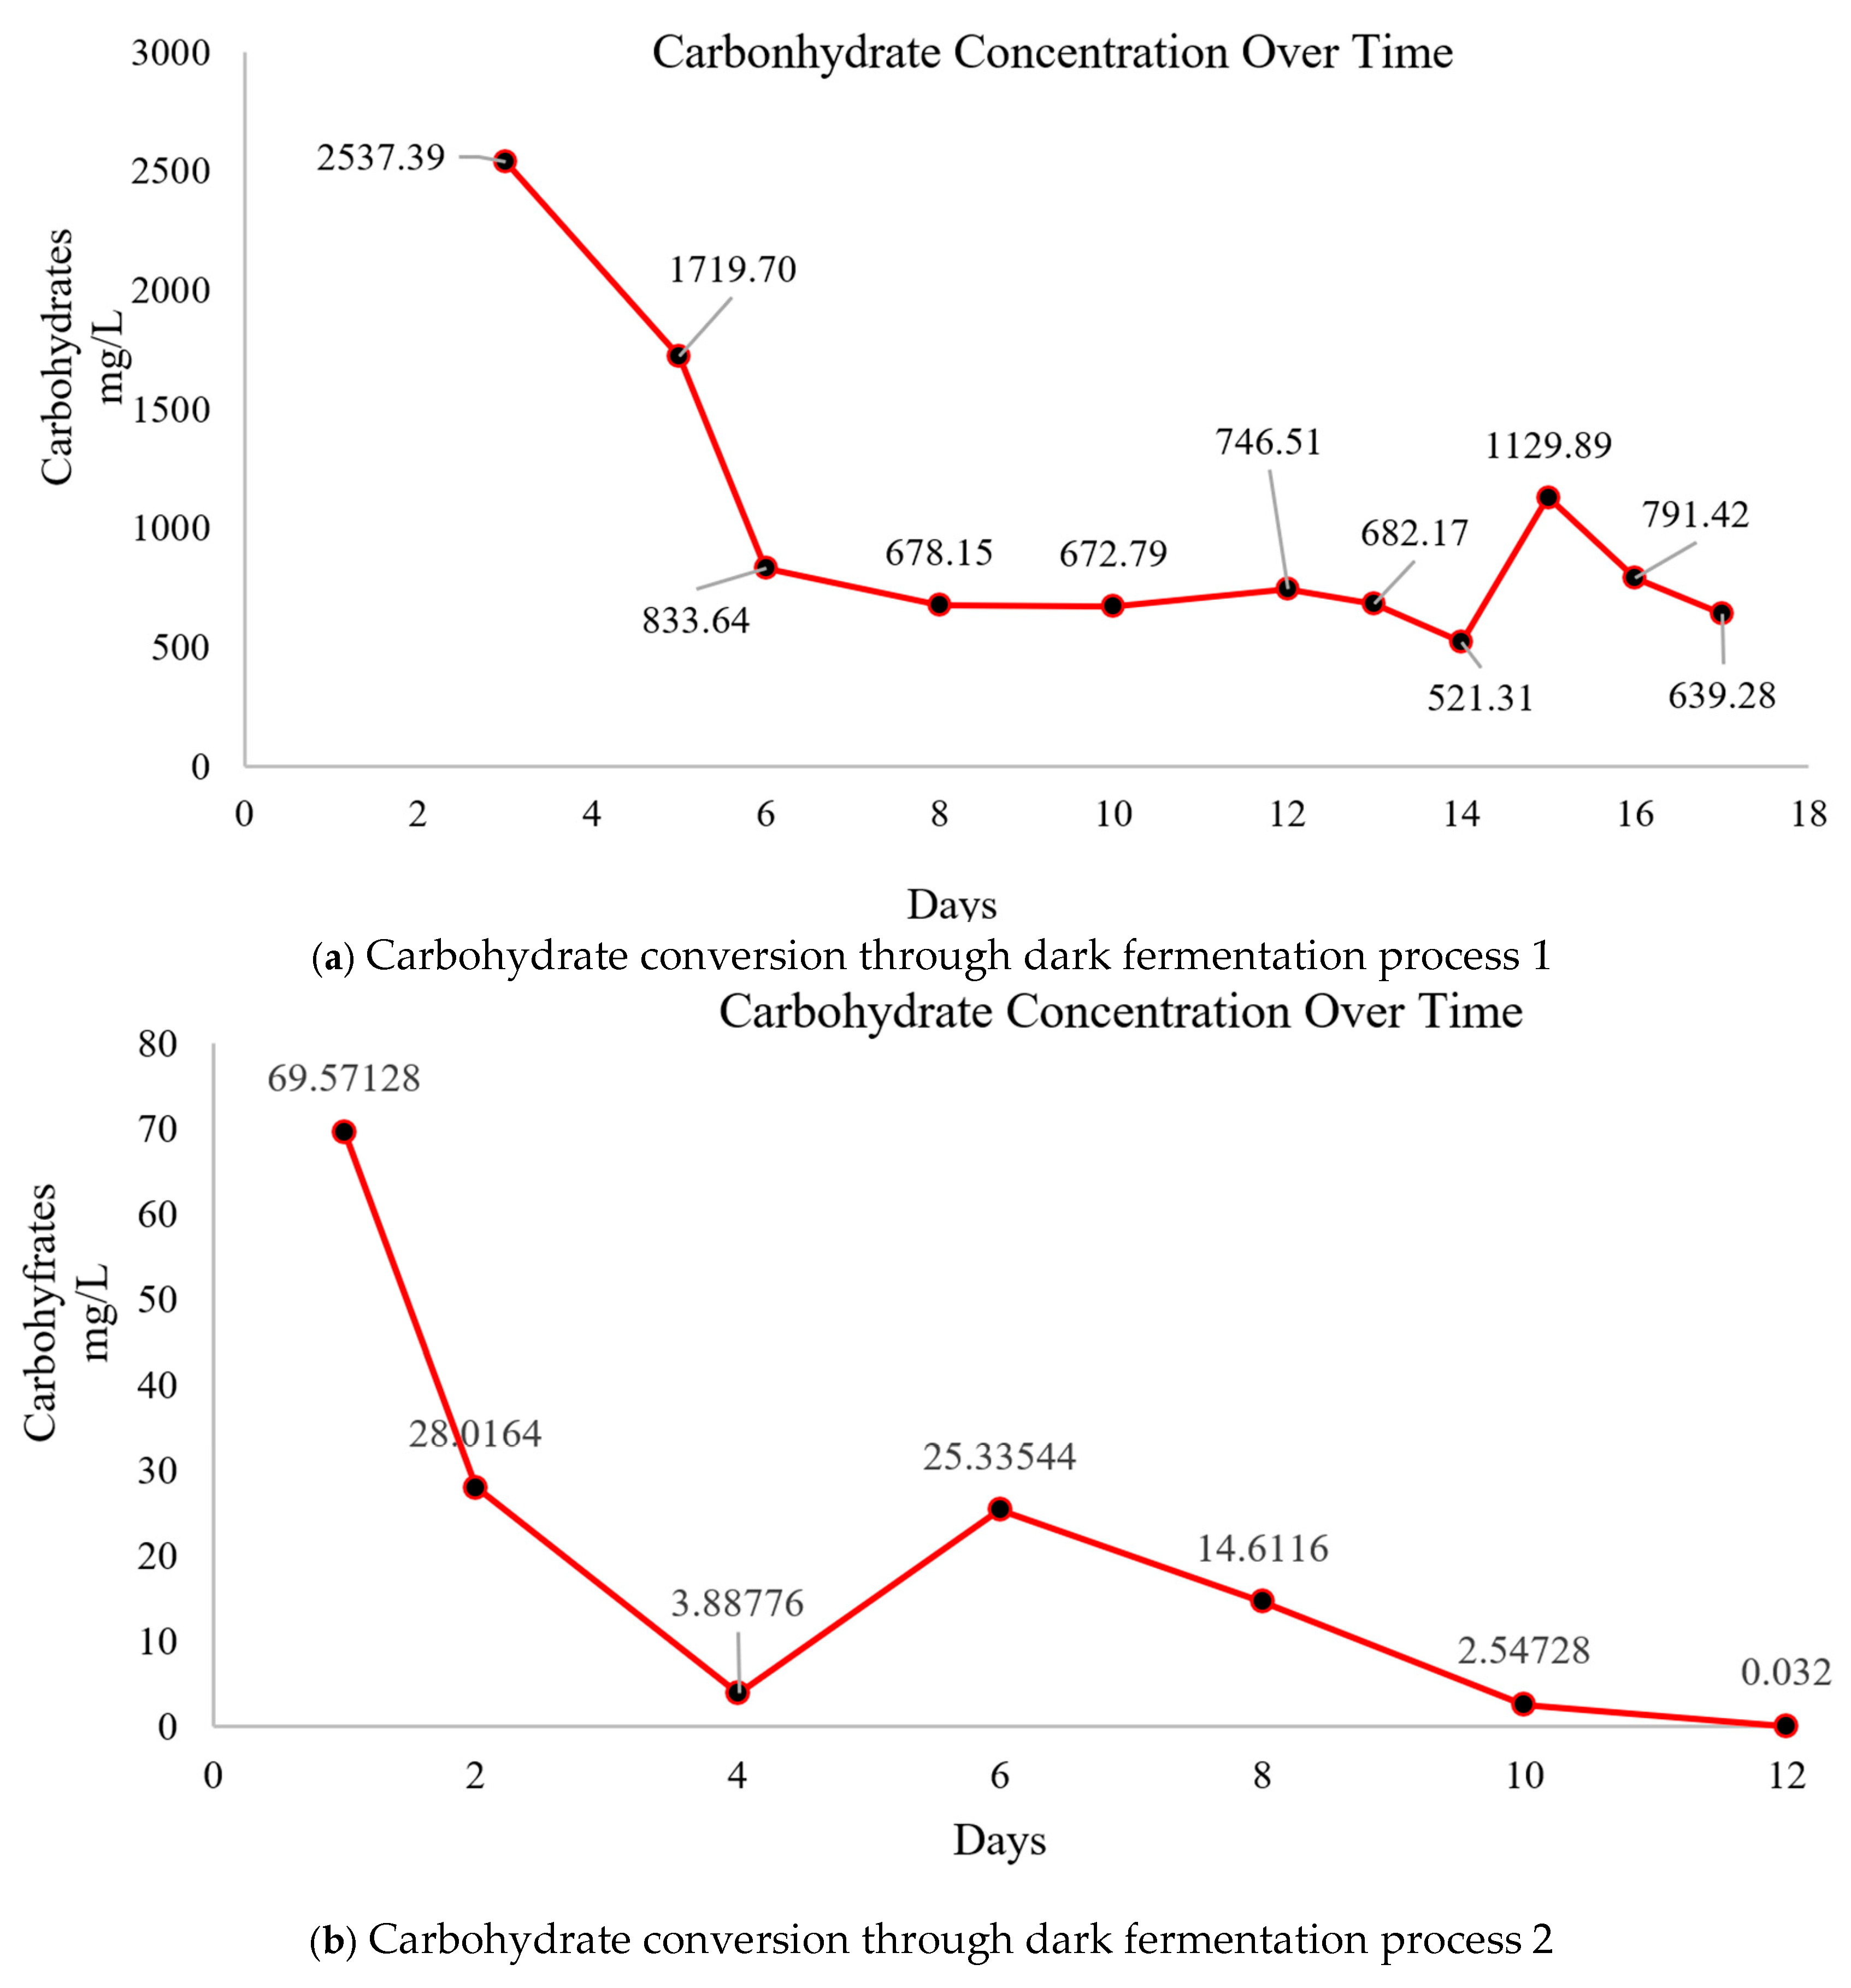
DF1 carbohydrate concentration decreased leading up to day 10. On days 11 and 12 there was a slight increase and then it began decreasing until day 14. A spike in concentration happened on day 15, then decreased again for days 16 and 17. Figure 6 shows the carbohydrate conversion process. Comparison of carbohydrate levels over time in dark fermentation stages 1 and 2 emphasizes variations in substrate consumption and microbial metabolic activity.
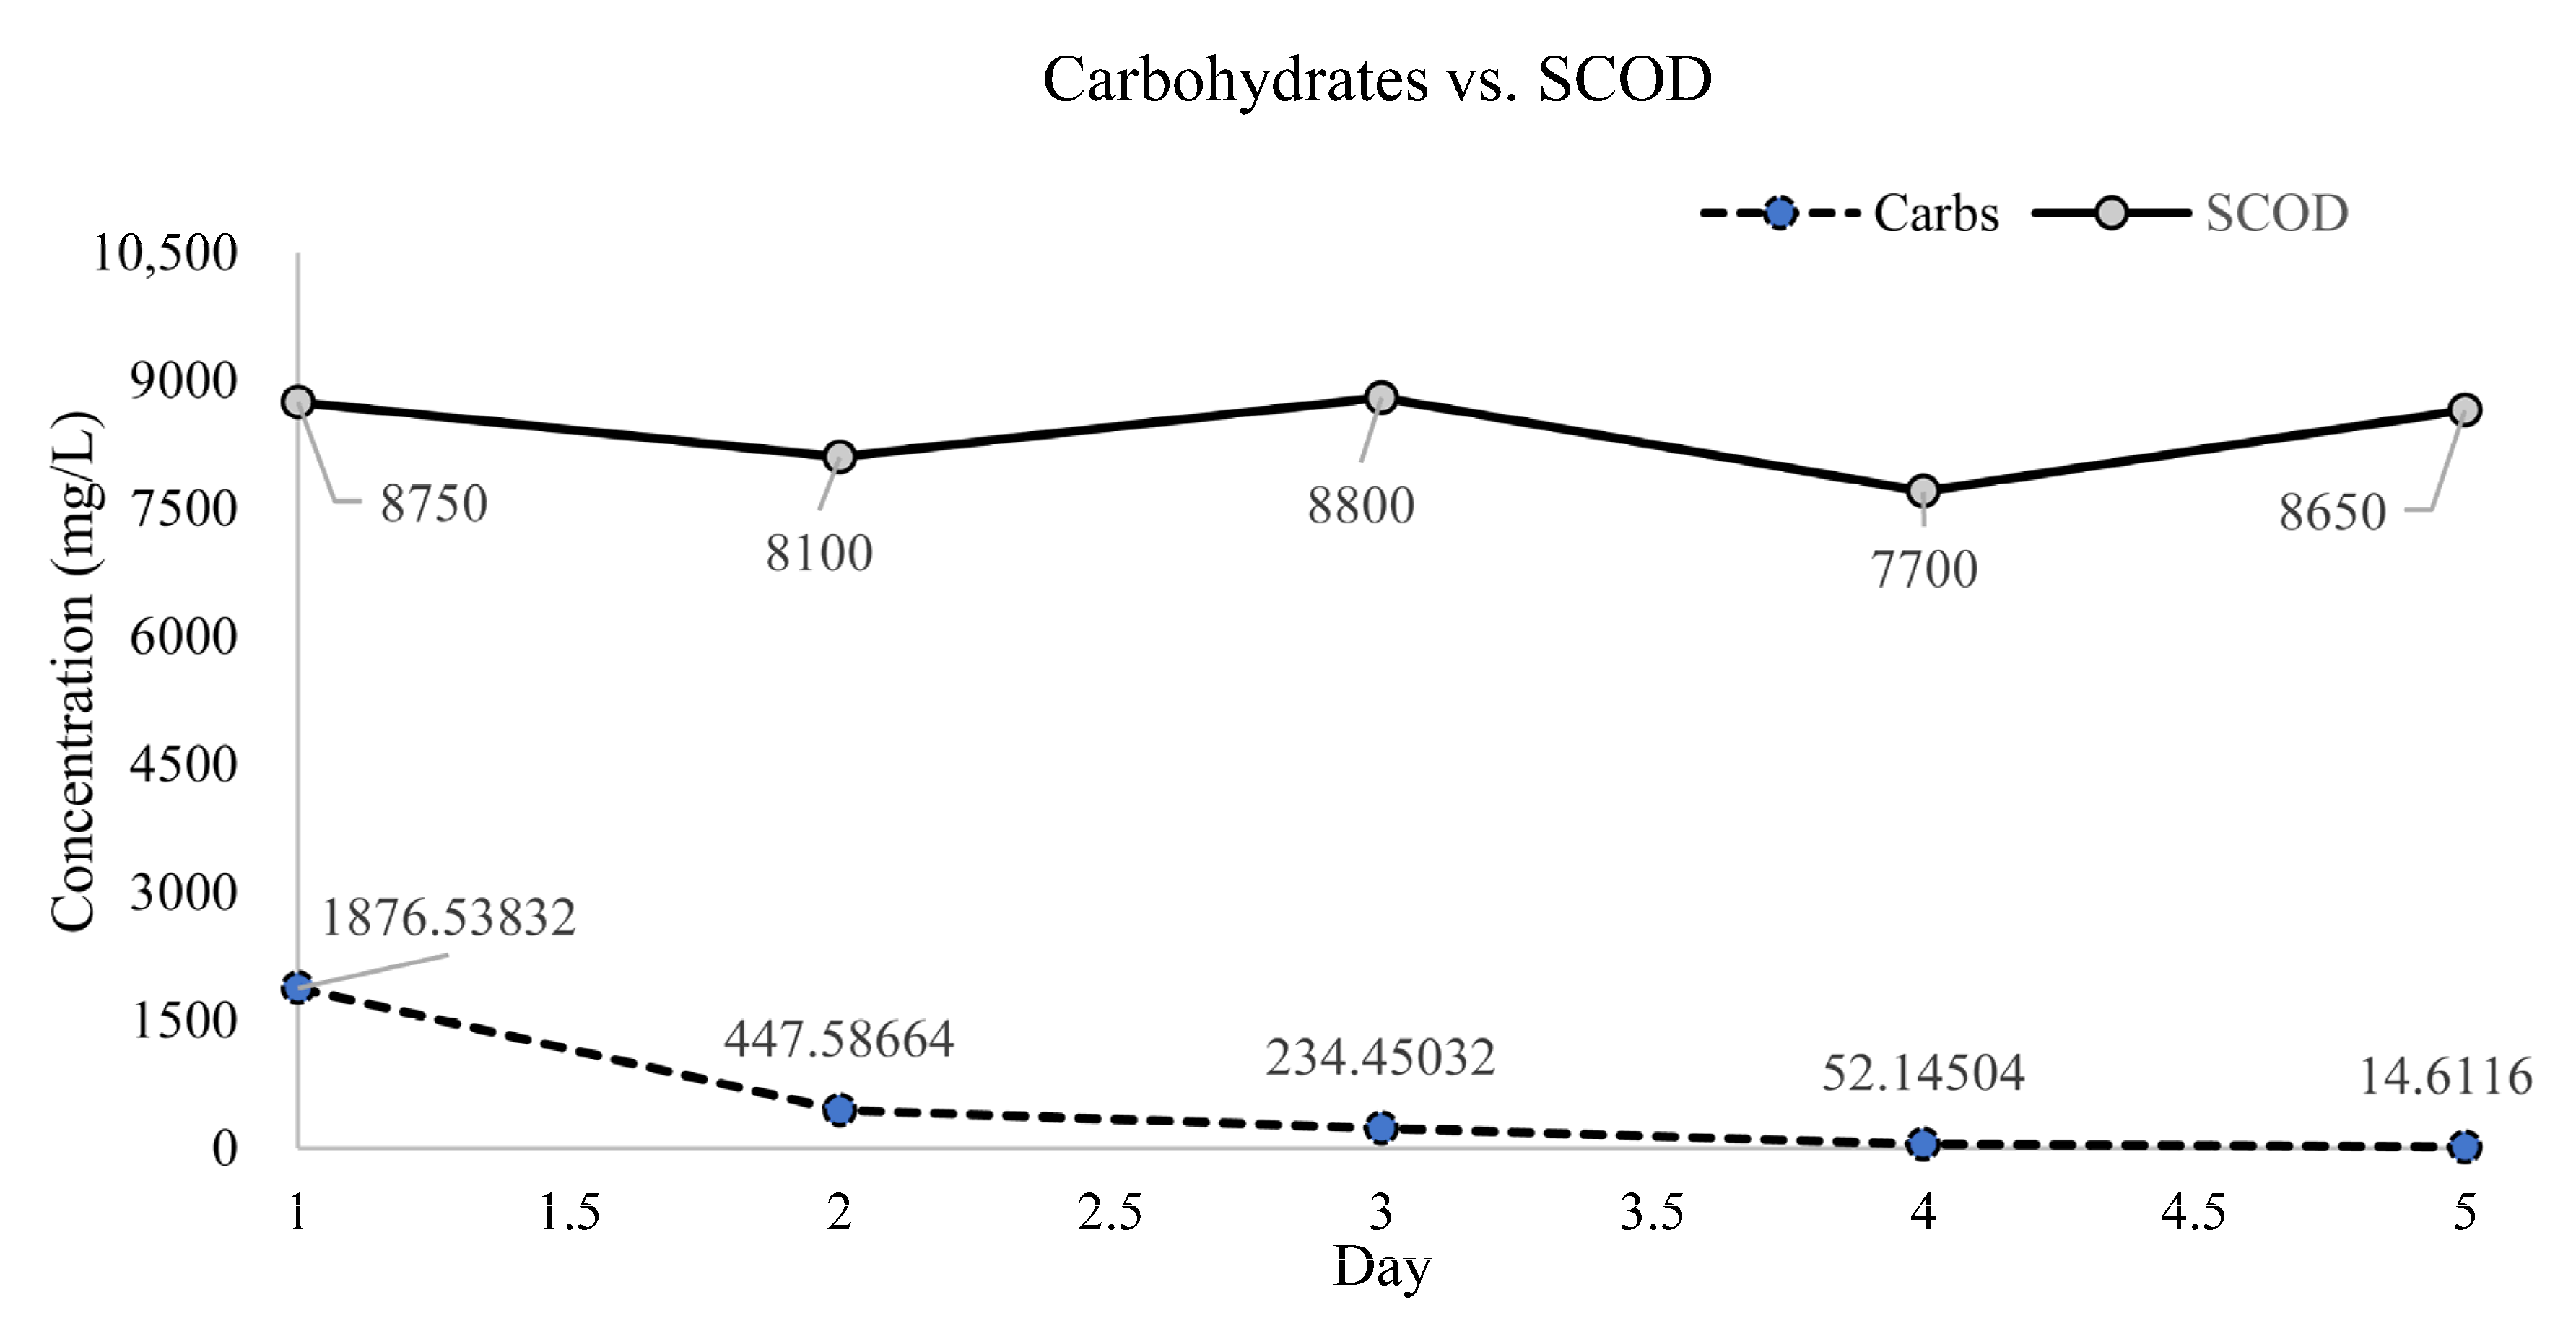
Figure 7 shows comparative analysis of dark fermentation performance using carbohydrates and soluble chemical oxygen demand (SCOD) as primary substrates for evaluating microbial activity and biohydrogen production efficiency. DF1.1 I2SR was 30:70 using the 5× diluted CW. pH is uncontrolled and agitated three times a day along with using a temperature of 37 °C.
During dark fermentation, the measured data were observed in the comparative profiles of carbohydrates and soluble chemical oxygen demand (SCOD) over the five-day period. Carbohydrate concentrations declined sharply from 1876.54 mg/L on day 1 to 447.59 mg/L on day 2, which indicated rapid microbial consumption of sugars in the early stage of fermentation. By day 3, carbohydrate levels further decreased to 234.45 mg/L, while SCOD increased to 8800 mg/L. These carbohydrate changes supported active production and accumulation of soluble intermediates such as volatile fatty acids (VFAs). On day 4, carbohydrates were nearly depleted at 52.15 mg/L, accompanied by a reduction in SCOD to 7700 mg/L, which indicates partial conversion of VFAs and other soluble organics into gaseous products, such as hydrogen and carbon dioxide. By day 5, carbohydrate concentrations reached near exhaustion at 14.61 mg/L, while SCOD increased again to 8650 mg/L, possibly due to secondary solubilization of organic matter or incomplete VFA conversion. Thus, these results examined a rapid initial substrate utilization phase and provided dynamic fluctuations in SCOD that reflect the balance between organic matter degradation and metabolite accumulation, a characteristic feature of dark fermentation processes.

3.2. Total Solids (TS), Volatile Solids (VS), Total Suspended Solids (TSS), and Volatile Suspended Solids (VSS)

The analysis of total solids (TS), volatile solids (VS), total suspended solids (TSS), and volatile suspended solids (VSS) provides insights into the composition of the samples. The CW (1×) sample has the highest TS concentration at 0.6135 g/mL, indicating a substantial presence of dissolved and suspended solids. In contrast, the CW (5×) sample exhibits a significant reduction in TS (0.1080 g/mL), suggesting dilution. The inoculum has a TS concentration of 0.5538 g/mL, which is slightly lower than that of CW (1×). Regarding volatile solids (VS), the VS content of CW (1×) (0.0551 g/mL) is considerably lower than its TS, indicating that most solids are non-volatile (fixed solids). The inoculum has a higher VS concentration (0.2891 g/mL) compared to CW (1×), suggesting a greater proportion of biodegradable organic matter. Although CW (5×) lacks VS data, it is expected to have a lower VS content due to the dilution effect. Table 4 describes the measured values of TS, VS, TSS, and VSS across different cheese whey dilutions and the inoculum sample.
The analyzed data provided the effects of dilution on the solid characteristics of cheese whey (CW) compared to the inoculum and demonstrated trends in total solids (TS), volatile solids (VS), total suspended solids (TSS), and volatile suspended solids (VSS). At 1× dilution, cheese whey showed a high total solids (TS) concentration of 0.6135 g/mL, primarily composed of dissolved solids, while the relatively low volatile solids (VS) fraction of 0.0551 g/mL indicated that a substantial portion of the solids was inorganic or non-biodegradable. The total solids (TS), volatile solids (VS), total suspended solids (TSS), and volatile suspended solids (VSS) of concentrated whey (CW) were measured at different dilutions (1×, 5×, and 10×). For the undiluted sample (1×), TS was 613.5 g/L, of which 551.0 g/L (~90%) was organic (VS). The suspended fraction was small, with TSS at 7.41 g/L and VSS comprising nearly all of it (7.31 g/L, 98.7%). Upon dilution, both TS and VS decreased proportionally: at 5× dilution, TS was 108.0 g/L and VS was 88.9 g/L, while TSS and VSS were 1.48 g/L and 1.46 g/L, respectively. At 10× dilution, TS and VS further decreased to 54.0 g/L and 45.3 g/L, with TSS and VSS at 0.16 g/L and 0.15 g/L. The VS fraction of TS remained high across all dilutions (83–90%), and the VSS fraction of TSS was consistently above 93%, indicating that the solids were predominantly organic and biodegradable. The inoculum contained high TS (0.5538 g/mL) and VS (0.2891 g/mL), with most solids in dissolved form and provided both biodegradable organic matter and microbial biomass to support fermentation. Thus, these results provided an insight that excessive solids in raw whey may inhibit microbial activity, whereas optimal dilution, particularly at 5×, balances substrate availability and inhibition, creating more favorable conditions for dark fermentation.

3.3. Influence of Volatile Fatty Acids on Biogas and Hydrogen Production

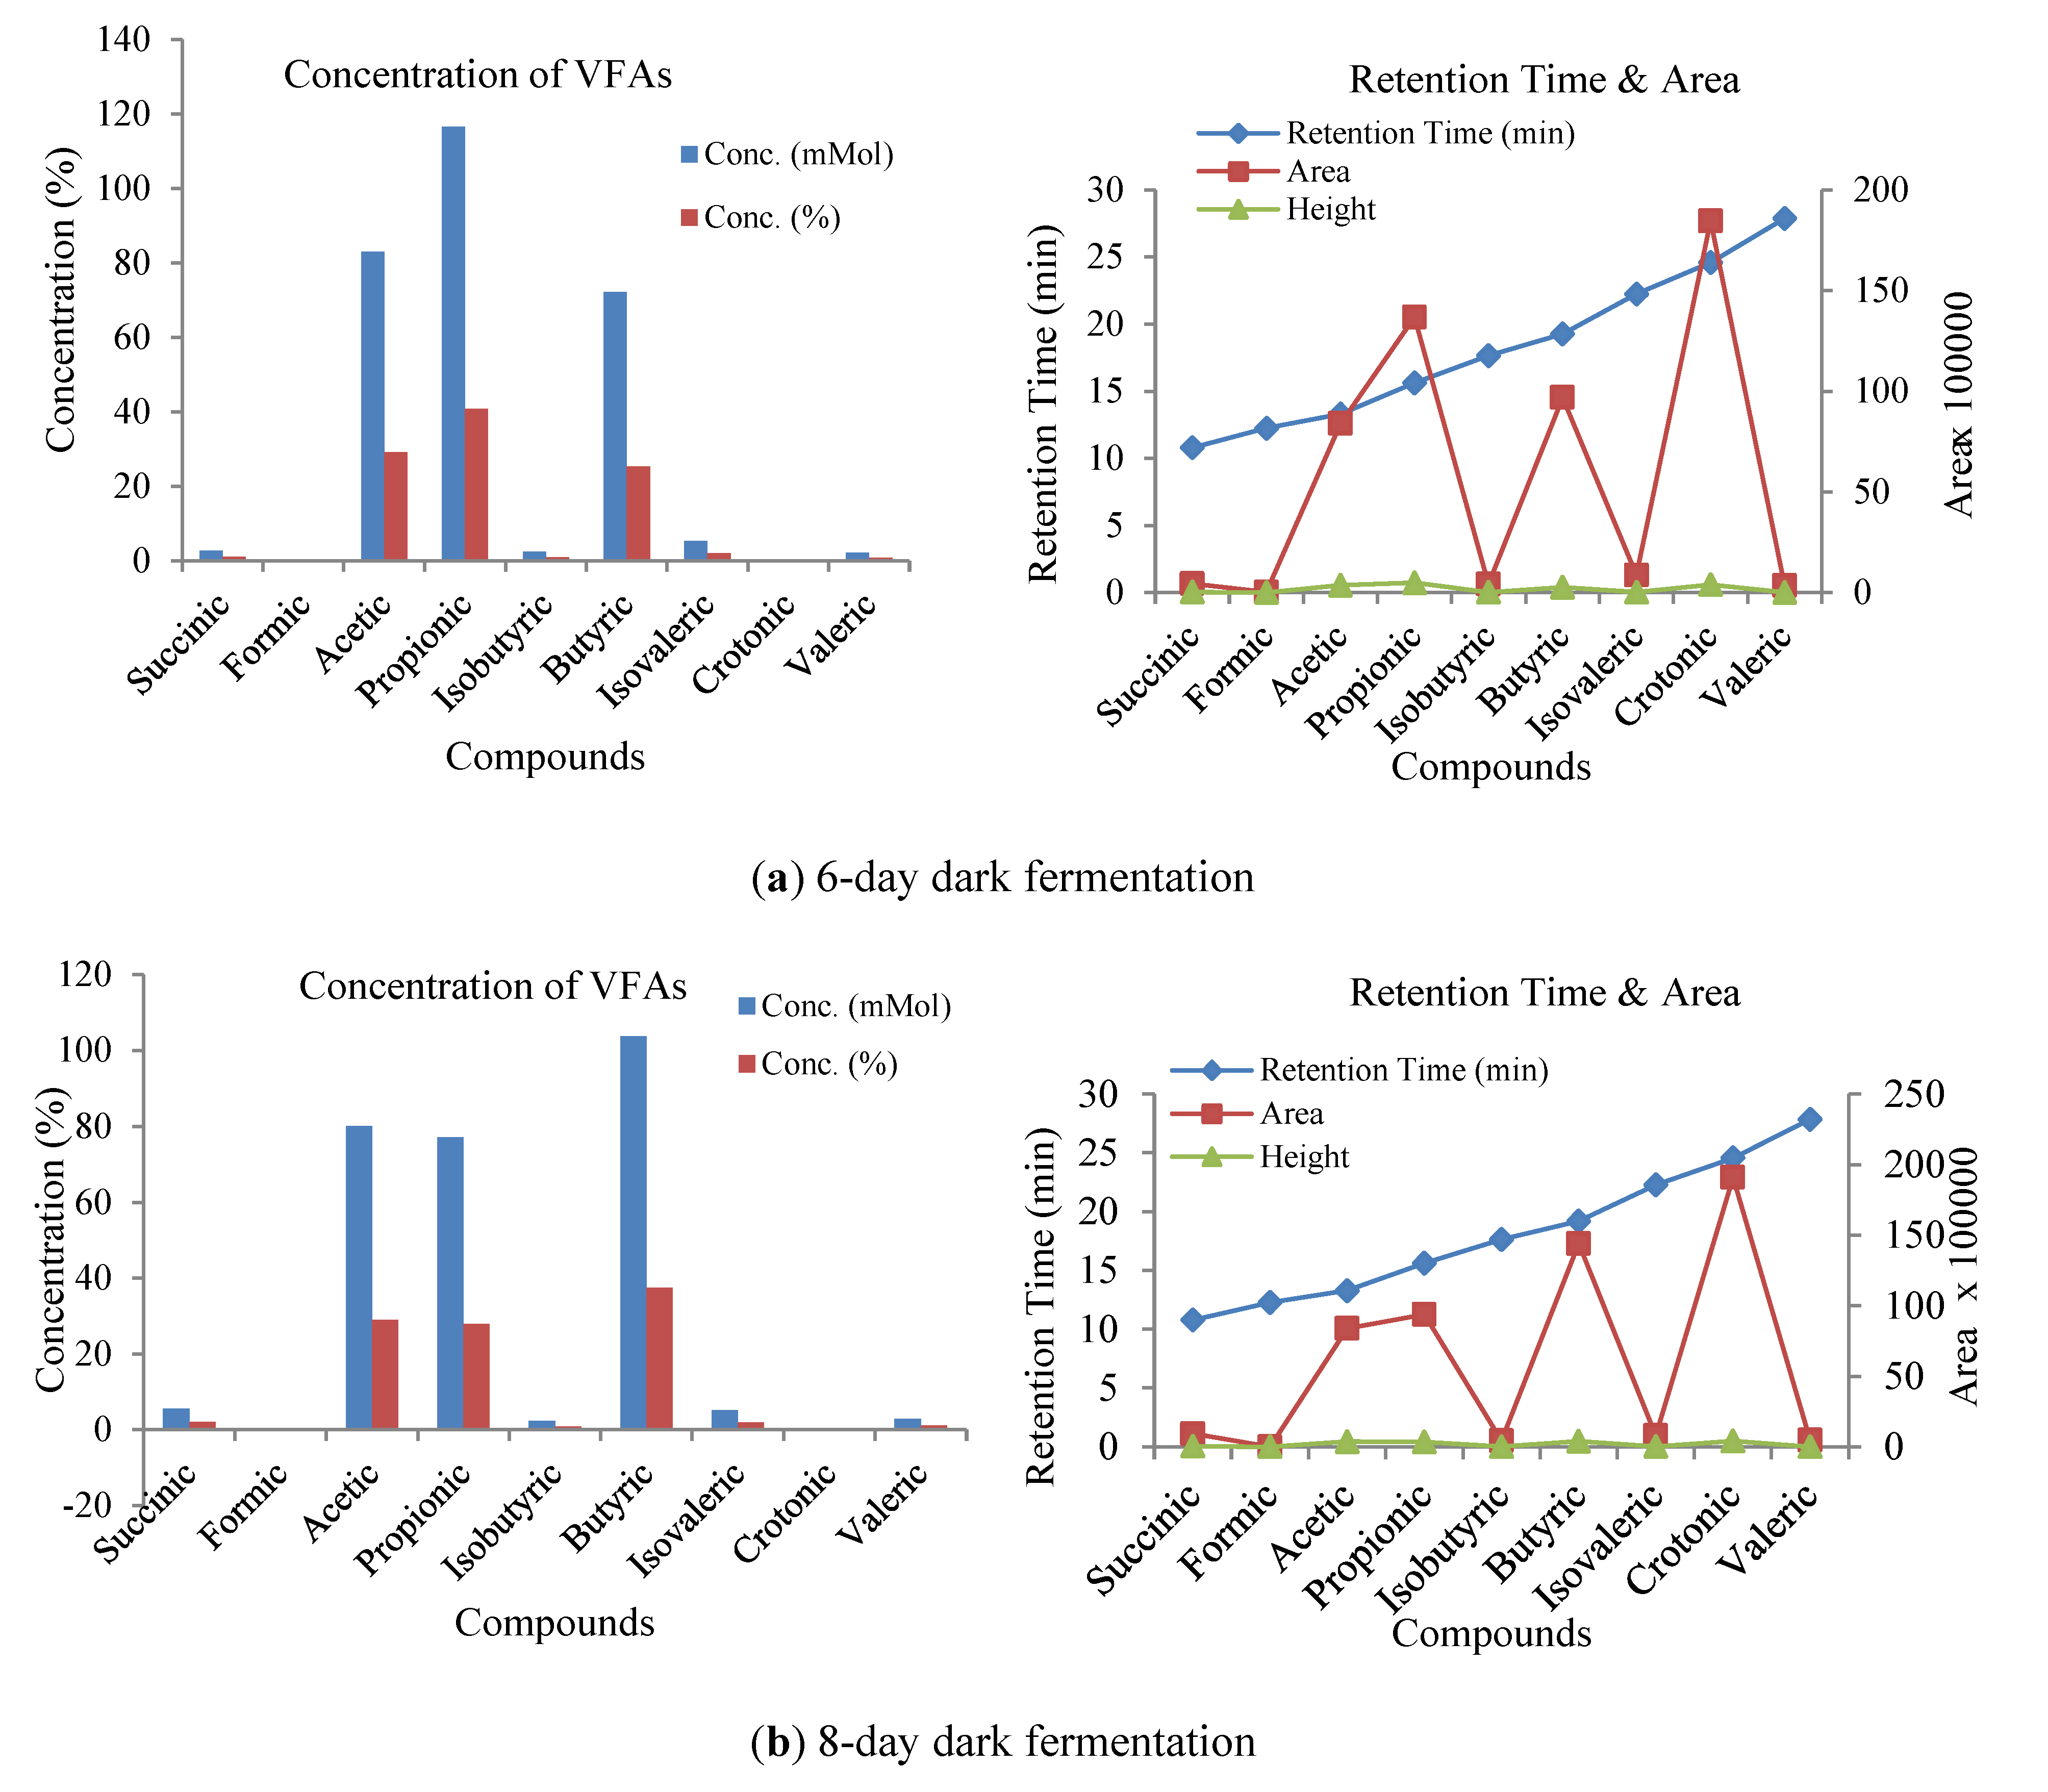
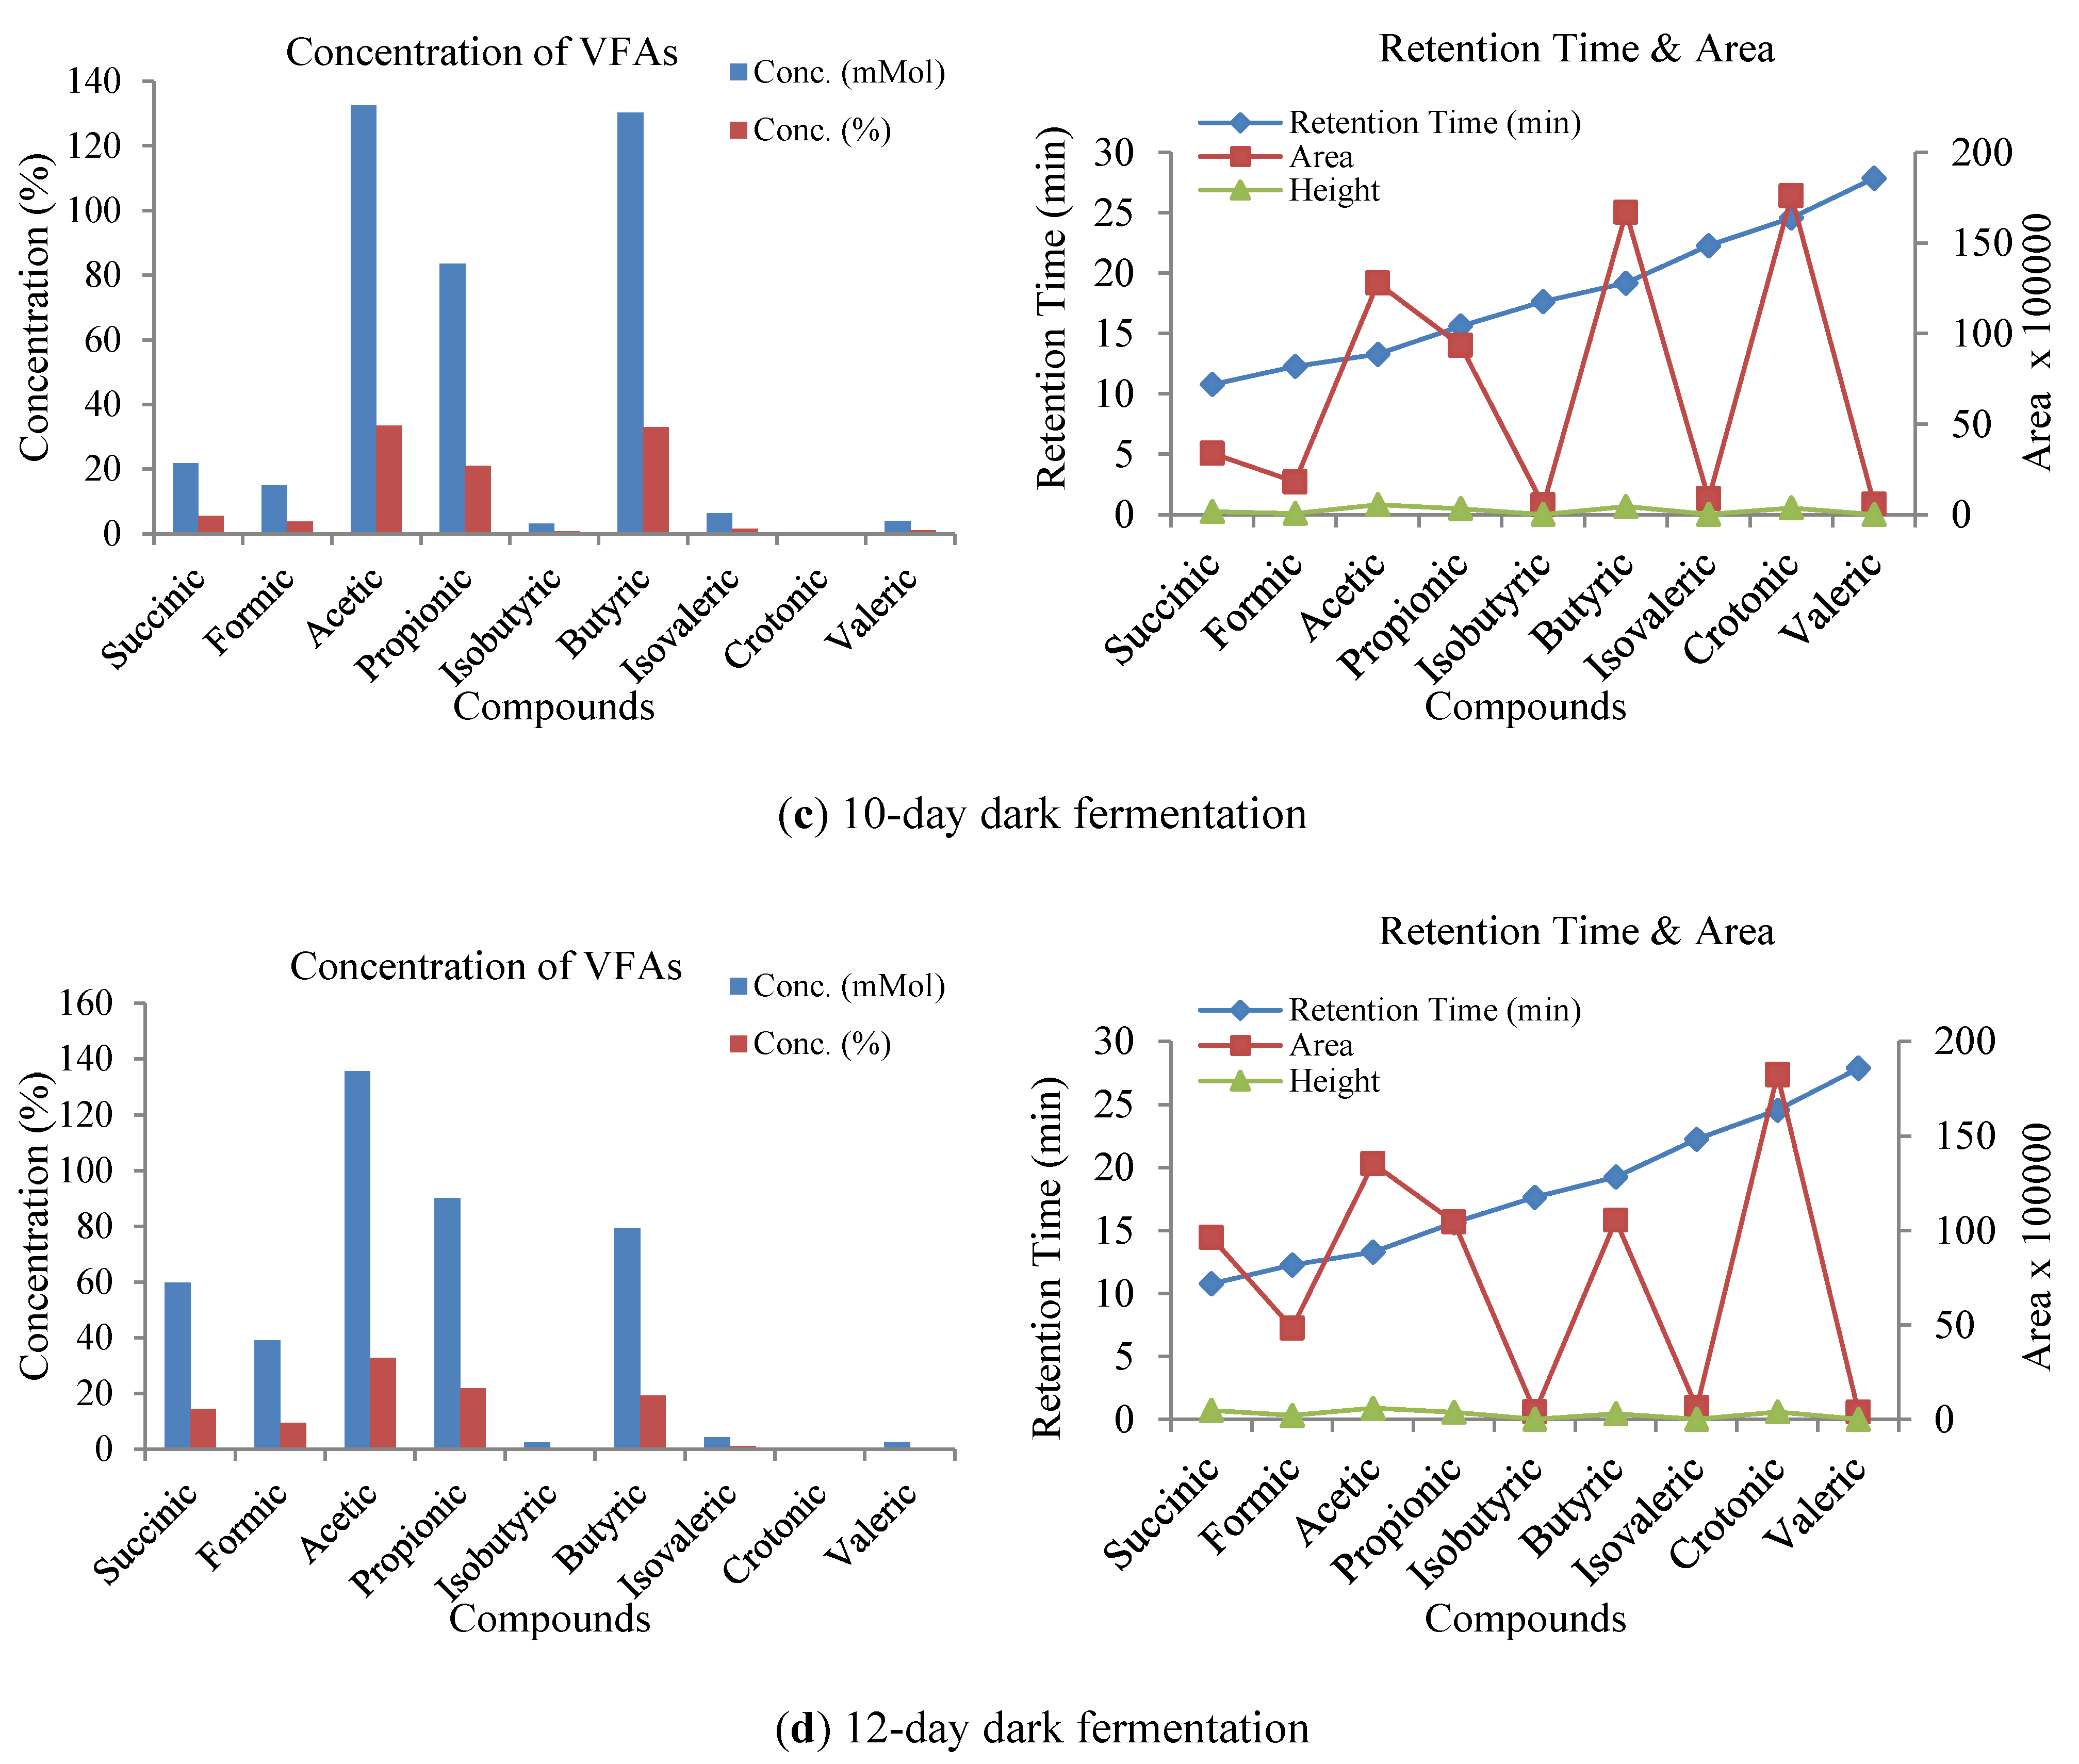
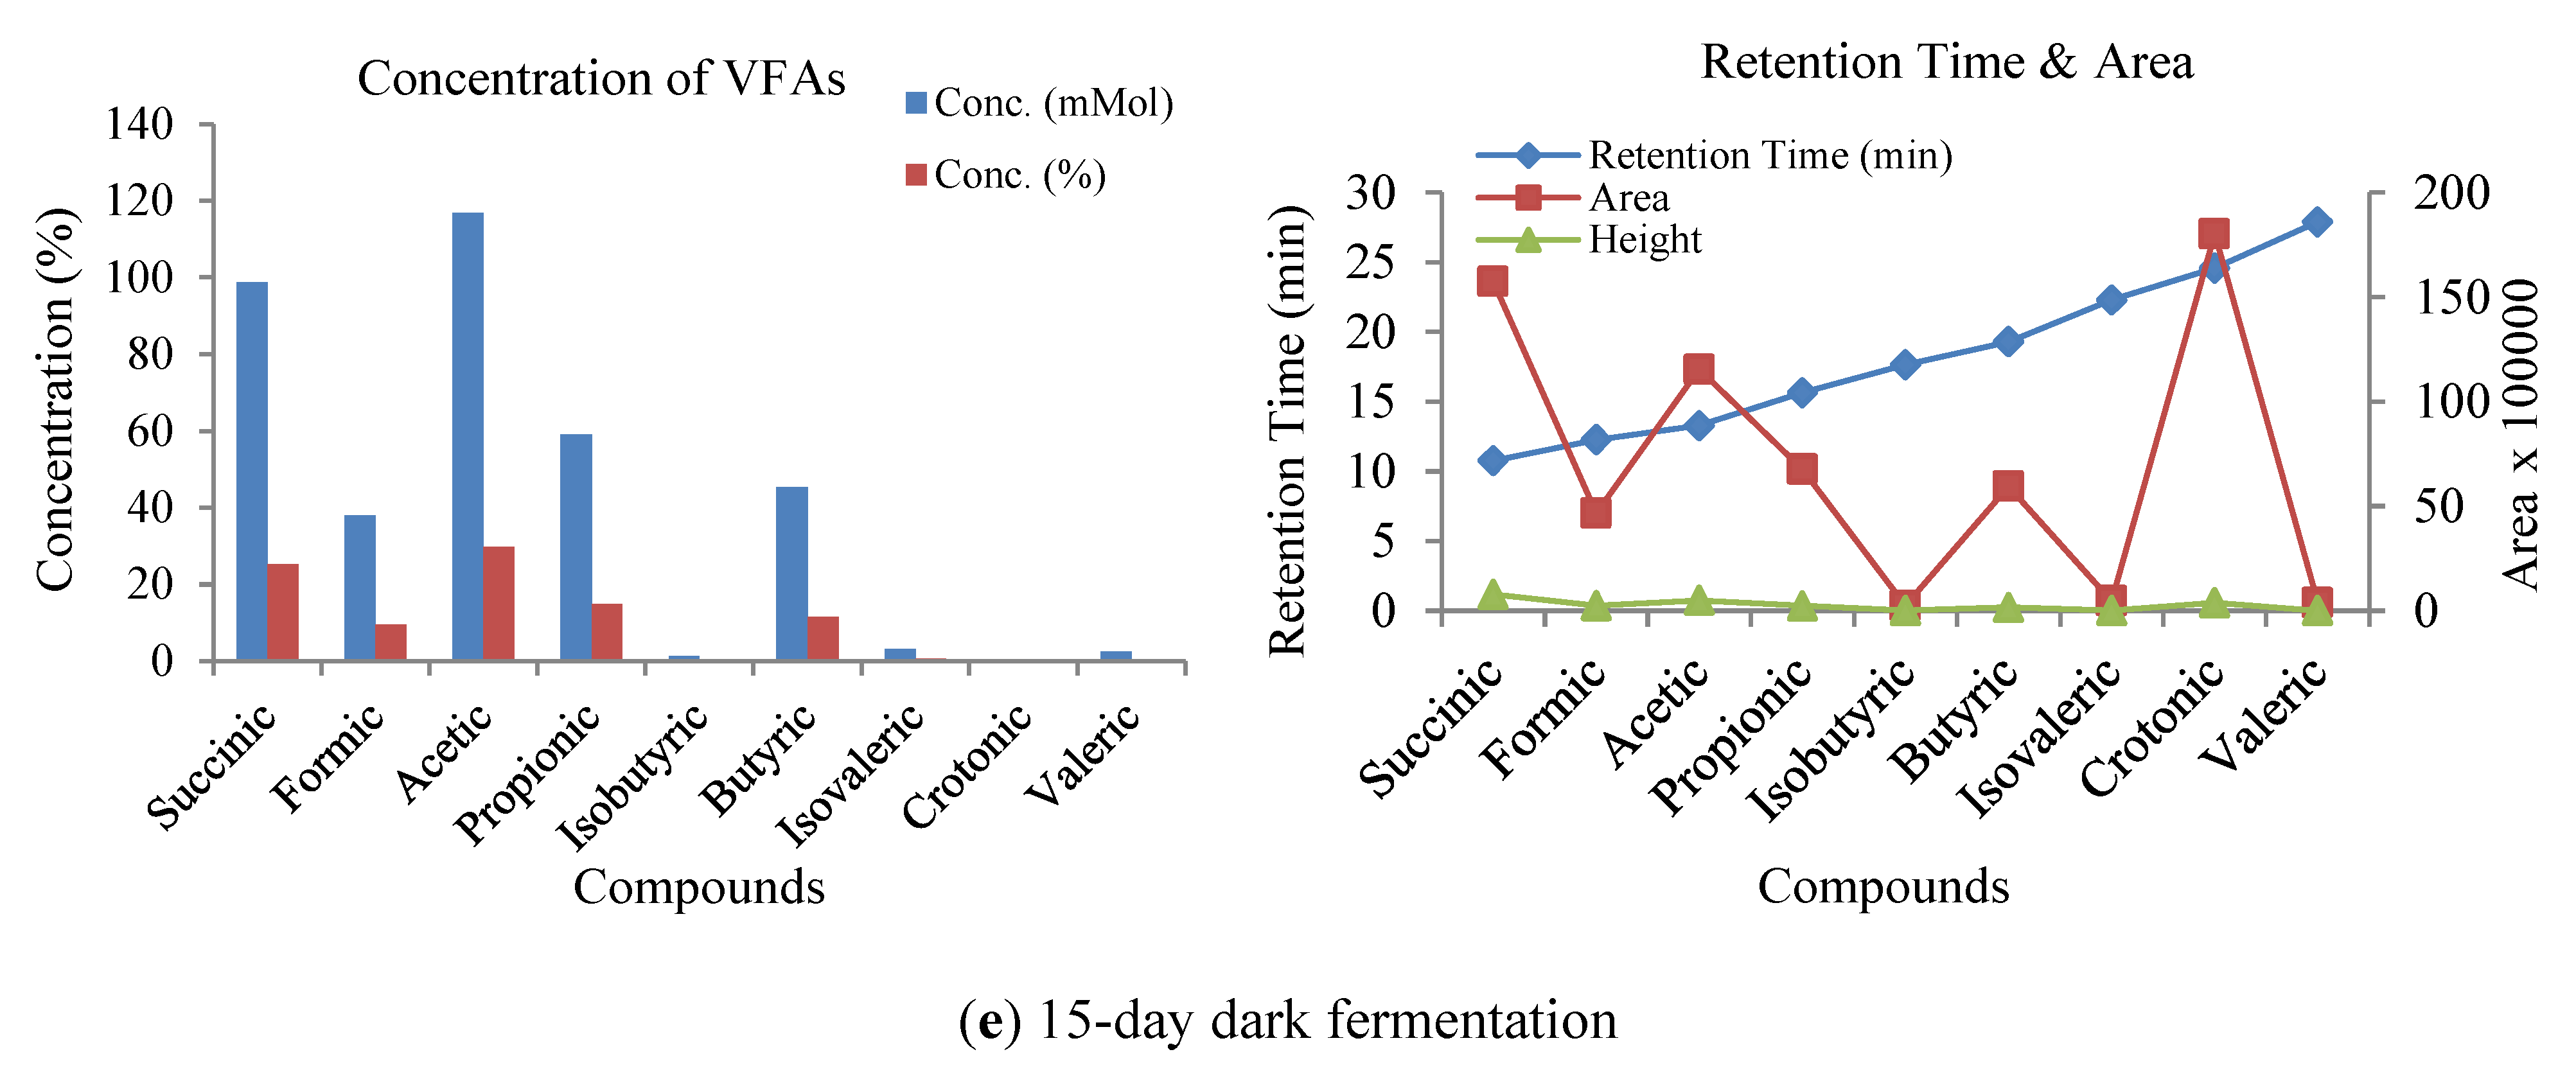
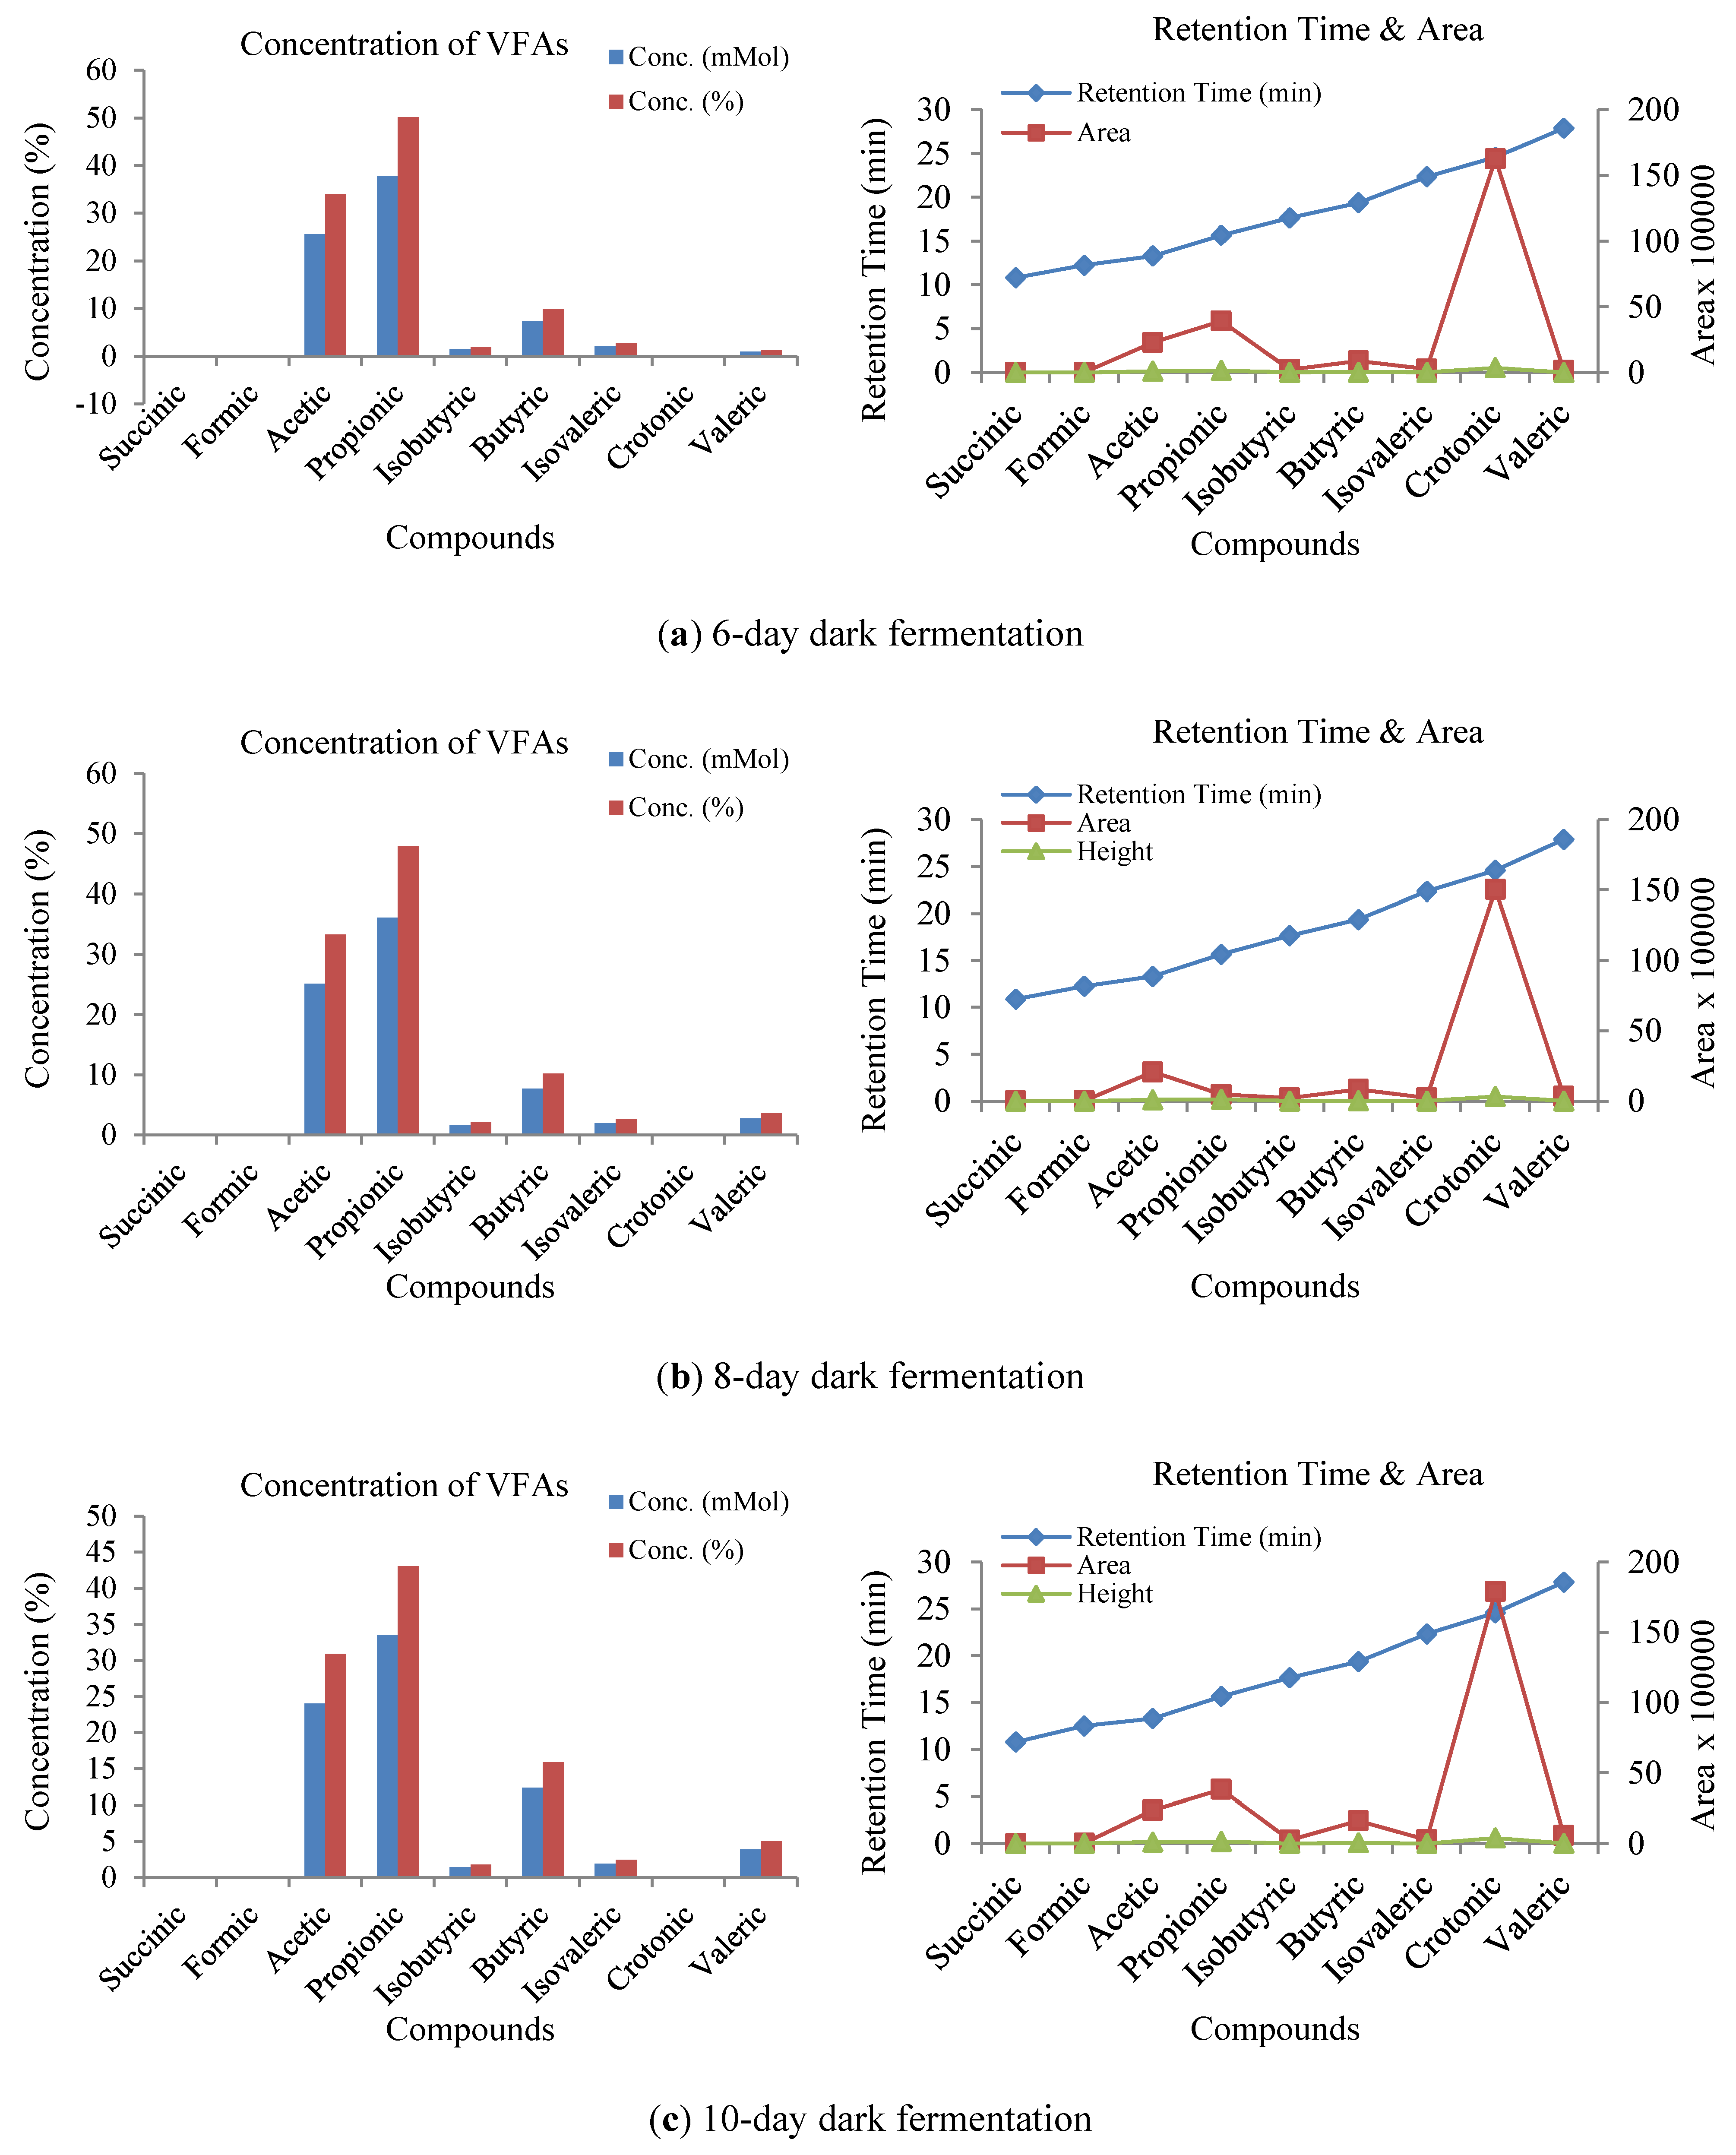
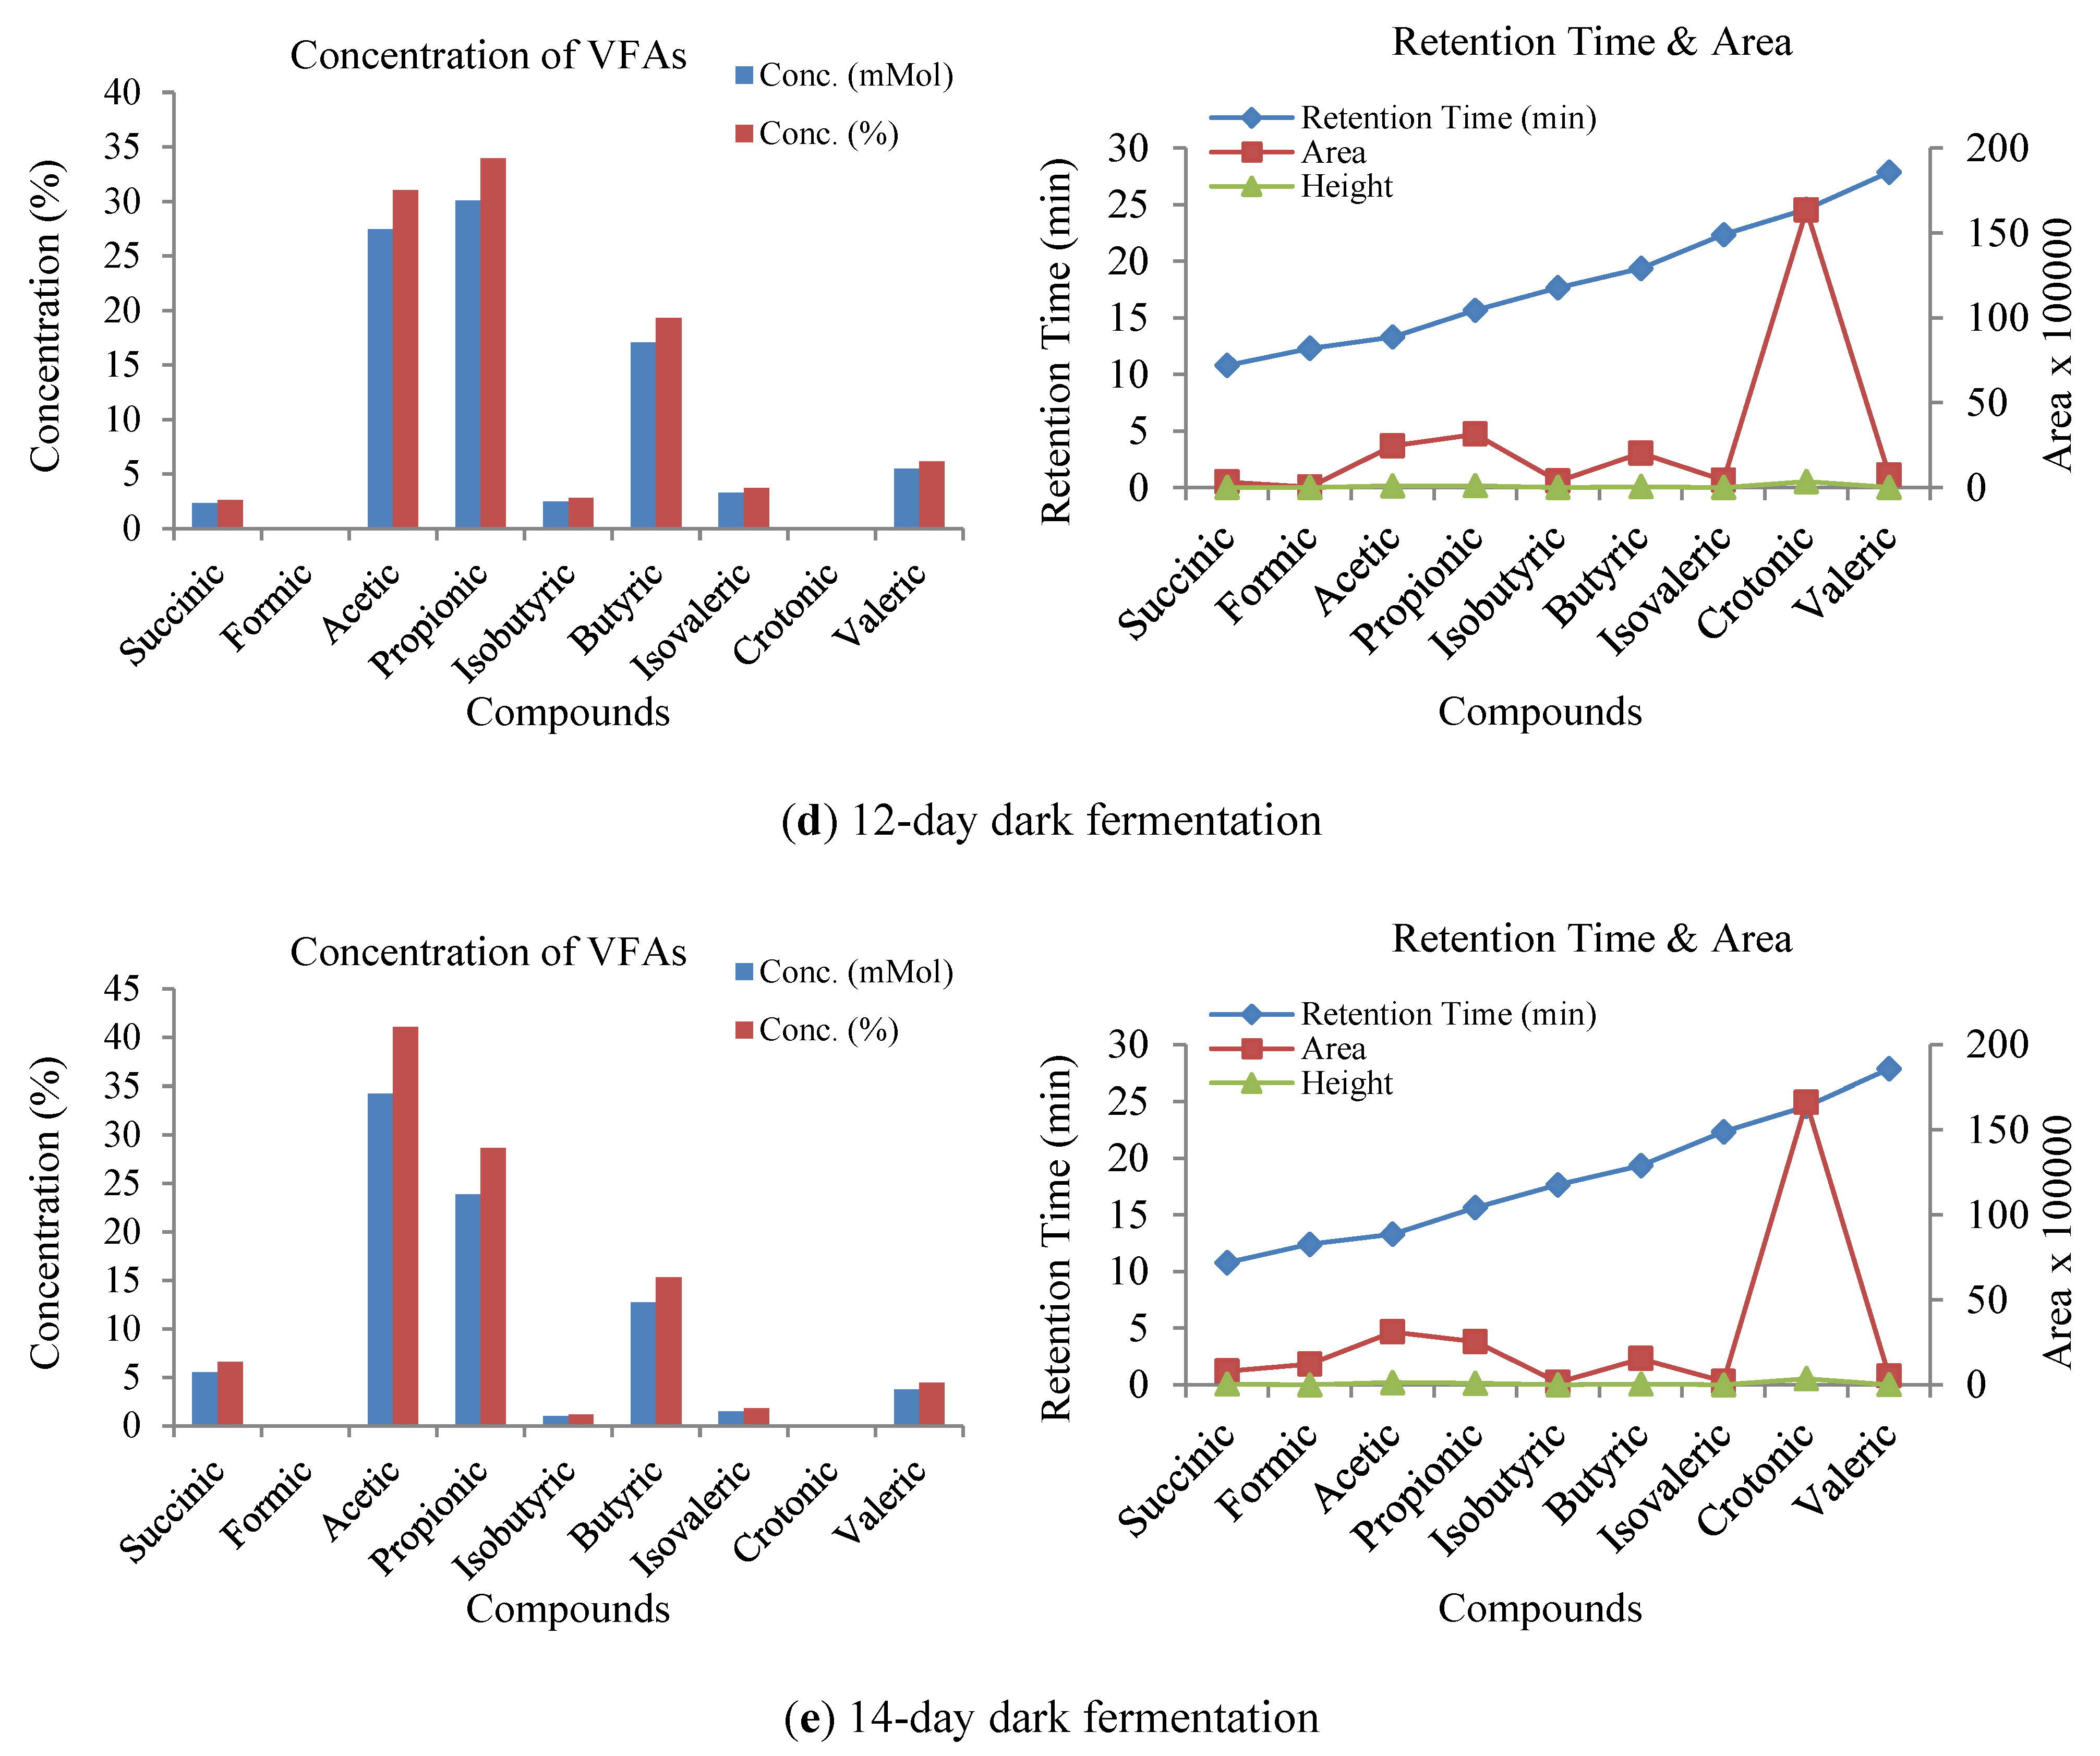
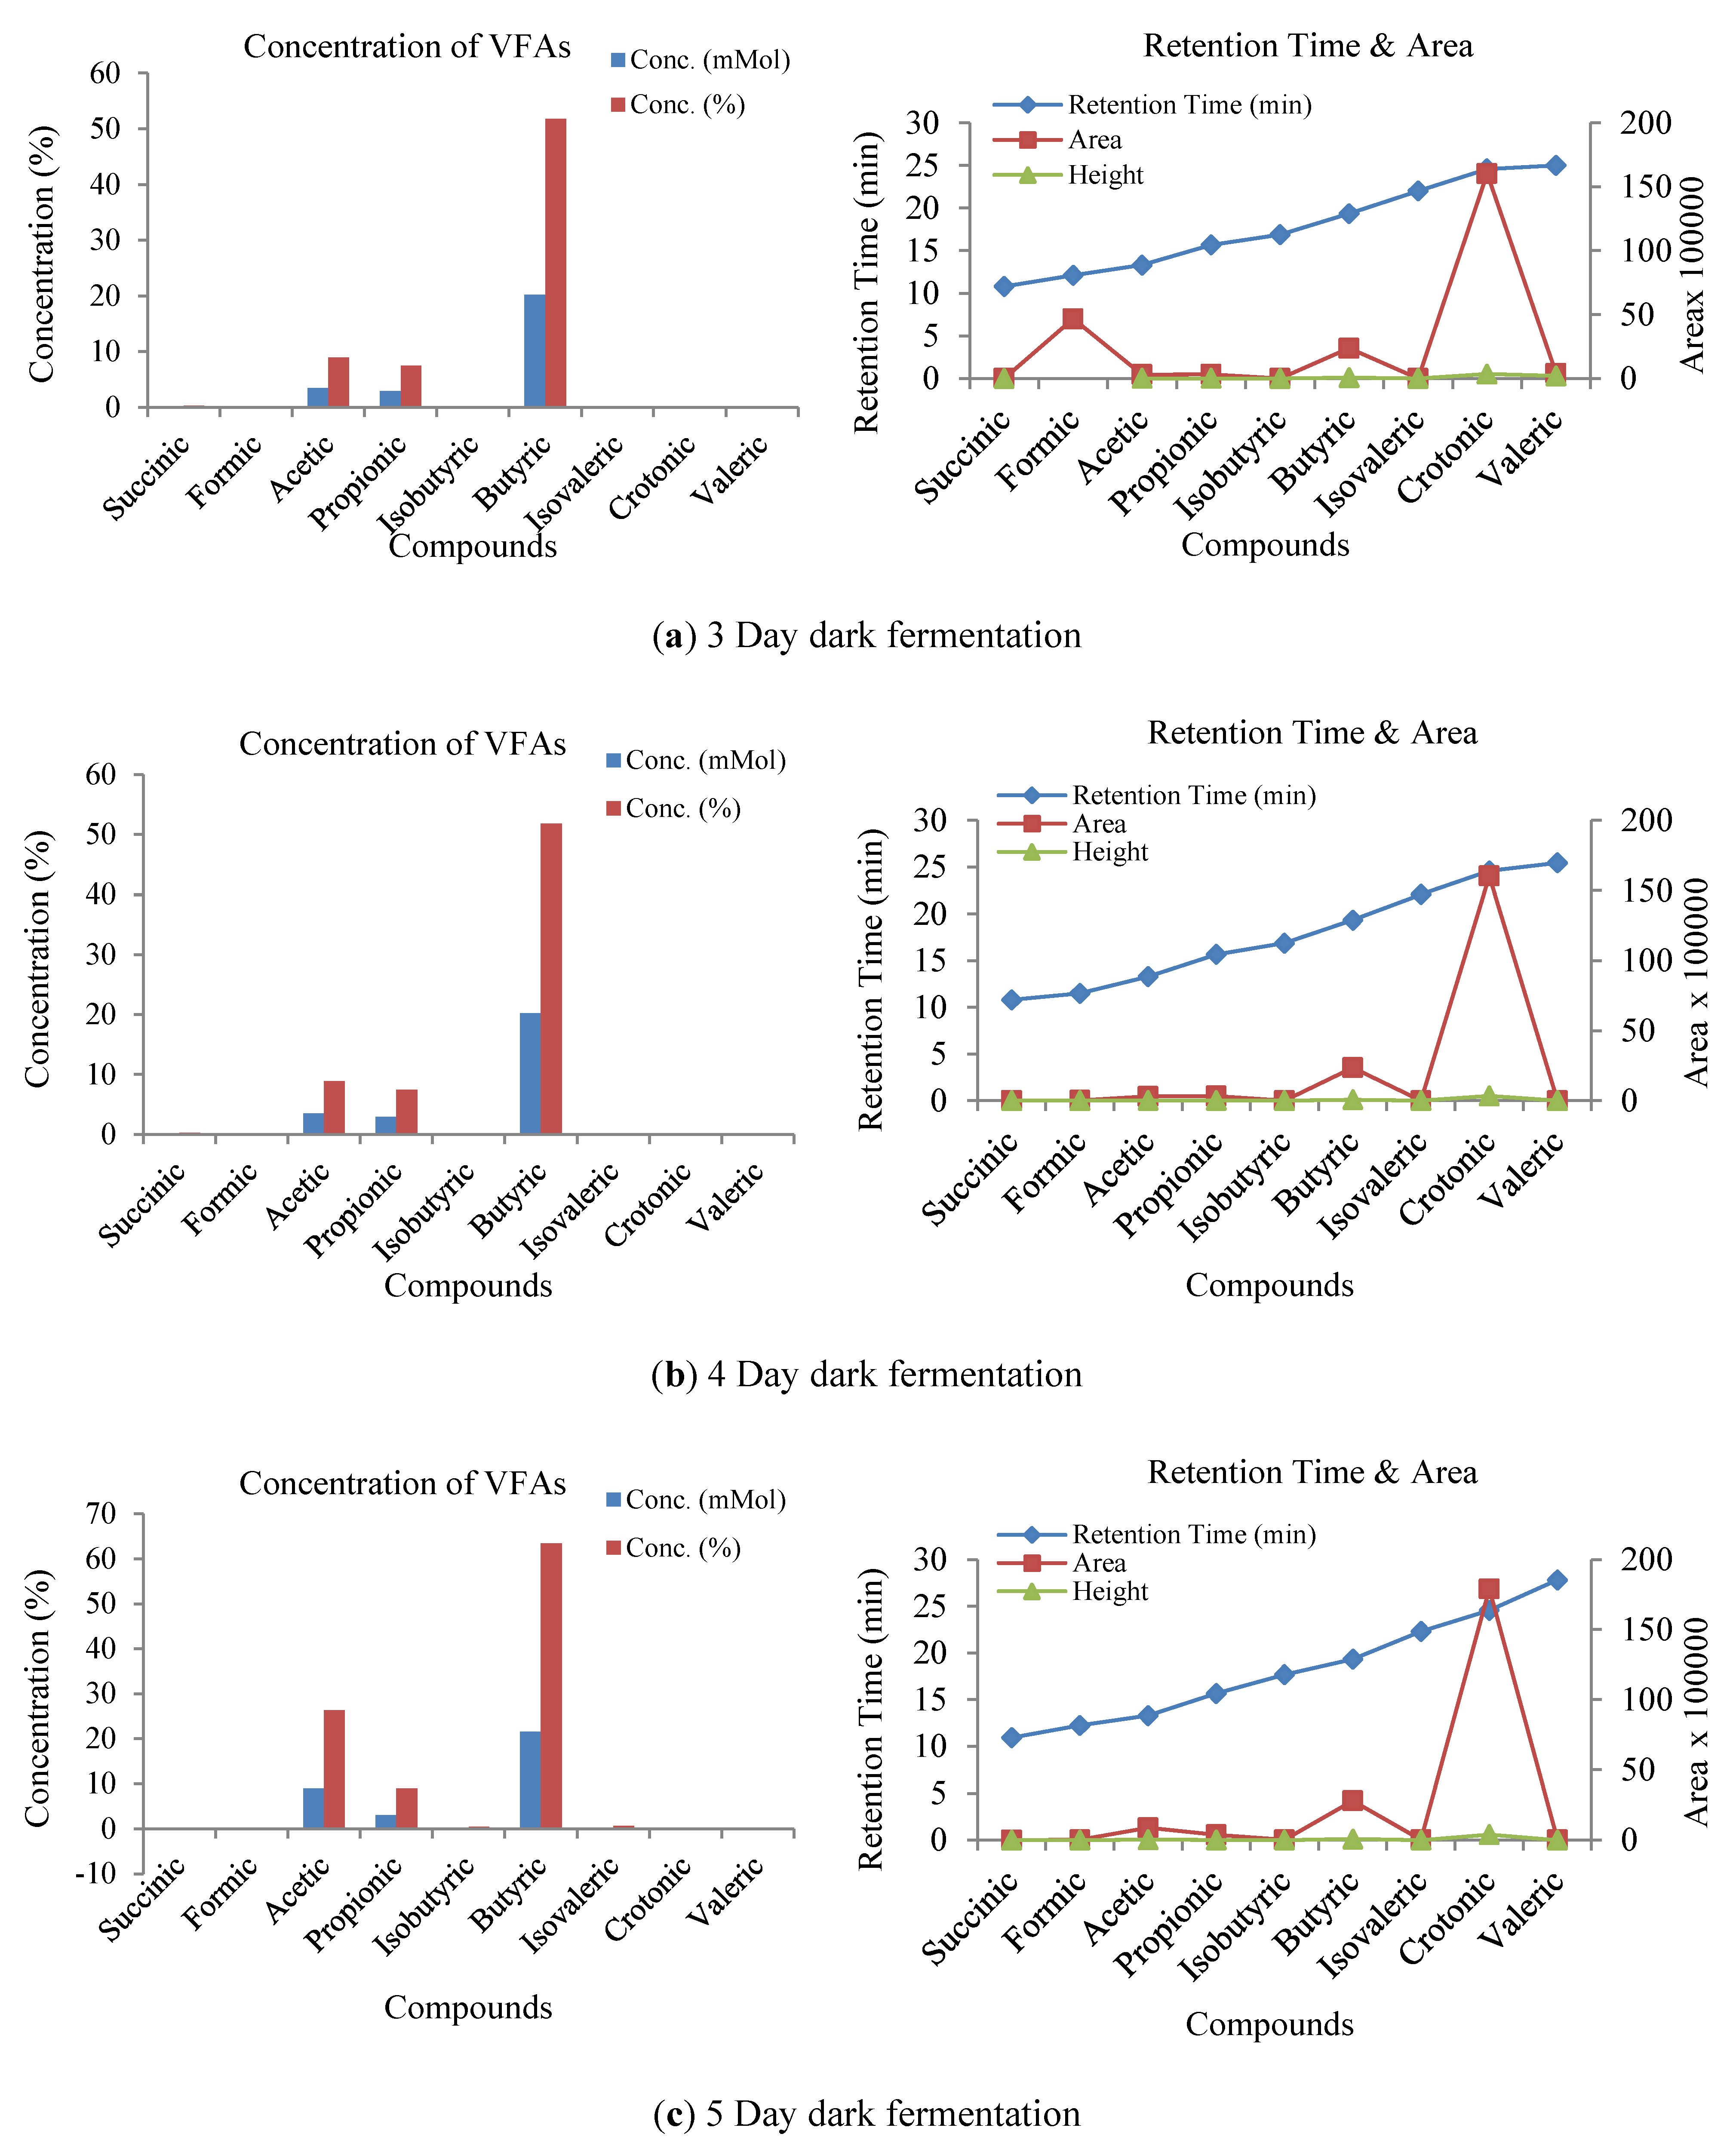
To optimize biogas and hydrogen production, the concentration of VFAs plays a crucial role in microbial metabolism. Acetic acid and propionic acid are the most critical for methane (CH4) and hydrogen (H2) production. Volatile fatty acids (VFAs) are main intermediates in anaerobic digestion and dark fermentation, and their concentrations strongly influence microbial metabolism and overall biogas production. Acetate and propionate are particularly critical, as acetate directly supports methanogenesis, while propionate must be efficiently converted to acetate and hydrogen to maintain substrate availability for methanogens. The interactions among VFAs, including propionate, butyrate, and valerate, rely on cooperative bacteria that generate acetate and H2. Imbalances, especially propionate accumulation, can lead to acidification, inhibit methanogens, and reduce methane yield. Therefore, optimizing propionic acid conversion is essential for enhancing methanogenesis efficiency. Strategies implemented in this project included buffering pH, supplying substrates to support cooperative bacteria, controlling inoculum-to-substrate ratios, performing appropriate dilutions, and maintaining stable organic loading. Efficient propionate degradation stabilizes the VFA profile, maximizes acetate availability, prevents inhibitory accumulation, and ultimately improves methane production and hydrogen turnover in anaerobic digestion. Acetic acid is directly converted into methane by acetoclastic methanogens, while propionic acid must first be converted into acetic acid and hydrogen before being utilized in methanogenesis. Butyric acid, isobutyric acid, and valeric acid contribute to hydrogen production through fermentation. The low concentration of isovaleric acid suggests limited protein degradation. This is beneficial since excessive branched-chain fatty acids can inhibit microbial activity. Crotonic acid, an intermediate in butyrate metabolism, is absent. Since it can be converted into butyric acid and facilitate hydrogen production, its absence may indicate a bottleneck in butyrate metabolism. Retention time analysis shows that acetic, propionic, and butyric acids have a retention time between 10 and 20 min and indicates they are efficiently processed in microbial pathways. However, compounds with longer retention times, such as isovaleric and valeric acids (>20 min), degrade more slowly than shorter-chain VFAs, which can influence hydrogen yield. Their slow degradation leads to accumulation in the reactor, potentially inhibiting hydrogen-producing bacteria and reducing overall hydrogen production. Longer hydraulic retention times (HRTs) can further exacerbate this buildup and intensify the inhibitory effect. Moreover, high concentrations of these acids can lower the reactor pH, creating an unfavorable environment for hydrogen-producing microorganisms. These findings emphasize the critical importance of controlling both VFA concentrations and pH to optimize acid production and maintain efficient hydrogen generation [43,44,45,46]. Figure 7 demonstrates that the influence of pretreatments on VFA generation was evaluated over a 15-day dark fermentation process. Critical VFAs were quantified at different time points (1 day, 3 days, 6 days, 9 days, 12 days, and 15 days), which shows changes in total concentration and individual VFA percentages, shown in Figure 8.
During the 15-day dark fermentation process, VFA production provided distinct phases influenced by metabolic shifts and pretreatment effects. On day 1, total VFA production was relatively low, dominated by propionic acid (116.57 mMol, 40.87%) and acetic acid (82.93 mMol, 29.08%), with butyric acid contributing 72.15 mMol (25.30%). Minor VFAs such as isobutyric and isovaleric remained below 3%, and crotonic acid was detected but not quantifiable. By day 3, butyric acid increased markedly to 103.73 mMol (37.46%), which indicates enhanced fermentation activity, while propionic and acetic acids slightly declined. Succinic acid more than doubled, suggesting metabolic shifts. On day 6, peak levels of acetic acid (132.51 mMol, 33.41%) and butyric acid (130.39 mMol, 32.88%) were reached, with a moderate decline in propionic acid and notable increases in formic and succinic acids. Day 9 saw maximum production of succinic (59.76 mMol, 14.47%) and formic acids (38.94 mMol, 9.43%), while acetic acid remained stable and butyric acid declined. By day 12, succinic acid peaked at 98.81 mMol (25.19%) and lactic acid rose sharply to 27.20 mMol (6.93%), while both acetic and propionic acids showed decreases, and butyric acid dropped significantly. On day 15, a shift toward butyric (20.24 mMol, 51.81%) and lactic acid (12.24 mMol, 31.32%) dominance was observed, with acetic and propionic acids reduced to trace levels. Overall, the early phase (days 1–6) was characterized by dominance of acetic, propionic, and butyric acids with rising succinic and formic acids; the middle phase (days 6–9) marked peak total VFA concentrations; and the later phase (day 12–15) exhibited a metabolic shift favoring butyric and lactic acid accumulation, likely driven by pH and byproduct effects.
Figure 9 shows several findings in the concentration, retention time, area, and height for various compounds across multiple datasets. Most compounds, including succinic, acetic, isobutyric, and butyric acids, show an increase in concentration over the datasets, with corresponding increases in both area and height, indicating a consistent analytical response. This indicates that succinic acid’s concentration rises from 0.069 mMol to 5.495 mMol, with a proportional increase in area and height. On the other hand, retention times remain relatively stable across the datasets, ranging from approximately 10.79 min to 10.88 min for succinic acid and between 12.23 min and 12.42 min for formic acid. However, propionic acid shows a decline in concentration from 37.751 mMol to 23.856 mMol accompanied by a decrease in both area and height. Formic acid’s data, with negative or missing concentration values in some datasets, suggests potential issues or discrepancies. Crotonic acid, despite having missing data in certain datasets, displays the highest area and height values when present, indicating a high detector response. From the data results, the analysis demonstrates that for most compounds concentration correlates with area and height, and provides a clear relationship between concentration levels and chromatographic responses, although some compounds, like formic acid, show irregularities that need further investigation.
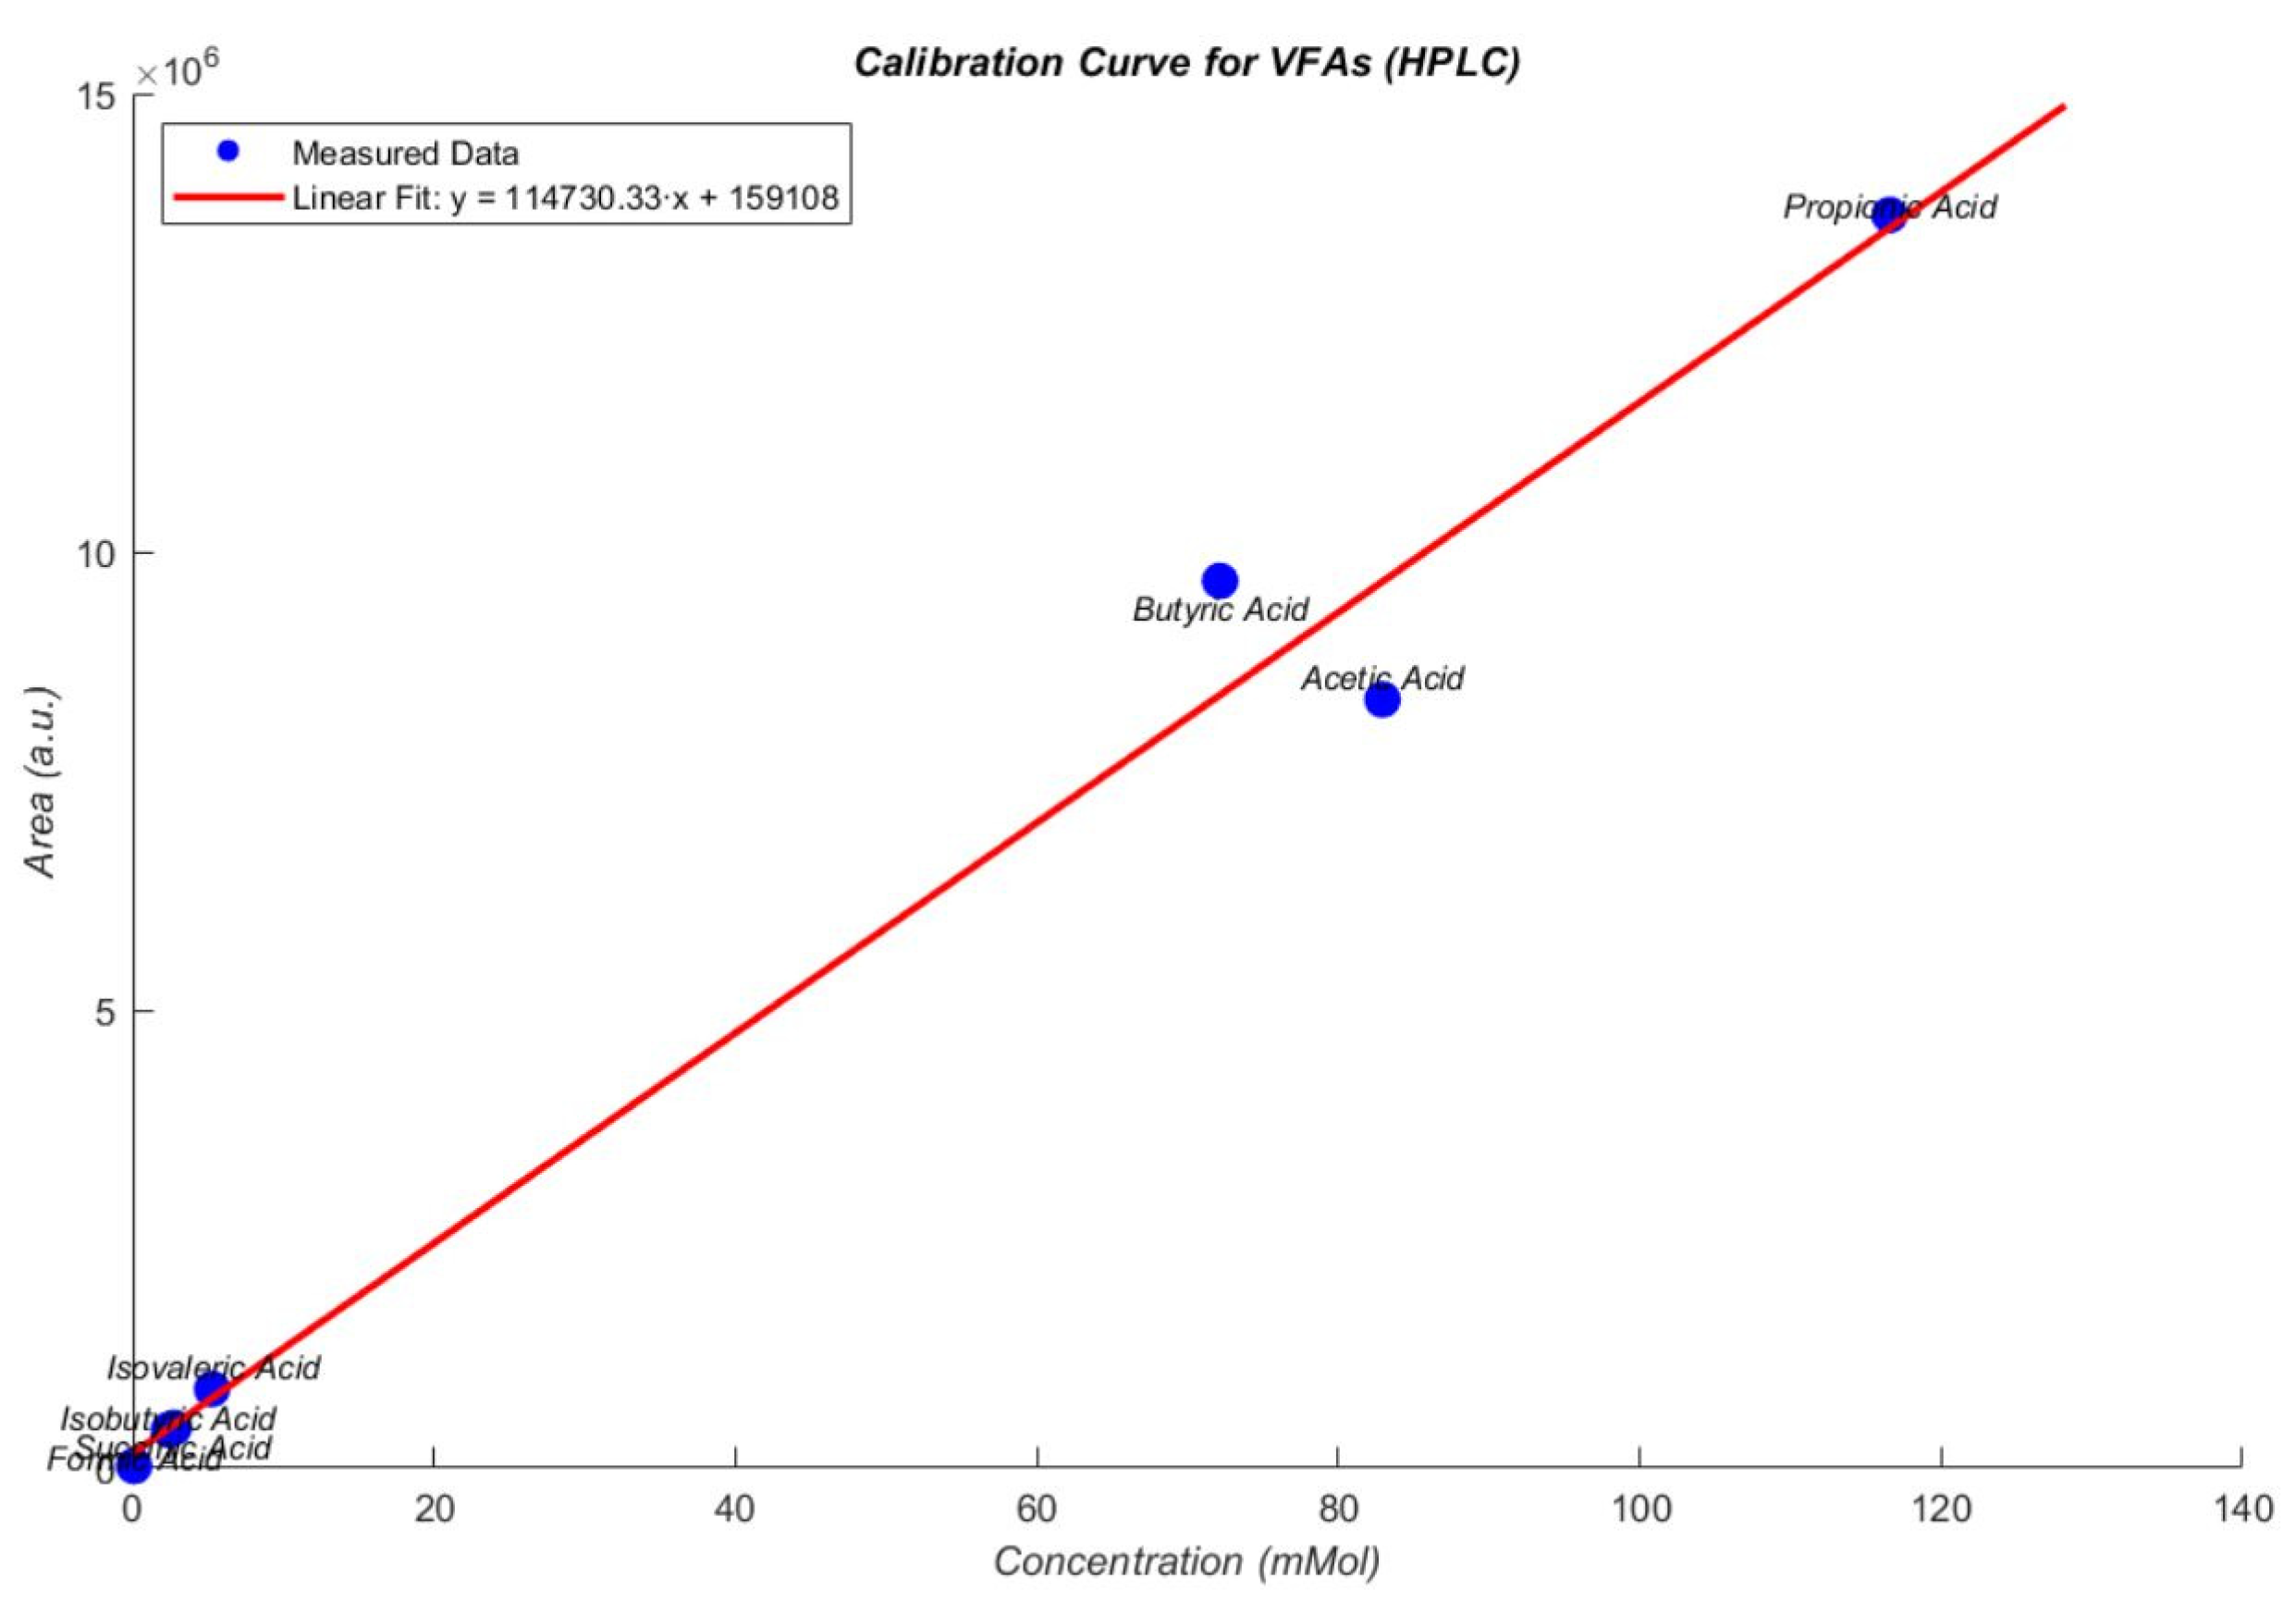
Figure 10 presents the calibration curve for VFAs and shows the relationships between area and concentration for each component. This graph shows the relationship between peak area and concentration for individual components.
The data points correspond to standard solutions of common VFAs, including formic acid, isobutyric acid, isovaleric acid, acetic acid, butyric acid, and propionic acid. A linear regression model was applied to the measured data, which demonstrates a strong linear correlation between concentration and peak area across the tested range. This strong linearity confirms the reliability of the method for quantifying VFAs in fermentation samples. The positioning of each acid along the curve reflects its specific concentration range, with lower molecular weight acids such as formic and isobutyric acids appearing at the lower end of the concentration axis, while acetic, butyric, and propionic acids fall in the mid-to-high concentration ranges. The close alignment of measured data with the regression line indicates high accuracy of the calibration, ensuring that subsequent VFA measurements in experimental samples can be quantified with confidence. The data analysis of various organic acids across multiple datasets provides several interesting findings. Concentrations for compounds like succinic, acetic, and propionic acids show significant variations, with some datasets indicating substantial increases, particularly for succinic acid. Retention times remain relatively stable across the datasets, suggesting consistent analytical conditions. The area and height values generally correlate with concentration levels, with compounds exhibiting higher concentrations also showing larger areas and heights, particularly noticeable in acetic and propionic acids. For formic acid, however, there are discrepancies, such as negative and missing values in some datasets, indicating potential measurement or data entry issues. Despite some inconsistencies, the overall data suggests a trend where higher concentrations lead to greater detector responses, both in terms of area and height. This pattern underscores the relationship between concentration and chromatographic response, providing valuable insight for further experimental analysis and optimization.

3.4. Sensitivity Analysis of VFA and pH Responses

Two sensitivity analyses were conducted to evaluate VFA and pH responses under varying conditions. These include changes in inoculum-to-substrate ratios, dilution factors, and pH levels. The goal was to determine how these parameters influence fermentation efficiency and biohydrogen production in anaerobic digestion systems. In the sensitivity analysis for DF1.1, the inoculum-to-substrate ratio (I2SR) was set at 30:70 using five-times diluted cattle waste (CW) as the substrate. The system operated under uncontrolled pH conditions to observe the natural progression of fermentation, with intermittent manual agitation performed three times daily. The temperature was maintained at 37 °C to support mesophilic microbial activity. Carbohydrate concentration was monitored to assess substrate degradation over time. On day 1, the initial carbohydrate concentration measured 1876.54 mg/L, indicating a high availability of fermentable sugars. Although carbohydrate consumption was monitored, the carbon balance between substrate input and measured fermentation products (VFAs, hydrogen, CO2) was not fully accounted for. This discrepancy may arise from unmeasured intermediates such as succinate and lactate, microbial biomass growth, or experimental variability in sampling and analysis. Future studies should include comprehensive quantification of all carbon-containing products to improve carbon recovery calculations. To avoid carbon imbalances, account for all major sinks, including biomass, soluble microbial products, and unmeasured organics like ethanol, lactate, and iso-VFAs. Correct gas-phase CO2 for water vapor and standard conditions, and measure TIC/TOC with an expanded organics panel. Quantify biomass via VSS using proper COD factors, and review operational logs (OLR, HRT, pH, mixing) to prevent sampling artifacts. In low-H2 systems, carbon often accumulates in biomass, or unmeasured metabolites, with high pH or poor mixing worsening apparent losses [47]. By day 5, the concentration had significantly decreased to 14.61 mg/L, demonstrating effective microbial consumption and metabolic activity. This sharp decline suggests that the conditions supported rapid carbohydrate utilization, a key factor influencing volatile fatty acid (VFA) production and hydrogen yield. The results provide valuable insights into the impact of I2SR, pH control, and substrate dilution on fermentation efficiency and biohydrogen potential in anaerobic digestion systems shown in Figure 11.
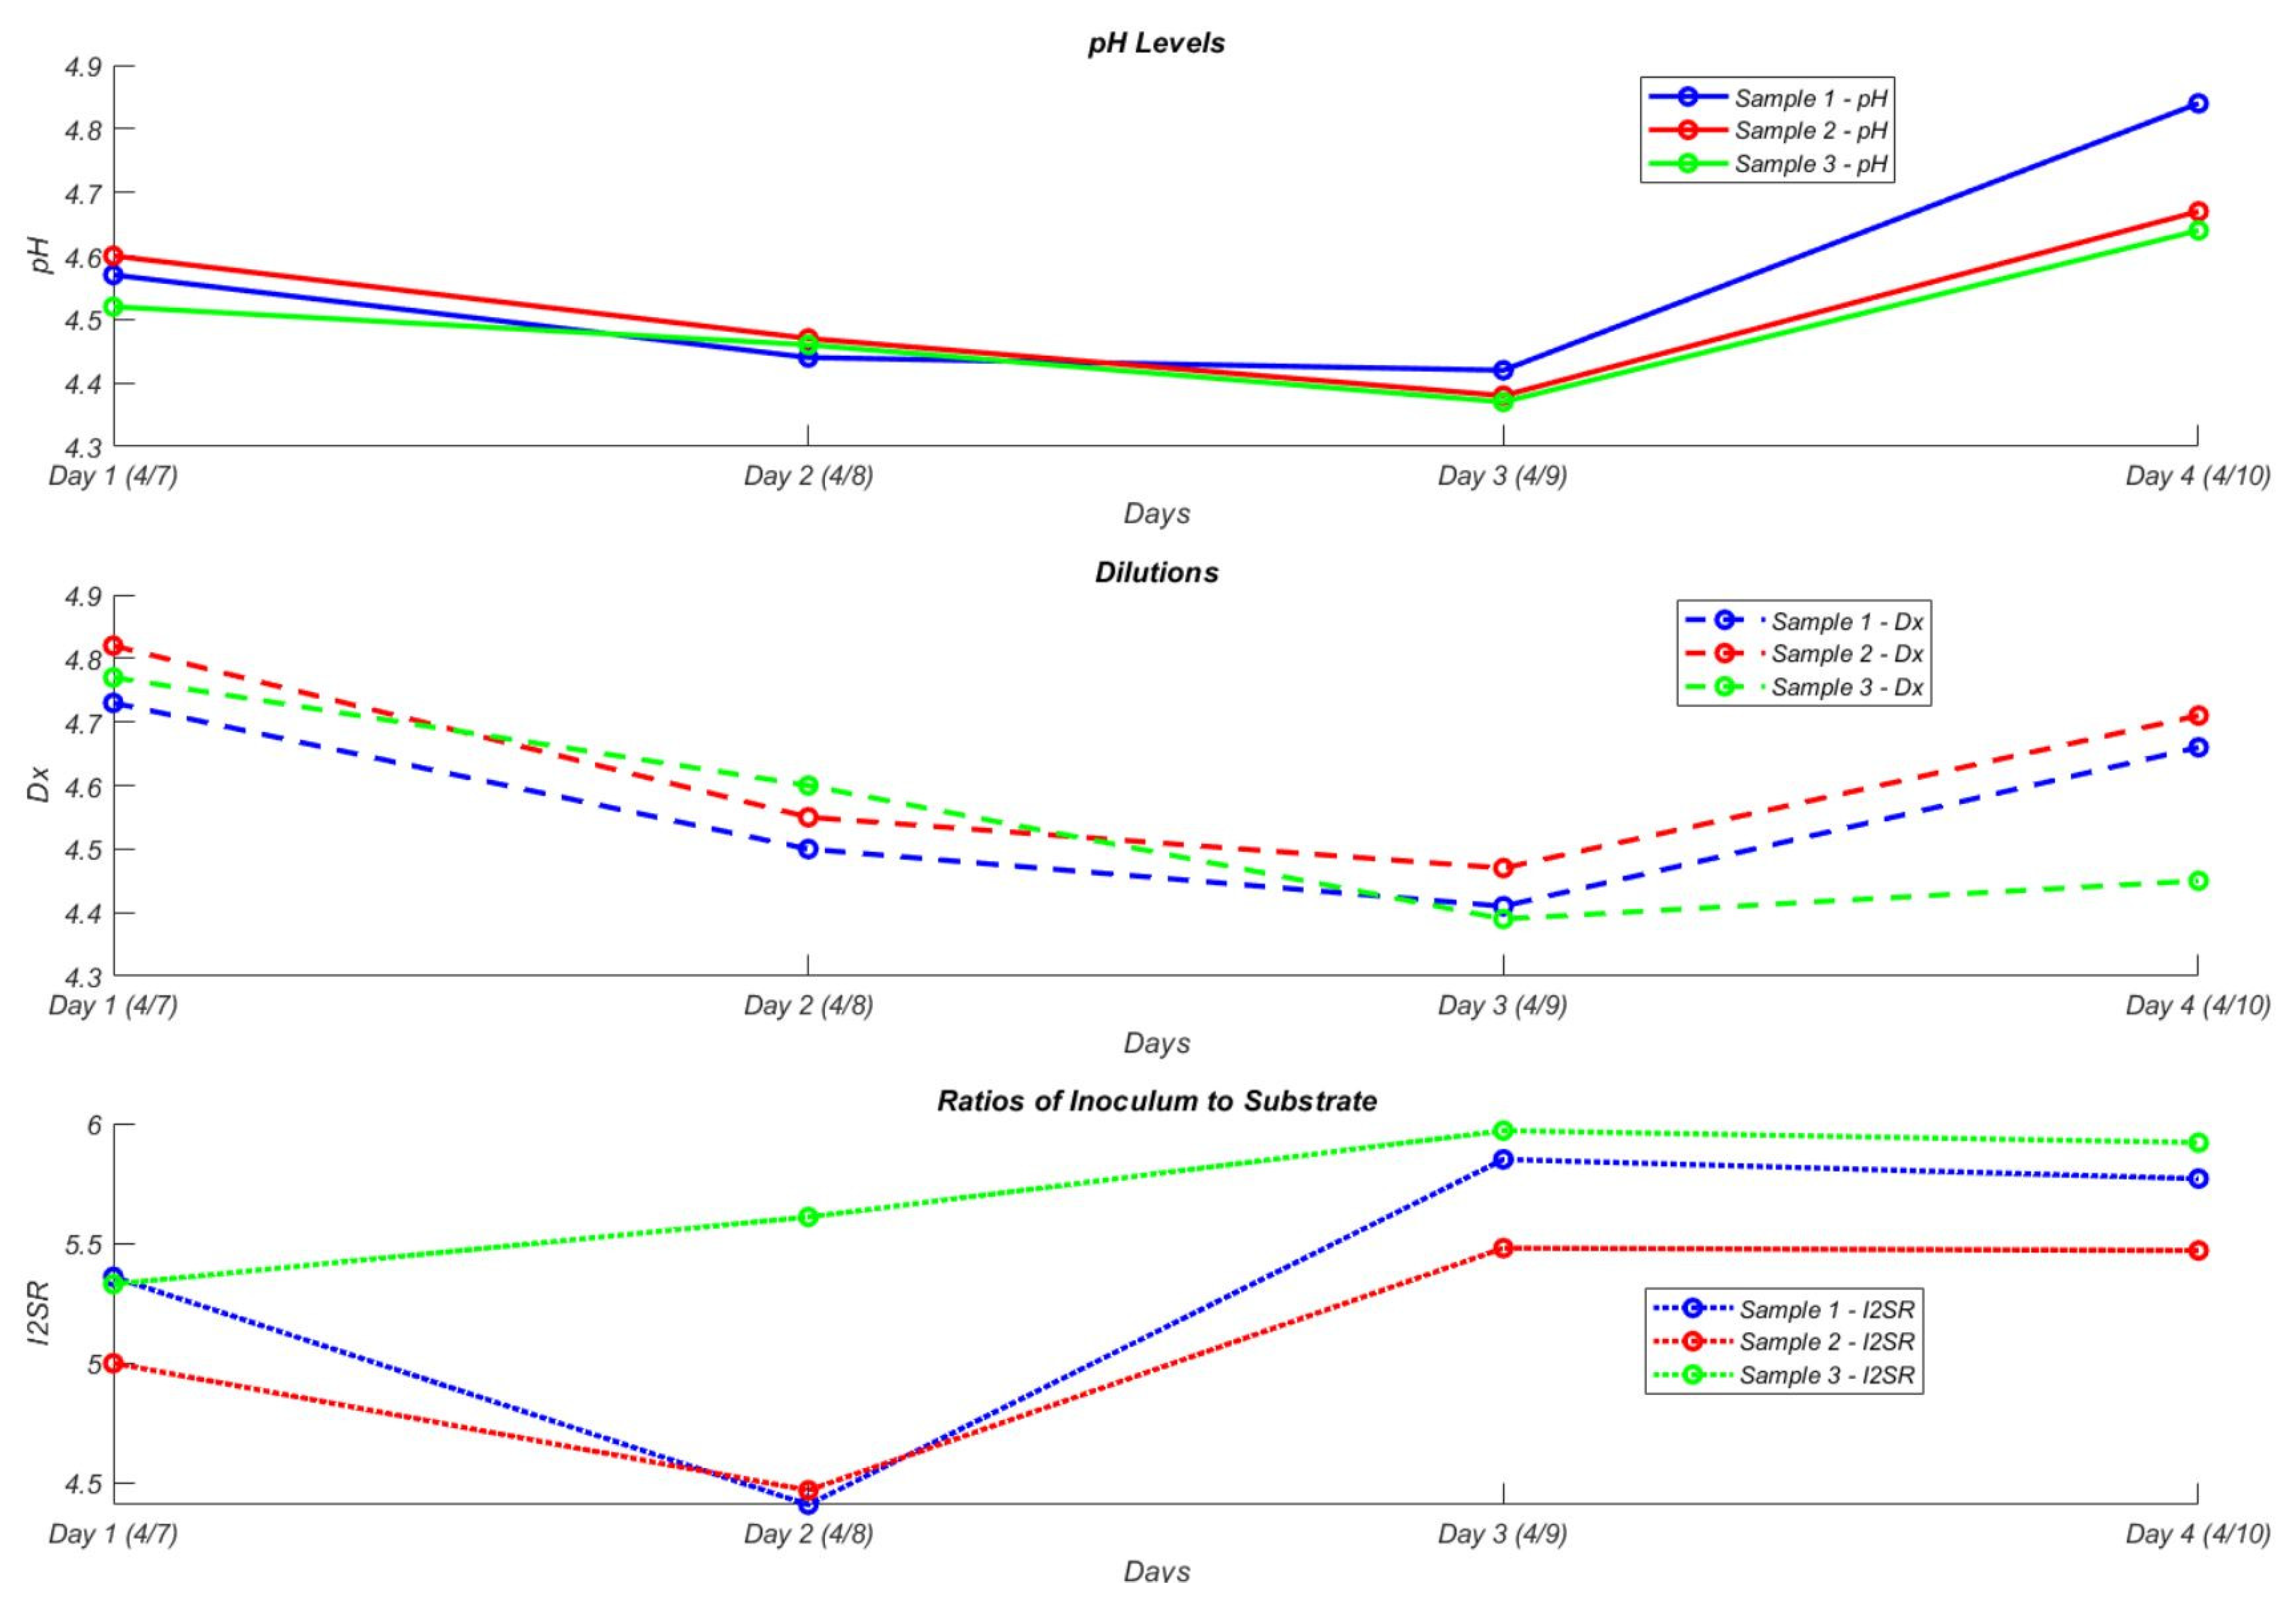
For variations in inoculum-to-substrate ratios, pH levels, and dilution factors, the preparation of samples involves setting specific values for pH, dilution, temperature, and the inoculum-to-substrate ratio (I2SR). These parameters control the environmental and operational conditions, directly affecting microbial or biochemical processes. Each factor plays a crucial role in microbial growth, enzyme activity, and chemical reactions. pH is a critical factor that determines the acidity or alkalinity of the sample, which influences the environment in which microorganisms grow. Different microbes have specific pH preferences, with some thriving in neutral conditions, while others may grow better in more acidic or alkaline environments. In this study, pH values range from 5 to 9, with an “uncontrolled” sample indicating no pH adjustments made. Dilution refers to the concentration of the sample. A dilution factor of 1 indicates no dilution, while factors like 5, 10, and 20 represent progressively more diluted samples. This dilution influences the concentration of nutrients, substrates, and microbes, thereby impacting microbial growth rates and metabolic activity. The process performance is significantly influenced by the interaction of I2SR, pH, and dilution. A higher and stable I2SR, as observed in sample 3, provided sufficient microbial availability to manage substrate loads. Moderate dilution helps prevent rapid acid accumulation and maintain a more stable environment. pH recovery patterns relate to metabolic balance, where smoother rebounds indicate more efficient stabilization than sharp fluctuations. Thus, sample 3 demonstrated the most favorable balance of conditions and suggested that a higher I2SR combined with controlled dilution contributes most to stable and efficient performance. Table 5 summarizes various batch experimental modes and provides differences in pH levels, dilution rates, and inoculum-to-substrate ratios used to evaluate process performance under varying conditions.
The batch modes for the experiment were conducted by varying pH, dilution levels, and the inoculum-to-substrate ratio (I/S) to assess their effects on microbial activity and biogas production. The pH was set to 6.5 for most samples, with exceptions for sample 7, which had a pH of 9, sample 8 at 7, and sample 9 at 5. The dilution factor (D×) varied across samples, with a dilution factor of 5 for samples 1, 2, 3, 5, and 7, 1 for sample 4, which indicated higher substrate concentration, and 10 for sample 6. The inoculum-to-substrate ratios were adjusted for each sample, with sample 1 having a 20-to-80 ratio, sample 2 a 30-to-70 ratio, and sample 3 a 50-to-50 ratio. Samples 4, 5, 6, 7, 8, and 9 all maintained a 30-to-70 ratio. These variations in pH, dilution, and inoculum ratio were tested to determine their impact on substrate degradation, VFAs production, and biogas yield, ultimately aiming to identify optimal conditions for the process. Figure 12 demonstrates the variations in pH, dilutions, and the ratios of inoculum to substrate and how they were affected over time.
The variations in inoculum-to-substrate ratio (I2SR), dilution factor (D×), and initial pH levels demonstrated distinct effects on pH trends over time. For the I2SR variable, all three conditions were conducted with an initial pH of 6.5 using a 5× diluted CW substrate. VAR I2SR 1 and VAR I2SR 2 showed a steady decline in pH across days 1 to 3, with an increase on day 4, indicating initial acidification with a slight recovery. In contrast, VAR I2SR 3 showed a gradual increase in pH over the first three days, with minimal change between days 3 and 4, suggesting a more stable environment. These differences highlight the influence of I2SR on microbial behavior and pH stability. In the D× variation, VAR D× 1 used a 1x diluted CW substrate with a 30–70 I2SR ratio and experienced continuous pH decline across all four days. VAR D× 2, with a 5× diluted substrate and the same I2SR, showed a similar drop for the first three days but rebounded slightly on day 4, resembling the pattern of VAR I2SR 2. Meanwhile, VAR D× 3, which involved a 10× dilution, showed an initial pH increase from day 1 to 2, remained stable on day 3, and slightly declined from 5.88 to 5.71 on day 4. The pH variation trials began with different initial values: VAR pH 1 started at 9.00, VAR pH 2 at 7.00, and VAR pH 3 at 5.00. VAR pH 1 showed a decrease followed by a rebound by day 4, while VAR pH 2 steadily declined until a slight increase on day 4. VAR pH 3 maintained relatively stable pH levels during the first three days before a significant increase on day 4, from 4.2 to 4.73.
Based on comparisons with recent studies, our findings provide both consistency and novel contributions. In continuous fermentation using synthetic cheese whey, the study by Factor-based Assessment of Continuous Biohydrogen Production from Cheese Whey [48] identified acetate and butyrate as primary fermentation products, with variable lactate and succinate formation. The study demonstrated that hydrogen yield, stability, and VFA profiles were closely linked to operational parameters such as retention time and organic loading rate. Similarly, our results show dominance of acetic and butyric acids under moderate dilution, and the observed succinate and lactate dynamics further emphasize the importance of process stability and parameter optimization. Regarding microbial community dynamics, Predicting Metabolic Pathways and Microbial Interactions in Dark Fermentation Systems Treating Real Cheese Whey Effluents [49] showed that Lactobacillus dominated carbohydrate consumption, while Clostridium sensu stricto 12 drove hydrogen production via electron-bifurcation reactions. Even though microbial sequencing was not conducted in our study, the observed shifts from propionate to acetate suggest functional convergence with Clostridium-mediated syntrophy, which will support our future microbial investigations. For control strategies to enhance hydrogen yield, a feedback control-based approach applied to acid cheese whey demonstrated improved hydrogen productivity by dynamically adjusting HRT and organic loading, with performance influenced by lactate-driven pathways [50]. Our controlled pH and dilution protocols are similar to this strategy, yielding comparable trends in hydrogen-favorable VFA profiles, particularly under buffered and moderately diluted conditions. In two-stage bioprocesses for hydrogen and polyhydroxyalkanoates (PHA) production, Biohydrogen and Polyhydroxyalkanoates (PHA) as Products of a Two-Step Bioprocess from Deproteinized Dairy Wastes [51] reported that acidogenic fermentation of deproteinized whey produced high hydrogen output alongside ~14 g/L organic acids, which were efficiently converted into PHA in a second stage. Our findings align with this VFA-rich effluent concept, which supports the applicability of VFA management strategies for downstream valorization. Finally, in combined bio-electrochemical systems, a two-stage hybrid integrating dark fermentation with microbial fuel cell technology achieved a threefold increase in hydrogen yield compared to standalone fermentation, driven by acetate–butyrate pathways, though acidification remained a limiting factor [52]. Our focus on controlling acidification through buffer management and dilution offers additional operational strategies to mitigate this limitation in coupled systems. Thus, these comparisons validate the effectiveness of our process design, demonstrate the importance of VFA management, and support the transferability of these strategies to continuous and two-stage systems for improved biohydrogen production and downstream valorization, such as PHA production.

4. Conclusions

The VFAs produced were mainly acetic acid, propionic acid, and butyric acid. DF1 and DF2 primarily produced acetic acid. Across all compared studies, acetic acid was the dominant VFA when using CW as a substrate. However, when food waste was used as the substrate, butyric acid was found in the highest concentrations, similar to DF1.1, which has batch mode, 5× diluted CW, and 30:70 I2SR, and also presented elevated butyric acid levels. DF1 demonstrated a strong ability to metabolize carbohydrates. VFA analysis showed the highest concentrations in DF1 were for acetic acid, butyric acid, and propionic acid. All of which are associated with hydrogen production. However, a spike in succinic acid was observed on days 10, 12, and 15, which is unfavorable for hydrogen production, as it draws away from pathways that promote acetate and butyrate synthesis. Acidification likely occurred after day 15 due to a sharp increase in lactic acid from zero on day 12 to 27.201 mMol on day 15. This may have resulted from overloading the system with organics via the 1× CW substrate. Over time in DF1, concentrations of desired VFAs (acetic, butyric, and propionic acids) decreased, while succinic and lactic acid levels rose, which decreased the system’s hydrogen-production capacity. This indicates that the high OLR from the 1× CW substrate caused a microbial shift away from hydrogen-producing pathways toward non-hydrogen-producing ones. On the other hand, using 5× diluted CW in DF2 helped mitigate acidification, which maintains low lactic acid concentrations. Hydrogen-producing pathways, especially acetic acid production, increased over time in DF2, and carbohydrate degradation was more efficient. The decreases in propionic and butyric acids may indicate their conversion into acetate, which is favorable. In batch mode DF1.1 (5× diluted CW), carbohydrate depletion was effective, and high concentrations of acetic, propionic, and butyric acids were observed, with butyric acid being the most abundant. Lactic acid levels decreased, indicating that the microbial community could consume it, thereby preventing accumulation and acidification. This demonstrates that increasing the HRT in continuous DF modes may help avoid organic overloading and improve system stability. Preventing lactic acid buildup is essential, as it requires more time for microbial conversion into VFAs. DF1.2’s pH analysis indicates that substrate dilution, I2SR, and initial pH significantly influence fermentation in batch DF systems. Initial pH dropped during days 1–3, showing active fermentation and VFA accumulation. VAR I2SR 3 and VAR Dx 3 showed increased pH, implying that a 50:50 I2SR or 10× diluted CW could reduce VFA production. pH spikes on day 4 for VAR I2SR 2, VAR Dx 2, and VAR pH 3 provide VFA consumption, allowing the microbial community to avoid acidification and favor hydrogen and acetate production. Thus, systems using more diluted CW or higher initial pH levels were less prone to acidification. Further VFAs and carbohydrates removal analyses are needed to establish relationships among parameters, pH, and VFAs production.
This study provides several valuable contributions. First, we conducted a systematic evaluation of dilution and inoculum-to-substrate ratios (I2SR), in contrast to many studies that tested only a single condition. By examining cheese whey dilutions (1×, 5×, 10×) and I2SR values (20:80, 30:70, 50:50), we generated comparative insights into how these parameters interact to influence VFA production, acidification stability, and hydrogen yields. Second, we identified the optimal conditions for hydrogen production, showing that moderate dilution (5×) combined with higher inoculum ratios stabilizes pH, reduces lactic acid accumulation, and promotes acetic-acid-dominated pathways favorable for hydrogen generation. Third, we investigated process stability and inhibitory compound dynamics. Our results demonstrated how carbohydrate utilization, SCOD fluctuations, and the accumulation of slow-degrading VFAs (e.g., valeric and isovaleric acids) affect microbial performance. Thus, these findings highlight operational strategies, including dilution control, pH buffering, inoculum ratio adjustment, and co-digestion substrate use that enhance both the quality and quantity of hydrogen and biogas production while minimizing inhibition. The study advances understanding of how feedstock preparation and operating parameters regulate VFA profiles and hydrogen yields in cheese whey fermentation, offering guidance for scale-up and process optimization in dairy waste-based biohydrogen production.
For future work, we identify those volatile fatty acids (VFAs) which are key intermediates in anaerobic digestion and dark fermentation, with their concentrations strongly influencing microbial metabolism and overall biogas production. Acetate and propionate are particularly critical, as acetate directly supports methanogenesis, while propionate must be efficiently converted to acetate and hydrogen to maintain substrate availability for methanogens. The interactions among VFAs such as propionate, butyrate, and valerate depend on cooperative bacteria that generate acetate and hydrogen, but imbalances, particularly propionate accumulation, can lead to acidification, inhibit methanogens, and reduce methane yield. To advance these findings, future studies will focus on optimizing propionate conversion to stabilize VFA profiles and prevent acidification, enriching microbial communities responsible for syntrophic VFA conversion through metagenomic and transcriptomic analysis, and applying advanced process control strategies such as pH buffering, optimized inoculum-to-substrate ratios, and controlled dilution. In addition, coupling VFA management with microbial electrolysis cells (MECs) or two-stage systems (dark fermentation plus anaerobic digestion) will be investigated to maximize hydrogen recovery and methane production, while scale-up studies in continuous and pilot-scale reactors will assess long-term stability and industrial feasibility. Ultimately, efficient propionate degradation and VFA stabilization are expected to maximize acetate availability, improve hydrogen turnover, and enhance methane production efficiency in anaerobic digestion systems.

Author Contributions

Conceptualization, H.-G.L.; methodology, H.-G.L. and Z.D.; graphics, H.-G.L. and Z.D.; validation, H.-G.L. and Z.D.; writing—original draft, H.-G.L.; writing—review and editing, H.-G.L.; supervision, H.-G.L.; project administration, H.-G.L. All authors have read and agreed to the published version of the manuscript.

Funding

This research received no external funding.

Data Availability Statement

The original contributions presented in this study are included in the article, further inquiries can be directed to the corresponding author.

Acknowledgments

Thanks to the Mayfield College of Engineering for their support, to Eunsung Kan and Gyucheol Choi, and to the College of Graduate Studies for funding.

Conflicts of Interest

The authors declare no conflict of interest.

References

  1. Salhotra, P.; Carver, J.L. Texas’ Water Infrastructure is Broken, Jeopardizing Quality and Supply for a Growing State. The Texas Tribune, 3 May 2023. Available online: https://www.texastribune.org/2023/05/03/texas-water-infrastructure-broken/ (accessed on 5 November 2024).
  2. Plainview Herald. Waco Sues Dairies to Get Relief from Pollution. Plainview Herald, 30 April 2004. Available online: https://www.myplainview.com/news/article/Waco-sues-dairies-to-get-relief-from-pollution-8958742.php (accessed on 5 November 2024).
  3. Ewusi-Mensah, N.; Logah, V.; Akrasi, E.J. Impact of Different Systems of Manure Management on the Quality of Cow Dung. Commun. Soil Sci. Plant Anal. 2014, 46, 137–147. [Google Scholar] [CrossRef]
  4. Rayne, N.; Aula, L. Livestock Manure and the Impacts on Soil Health: A Review, MDPI soil systems. Soil Syst. 2020, 4, 64. [Google Scholar] [CrossRef]
  5. Dadrasnia, A.; Muñoz, I.d.B.; Yáñez, E.H.; Lamkaddam, I.U.; Mora, M.; Ponsá, S.; Ahmed, M.; Argelaguet, L.L.; Williams, P.M.; Oatley-Radcliffe, D.L. Sustainable nutrient recovery from animal manure: A review of current best practice technology and the potential for freeze concentration. J. Clean. Prod. 2021, 315, 128106. [Google Scholar] [CrossRef]
  6. Meena, P.K.; Patane, P.M. Biohydrogen: Advancing a sustainable transition from fossil fuels to renewable energy. Int. J. Hydrogen Energy 2025, 100, 955–970. [Google Scholar] [CrossRef]
  7. Qureshi, F.; Kamyab, H.; Rajendran, S.; Vo, D.-V.N.; Rajamohan, N.; Yusuf, M. Unveiling the potentials of biohydrogen as an alternative energy source: Strategies, challenges and future perspectives. Mater. Today Sustain. 2025, 31, 101133. [Google Scholar] [CrossRef]
  8. Kanwal, F.; Torriero, A.A.J. Biohydrogen—A Green Fuel for Sustainable Energy Solutions. Energies 2022, 15, 7783. [Google Scholar] [CrossRef]
  9. Ahmed, S.F.; Rafa, N.; Mofijur, M.; Badruddin, I.A.; Inayat, A.; Ali, S.; Farrok, O.; Khan, T.M.Y. Biohydrogen Production From Biomass Sources: Metabolic Pathways and Economic Analysis. Front. Energy Res. 2021, 9, 753878. [Google Scholar] [CrossRef]
  10. Bertasini, D.; Battista, F.; Mancini, R.; Frison, N.; Bolzonella, D. Hydrogen and methane production through two stage anaerobic digestion of straw residues. Environ. Res. 2024, 247, 118101. [Google Scholar] [CrossRef]
  11. Mukherjee, T.; Senevirathne, N.; Kaparaju, P. Dark fermentative hydrogen production from sugar syrup at different temperatures and inoculum-to-substrate ratios. Int. J. Hydrogen Energy 2025, 102, 37–49. [Google Scholar] [CrossRef]
  12. Alvarez-Guzmán, C.L.; Rodríguez-Hipólito, F.; Chávez-Reyes, Y.; Valdez-Vazquez, I. Lignocellulosic biomass mixtures improve hydrogen production by promoting microbial complementation in a consolidated bioprocess. J. Clean. Prod. 2025, 489, 144691. [Google Scholar] [CrossRef]
  13. Sun, W.; Vasu, S.; Blais, M.S. Chapter 2—Fundamentals. In Machinery and Energy Systems for the Hydrogen Economy; Elsevier: Amsterdam, The Netherlands, 2022; Volume 9, pp. 11–30. [Google Scholar] [CrossRef]
  14. Yang, M.; Hunger, R.; Berrettoni, S.; Sprecher, B.; Wang, B. A review of hydrogen storage and transport technologies. Clean Energy 2023, 7, 190–216. [Google Scholar] [CrossRef]
  15. Aziz, M. Liquid Hydrogen: A Review on Liquefaction, Storage, Transportation, and Safety. Energies 2021, 14, 5917. [Google Scholar] [CrossRef]
  16. Medeiros, F.; Lopes, F.; Vasconcelos, B. Prospects and Technical Challenges in Hydrogen Production through Dry Reforming of Methane. Catalysts 2022, 12, 363. [Google Scholar] [CrossRef]
  17. Shahid, M.I.; Farhan, M.; Rao, A.; Hussain, M.S.; Salam, H.A.; Chen, T.; Zhang, Z.; Li, X.; Ma, F. Hydrogen production by waste heat recovery of hydrogen-enriched compressed natural gas via steam methane reforming process. Int. J. Hydrogen Energy 2025, 117, 374–392. [Google Scholar] [CrossRef]
  18. Karibe, H.; Sair, S.; Faik, A.; Ousaleh, H.A. Electrified steam methane reforming: A review of heating technologies, challenges, and prospects. Int. J. Hydrogen Energy 2025, 133, 200–213. [Google Scholar] [CrossRef]
  19. Lavoie, J.-M. Review on dry reforming of methane, a potentially more environmentally-friendly approach to the increasing natural gas exploitation. Front. Chem. 2014, 2, 81. [Google Scholar] [CrossRef]
  20. Mokhtarani, B.; Zanganeh, J.; Moghtaderi, B. A Review on Biohydrogen Production Through Dark Fermentation, Process Parameters and Simulation. Energies 2025, 18, 1092. [Google Scholar] [CrossRef]
  21. Sun, S.; Wang, X.; Cheng, S.; Lei, Y.; Sun, W.; Wang, K.; Li, Z. A review of volatile fatty acids production from organic wastes: Intensification techniques and separation methods. J. Environ. Manag. 2024, 360, 121062. [Google Scholar] [CrossRef]
  22. Liang, J.; Zhang, P.; Zhang, R.; Chang, J.; Chen, L.; Zhang, G.; Wang, A. Bioconversion of volatile fatty acids from organic wastes to produce high-value products by photosynthetic bacteria: A review. Environ. Res. 2024, 242, 117796. [Google Scholar] [CrossRef]
  23. Pandey, A.K.; Pilli, S.; Bhunia, P.; Tyagi, R.; Surampalli, R.Y.; Zhang, T.C.; Kim, S.-H. Dark fermentation: Production and utilization of volatile fatty acid from different wastes- A review. Chemosphere 2022, 288 Pt 1, 132444. [Google Scholar] [CrossRef]
  24. Chaitanya, N.K.; Chatterjee, P. Medium chain fatty acid production from CO2 in integrated dark fermentation-microbial electrosynthesis reactor. Bioresour. Technol. 2025, 426, 132371. [Google Scholar] [CrossRef]
  25. Syaichurrozi, I.; Hidayatullah, M.A.; Nurullah, A.; Suhendi, E.; Kustiningsih, I.; Susanti, D.Y.; Darsono, N.; Primeia, S.; Khaerudini, D.S. Enhanced biohydrogen production from palm oil mill effluent using single-stage process of dark fermentation and microbial electrolysis cell at various initial pHs. Renew. Energy 2025, 249, 123161. [Google Scholar] [CrossRef]
  26. Cardeña, R.; Buitrón, G.; Valdez-Vazquez, I.; Contreras, M. Biohydrogen production from cheese whey in UASB and packed bed reactors: Impact of microbial interactions on productivity. Int. J. Hydrogen Energy 2025, 141, 1061–1069. [Google Scholar] [CrossRef]
  27. Sarkar, O.; Rova, U.; Christakopoulos, P.; Matsakas, L. Continuous biohydrogen and volatile fatty acids production from cheese whey in a tubular biofilm reactor: Substrate flow rate variations and microbial dynamics. Int. J. Hydrogen Energy 2024, 59, 1305–1316. [Google Scholar] [CrossRef]
  28. Pandey, A.; Srivastava, S.; Rai, P.; Duke, M. Cheese whey to biohydrogen and useful organic acids: A non-pathogenic microbial treatment by L. acidophilus. Sci. Rep. 2019, 9, 8320. [Google Scholar] [CrossRef] [PubMed]
  29. Astals, S.; Esteban-Gutiérrez, M.; Fernández-Arévalo, T.; Aymerich, E.; García-Heras, J.; Mata-Alvarez, J. Anaerobic digestion of seven different sewage sludges: A biodegradability and modelling study. Water Res. 2013, 47, 6033–6043. [Google Scholar] [CrossRef] [PubMed]
  30. Song, C.; Bi, C.; Ma, C.; Shi, J.; Meng, Q.; Li, J.; Zhang, S.; Li, J.; Shan, A. Lactic acid bacteria mechanism of protein degradation in anaerobic co-fermentation of cabbage waste with wheat bran. Chem. Eng. J. 2025, 507, 160738. [Google Scholar] [CrossRef]
  31. Kontodimos, I.; Evaggelou, C.; Margaritis, N.; Grammelis, P.; Goula, M. Dark Fermentation and Anaerobic Digestion for H2 and CH4 Production, from Food Waste Leachates. Methane 2025, 4, 11. [Google Scholar] [CrossRef]
  32. Hussien, M.; Mohamed, H.O.; Jadhav, D.A.; Bahaa, A.; Jo, S.-M.; Jang, J.-H.; Kim, J.-H.; Kwon, J.-Y.; Sayed, E.T.; Abdelkareem, M.A.; et al. Synergistic integration of dark fermentation and microbial electrolysis cells for hydrogen production and sustainable swine manure treatment. Int. J. Hydrogen Energy 2025, 115, 299–309. [Google Scholar] [CrossRef]
  33. Harirchi, S.; Wainaina, S.; Sar, T.; Nojoumi, S.A.; Parchami, M.; Parchami, M.; Varjani, S.; Khanal, S.K.; Wong, J.; Awasthi, M.K.; et al. Microbiological insights into anaerobic digestion for biogas, hydrogen or volatile fatty acids (VFAs): A review. Bioengineered 2022, 13, 6521–6557. [Google Scholar] [CrossRef]
  34. Zhang, M.; Liang, G.; Zhang, X.; Lu, X.; Li, S.; Wang, X.; Yang, W.; Yuan, Y.; Jiao, P. The gas production, ruminal fermentation parameters, and microbiota in response to Clostridium butyricum supplementation on in vitro varying with media pH levels. Front. Microbiol. 2022, 13, 960623. [Google Scholar] [CrossRef]
  35. Liu, S.; Bischoff, K.M.; Leathers, T.D.; Qureshi, N.; Rich, J.O.; Hughes, S.R. Butyric acid from anaerobic fermentation of lignocellulosic biomass hydrolysates by Clostridium tyrobutyricum strain RPT-4213. Bioresour. Technol. 2013, 143, 322–329. [Google Scholar] [CrossRef] [PubMed]
  36. Selig, M.; Schröder, C.; Schönheit, P. Glucose fermentation to acetate, CO2 and H2 in the anaerobic hyperthermophilic eubacterium Thermotoga maritima: Involvement of the Embden-Meyerhof pathway. Arch. Microbiol. 1994, 161, 460–470. [Google Scholar] [CrossRef]
  37. Abedi, E.; Hashemi, S.M.B. Lactic acid production—producing microorganisms and substrates sources-state of art. Heliyon 2020, 6, e04974. [Google Scholar] [CrossRef]
  38. Lynd, L.H.; Zeikus, J.G. Metabolism of H2-CO2, methanol, and glucose by Butyribacterium methylotrophicum. J. Bacteriol. 1983, 153, 1415–1423. [Google Scholar] [CrossRef]
  39. Yonehara, T.; Miyata, R. Fermentative production of pyruvate from glucose by Torulopsis glabrata. J. Ferment. Bioeng. 1994, 78, 155–159. [Google Scholar] [CrossRef]
  40. Sirisangsawang, R.; Samaikaew, P.; Chotiviriyavanich, B.; Kitchaiya, P. Conversion of Sodium Lactate to Lactic acid and Sodium Hydroxide with Cation Exchange Membrane Electrolytic Cell. In IOP Conference Series Materials Science and Engineering, Proceedings of the 2020 3rd International Conference on Chemistry and Energy Research, Shenzhen, China, 23–25 October 2020; IOP Publishing: Bristol, UK, 2019; Volume 639, p. 12052. [Google Scholar] [CrossRef]
  41. Ai, B.; Li, J.; Chi, X.; Meng, J.; Liu, C.; Shi, E. Butyric Acid Fermentation of Sodium Hydroxide Pretreated Rice Straw with Undefined Mixed Culture. J. Microbiol. Biotechnol. 2014, 24, 629–638. [Google Scholar] [CrossRef] [PubMed]
  42. Oshiro, R. EPA Microbiological Alternate Test Procedure (ATP) Protocol for Drinking Water, Ambient Water, Wastewater, and Sewage Sludge Monitoring Methods, EPA-Engineering and Analysis Division (4303T), September 2010, EPA-821-B-10-001. Available online: https://www.epa.gov/sites/default/files/2015-09/documents/micro_atp_protocol_sept-2010.pdf (accessed on 21 January 2025).
  43. Zhang, P.; Chen, Y.; Zhou, Q. Waste activated sludge hydrolysis and short-chain fatty acids accumulation under mesophilic and thermophilic conditions: Effect of pH. Water Res. 2009, 43, 3735–3742. [Google Scholar] [CrossRef]
  44. Wainaina, S.; Lukitawesa; Awasthi, M.K.; Taherzadeh, M.J. Bioengineering of anaerobic digestion for volatile fatty acids, hydrogen or methane production: A critical review. Bioengineered 2019, 10, 437–458. [Google Scholar] [CrossRef]
  45. Hidalgo, D.; Garrote, L.; Infante, F.; Martín-Marroquín, J.M.; Pérez-Zapatero, E.; Corona, F. Targeted Acidogenic Fermentation of Waste Streams for the Selective Production of Volatile Fatty Acids as Bioplastic Precursors. Appl. Sci. 2025, 15, 5923. [Google Scholar] [CrossRef]
  46. Jalil, A.; Yu, Z. Impact of Substrates, Volatile Fatty Acids, and Microbial Communities on Biohydrogen Production: A Systematic Review and Meta-Analysis. Sustainability 2024, 16, 10755. [Google Scholar] [CrossRef]
  47. Deublein, D.; Steinhauser, A. Biogas from Waste and Renewable Resources: An Introduction; Wiley: Weinheim, Germany, October 2010. [Google Scholar] [CrossRef]
  48. Polettini, A.; Pomi, R.; Zonfa, T.; Gioannis, G.D.; Muntoni, A. Factor-based assessment of continuous bio-H2 production from cheese whey. Chemosphere 2022, 8 Pt 1, 136174. [Google Scholar] [CrossRef] [PubMed]
  49. Munoz-Paez, K.; Buitron, G.; Vital-Jacome, M. Predicting metabolic pathways and microbial interactions in dark fermentation systems treating real cheese whey effluents. Bioresour. Technol. 2024, 413, 131536. [Google Scholar] [CrossRef] [PubMed]
  50. Muñoz-Páez, K.M.; Vargas, A.; Buitrón, G. Feedback Control-Based Strategy Applied for Biohydrogen Production from Acid Cheese Whey. Waste Biomass Valorization 2022, 14, 447–460. [Google Scholar] [CrossRef]
  51. Colombo, B.; Calvo, M.V.; Sciarria, T.P.; Scaglia, B.; Kizito, S.S.; Adani, F. Biohydrogen and polyhydroxyalkanoates (PHA) as products of a two-steps bioprocess from deproteinized dairy wastes. Waste Manag. 2019, 95, 22–31. [Google Scholar] [CrossRef]
  52. Zonfa, T.; Kamperidis, T.; Falzarano, M.; Lyberatos, G.; Polettini, A.; Pomi, R.; Rossi, A.; Tremouli, A. Two-Stage Process for Energy Valorization of Cheese Whey through Bio-Electrochemical Hydrogen Production Coupled with Microbial Fuel Cell. Fermentation 2023, 9, 306. [Google Scholar] [CrossRef]
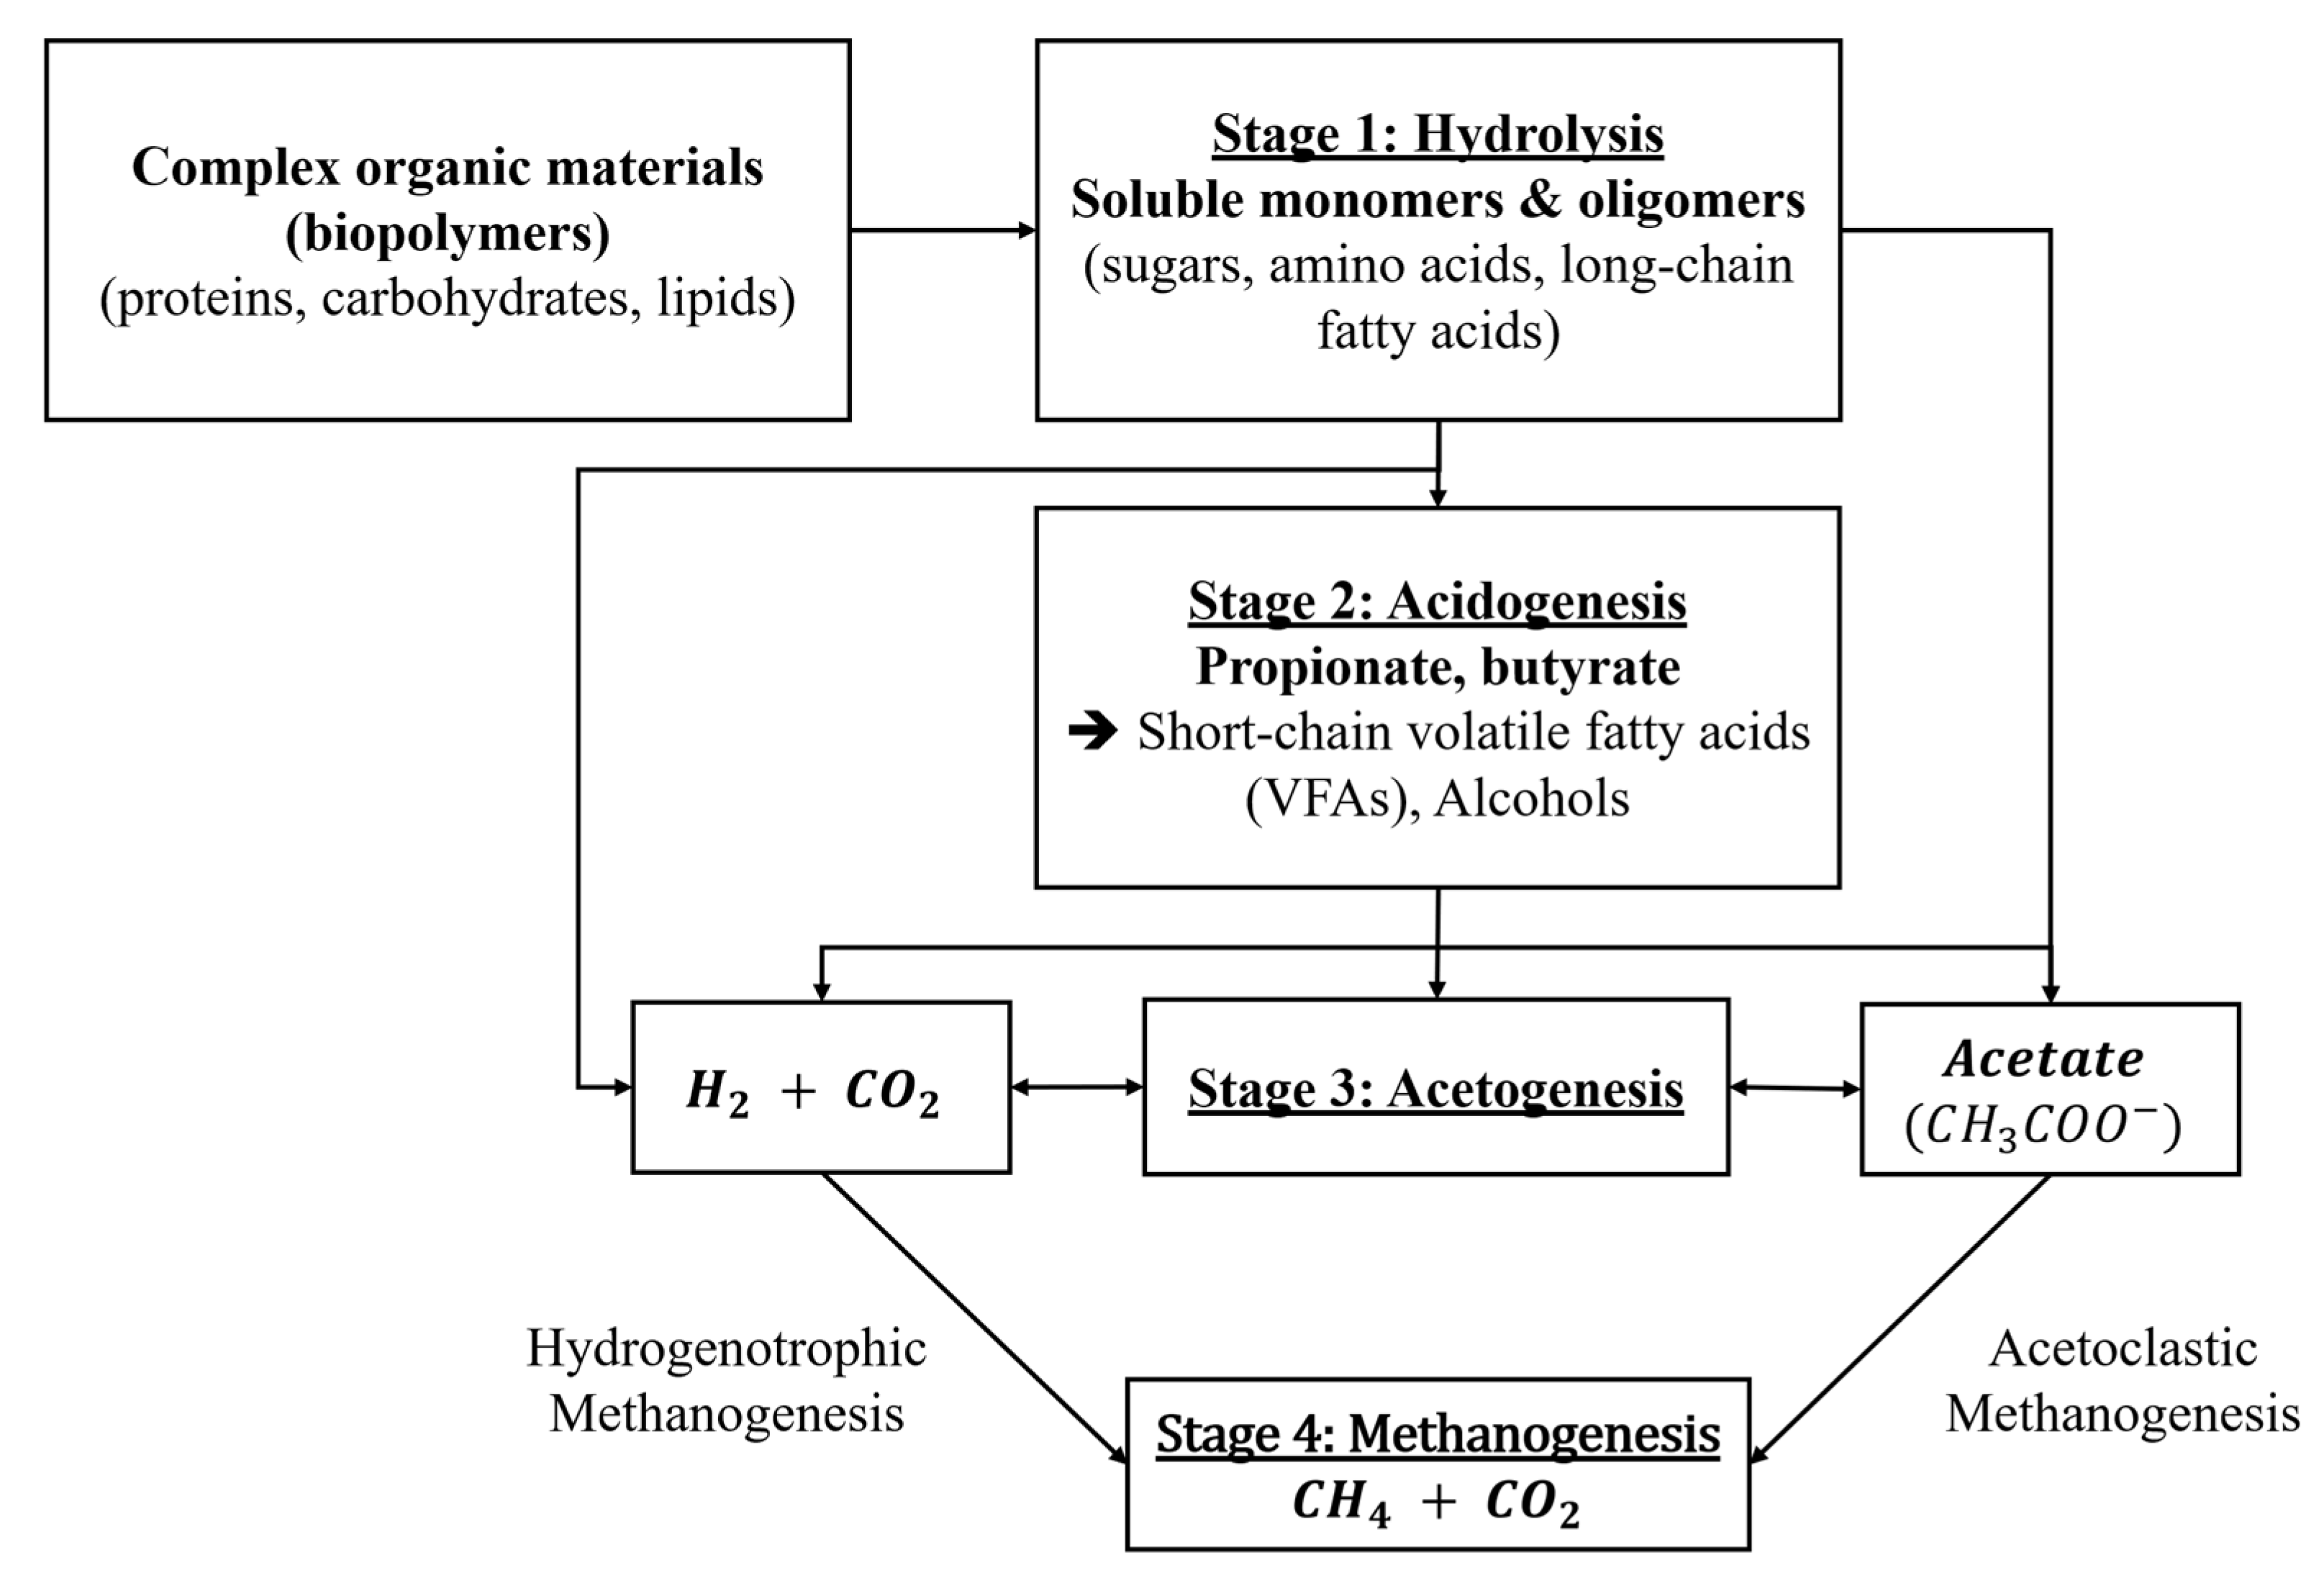
Figure 1. Simplified substrate degradation pathways in anaerobic waste degradation.
Biomass 05 00057 g001
Figure 2. Inoculum pretreatment and activation in Texas AgriLife Center.
Biomass 05 00057 g002
Figure 3. Continuous mode vessel and control system for pH, temperature, and agitation speed.
Biomass 05 00057 g003
Figure 4. Experimental setups and procedures for COD measurements.
Biomass 05 00057 g004
Figure 5. Experimental setups and procedures for solids characterization (TS, VS, TSS, VSS).
Biomass 05 00057 g005
Figure 6. Carbohydrate conversion: Comparative analysis of dark fermentation stages 1 and 2.
Biomass 05 00057 g006
Figure 7. Comparative analysis of dark fermentation using carbohydrates and SCOD as substrates.
Biomass 05 00057 g007
Figure 8. Influence of pretreatments on VFA production, and percentage of individual VFA under maximum production during dark fermentation 1 process.
Biomass 05 00057 g008aBiomass 05 00057 g008bBiomass 05 00057 g008c
Figure 9. Influence of pretreatments on VFA production, and percentage of individual VFA under maximum production during dark fermentation 2 process.
Biomass 05 00057 g009aBiomass 05 00057 g009b
Figure 10. Relationships between area and concentration for each compound.
Biomass 05 00057 g010
Figure 11. Influence of pretreatments on VFA production, and percentage of individual VFA under maximum production during dark fermentation 1.1 process.
Biomass 05 00057 g011
Figure 12. Variations in pH, dilutions, and the ratios of inoculum to substrate.
Biomass 05 00057 g012
Table 1. Cheese whey medium properties.
Cheese WheyTCOD (g/L)SCOD (g/L)Carbohydrates (g/L)
87.578.578.4
19.217.814.75
Table 2. Preparation of carbohydrate standards using varying concentrations for spectrophotometric calibration.
Concentration (mg/L)0100200
DW (mL)10.50
Standard solution (mL)00.51
Reagent A (mL)111
Reagent B (mL)555
Table 3. Cheese whey medium properties: TCOD, SCOD, and Carbohydrates.
Cheese Whey (Dilution)TCOD (g/L)SCOD (g/L)Carbohydrates (g/L)
87.578.578.4
19.217.814.746
Table 4. TS, VS, TSS, and VSS data.
g m L (TS)(VS)TSSVSS
Dilution CW (1×)0.61350.05510.007410.00731
CW (5×)0.10800.08890.001480.00146
CW (10×)0.05400.04530.000160.00015
Inoculum0.55380.28910.000740.00093
Table 5. Different batch experimental modes with variations in pH, dilution levels, and inoculum-to-substrate ratios.
SamplespHDilution (D×)Ratio of Inoculum to Substrate (I/S)
16.5520 to 80
26.5530 to 70
36.5550 to 50
46.5130 to 70
56.5530 to 70
66.51030 to 70
79530 to 70
87530 to 70
95530 to 70
Disclaimer/Publisher’s Note: The statements, opinions and data contained in all publications are solely those of the individual author(s) and contributor(s) and not of MDPI and/or the editor(s). MDPI and/or the editor(s) disclaim responsibility for any injury to people or property resulting from any ideas, methods, instructions or products referred to in the content.