1. Introduction
Although this report focuses on Nature’s biomass stocks and losses, the issue of increasing biomass energy to replace fossil fuels is also briefly discussed in context of other limitless energy sources, such as terrestrial heat pumps, geothermal energy, and restoration of compressed-air power from falling water in trompe systems or directly from the deeper subterranean. It seems a misguided policy or plan to redirect valuable crop residues or other organic resources from composts that need to be returned to soils, especially if this is under an argument to address the climate issues related to CO2 increases. With realization that most emissions are from topsoil loss, priority should be the return of carbon directly back to soils in a circular economy, using appropriate organic farm practices.
Some data presented herein are well established, others are newly unearthed, but, as always, it is proper and seemly to start revisions at the beginning—from “the ground up”.
Life on Earth is carbon-based, seemingly emerging in geothermal hot-springs on Land, as in Darwin’s prescient “
warm little pond” theory of origin, possibly with Montmorillonite clay catalysis, evidenced by fossil soils claimed to be dated to nearly 4 billion years and living entities on land for >3.5 billion years [
1,
2,
3,
4,
5,
6].
Evolving organisms faced extreme challenges of radiation and resource scarcity that gradually resolved when land plants emerged, spurring the Neoproterozoic Oxygenation Event (NOE) that released sufficient oxygen, O
2, for ozone, O
3, to form, blocking the Sun’s harmful UV-B radiation whilst fueling bountiful nutrient turnover in biomass (
Figure 1).
Atmospheric oxygen (O
2) increase is stoichiometrically interlinked to carbon dioxide (CO
2) removal in classic photosynthesis ↔ respiration equations, shown simplified here:
From the left the formula is carbohydrate photosynthesis; in reverse from the right is equal but opposite respiration/decomposition/incineration consuming biomass (
Figure 2).
Microbial decomposition or biomass burning have essentially the same mechanism as respiration, with net intake of oxygen (O
2) and release of carbon dioxide (CO
2) plus water (H
2O). Oxygen accumulated primarily due to land plants to a level of 21% O
2 in the air we now breathe, also fuelling soil decomposition. The question is: Where did the carbon go? The current study reviews and extends supporting evidence that, in 550 million years (Ma) ago, Phanerozoic carbon was mainly sequestered on land; initially in living biomass, accumulating in primal soil organic matter (SOM, e.g., humus or Darwin’s “
vegetable mould”), or sometimes fixed in anoxic sediments as peat, coal, oil, and other fossil fuels or non-fuel fossils, with a concurrent and constant recycling on land of vital biomass, then as now. How much carbon was fixed? Increasingly, our understanding is of substantial SOM sequestration, given the much higher early carbon dioxide levels around 550 Ma (
Figure 3).
As well as primordial Chloroplasts and Mitochondria as endosymbionts, early symbioses—as formed over 400 Ma between fungi and cyanobacteria/algae in the lichens of land’s Biocrust—were partnerships between fungi and plants with mycorrhizal fungi emerging as early as 500 Ma [
9]. This attests to biotic inter-reliance between taxonomic groups for synergy and survival. Moreover, fungi fruiting above-ground are considered soil-based, as indeed now are most land plants.
Related to fungi, particularly arbuscular mycorrhizal (AM) fungi, known previously as vesicular-arbuscular mycorrhiza (i.e., VAM), these are reported to consume up to 50% of the photosynthates from host plants. Such below-ground factors are often overlooked in biomass budgets and productivity models partly through oversight of soil basics and in part because the extent of ancient soil fungal syntheses are relatively recent discoveries.
Refs. [
10,
11] show an estimated 10–50% of the carbon captured by photosynthesis is transferred under-ground to the AM fungi, with earliest fossil symbioses from 250 to 400 million years ago (e.g., [
12]). Part of these nutrients are converted into glomalin, discovered only in the 1990s [
13], as a fungal hyphae/spore-derived glycoprotein that is tightly bound to soil particles, earning it the epithet of a “
super glue”. Strictly, it is part of a complex of difficult-to-extract compounds, including bacterial components and humic acids, all grouped under the term glomalin-related soil proteins (GRSPs), that may contribute an extra 4–52% to SOC tallies or, on average, about a third more [
14]. Ref. [
15] report that GRSP may account for 27% of total SOC, but in ancient oxidized soil (>4 Ma), GRSP was less at about 4–5% of total C, while in a peat soil purified GRSP was as high as 52% of the total SOC. Glomalin, or strictly GRSP, thus ranges between 4–52%, but averages may converge with extra SOC around 25–30% in most mineral soils. These large oversights are gradually being considered in soil carbon stocks tally.
Omission of glomalin-like protein products alone from carbon cycle budgets substantially reduces reality and representativeness of models, invalidating many conclusions or policies based upon those incomplete reckonings. It helps explain why many models fail.
1.1. Defining Biotic Biomass
The term Biomass is the quantity of material of organic origin present in a habitat or biome. It generally refers to living or recently dead organisms, plus any byproducts of those organisms be they virus, microbe, fungi, plant, or animal. In a different, though related, sense, it is applied to plant matter or animal waste used or intended as a source of fuel. In a strict sense, it refers to a single species in a limited habitat or, in the broadest view, it encompasses all organisms that are living or dormant, or dead (sometimes labelled Necromass), plus their specific products (e.g., GRSP). In addition to plant, fungal, or microbial exudates, products may include molluscs shells or earthworm calciferous secretions, plus eggshells, bones, etc.—which are generally (mis)classed as inorganic carbon in soil analyses. Biomass is usually expressed as mass for a defined area, or as density per unit area (for soil or land), or per unit volume (for aquatic or marine, often summarized per unit area too), these are averaged and typically multiplied by planimetrically flat area.
Measurements of biomass are obtained by two basic methods: Direct field sampling (cores or quadrats with flat surface areas taken perpendicular to the centre of the Earth), and via remote sensing (e.g., tower monitors, aircraft, or satellites). Mean values per unit area are extrapolated for biomes based upon simplistic model assumptions. Although planimetrically flat surface areas are appropriate for aquatic metrics, for the terrestrial realm, a manifest reality is of terrain with undulating topography overlain by rugosity of soils.
Whereas Ocean or Atmospheric tallies are reported to full depth or altitude, for some reason, Soil budgets are usually reported only for superficial layers, often just cm or m. Apart from true soil depth, other underappreciated factors are friable saprock and the extraction of recalcitrant glomalin/GRSP fractions, as is noted above and as detailed later.
Terrestrial values may be doubled for depth for inappropriately shallow samples and doubled again for topographical terrain [
16], plus other omissions added. A simple example is data from [
17] showing Earth’s living organic matter (biomass) dominated by autotrophic and photosynthesizing land organisms. Their total 2402 Gt dry weight for both above- and under-ground parts of plants is equivalent to 1201 Gt C biomass which, doubled for terrain, is ~2400 Gt C (>99.9% of Earth’s total). In context, their 0.08 Gt C Ocean Phytomass (plant biomass) is 30,000 times smaller.
1.2. Soil Organic Carbon (SOC)
In addition to Phytomass, Soil Organic Carbon (SOC), comprising approximately half of all complex biochemicals in Soil Organic Matter (SOM), is used as a standard measure of soil biomass. Biomass is either rapidly recycled or stored and progressively consumed, decomposed, eroded, burnt, thawed, or drained—both naturally or via human activities. When considered in its entirety, the SOC stock often accumulates over varying timescales and is held to depth in several interlinked and intergrading SOC storage sub-categories:
Biomass that is actively living and is then mostly recycled within short time periods;
Mineral soils (with <17% SOC) that store humic carbon when there is insufficient Nitrogen or other limiting factors for completed digestion by microbes (this inferred from poor agriculture that adds excess N, rapidly depleting the humic SOM stocks);
Permafrost frozen to depth with seasonally thawed topsoil (with permafrost peats);
Non-permafrost peats that are waterlogged and too oxygen-deficient for rapid decay;
Fossils/fuels formed from the geological-era, anoxic accumulation of SOM products;
Sediments washed from watersheds or leached in Dissolved Organic Carbon (DOC).
Like others, ref. [
18] demonstrated soils hold the largest biogeochemically active carbon pool on Earth, albeit they noted SOC estimates ranged six-fold, from 500 to 3000 Gt C (now by factors at least ×10). Their six-fold SOC increase is interesting as it is less than a modest 4–6-fold increase invoked, and as criticized, in a meta-analysis by [
16]. Similar wide errors pertain to other biomass estimates and metrics, with ranges differing inordinately, attesting to our ignorance of the basics of soil data.
Soil ecological data are so remarkably obscure that values presented by many authors may differ by an order or two of magnitude, often subsequently revised upwards. For example, the global SOC stocks’ range reported by [
19] was 504–3000 Gt SOC; but ranges were 1417–25,000 Gt SOC (×18) due to a statement by [
20] that “
the global SOC stock to 100cm soil depth is estimated at 1417 Pg C” compared to best estimates (with terrain) of >8000–25,000 Gt by tables 10 and 12 in ref. [
16]. Already, without terrain, errors were manifest in mineral soil underestimations up to seven times [
21], Permafrost by 200% or three times [
22]—these base values since doubled by [
16]—and total Peat SOC was further doubled [
23,
24,
25]. Roots are underestimated up to 100% [
26] and, for litter, ref. [
27] found: “
litter stocks based on observations (68–97 Gt C) or models (47–196 Gt C)”. Mainly soil Bacteria have uncertainty, as with most other Microbiota, up to 10-fold [
28]. For Net Primary Productivity (NPP), estimates were 2–5 times higher, accounting for below-ground dynamics [
29]. Ref. [
30] discuss disparities in both satellite and model assumptions with “
range of two orders of magnitude in field-measured NPP” [my bolding]. Noting that “
Soils provide humans with 98.8% of our food”, ref. [
31] had soil erosion with a rate of loss “
unsustainable at 10–1000 times higher than the rate at which soils form” and [
32] posited global land use change as ×4 greater than previously estimated. Ref. [
33] had soil↔air CO
2 flux estimates varying 25–450 Gt C/yr, and discrepancy of SOC loss oxidation during erosion were 0–100% [
34]. Preindustrial SOC emissions before 1850 range 48–540 Gt C (e.g., [
35] and table 7 in ref. [
36]) while post-industrial data also vary with conversion from natural ecosystems to SOC-depleting farmland supposedly releasing 50–200 Gt C to the Atmosphere [
34,
37]. These and many other examples of wide uncertainties in a range of vitally important soil properties or rates of change attest to an urgent need for thorough review.
Despite recent initiatives such as GBIF, SoilBON, GSP, the Global Fungi Database (
https://globalfungi.com/, accessed on 11 November 2024), or an Earth Microbiome Project (
https://earthmicrobiome.org/, accessed on 11 November 2024), data deficits are surely due to the lack of a dedicated, peak “Soil Ecology Institute” comparable to myriad Marine or Atmospheric Facilities, to compile and coordinate basic research/education in both natural and managed soils. This oversight is further highlighted by data deficiencies and uncertainty to the most basic of soil metrics, as these are indeed highlighted in the present study.
1.3. Biosphere and SOC Stock
Disparity in an unjustifiable overemphasis of marine compared to soil research is manifest in the most recent estimates of living biomass and abundance data (
Figure 4).
Since plants are now accepted as being soil-based, Soil inarguably supports the most living biomass for the whole Biosphere. In
Figure 4, biomass of >100 Gt C (>99% of total) is terrestrial, found almost entirely within, or is supported by, Soil; the lesser ~1 Gt C (<1%) biomass is only partly marine, viz., Fish, Arthropods (marine), and Cnidarians (corals/jellies), while, the majority of Viruses—by far the most numerous of any organism—are also from soils ([
38] and in prep.). Nematodes are mostly terrestrial, but are not particularly abundant nor weighty, barely above meagre whales, miniscule at 0.01 Gt C (
https://ourworldindata.org/grapher/global-whale-biomass, accessed 11 November 2024), having much lower ecological or economic influence than Annelid earthworms that are now raised in both abundance and biomass ×20 as detailed in Results.
In overall context, the Biosphere is a relatively minor carbon component (
Figure 5).
1.4. Global Carbon Stocks and Net Primary Productivity (NPP) Cycle
Herein, global estimates of biomass in terms of carbon stocks from cyclical turnover and processing of atmospheric CO
2 (i.e., NPP fixation and decay) are updated from summaries of annual carbon cycle sources and sinks on a global level provided by the Global Carbon Project (GCP:
https://globalcarbonbudget.org/, accessed on 11 November 2024), their most recent published in December, 2023 (GCB 2023—
https://essd.copernicus.org/articles/15/5301/2023/, accessed on 11 November 2024) [
40]. In addition, comparison is with UN’s Intergovernmental Panel on Climate Change (IPCC) Working Group periodic Assessment Reports, the two most recent being WG1 AR5 [
41] and AR6 [
42].
Biogenic carbon is stored for varying periods in biomass before re-circulation via three main active reservoirs: Gasses in the Atmosphere, in solution (or debris) in the Ocean, or both gas and liquid but mainly solid matter in Soil, as summarized in
Figure 6.
Global carbon stocks from latest [
40] report are: Atmosphere—885 Gt C; Ocean—700 Gt C as dissolved organic carbon (also ~37,000 Gt in dissolved inorganic carbon that is mainly deep and inaccessible, inactive, and thus largely irrelevant); and Soil—3100 Gt C (they have as 1400 Gt C in Permafrost + 1700 Gt C in “
Soils”) as herein revised. For the Biosphere, they cite terrestrial Vegetation as 450 Gt C, vs. Marine biota just 3 Gt C (i.e., >99.3% vs. 0.6% of total living biomass), but these biomass data also require revision.
Regarding primary productivity, it is notable that unrepresentatively narrow arrows for land flux indicate 130 Gt C/yr in gross primary production drawdown with a matching 130 Gt C/yr in total respiration/decomposition, mainly from soils. As explained later, this implies an NPP rate of (130/2 =) ~65 Gt C/yr. The further impression, that the ocean has a similar but lower exchange of 80 Gt C/yr (implying 40 Gt C/yr NPP?), is not active photosynthesis nor respiration; rather, it is passive gas exchange governed by Henry’s law (as shown explicitly in the AR5 and AR6 report Figures that follow shortly below).
Ocean NPP is truly reported as quite low: E.g., tables 5 and 6 in ref. [
17] have Ocean NPP at (60/2 =) 30 vs. land NPP at (172.5/2 =) 86 Gt C/yr. Siegenthaler and Sarmiento figure 1b in ref. [
43] had Ocean NPP just 10 Gt C/yr compared to Terrestrial NPP of ~50 Gt C/yr converted into “
soil and detritus”, or five times as much on land (they also show soil decomposition plus deforestation releasing more than ×10 emissions from fossil fuels!). Moreover, ref. [
44] had marine NPP at ~55 and Continental NPP double at ~116 Gt C/yr. These land NPP rates, doubled for terrain (as is justified in Results sections below), are (86 × 2 =) 172, (50 × 2 =) 100, and as high as (116 × 2 =) ~232 Gt C/yr that exceeds a terrestrial NPP of 218 Gt C/yr in table 15 in Ref. [
16].
Artificial simulation models failing to address such basic NPP discrepancies surely fail.
Figure 1a,b in ref. [
43] have atmospheric CO
2 from Preindustrial to 1990 levels with a cumulative land-use effect deficit of −120 Gt C divided equally between loss of vegetation and of soil carbon. An increase from 600 to 750 Gt C, or an extra 150 Gt C added, was likely due to poor soil management relating to land clearing and agrichemical overuse as major causes of SOC depletion and of CO
2 accumulation.
Soils are thus already “officially” demonstrated as the greatest organic carbon stock (>3000 Gt SOC) and both greatest sink and source of CO
2 from respiration/decomposition mismatch of GPP at ~130 Gt C/yr, or an order of magnitude above ~10 Gt C/yr fossil fuel emissions. The present study confirms models of SOC stocks and terrestrial NPP are inordinately underestimated with recalculated values in tables 10, 12 and 15 in ref. [
16] of >8580–25,000 Gt SOC and of >218 Gt C/yr terrestrial NPP, further refined herein.
Ref. [
40] data compare with those in earlier [
42] report (
Figure 7).
Figure 7 of [
42] has land NPP of ~71 Gt C/yr corresponding to values implied by [
46] and by figure 2a in ref. [
47] who also have 142 Gt C/yr terrestrial GPP they say represents a 35% increase since 1900 due mainly to the CO
2 greening effect. A corresponding rapid increase in atmospheric CO
2 estimated in this same period (1900–2020) is from 280 to 412 ppm, or a similar 32% rise. The inability of NPP to entirely accommodate this rise, as would be expected, is attributable in a large part to net erosional loss of topsoil and humus with other limiting factors (e.g. temperature, moisture) reducing the plants’ ability to adapt or to fully utilize this otherwise limiting CO
2 carbon resource that is fundamental to photosynthesis.
Concomitantly, global loss of topsoil biomass emits more carbon per year than do fossil fuels. Interestingly, the AR6 [
42] Report accepts that melting of ancient Permafrost adds CO
2 to the Atmosphere, which is depleted in isotopic carbon similar to burnt fossil fuels when they say: “
thawing soils due to anthropogenic warming are losing carbon from the decomposition of old frozen organic matter, as found via
carbon 14 (14C) signature of respiration at sites undergoing rapid permafrost thaw”. It is an oversight for IPCC not to readily accept that rapid erosion and loss of ancient mineral soil, formed over millions of years and similarly depleted in
14C isotopes, is also a major contributor to atmospheric CO
2.
Permafrost was divided by AR6 into “
surface or deep”, plus non-permafrost soil in the boreal region (of 280–340 Gt C, median 300 Gt C), possibly alluding to peatlands that are mostly excluded from the IPCC report for some reason. It is claimed that ∼300 Gt of permafrost region soil carbon is stored in peat, which must not be counted twice in peatland estimates ([
18,
48]), as is discussed later. Yet, IPCC do accede that “
Peat soils, where thick organic layers build up due to saturated and anoxic conditions, represent another possible source of carbon to the atmosphere. Peats could dry, and decompose or burn as a result of climate change in both high (Chaudhary et al.
, 2020) and tropical (Cobb et al.
, 2017) latitudes, and in combination with anthropogenic drainage of peatlands (Warren et al.
, 2017). Peat carbon dynamics are not included in the majority of CMIP6 ESMs.” This is confirmed by GCB (2023 supplement—
https://essd.copernicus.org/articles/15/5301/2023/essd-15-5301-2023-supplement.pdf, accessed on 11 November 2024) [
40] saying: “
Bookkeeping models do not directly capture carbon emissions from the organic layers of drained peat soils nor from peat fires. Particularly the latter can create large emissions”. Along with the land NPP underestimations, Peat too is thus a major omission from their models.
The AR6 summary compares to an earlier AR5 report [
41] where Ocean values are the same, although those for Soil, Permafrost, and Vegetation differ (
Figure 8).
Note that natural gas “
reserves” in [
41] range 383–1135 Gt C, mainly in methane (CH
4) that is also a biomass breakdown product. Ref. [
49] have methane emissions from thawing Permafrost alone at around ∼0.5–2 Gt C/yr, which is a sizable contribution and may itself possibly be doubled to account for terrain factors up to 4 Gt C/yr, matching the atmospheric CO
2-C increase. Nevertheless, despite its substantial importance, natural gas is not considered further in the current study of biomass stock.
The reasons why an Ocean inventory includes dissolved organic carbon (DOC at 700 Gt C) and dissolved inorganic carbon (DIC at ~38,000 Gt C) but not the Soil’s is unclear as soil inorganic carbon (SIC/DIC) plus soil’s DOC, as well as being substantial, are reactive. Ref. [
50] say: “
Inorganic C as soil carbonate (2255 Pg C down to 2 m depth) and as bicarbonate in groundwater (1400 Pg C) together surpass SOC (2400 Pg C) as the largest terrestrial C pool”. An update by [
51] claims soil inorganic carbon is slightly higher, but only by about 50 Gt C, with 2305 ± 636 Gt SIC to 2 m soil depth. Arguably, these values are doubled, not least for depth if not terrain, as in the Results below.
In addition, dissolved organic carbon (DOC) estimate is 7.20 Gt in the top 0–30 cm and 12.97 Gt in the 0–100 cm soil profile, increasing as Permafrost melts [
52,
53]. For soils >1 m, this total value likely doubles to >26 Gt DOC and a possible terrain factor may double this value again to around 52 Gt DOC. Nevertheless, it is likely DOC is already included in the SOC results, depending on sampling, treatment, and measurement of actual soil samples, so its separate reporting is ambiguous.
1.5. Soil Depth and 3D Area Sampling
As just noted above, unlike atmospheric or oceanic inventories that are entire, Soil carbon stocks are often inexplicably and unrealistically measured (or at least mostly reported!) in only the top 20–30 cm or perhaps the top metre or so, and Soil Survey soil depth is often to just 1 or 2 m. This is unrepresentative as Peat can be 200 m deep, Permafrost 1.6 km, and mineral soils up to 3.1 km with global mean soil depth 13.1 m blending into underlying bedrock often with several metres (mean ~8 m?) of friable saprock (table 5 in refs. [
54,
55]) Furthermore, ref. [
56] noted that sedimentary deposits in lowlands generally exceed the 2 m depth limit of most soil surveys. In general, soil sample cores are taken perpendicular to the centre of the Earth (as clearly stated in [
16]) and values extrapolated based upon planimetrically flat land biomes. Land is yet sloping and is manifestly hilly at macro-scale, plus soil is certainly bumpy and rugose at micro-scales. Factoring in full Soil depth and terrain, ups both carbon stocks and terrestrial NPP rates considerably.
In soil sampling, assuming that randomly representative and replicable methods are properly employed, stones are routinely removed or sieved and are reported separately, as are roots, earthworms, and other larger biotic inclusions that may, or may not, be measured. For this reason, separate estimates for roots and for earthworms are provided herein.
As a starting point for review,
Table 1 has unrefined land data in IPCC/GCB reports.
A soil carbon starting point from [
40] tracks back to figure 6 in ref. [
57] with 1700 Gt C in “
Permafrost” and 1500–2400 Gt C in “
Soils” to total 3200–4100 (median 3650) Gt SOC, somewhat higher than [
42], but their highest value is less than half that in [
16]. Nevertheless, “official” (IPCC/GCB) soil carbon stocks in
Table 1 are 2900 and 3100 for a median baseline value of about ~3000 Gt SOC.
For NPP, “official” IPCC/GCB values of 60–70 (median: 65) Gt C/yr are inadequate given recent raising to 80 Gt C/yr by [
58] and up to 100 Gt C/yr by [
59]; both are lower than ~220 Gt C/yr as justified in [
16].
The next few sections review SOC and NPP status quos before refinement in Results.
1.6. Previous SOC Stock Evaluations
A comprehensive study by table 6 in ref. [
18] allocated soils thusly:
Mineral soils (0–2 m deep)—1263 Gt SOC;
Permafrost (0–2 m)—466 Gt SOC;
Peatland (in permafrost region, 0–2 m)—116 Gt SOC;
Peatland (non-permafrost, 0–2m)—427 Gt SOC;
Soils, permafrost, and peat (at 2–3 m depth)—498 Gt SOC allocated thus: 199 for mineral soils, 207 for permafrost region (with half peat?), ~92 for peatland;
Additional deep SOC deposits (>3 m)—330–550 Gt, median 440 Gt, allocated: 300–500 (median: ~400 Gt) in permafrost region (ambiguous about including peat that they limited to mean depth of 2.3 m?), ∼30–50 (~40 Gt) in tropical peatlands;
Sediments to depth elsewhere, e.g., deltas, floodplains, loess deposits—unknown.
Although these data are complex, they may be summarized as Mineral soils (0–3 m) with (1263 + 199 =) 1462 Gt SOC; Permafrost (0 to >3 m) with (466 + 116 + 207 + ~400 =) 1189 Gt SOC; and non-permafrost Peat (0–2?) with (427 + 92 + ~ 40 =) 559 Gt SOC. Total peatland peat plus Permafrost peat would be about (559 + 116 =) 675 Gt C. Soil carbon in its entirety was thus ~3210 Gt SOC to 3 m depth, excluding substantial “unknown” deep sediments. This is only slightly higher than the IPCC and GCB baseline value above of ~3000 Gt SOC.
For the vast Permafrost region alone, ref. [
60] had 1672 Gt C and reported deeper sediments with 407 Gt C in >3–25 m Yedoma deposits and 241 Gt C in Permafrost delta alluvia >3 m to add another (407 + 241 =) 648 Gt SOC. This is greater by 248 Gt C than ~400 Gt SOC Jackson et al. estimated for deeper than 3 m. Added to Jackson et al.’s Permafrost total gives the frozen region, to depth, about (1189 + 248 =) 1437 Gt SOC. Despite claims by [
19] for just peat in Tundra and Tropics >3 m deep with 1672 Gt C and 11 m deep with 89 Gt C, respectively (= 1761), this most certainly is an error mainly referring to Permafrost, as is discussed further in the Peat section below.
A later Permafrost evaluation of up to 2000 Gt C by [
49] is, for some reason, ignored in “official” carbon reports (e.g., [
40]. Yet, an important point is that superficial Permafrost totals of 1672 or 1189 Gt SOC in the boreal region are close to 1700 or 1200 Gt SOC that are reported by [
41,
42]; thus, they seemingly include some boreal peat in Permafrost, while apparently omitting non-Permafrost peat as a separate entity. This is a major oversight as will be shown by revision of the extent of global peatland carbon stocks. As a crosscheck, areas of peatlands or bogs in Permafrost, in temperate regions, or in the Tropics are defined separately in table 7 in ref. [
17] in an extensive, yet overlooked, study of Earth’s Phytomass and NPP.
Nevertheless, in summary, Jackson et al.’s SOC pool to 3 m was 2800 Gt C plus >3 m adds >500 Gt to total >3300 Gt SOC (possibly an extra 500 Gt for Permafrost?). Conversely, figure 2C in ref. [
61] had SoilGrid values adding to 4595 Gt, and table 5 in ref. [
62] to just 0–2 m depth, from WISE and SoilGrid data sets, was 1000 higher than Jackson et al. at 4305 Gt SOC, questioning validity of a baseline ~3000 Gt SOC.
1.7. Comparison of SOC with Erosion Losses and a Fermi Estimate
As just shown, ref. [
40] from [
42] baseline median value of ~3000 Gt SOC is at odds with a contemporary summary of other accepted estimations by figure 2A in ref. [
61] or table 5 in ref. [
62] with up to 4595 Gt SOC to just 2 m depth.
Albeit 3000–4595 Gt total SOC stocks, doubled for full soil depths and then for terrains (as per [
16],) now range ~12,000–18,400 Gt C, these too are not fixed as all are subjected to constant, and increasing, net erosion. Ref. [
63] said “
The global magnitude of SOC erosion may be 1.3 Pg C/yr. by water and 1.0 Pg C/yr. by wind erosion” to total 2.3 Gt SOC/yr that, when doubled for terrain, is likely >4.6 Gt C/yr or approximately the same as 5.2 Gt C/yr excess CO
2 claimed by GCB (
Figure 6). Nevertheless, GCB readily admits their budget “
is incomplete and uncertain because SOC erosion is not accounted for”.
Most soil factors must be multiplied for depth and terrain, plus other refinements, as indeed in the re-evaluations of the current study as presented in Results. As all initial data are based upon planimetrically flat biome areas, when properly doubled for terrain and topography (except for waterlogged peats, sediments, and deltas), likely totals approximate as ((3300 − 675) × 2 + 675 peat =) ~6000 Gt SOC. Doubled again to allow for subsequent calculations to deeper depths for soil, Permafrost(?) and Peat (noted later) is 12,000 Gt SOC, plus a reasonable third for glomalin (also explained later) is closer to 15,000 Gt SOC. Wang et al. have a mean of 4305 Gt SOC that, if treated similarly, would be much higher.
Upper global values of 12,000–25,000 Gt SOC were already speculated in Blakemore (tables 10 and 12 in ref. [
16], table 9 in ref. [
64]), although these publications are mostly overlooked. Most simplistically, a “Fermi Estimation” to be refined in more detail later, from an “official” baseline SOC estimate to a couple of metres depth of ~3000 Gt SOC, adding a third glomalin/GRSP is ~4000 Gt, saprock adds >25% for ~5000 Gt; doubled for depth and then again for terrain gives a best-guess global total value of around 20,000 Gt SOC.
1.8. Comparison of Total Living Biota Biomass and Extinction Losses
For Vegetation in
Table 1, rather than 450 Gt C as reported by AR6 [
42] and [
40], the AR5 [
41] median was 550 Gt C that almost corresponds to [
16] and figure 2A in ref. [
61] that are both explicit that this is for “
above-ground” vegetation at 500–560 Gt C, which, as pointed out by Blakemore (2019—Science eLetters, 2 December 2019 RE: Soil Carbon and Biomass: Flat Out Wrong?) [
65], when properly doubled for terrain is >1100 Gt C. Additionally, below-ground plant roots are also substantial, almost equivalent to above-ground plant biomass likely around 1000 Gt C (as justified in [
16] and examined further below). This gives about 2100 Gt C in the global plant standing stock, mainly on land, which almost agrees with the earlier full-depth value modified from data in Rodin et al. of 2400 Gt C. Comparably, reports show Ocean biota at just 3 Gt C biomass (0.15% of total, less yet when soil biota and other terrestrial organisms are fully upgraded for land area).
Thorough inventories of global biomass abundance and species biodiversity are important for understanding basics of ecological and hence economic realities of production and consumption, but also to track any changes or threat of irreversible extinctions. Five major global extinction events seemingly occurred, prior to our current situation of mass biotic loss, this time mainly from the soil due to bad agriculture, excessive meat consumption, and soil acidification from fertilizer overuse, plus general poisoning of soils, and hence our food, and secondarily of the air and water, with toxic agrichemicals and other pollutants. Soil erosion with SOM/biomass loss is a global issue of concern as is soil acidification—also mostly from agrichemical excess—as a major, albeit mostly ignored, problem (cf., [
50,
66]). Acidic mineral soils are antagonistic to healthy biological processes therefore SOC production is lower and biota lesser.
That there is an extinction crisis and loss of biota (and hence biomass) may be realized in the Living Planet Index showing a −69% decline in populations of certain species since 1970 (
https://ourworldindata.org/grapher/global-living-planet-index, accessed on 11 November 2024). Species loss especially applies to soil organisms such as land plants, invertebrates and microbes that, despite being mostly ignored, are subject to intense threats or pressures [
67]. Issues of biomass and biodiversity loss will be discussed in Results with proposals on how to reverse these, mainly via restoration of 100% organic husbandry with composting, all under the principals and practices of Permaculture [
68] and a more “
Circular Economy”. A corresponding and irrefutable realization is that economic or financial Economy is entirely subordinate to well-balanced, natural Ecology.
1.9. Comparison of Land NPP Estimates & Mystique of Historical Marine NPP
For NPP values noted above, seemingly all Ocean (over-)estimates (e.g., IPCC, ESSD, etc.) track back to table 6 in ref. [
69] based “
in part after HUTCHINSON (1954)” that was “
too uncertain to allow any definite conclusions”. Ref. [
70] had NPP on land of just 20 ± 5 Gt C/yr, saying these figures were too low as they failed to account for tropical rainforests(!). Ocean NPP was claimed to be six times greater at 126 ± 82 Gt C/yr; he said was likely “
an order of magnitude too high”. These mystical, widely speculative NPP figures (126 vs. 20 Gt C/yr for Ocean vs. Land) appear to originate from [
71] itself tracking back to preliminary reports as early as [
72].
Ref. [
73] found Ocean NPP “
incredible” and determined its NPP just ~15 Gt C/yr. Whereas [
74]—an oft quoted data source—had similar NPP contributions from terrestrial 56.4 Gt C/yr (53.8%) and oceanic 48.5 Gt C/yr (46.2%) components, their Ocean productivity was nearly halved in estimates made before 1970’s satellite data. Land calculations for flat surfaces, properly doubled for terrain, would amount to ~113 Gt C/yr. Alternatively, since NPP is now shown to be around 220 Gt C/yr, then a four-fold increase is warranted and may be justified. Moreover, ref. [
74] cogently noted: “
Because of the rapid turnover of oceanic plant biomass, even large increases in ocean NPP will not result in substantial carbon storage”. Their average Land NPP was 426 g C/m
2/yr, whereas Ocean almost a quarter of this at 140 g C/m
2/yr (for flat surface areas!).
In an earlier comprehensive study, table 5 in ref. [
17] refined Ocean NPP to 30 Gt C/yr and Continental NPP to 86 Gt C/yr (which when doubled for terrain is 162 Gt C/yr). Later, table 5 in ref. [
75] had marine NPP as 24.8 Gt C/yr and terrestrial just 52.8 Gt C/yr, whereas [
43] gave marine production of 10 Gt C/yr compared to terrestrial NPP of 50 Gt C/yr, or five times greater.
That land NPP is now much higher at ~220 Gt C/yr as the current report demonstrates, is due mainly to new data for soil respiration plus terrain factors. Compared to this, there is little evidence for Ocean NPP much above 10–25 Gt C/yr supporting its total biomass of only around ~3 Gt C, nor of any direct interaction between the Atmosphere and marine photosynthetic gas exchange. As [
76] state: “
The turnover time of water masses, which transport CO2 into the deep sea in polar regions, where the CO2 is released at lower latitudes, is of the order of a thousand years (650 year in the Atlantic to 2000 in the Pacific)… Increased atmospheric CO2 will only slightly affect the CO2 level in the oceans, since the latter contain 55 times more CO2 than the atmosphere. Thus there will be no feedback based on increased atmospheric CO2, or at most very little)”. They add: “
The average annual primary production of the world oceans of 30 gigatons carbon”, but this may be too high.
Rather than 30–50 Gt C/yr as claimed, reports above are of lower Ocean NPP of just 10–30 Gt C/yr and an oceanic DOC pool of only 0.2 Gt C. However, ref. [
77], citing 660 Gt DOC in the Ocean, say: “
With this fast turnover, the pool’s contribution to carbon sequestration is inconsequential”. Moreover, sea↔air gas exchanges are passive and instantaneous, governed by Henry’s Law. Hence, Ocean overstated importance to global CO
2 or O
2 cycles, albeit highly speculative, are relatively minor. In figures 5,4b in ref. [
33], terrestrial NPP is 114 Gt C/yr and air↔leaf flux −400–750 Gt C (i.e., ±350 Gt C/yr) and, as they explain: “
the gross ocean fluxes largely cancel out” (net: ∼±2.5 Gt C/yr). Hence, much promoted “
Blue Carbon” climate proposals are unrealistic, impractical, speculative solutions that lack true grounding, as indeed [
78] concur.
Increasing evidence for higher Land vs. Ocean NPP is also provided by [
79], who doubled terrestrial Rubisco to about 0.7 Gt (96%) vs. 0.03 Gt (4%) in marine environments. Doubled again for terrain, if commensurate with NPP, equates to Ocean NPP reduced to just 5–10 Gt C/yr. This is discussed further in the Results section.
1.10. Comparisons of Turnover Times (τ) for Atmospheric Carbon Support Higher Land NPP
Ref. [
80] stated: “
Our analysis suggests that current estimates of global gross primary production, of 120 petagrams of carbon per year, may be too low, and that a best guess of 150–175 petagrams of carbon per year better reflects the observed rapid cycling of CO2” [my bolding], i.e., an NPP rate > 80 Gt C/yr. Other “official” counts have higher NPP too; e.g., ref. [
81] has “
a total global terrestrial NPP of around 100 PgC yr−1”. Support for relatively higher terrestrial NPP also comes from isotopic studies of the atmosphere and the turnover time to recycle all 890 Gt C of atmospheric CO
2 carbon, e.g., by [
46,
82,
83]. Most recently, ref. [
59] admit wide underestimation with a latest “
best estimate” of terrestrial GPP of ~170–200 Gt C/yr (=NPP on land of 85–100 with median of ~93 Gt C/yr). Terrestrial gross flux they quantified to 550±60 Gt C/year, falling in the range reported in the literature of 200–660 Gt C/year, to give turnover time for atmospheric CO
2 (828 Gt C/550 Gt C/yr GPP =) 1.5 years. Despite ignoring terrain, their table 2 in ref. [
84] shows already calculated land GPP (200 Gt C/yr) more than twice Ocean GPP (91 Gt C/yr), or NPP 100 vs. 45.5 Gt C/yr, proving already realized Soil:Sea disparity.
However, ref. [
59] oceanic component claimed as 90–120 Gt C/yr GPP (or 45–60 Gt C/yr NPP) is likely overstated since, as detailed above, there is little evidence for Ocean NPP much above 5–10 Gt C/yr. Thus, their ocean NPP estimates may be overblown by up to 50 Gt C/yr, which, when logically carried over to land, ups their (flat!) land NPP range to 120–150 Gt C/yr, approaching 218 Gt C/yr NPP from [
16].
Confirmation of Land as the major influence is confirmed by [
59] turnover times of 1.2 yr vs. 1.8 yr in the North vs. the South, or 50% more rapid with more landmass—the southern hemisphere having 50% less green landscape than in the North.
Earlier, ref. [
80] gave approximate NPP, PR, and SR rates of >80 Gt C/yr with fossil fuel (FF) contribution only ~11%. Other counts similarly trend towards a Land estimate, with terrain, of 218 Gt C/yr (as in [
16]) thereby reducing fossil fuel emission to 4–5% of total contribution (Ocean emissions are negated).
Using C and O isotopes [
46,
59,
80,
82,
83] give CO
2 carbon turnover times of 0.9–2.8 yrs (median ~1.8 yrs), mainly due to terrestrial activity. Compared to [
59], the earlier figures by [
80] estimated 475–897 Gt C/yr and atmospheric C turnover time of 0.9–1.7 yrs (mean 1.3 yrs). With just ±80 Gt C/yr passive exchange from the Ocean then, presumably, 395–817 Gt C/yr (mean ~600) is on Land and all 875 Gt C in CO
2 processed in ~1.5 yrs. As they say: “
plausibly, the fast response can be accounted for by revising global GPP upwards.” Plausibly of doubling of NPP to allow for a terrain factor would likely ratify this in most current carbon cycle models.
Concomitant with an increase in realistic NPP is upping of global terrestrial biomass, SOC, and other carbon factors, as further refined in revisions presented below in Results.
2. Materials & Methods
Land measurements are generally at larger scales, often hectares (ha) or, most refined, perhaps at m2. As justification for terrain measurements at progressively finer scales, it is noted that many biological processes act at the cellular or microbial levels, and solar irradiance is measured in the langley (1 g-calorie/cm2), a sun (100 mW/cm2), or in kcal/cm2, corresponding to individual photosynthetic leaf surface areas that are also on average at cm2 scale. Soil aggregate particles and soil microbial assays are at a microscale.
Reasonable assumptions for most biotic samples are that moisture content is about half (i.e., 50% for dry weight but often hydration is somewhat higher); for dry samples, a carbon content is near half again. Soil organic matter (SOM) follows the Van Bemmelen factor modified by [
85] based on the determination that organic matter in most cases is ~50% carbon. Biomass carbon [
86] took as half average soil prokaryotic dry cell weight. This is tolerable as [
87] showed bacterial dry weight about half the cell weight, and C content about half again.
Net primary productivity (NPP) on land—sometimes called Biomass Productivity—is generally about half gross primary productivity (GPP) to allow for respiration from autotrophic plant respiration (PR), and it is often equivalent to heterotrophic (mainly soil microbial) decomposition (SR). A complication is that soil respiration often measures root respiration too, which may need to be accounted for separately. Expressed in terms of carbon amassed or exuded per year (Gt C/yr), the formulas, when Nature is in synchronous balance, are:
Rather than Pg C as some sources, the current report like [
28,
40], etc., standardizes to gigatonnes (10
9 tonnes) expressed as Gt C or Gt C/yr.
A conversion factor of 2.12 Gt C per ppm atmospheric CO
2 complies with figure 10-5 in ref. [
41]. Thus, 420 ppm today (in 2024) is about the same as 890 Gt CO
2-C in total.
Website URLs were accessible and current at the time of publication, but any defunct links or subsequent changes may often be tracked using the Wayback Machine (
https://web.archive.org/itself, as accessed earlier on 4 December 2024).
In this refinement review, global values that ignore soil to full depth and do not factor in the reality of terrain (at macro-scales) nor rugosity (at micro-scales) are recalculated. Other soil omissions, particularly relating to collection and handling of samples, the measurements of GRSP, and allowance for full soil depth, are corrected and totals are updated.
3. Results and Discussion
This report aims to refine, update, or correct data omissions in [
16,
38,
64] as summarize in the Introduction and shown graphically in
Figure 9.
3.1. Soil Respiration Upgraded
Soil and litter respiration/decomposition (SR) is through root (autotrophic ~50%) and microbial (heterotrophic ~50%) respiration as calculated by [
89] at ~110 Gt CO
2 C/yr they said is about ten times fossil fuel emissions. This is the same as 111 Gt C/yr that figure 5 in ref. [
33] modelled for total soil respiration. More recent value ranges have been 68–101 Gt C/yr [
90], or 78–108 Gt C/yr [
91], these latter authors found the mean SR a bit higher at around 107 Gt C/yr. Reasonably doubled for neglected terrain, SR is then in the bounds of 220 Gt C/yr, with possibly 50:50 from root respiration vs. microbial decomposition. This is more than ×20 the release of CO
2 carbon from burning of fossil fuels currently of around ~10 Gt C/yr. Consequently, as NPP ≈ SR, the raising of NPP to ~220 Gt C/yr gains justifying support.
In
Figure 9, total Soil Respiration (SR) of ~100–220 Gt C/yr implies similar ~100–220 Gt C/yr Plant Respiration (PR) to total ~200–440 Gt C/yr balancing GPP in equation GPP ≈ (PR + SR). The mostly natural soil respiration/decomposition (SR) rate of 220 Gt C/yr, as already noted, is over ×20 fossil fuel emissions of 9.4 Gt C/yr, nearly matched by 9.2 Gt C/yr SOC loss largely from poor farming methods, plus ~3.2 from vegetation clearance/desiccation to sum ~12.4 Gt C/yr. With Fire (4–8 Gt) and land-use-change (LUC ~12.4 Gt) give 16–20 Gt C/yr Land emissions, or twice that released from burning of fossil fuels.
3.2. Scope of Biomass Carbon Stock
Biomass stocks or turnover rates are verified from on-the-ground sample measurements, but insight into their origin may be derived from geological inventory estimates of atmospheric carbon and oxygen levels in the primal atmosphere. Plausibility of raised land carbon stock determinations are then calibrated against past carbon drawdown.
Is higher soil carbon justifiable? As noted in the Introduction, early atmospheric levels changed due to carbon drawdown of the Neoproterozoic Oxygenation Event (NOE). Published studies update error values, with a CO
2 range 1500–20,000 ppm and a median value of ~8000 ppm around 540 million years ago (Ma) when fungi and other microbes were likely abundant, but land plants had barely established a toehold (
Figure 10).
Compared to
Figure 10A atmospheric CO
2 median of 8000 ppm 540 Ma, figures 5–17 in ref. [
93] had a higher median CO
2 of up to 10,000 ppm. At current CO
2 values near 420 ppm, the difference from a median range of 8000–10,000 ppm converted to mass (× 2.12) implies >16,000–20,000 Gt C removed in toto. This would be a likely minimum value as CO
2 has been constantly added during the last 500 million years from volcanic and other processes that would have also been drawn down by land plants. IPCC (2013: Figure 6.1 ref. [
41]) show volcanic emissions of 0.1 Gt C/yr (or strictly 0.02 to 0.05 Gt C/yr due to vulcanism) that, if constantly multiplied through millennia, would amass an enormous amount of excess carbon, albeit this is more than offset by “
Rock weathering” with a 0.4 Gt C/yr flux of dissolved inorganic carbon (DIC) derived from the weathering of CaCO
3, which takes up CO
2 from the atmosphere in a 1:1 ratio. Both these fluxes are themselves possibly cancelled out by net loss from soils to rivers of 1.7 Gt C/yr, and then from rivers to sea of ~0.8 Gt C/yr of which it is estimated about half is organic and half inorganic carbon. These rates are derived from the sources in
Figure 6,
Figure 7 and
Figure 8. Therefore, net ~20,000 Gt SOC fixation, matching a Fermi Estimation above, is a most modest receptacle evaluation.
Before soils fulfilled their potential, oxidation saturation of Ocean and Atmosphere occurred; analogous is the current research effort situation needing to be redirected to Soil. Ref. [
94] show an average for each 1.0 ppm CO
2 increase brings a corresponding loss of 2.15 ppm of atmospheric O
2, and the reverse likely holds true. A rough, “back-of-envelope” calculation of ratio of C:O
2 for current 1,200,000 Gt O
2 (from table 5 in ref. [
76]) means that most was due to terrestrial photosynthesis as figure 14 in ref. [
95] implies but realizing that land debris does not fossilize as readily as in an anoxic Aquasphere). Then, from molecular weights of 12/32, over 100,000 Gt SOC was fixed in soils with much since fossilized (if submerged) or eroded to the sea. At three times the current Ocean carbon total, this further endorses Land’s great magnitude.
Figure 10B of O
2 levels allows a simple stoichiometric crosscheck. After Ocean and Lithosphere sinks were saturated, this gas began to fluctuate with net atmospheric accumulation. From median (dark line) starting value 540 Ma shown at about 18% and current level being 21%, this is a 3% increase or, proportionately, +16%. Since the mass of atmospheric oxygen today is about 1.2 million Gt, this 16% would equate to about 150,000 Gt O
2 added following photosynthetic removal of the carbon atoms from CO
2. Given that carbon molecular weight (molar mass) is about 0.27 of total CO
2, then the presumed corresponding drawdown of carbon would roughly equate to (150,000 × 0.27 =) 40,500 Gt SOC.
A likely range of C sequestered, from CO2 and O2 inventories, is then between 16,000–40,500 Gt C with a median terrestrial drawdown value around 30,000 Gt SOC in toto.
Inventory of total fossil fuel stocks (coal, oil, gas) estimated at 5000–10,000 Gt C ([
88],
https://earthobservatory.nasa.gov/features/CarbonCycle, accessed on 11 November 2024), if subtracted, gives a most modest balance of 18,000–23,000 Gt C arguably stored in ancient soils, Permafrost, Peat and as biomass in standing stock—mainly on land—plus carbon sediments variously eroded to freshwater, or as net losses to the Ocean.
3.3. Refinement of Soil Carbon Stocks (Terrain, Depth, Glomalin, Saprock)
Major refinements of biomass SOC stocks are for terrain, depth, glomalin, and saprock. Terrain increases those terrestrial values presented on planimetrically flat biomes [
16]. Other considerations are biomass stored at depth in soil and effect of soil depth on the estimations of NPP or respiration, plus contributions of glomalin and other difficult-to-extract biotic protein products. To date mostly overlooked, these factors are slowly being budgeted, in both biomass stocks and primary production estimates.
3.3.1. Soil Depth Considerations—Just Scratching the Surface
It is becoming increasingly realized that soils are extraordinarily ancient and deep. Ref. [
96] questioned “
How Deep Is Soil?” and, on page 601, noted: “
The lower boundary of soil is difficult to determine precisely, so the Soil Survey Staff (1992) recommended that, for convenience, the lower limit of soil be considered to be at a depth of 2 m” [my bolding]. Yet most samples are still for only 20–30 cm or, at most, a metre or so.
This is manifestly inadequate as [
97] estimated 56% more SOC storage in the top 3 m of soil than in just the first metre, readily justifying doubling of superficial sample results. Ref. [
98], in soils up to 5 m deep, found that layers below 90 cm accounted for approximately 80%, while the 0–30 cm layer represented only 10% of total SOC stored (i.e., ×10 for >30 cm). As noted in the Introduction, in Western Australia, ref. [
21] had SOC values up to five times greater in soils at a depth > 1 m down to 35 m deep. Thus, mere depth doubling is also a modest outcome.
Although often assumed or repeated that soils are only a metre or two deep, a summary by table 5 in ref. [
54] has: “
The mean absolute DTB [Depth to Bedrock, hereafter as DtB]
predicted was 33.6 m” but a Mean and Maximum Absolute DtB shown was 13.1 m, and soil was up to 3.1 km deep in two USA samples, not for Peat nor Permafrost—this for mineral soils (for details and email exchange with authors, please see—
https://vermecology.wordpress.com/2024/02/20/dtb-2/, accessed on 11 November 2024).
For Peat, the deepest currently reported is perhaps in Phillipi, Greece, at 190 m and dating largely from the Pleistocene [
99]. Permafrost is known to extend as much as 1.6 km and also date to the Pleistocene (often referred to as the Ice Age) from 2.5 Ma or the Holocene from about 11,000 years ago. Mineral soils are allegedly much more ancient, some fossilized in rocks from over 4 billion years old [
12], but mostly forming since 500 Ma ago. Thus, soils are proven to be both ancient and deep.
Although [
18] had a caveat that their ~3300 Gt total SOC estimates could be as much as 700 Gt C smaller due to a revised depth to bedrock (DtB) by [
56], this may be a wide underestimation. Jackson et al. do not give DtB estimates, but, for China alone, mean DtB was 42.20 m in a study by [
100], whereas mean values predicted by [
56] and figure 10b in ref. [
54] were just 11.81 m and 26.64 m, respectively. This suggests the Pelletier model DtB is about half of Shangguan et al.’s model, itself about half of the Yan et al. model. Thus, rather than reduced, Jackson et al.’s figure may truly be doubled (or possibly quadrupled?), for greater depth, possibly to as much as >6600 Gt SOC!
An effective depth of Peat vs. Permafrost peat is discussed further in the Peat section.
Ref. [
101] discovered depth is lacking from about half of the papers they surveyed. Moreover, the depth of the soil studied halved in the past 30 years. They said that, for a more complete understanding of soil processes, soil properties, and microbial communities, soils should be studied to a greater depth. This is attempted herein; hence, extrapolation from superficial results to account for full depth of soil profiles seems entirely appropriate and reasonable, albeit water tables influence deeper soils.
Since soils are shown to be tens or thousands of metres deep, shallow samples are no longer tenable. Although quite justified, as with terrain, the mere doubling for soil or peat depth may be a most modest outcome, albeit this is routinely applied in the present work.
3.3.2. Bedrock/Saprock Additions—Digging Deeper
A recent study by [
55] found soil penetrates friable saprock and may extend profiles +8 m deeper. If widely applicable, this may extend the mean Depth to Bedrock (DtB) of ~13 m, to a new total depth approaching (13 + 8 =) 21 m.
Recent reports by [
55,
102] estimated an extra 26–30% of carbon stored in weathered bedrock beneath soil; these latter authors had “
up to 8 m, for a total soil depth of more than 10 m”. It seems, however, that they were misled by the assumption soil is only 2 m deep, rather than 13 m deep on average as noted herein. Ref. [
102] had also claimed: “
up to 30% of OC was stored in saprock (friable weakly weathered bedrock)”. These authors suggest an extra 200 Gt or more land carbon, which may be a minimum were this too doubled for terrain to at least 400 Gt SOC. However, if mineral SOC is ~10,000 Gt, adding 26–30% for saprock may possibly yield an extra ~2600–3000 Gt SOC. In other words, adding 400–3000 Gt SOC is a wide range of saprock values that needs further refinement. For now, the lower value is applied.
The relevance of saprock for Permafrost, or Peat overlying lignite beds, is unknown.
3.3.3. Glomalin Unstuck with Glomalin Related Soil Protein (GRSP)
As already covered in the Introduction, a summary paper by [
103] confirmed that glomalin-related soil proteins (GRSP) represent ca. 20% of the soil organic carbon and aid carbon sequestration by stabilizing soil aggregates. For farmlands, USDA (
www.ars.usda.gov/ARSUserFiles/30640500/Glomalin/Glomalinbrochure.pdf, accessed on 11 November 2024) had: “
Glomalin accounts for a large amount (about 15 to 20%) of the organic carbon in undisturbed soils”. Possibly, degraded farmland soils suffer depleted fungal activities since, as noted in the Introduction, ref. [
15] report higher values of GRSP accounting for around 27% of total SOC. In an ancient, oxidized soil (supposedly >4 million years old), it was less at about 4% of total C, whereas in a peat, purified GRSP was as high as 52% of total SOC. The “Rillig et al.
2000” reference from He et al. appears to be mistaken, but another paper by [
104] does have 52% glomalin in a peat, viz.: “
GRSP accounted for 25% and 52% of total C in the mineral soils and organic soil [peat],
respectively”. This implies an allowance for difficult-to-extract glomalin in measured Peat SOC may (always?) be doubled. It was shown that GRSP can contribute about 27% of SOC while soil humus may contribute only 8%; thus, carbon capacity of GRSP is 2–24 times that of soil humus [
12]. The GRSP status of Permafrost is uncertain and urgently requires greater depth of study as, if it is similar to Peat, its contribution is not insubstantial. For mineral soils, adding of about +25% seems reasonable.
Conversely, ref. [
105], while admitting some studies at that time indicated glomalin as high as +27% in SOC, claimed 0.7 to 2.4% appear more common for Agroecosystems. This may be partly true for intensive, agrichemical fields, which are depleted in both humus and soil biota (as reported by [
67]). Their understanding suggested values much above 2% of SOC were unreasonable based on NPP they calculated would be required to support AMF hyphal growth (in their Appendix II). In other words, if glomalin was as high as reported, NPP models would need to be modified. This is not a proper Scientific approach as data should be followed, regardless of any ideal model outcomes. Since glomalin often measures at 30% or up to 52% of SOC, what they unwittingly support is need for terrestrial models to be substantially increased, perhaps as herein, to recognize NPP up to, or much above, >220 Gt C/yr. See too the Rubisco study.
Current information is scant and based upon few studies, but confirmation of the importance and contribution of GRSP to total SOC as outlined in [
103] are found in a case study by [
106] showing GRSP (in total?) in cropland and forests making up 24% and 18% of the 20–25 g/kg SOC, respectively. They reported total GRSP accounted for 8.19%–73.70% of SOC totals in the forest soils and 4.33%–86.11% in croplands, while easily extracted GRSP was obviously less, at 1.00%–10.38% or 1.09%–12.37%, respectively. This demonstrates that glomalin is a non-trivial SOC addition. Their summary figure gives an indication of respective Fungal-to-Bacterial ratios (
Figure 11).
A recent study by [
107] found glomalin particularly important in (fungal dominated?) acid soils of coniferous forests that are abundant in the boreal North.
3.4. Case Study of Soils Downunder in Australia: Increases ×30 (From ~30 Gt to >900 Gt SOC)
Despite no definitive estimate of its true total land surface area, it has been assumed that Australia with low mountain ranges and eroded soils gains little from terrain. Yet, on the ground observations are of sloping, undulating land with rugose topsoil overlays that, as elsewhere, clearly demonstrate the Continent is misrepresented as being mirror-flat. This topography ups the soil surface area and hence extrapolations. Regarding soil depth, of special note, in table 5 in ref. [
54] for “Oceania (i.e., mainly Australia) a mean DtB is 33.36 m. This is supported by [
21] sampling to depths of 35 m in WA and and (
https://link.springer.com/content/pdf/10.1007/s11104-022-05627-7.pdf, accessed 11 November 2024) also in SW Australia, finding soils up to 29 m deep.
Then a question is: How much carbon is truly in Australian soils? The CSIRO’s Soil Carbon Mapping Project [
108] provides national-scale representation of an average amount of organic carbon of Australian soil at 29.7 t/ha and total for the whole Continent at 24.98 Gt SOC, but only in the top 30 cm. This was recently updated very slightly by [
109] to 27.6 Gt SOC. Doubled for neglected terrain, then again for depth (at least!) is about 110 Gt SOC stock, plus ~25% GRSP and ~25% saprock would total ~165 Gt SOC as a minimum value likely to be increased further.
Although raised four times, this is a minimum value if [
77] are correct that 0–30 cm layer represents only 10% of total (flat land) SOC, hence a true figure may be (~30 × 10 = 300 × 2 for terrain and +50% for glomalin + saprock =) 900 Gt SOC!
Flaws in the argument by [
105] for dismissing or diminishing glomalin as both a significant and important part of Australian soils are already discussed.
Moreover, this is remnant soil since an estimated >50% of original topsoil SOC lost in intensive Australian cropping systems essentially, the SOC has been mined (
https://www.tropicalgrasslands.info/public/journals/4/Historic/Tropical%20Grasslands%20Journal%20archive/PDFs/Vol_44%20(1_2_3_4)/Vol%2044%20(3)%20Chan%20%20McCoy%20P%20184.pdf, accessed 11 November 2024). Australian agricultural soil 0.3 m deep have 12.7 Gt SOC, doubled for depth then terrain alone is just ~52 Gt SOC remaining. If proper organic farming restored this back to >100 Gt SOC in agricultural soils, SOC would be stabilized with equivalent drawdown of −25 ppm CO
2. Further details on options for re-greening Australia and Tasmania, citing Count Strezeleki’s original 1830’s data, are presented by Blakemore (2023 “Biotic SOC Stock: What We Had & What We Lost. ”
https://veop.wordpress.com/2023/04/14/volume-6/, accessed 11 November 2024) [
64] noting fossilized tree-kangaroos in the Nullarbor (“No trees”) Plain in WA that is now entirely arid desert rather than the lush forest that once must have enveloped the landscape from Cape York southwards.
Pertinent to this “
Green Carbon”, ref. [
109] estimated Australian and global marine-based
“Blue Carbon” at 0.35 and ~32 Gt C, respectively, mainly in mangroves and seagrasses that do not gain ground from terrain. Neither do they gain much from depth as, incredibly, rather than 0.3 m as for soils, their incomparable values were for a 1 m depth. It may be noted that 32 Gt marine C is only ~0.1% of total terrestrial SOC stocks. Moreover, as this report clearly shows, our main global concern is rather “
Brown Carbon”.
3.5. Total Global Soil SOC Refined
As provided for in the Introduction, estimations for global soils differ widely, due in part to overlap between precise biome definitions, due to inadequate allowance for full depth (now >13–21 m on average), and neither for terrain factors nor for analysis errors.
Soils occupy some 12 Gha on a conventionally flat landscape of 15 Gha that is not ice-covered nor arid desert, now raised up to 24 Gha soil on 32 [
16]. Estimates of global SOC, as noted, generally circulate around ~3000 (
Figure 6,
Figure 7 and
Figure 8). As [
110] summarize: “
The global SOC stock of ice-free land contains about 1500–2400 Pg C [Pg = Gt]
in the top 1 m, 2300 Pg C in the top 3 m, and 3000 Pg C in the soil profiles”. Higher values by figure 2C in ref. [
61] of SoilGrid values to 4595 Gt C (not 1500 Gt C as they stated—see [
65]) and by table 5 in ref. [
62] of SOC at 0–2 m depth from latest WISE and SoilGrid data sets ranging 2815–5796 Gt C with a median value of 4305.5 Gt C. Thus, the selection range for a reasonable baseline starting value is anywhere between ~2815–5796 Gt SOC.
Although almost any interim value from the wide range given could be taken as a starting point for refinement, a modest median value is perhaps around 3600 Gt SOC. [This, coincidentally, agrees with a mean SOC value in IPCC (2013) as shown in
Table 1.]
Doubled for depth and then again for terrain gives a total 14,400 Gt SOC, plus a third glomalin to total more than 19,000 Gt SOC plus +25% saprock sum up to ~23,750 Gt SOC.
Conversely, since glomalin and saprock are calculated as additions to baseline value, from ~3600 Gt SOC, adding a third for glomalin/GRSP is 4800 Gt, plus +25% for saprock is 6000 Gt, then doubling for both depth and terrain gives approximately 24,000 Gt SOC.
For proper analysis, total values may be divided into major constituents. Specifically, SOC stocks are broadly sub-divided between mineral soils, Permafrost, Peat, plus living soil Biota. These are treated separately in the following sections for comparative purposes.
3.5.1. Mineral Soils
Mineral soils are formed from biotic weathering of parent rocks and are primarily composed of inorganic material usually defined as having less than 17% living SOC compared to “Organic soils” like Peat (not to be confused with the carbon-enriched soils as found on organic farms). According to the Soil Classification Working Group, organic soil horizons may contain >17% SOC (or >30% of SOM) by weight, and these occur in Organic soils, or may be present at the surface of mineral soils. All soils are living entities, and a precise definition of a mineral soil is “A soil consisting predominantly of, and having its properties predominantly determined by, mineral matter. It usually contains <20% organic matter [i.e., <10% SOC] but may contain an organic surface horizon up to 30 cm thick”. Permafrost is perhaps entirely (or mostly?) excluded from this definition except where discontinuous or sporadically intergrading thus possibly overlapping with other soil types, including Peat.
Mineral soils are most productive for forests, woodlands, pasture, or farmland. Total mineral SOC is difficult to determine accurately but can be calculated from best estimates or deduced from a total global SOC tally, less defined Peat and Permafrost components.
Perhaps a reasonable starting point is [
18] who explicitly account for mineral soils with 1263 Gt SOC up to two metres depth plus 199 Gt SOC in 2–3 m deep soil (with zero below this, thus omitting deeper delta, alluvia, or loess) to total (1263 + 199 =) 1462 Gt SOC. Doubled for depth, and again for terrain is 5848 Gt SOC. Adding 25–30% glomalin/GRSP is ~7000 Gt SOC plus 26% saprock C possibly sums to total 8650 Gt SOC. Interestingly, this is similar to an estimated total in [
16] of 8580 Gt SOC.
These are the most conservative totals as other calculations of basic mineral soil SOC are higher. For example, tables S1,S2 in ref. [
111] for global “
mineral soil” (excluding tundra, peatlands, and deserts) for what they call “
topsoil” (<0.3 m) plus “
subsoil” (0.3–1.0 m depth only!) from SoilGrids of 1401–1765 Gt SOC, with median value about 1583 Gt SOC. This is above mineral soils in Jackson et al. to fully 3 m depth (1462 Gt SOC) but seems to ignore Jackson et al.’s 199 Gt SOC in >2–3 m or deeper.
Surprisingly, figure 5 in ref. [
112] had yet higher values (of Mineral-Associated OM and Particulate OM) to just 1 m depth from various data sets of 1390–2470 Gt SOC excluding Peat, but with Permafrost contribution to the values unclear (if at all).
In summary, superficial mineral soils say of ~1500 Gt SOC, doubled for terrain then full depth (× 4), is ~6000 Gt SOC; adding ~25% GRSP and ~25% saprock C, totals ~9000 Gt SOC. Conversely, ~1500 Gt plus 30% GRSP + 25% saprock is 2500 Gt × 4 = ~10,000 Gt SOC.
3.5.2. Permafrost
Permafrost, occupying 11–15% of land area, is one of Earth’s major SOC stores and carbon loss contributors. It is both remarkably old (supposedly in places over 2.5 million years old) and deep with areas of continuous permafrost often >100 m thick and the deepest in Siberia extending to 1650 m depth (
https://nsidc.org/learn/parts-cryosphere/frozen-ground-permafrost/science-frozen-ground, accessed on 11 November 2024). Non-terrestrial, sub-oceanic stores are not included. It is treated in some detail already, also in [
64]: “
3.2.1 Biotic Boreal Permafrosts Reconsidered but Not Reconciled”. It is not intended to repeat all the information provided therein, rather just a brief updated summary herein.
Ref. [
49] divided Permafrost carbon thusly:
Near-surface Permafrost soils (0–3 m)—1035 Gt SOC;
Yedoma deposits of Siberia and Alaska (>3 m of 327–466)—median 397 Gt C;
Arctic river deltas (at soil depth > 3 and up to 60 m deep)—~96 Gt C;
Qinghai-Xizang (Tibet) Plateau and northern China (to full depth?)—~36 Gt C;
Deep deposits outside the Yedoma region (of 350–465 to >3 m?)—median 408 Gt C;
[Subsea permafrost, ∼560 Gt C, herein ignored as not in current terrestrial C stocks].
For some reason, they gave a median only for categories 1 to 3 of 1530 Gt C, whereas for all Permafrost to depth, their data yield (1035 + 397 + ~96 + ~36 + 408 =) ~1972 Gt SOC.
Surprisingly, an omitted citation is [
22], also indicating up to 2000 Gt C. But, in brief, rather than ~1972 or ~2000 Gt SOC as just shown, the “
official” IPCC and GCB data (in
Table 1 in Introduction) have between 1200–1700 Gt SOC (median: ~1450 Gt SOC). Yet, it was unclear whether or not they included Peat. As noted, although [
60] implied about 200 Gt C in Permafrost peat, ref. [
18] claimed ∼300 Gt in the boreal region, whereas [
113] had Northern peatland store of 415 ± 147 Gt C, of which just 185 ± 66 Gt C is in Permafrost-affected peatlands. Thus, the most conservative Permafrost value would be about (1450 − 300 =) 1150 Gt SOC that is about the same as the Jackson et al. estimation, less Peat, to >3 m depth. However, ref. [
60] have higher Permafrost figure to greater depth (3–25 m!) of 1672 Gt, of which 1466 Gt was Permafrost proper (i.e., implying just ~206 Gt Peat?).
A baseline Permafrost mineral soil may reasonably be around ~1500–2000 Gt SOC.
Yet, the earlier baseline chosen by [
22] was of 1300 Gt SOC for which “
Northern circumpolar permafrost soils contain more than a third of the global soil organic carbon pool (SOC)”. Their study combined topographic models with (full?) soil profile data and a topographic analysis to evaluate the quantity of permafrost SOC deposits, finding an approximate >200% uncertainty that may also pertain to a circumpolar scale. For perennially frozen soil in the upper 3 m of circumpolar permafrost terrain, from an initial overall estimate of 822 Gt C, their uncertainty was up to >200% (or ×3 times) the prior estimates of SOC mass. They said: “
SOC mass stored in perennially frozen hill toe deposits alone vary from few percents to more than double of current SOC estimates”. They indicate mean values of ∼550 and ∼720 Gt C for the linear and sigmoidal profile geometries, respectively, with a maximal uncertainty of >2000 Gt C they said was like estimates of “
global SOC mass” in 0–3 m depths amounting to 2000–3000 Gt SOC.
Importantly, their study somewhat validates the rationale to double soil samples for both depth and terrain. Moreover, their distinction between linear and sigmoid models (figures 3f,g in ref. [
22] endorses the argument for using curved arc lengths rather than straight lines as in Figure 13 in ref. [
16]. Ref. [
22] found volumes of ∼530 and ∼790 km
3 for linear and sigmoidal profile geometries (difference: +49%). Their new mean carbon values were 25 vs. 35 Gt C for Alaska alone and ∼550 vs. ∼720 Gt C for the whole circumpolar region with these linear and sigmoidal models (viz., between +31–40% difference), indicating importance of realistic, representative curves to topographic or terrain models, not just straight lines joining reference points, at all scales (as was advocated for in topographical terrain models by [
16].)
Notwithstanding general terrain considerations, Permafrost has large uncertainties for proper depth sampling that are slowly being resolved, thereby increasing its SOC. Thus, rather than multiplying current estimates for both depth and terrain, it is perhaps more circumspect to impose underestimation correction more for terrain than for depth.
Adding to [
22], Permafrost median value of ~1972 to >3 m depth would then possibly be doubled mainly for terrain, not extra depth, to ~4000 Gt SOC.
It is unlikely deep Permafrost would gain much from saprock, but initial indications are that glomalin/GRSP achieves at least 25%, thereby possibly adding >1000 Gt SOC. This would be expected since research has shown a directly positive relationship (
r = 0.62) between GRSP and soil organic C content [
114], and additionally since glomalin, as a fungal-derived product, is likely highest in boreal Peat and Permafrost realms, as per (tables 5, 6 and figure 3a in ref. [
15]) Preliminary evidence is of high glomalin/GRSP in boreal regions [
11] and frozen Permafrost may have relatively undecomposed GRSP compared to typical soils. Despite evidence of importance, few reports are on GRSP in Permafrost (nor much in Peat!), which thus merit greater research effort (and funds) amongst all other soil arena aspects.
Permafrost mineral soil refined evaluation is (4000 + 1000 GRSP =) ~5000 Gt SOC.
3.5.3. Peat (p-SOC)—Mired in Speculation?
In the interest of readability and brevity, the section concerning Peat SOC (p-SOC) is presented in
Appendix A, where those interested may find a fuller account. Recent reports had peatlands’ peat of 600 Gt raised to about 1123 Gt C (e.g., [
23]). Present Peat tallies to full depth, and especially profiting from glomalin (as high as +52%), are of >3000 Gt. Due to waterlogging, they gain little from terrain, neither does saprock apply as old/extant peats often overly or have metamorphosed into lignite, an immature form of coal, itself totaling 3000 Gt C that may strictly be added to the Peat budget as a bioproduct.
Potentially the largest single store of organic carbon on Earth, in essence, Peat of all depths or ages at >6000, less lignite, ranges 3000–4050 Gt p-SOC. Since lignite is usually included in fossil fuel inventories, it is excluded; and, as glomalin likely reduces with depth/age (?), then a modest total global total value is restored at around 3000 Gt p-SOC.
3.5.4. Sediment Organic Carbon (SeOC) from Muddied Waters
Landlocked Aquatic or semi-aquatic systems are said to occupy 1–2% of land surface, now halved since, like Peat, they do not gain from terrain, and neither do their C budgets.
Herein, the intermittently inundated areas, such as floodplains, thaw lakes, or paddy, are not included, and Peat too is excluded, yet the carbon stored in permanent waterways and non-marine sediments is not trivial. Lake sediments alone are estimated to contain 820 Gt organic carbon (SeOC) [
115,
116]). River storage is unknown but is probably at least as large (consider Mekong, Amazon, Yangzi, Congo, or Indus). From [
117] and table 5 in ref. [
115], a rough estimate based upon carbon efflux rates may be twice the lake storage, or something around ~1640 Gt SeOC for riverine storage.
A best-guess global lake plus river sediment is about (820 + 1640 =) ~2500 Gt SeOC.
This is relevant as a partial and rapid remedy for loss of topsoil; also, a traditional practice is to dredge waterways and lakes (after determining that levels of toxic metals and other poisons in the sediments are within tolerable levels). Like any other biological intervention, it does not need to be complete dredging, just a reasonable proportion to allow restoration of as much of the sediment, litterfall, and dissolved organic matter (DOC) that originates in the topsoil before it eroded/leached. Ref. [
118] notes King’s mention of an ancient Chinese practice of mixing fresh organic/leguminous plants with dredged canal mud silts for fertile composts. Naturally, this does not apply to saline and inaccessible Marine deposits. Slight loss of Aquatic biomass may balance Soil’s gain.
3.5.5. Root Stock Biomass
Preprint root biomass presented in [
64] is only slightly updated herein. Roots spread deep and wide for many plants, as visualized in 3D images online—
https://www.thisiscolossal.com/2022/01/wageningen-root-archive/, (accessed on 11 November 2024). Examples of extent are for prairie grasses or trees with the deepest known at 120 m for a wild Natal fig (
Ficus natalensis Hochst.) at Echo Caves in Transvaal, South Africa [
119], or 68 m for
Boscia albitrunca (Burch.) in Botswana’s central Kalahari Desert [
120]. A summary for root biomass by [
16] reported an initial 146 Gt C from a dry biomass of 292 Gt from table 6 in ref. [
121] that was allocated about 175 Gt (80%) for forests and about 42 Gt (20%) in other biomes. Jackson et al. found fine roots alone (also ~20% of their total) representing 33% of net primary productivity that may be missed in most NPP models! [
122] updated a root total to 241 Gt C, or less than an earlier figure of 267 Gt C by figure 2 in ref. [
26] who said they comprised about half of 492 Gt C estimated for the Planet’s above-ground vegetation. Robinson’s value seems mainly for tree roots rather than grass, scrub, tundra, moor, desert, etc., that are substantial (~20% as noted).
Ref. [
26] found that true below-ground biomass of tree roots in general are not only underestimated by about 60%, but also that losses as large as 20–40% of root samples can occur after recovery from soil due to subsequent handling, washing, and storage, i.e., errors may amount to 100%. Therefore, instead of an initial 160 Gt C as then estimated in (tree?) root systems globally, he said a true amount could be about 267 Gt C. If 20% of this value is added for other than forest biomes (from table 6 in ref. [
121]), a new total is about (267 + 53 =) 320 Gt C. Alternatively, the new total from [
122] of 241 Gt C with 60% added for missed tree roots, plus mean 30% added for Robinson’s sampling errors, is (241 + 217 =) 458 Gt C. Doubled for terrain, this becomes 916 Gt C, or roughly the same as above-ground plant biomass estimated at ~1100 Gt C.
Some support for this is [
123] global synthesis root:shoot ratio of 0.90. Often commensurate, ratios for trees are lowest with grasses highest and table 8 in ref. [
124] footnote has roots as high as 74% of total phytomass for
Calluna heathland in UK. If above-ground vegetation is 1100 Gt C, then a 0.90 root ratio gives 990 Gt C. However, ref. [
17] reported: “
above- and underground parts of plants” add to 2400 Gt C; if so, a 0.90 root:shoot ratio, i.e., 47%, gives root biomass as (2400 × 0.47) = 1128 Gt C.
Dead or decaying roots form an integral part of the litter pool but are rarely included.
3.5.6. Litter/Log Stock Biomass (l-SOC)
Estimates of global litter carbon are scarce, often included in total SOC, but not always. However, IPCC (2001: fig. 3.1d—
https://www.ipcc.ch/report/ar3/wg1/the-carbon-cycle-and-atmospheric-carbon-dioxide/, accessed 11 November 2024) and figure 5 in ref. [
88] separate soil “
litter” at 300 Gt C with an annual input supposedly of ~60 Gt C/yr in NPP residues. Their 300 Gt C in soil litter (and logs?) was possibly derived from [
125] report of (160 fine + 150 coarse =) 310 Gt, “
dm = dry matter” with “
rarely included” below-ground litter. This value should properly be halved for carbon to 155 Gt C but doubled again for terrain to 310 Gt C. Matthews also noted that: “
including standing and fallen dead wood may increase estimates of the fine litter pool by ~40%”. Compare this to [
124] that has humus, mulch, etc., “
detritus” at ~700 Gt C. Assuming Houghton et al.’s 300 Gt C value is correct and reasonable, the total, doubled for terrain, remains as ~600 Gt l-SOC.
Interestingly, ref. [
28], based on field observations, had plant litter at ≈80 Gt C, saying microbe biomass (viz., bacteria, archaea, fungi, and protists) was less than 1% of total organic carbon mass in litter, meaning microbial biomass in litter would not surpass 1 Gt C. However, if as here, litter is 600 Gt C its microbe biomass grows to 6 Gt C.
Ref. [
126] estimated carbon stocks in the world’s forests with 73 Gt C in deadwood (e.g., logs and sticks), and 43 Gt C in superficial litter (these last two “
litter” categories adding up to ~116 Gt C just for forests). Often unrecorded are below-ground dead root stock and root litter that may themselves amount to at least half as much as the above-ground stocks. It may be assumed that the remaining 60% of non-forested land surface has a considerable stock too, possibly at least as large as the above- and below-ground forest litter, say (73 + 60 =) 133 Gt C. The forest and non-forest litter/logs then total (116 + 133 =) ~250 Gt C. In addition, crop residues or smaller inputs from animal herbivory and manuring contribute to the total, validating 300 Gt C as a reasonable baseline value. This estimate, doubled for terrain, seemingly justifies a litter/log stock total of ~600 Gt l-SOC.
3.5.7. Biocrust and Phytomenon (b-SOC) with Contributions to NPP
The soil Phytomenon, surface Biocrust or autotrophic biofilm, and epiphytes (that is, bryophytic liverworts, hornworts, epiphytic mosses plus micro-fungi/yeasts, photosynthetic green algae, lichens, and Cyanobacteria or Cyanophyta) coat the convoluted superficial and interstitial surface rocks, topsoil, and sands. According to [
127], cryptogamic covers or Biocrust total ~5 Gt C taking up ~4 Gt C per year in NPP, but terrain likely doubles values, possibly again at finer scale, to 10–20 Gt C and ~8–16 Gt C/yr.
Ref. [
28] found support for initial value in [
128] analysis of global carbon content of cryptogamic covers in the Ordovician–Silurian period (~400–500 Ma), suggesting these were similar to today’s values (i.e., a baseline ~5 Gt C).
Phytomenon (e.g., soil algae, Cyanobacteria, etc.) and Biocrust biomass, although amounting to 10–20 Gt b-SOC (as above and in [
64]), are often ignored as relatively trivial components of the terrestrial biome. Yet their biomass exceeds all Ocean’s and their NPP nears Ocean’s. Being surficial, they gain little for soil depth, but as they are ubiquitous in arid and frozen lands too, their multiplication for micro-terrain is validated.
Biomass of Cyanobacteria, including much proclaimed
Prochlorococcus and
Synechococcus, were reported on by [
129]. In arid land soil crusts alone, they are estimated to reach 0.054 Gt C and in endolithic communities, an additional 0.014 Gt C giving a total of 0.068 Gt C. Comparatively, just 0.003 Gt C occurs in lakes. As arid land makes up about a third of total land area, this value may be easily doubled if not tripled, and when doubled again for terrain, the land cyanobacteria component is >0.27 Gt C on land vs. <0.17 Gt C in all the Ocean (and a miniscule 0.003 Gt C in Aquatics). Moreover, these authors admit theirs was a conservative estimate, excluding significant land reservoirs such as Polar or Subarctic areas and subhumid topsoils (!). For algal biocrust, as well as tropical blooms, these occur on polar or subarctic rocks, snow and ice too [
130], contributing yet more to both biomass and to productivity. Cyanobacteria in Phytomenon far exceed, likely at least double, Ocean’s Phytoplankton.
Ref. [
131] found an average 5.5 million micro-algae inhabit each gram of surface soil. They concluded that soil algae added a “
so far not considered additional” 3.6 Gt C/yr NPP. This, they said, is slightly higher than the value reported for soil cryptogams, including bryophytes and lichens, of 0.34–3.3 Gt C/yr. However, table 6 in ref. [
132] included cryptogamic “
bare” Earth biocrust and
“Mosses and lichens” respiration (= NPP) as 2.76 and 1.73 Gt C/yr, respectively, to total 4.5 Gt C/yr. Moreover, ref. [
133] had photoautotrophic microbes comprised of Bacteria and algae sequestration of 0.6 to 4.9 Gt C/yr based upon a surface area of 14 Gha. If Jassey et al. terrestrial soil algal addition of 3.6 Gt C/yr is correct, a combined sum is ~8.5 Gt C/yr NPP for a flat land surface area. Doubled for terrain (but not yet for microtopography?), current NPP of ancient biocrust is then about ~17.0 Gt C/yr, which easily matches or exceeds the Ocean’s.
Ref. [
134] discuss tropical soil algae seasonal bloom as fertilizer.
3.5.8. Dissolved Organic Carbon (DOC) in Soils
An estimate is of ~13 Gt DOC in soils to 1 m depth [
52,
135]; doubled, at least, for depth and possibly again for terrain, would raise this to 52 Gt DOC. Subsequently, ref. [
136] estimated annual carbon release from DOC as 27.98 Gt C/yr; they say is three times greater than global fossil fuel carbon emissions from IPCC (of ~9 Gt C/yr). Moreover, ref. [
137] has ~2–5 Gt/yr DOC/DIC processed by water. These will increase as Permafrost melts further [
53,
135].
DOC intergrades with Soil Inorganic and Dissolved Inorganic C: viz. (SIC) and (DIC).
3.5.9. Soil Inorganic Carbon (SIC) and Dissolved Inorganic Carbon (DIC) in Soils
Earlier studies by [
138] were updated by [
50], who found: “
Inorganic C as soil carbonate (2255 Pg C down to 2 m depth) and as bicarbonate in groundwater (1400 Pg C) together surpass SOC (2400 Pg C) as the largest terrestrial C pool”. Another recent report by [
51] claims soil inorganic carbon is slightly higher at 2305 ± 636 (±1 SD) Gt SIC to 2 m soil depth. Doubled for depth and/or terrain ups these latter SIC plus DIC values, giving total (2305 + 1400 = 3705 × 2 =) 7410 Gt SIC/DIC.
It is possible that those dissolved portions of SIC within the water table, being at its own levels, as found in DIC, are not so obviously increased.
Figure 12 summarizes this.
As already noted, a mean soil depth of >13–21 m is six or ten times deeper than most samples, thus these values may truly be much higher. Moreover, terrain may factor in yet higher for SIC but possibly not so much, if at all, for DIC that finds its own level.
Also noted above, in addition to DIC, the new total of dissolved organic DOC, that may, or may not, be counted within routine soil samples, amounts to ~52 Gt DOC. When combined, these estimates of SIC/DIC/DOC add up to around (>7410 + 52 =) >7462 Gt C.
3.6. Soil Carbon Stocks Summary
From a total global baseline of ~24,000 Gt SOC calculated above, we may add sediment carbon in lakes and rivers (820 + 1640 = 2460 Gt SeOC). Then a SOC total is (24,000 + 2460 =) ~26,460 Gt SOC. Adding inorganic/dissolved carbon in soils (SIC/DIC/DOC of approximately 7462 Gt C as noted above) gives a grand land total of 33,922, or nearly 34,000 Gt C for all forms of soil carbon (approaching the 38,000 Gt C in Ocean’s DIC/DOC stock and exceeding it should 5000–10,000 Gt C in mainly terrestrial fossil fuel stocks be added).
Disparity of terrestrial soil carbon stocks, as noted in the Introduction, ranging from prior 3000 to 34,000 Gt SOC herein, indicates inadequacy of our basic knowledge of soils, their carbon stocks, and of Earth’s natural processes. To provide clarity in terms of a full soil biome, inventory requires that living biomass, Dissolved Organic Carbon (DOC), and Sediment Organic Carbon (SeOC) and other factors be added for depth and for terrain.
Additional factors, as well as glomalin and saprock, are amounts of terrestrial biomass lost to the oceans each year. Siegenthaler and figure 1b in ref. [
43] had 0.8 Gt C/yr transported to oceans via rivers. Lower values were provided by [
139], who estimated 0.25 Gt C of dissolved (<0.5 μm) organic carbon (DOC) and another 0.15 Gt C of particulate (>0.5 μm) organic carbon (POC) lost from Continents each year. Although tree logs and other larger woody materials appear substantial, current information indicates they are a minor contributor. An annual driftwood export to oceans of 4.7 million m
3 equates to 1.41 Mt of carbon, or just 0.0014 Gt C/yr [
140], compared to 0.4–0.8 Gt DOC/POC. Moreover, figure 7.6 and tables 7.8, 7.9 in ref. [
34] showed 0.4–0.6 Gt C/yr (or 10% of total soil erosion) flowing to the ocean via rivers, which may be doubled for terrain (depending on data source or to allow for coastal erosion) to over 1 Gt C/yr. Conversely, figure 10.5 in ref. [
41] and [
42] already have 0.8–0.9 Gt C/yr exports of carbon to the Ocean that, depending upon source or data methods, may truly represent a substantial contribution as well as a large loss from terrestrial NPP via soil erosion.
The following sections consider living terrestrial Biomass (>2400 Gt C) with its dormant/dead Necromass that add to a total Soil carbon inventory. Comparably, just 3 Gt C of Ocean life in plants and animals exists (
Figure 6,
Figure 7,
Figure 8 and
Figure 9). Although [
28] doubled this to 6 Gt C, it is still just 0.1–0.2% of total. As noted, decay from past and present extinction events return some stored SOC to atmospheric CO
2, as does topsoil erosion today.
3.7. Total Living Biomass
Separate from the soil carbon inventories just calculated, as noted in the Introduction, is Vegetation with an above-ground component estimated at >1100 Gt C and, in addition, below-ground roots at around 916 Gt C to give ~2016 Gt C in the global Phytomass stock. Conversely, as calculated above, 1200 Gt standing stock and 0.90 root:shoot ratio is about 990 Gt C roots (total 2100 Gt C). However, extrapolation of an earlier full-depth evaluation by [
17] of 1200 Gt C in plants to depth, when doubled, is ~2400 Gt C.
Adding other terrestrial biotic components from the current study, plus a minor marine contribution (3–6 Gt C), gives total living biomass of ~3000 Gt C, mostly on land and in soil biota. This is not preposterous as an earlier living biomass value was 4000 Gt C (
https://web.archive.org/web/20151224194748/http:/www.agci.org/classroom/biosphere/index.php, accessed on 11 November 2024). Comparatively, ref. [
28] claimed an above-ground biomass of only ≈320 Gt C representing ≈60% of global biomass, plus ≈130 Gt C below-ground biomass composed mainly of plant roots and Bacteria in the soil. For plant biomass, they included ≈70% stems and tree trunks, which are mostly woody and relatively metabolically inert. Although Fungi, as with other microbes, are often included in the soil SOC calculations, earthworms, as with roots, are usually deliberately removed or sieved out and excluded. All three values—for Bacteria, fungi, and earthworms—are revised below, after revision of forest biomes, a major part of global C stocks.
3.7.1. Forest Biome as Part of Total Vegetation Biomass and SOC
Forests occupy about a third of total land area but supposedly support 80% of above-ground biomass and 40% of soil organic carbon bio-/necromass [
141]. Tropical forests constitute 12.2% of the Earth’s land area, have high NPP, and their soils, long thought to be SOM-deficient, are now known with high SOC content of 692 Gt C to 3 m depth [
142]. Doubled for terrain, this tropical soil component alone is about 1284 Gt SOC! Earlier estimates of live forest biomass, both above- and below-ground, are thus shown to be quite inadequate compared current evaluation refinements.
Relevant to earlier log/driftwood questions, ref. [
126] estimated carbon stocks in the world’s forests as 861 Gt C, with 383 Gt C (44%) in soil (to 1 m depth), and 363 Gt C (42%) in live biomass (above- and below-ground, although their root components may be underestimated). Their remaining “
litter” categories added up to ~116 Gt C for forests. The soil component may be doubled for depth, then all values doubled again for terrain to give a total forest inventory of ~2250 Gt C. These authors provided estimates of regional production in various components, albeit many forests now being clear-felled.
Figures 6 and 7 in ref. [
141] also show carbon allocation in boreal forests in USA compared to global differences in tropical, temperate, and boreal forests where below-ground allocations differ markedly. The importance of often neglected below-ground allocation of NPP is shown by [
143] summarizing that, on average, soil respiration is three times the above-ground litterfall-C, which further implies total below-ground carbon allocation (to roots, exudates, etc.) is roughly twice annual above-ground litterfall-C (often erroneously equated to global NPP). Recently, ref. [
10] found up to 50% of NPP allocated to soil fungi (discussed later under f-SOC).
Indeed, ref. [
143] said allocation of carbon to below-ground plant structures often equals or exceeds above-ground litterfall and above-ground respiration in forest ecosystems, making soil the single most important recipient of gross primary productivity. Despite its importance, total forest carbon allocation remains poorly understood due to difficulties of quantifying root and mycorrhizal processes by any single method. These authors describe soil as the largest biochemically active carbon flux in forest ecosystems, thus surely the largest carbon exchange system in the whole Biosphere. A large component of this massive soil carbon exchange is found in the “Fungisphere”.
3.7.2. Fungal Biomass (f-SOC) Mushrooms from 12 Gt to 300–3760 Gt
A detailed account of Fungal Biomass carbon (f-SOC) is delegated to
Appendix B. In summary, the official “best guess” estimates from “
expert” opinion of global fungal biomass ranged between 12 Gt C or, strictly, 12.56 Gt C up to 15 Gt C, whereas my calculation is soil fungi may store between ~300–3760 Gt f-SOC depending upon means of measurement. The initial fungal estimates from Bar-On et al. (2018: supplement) [
28] are of ≈12 Gt C; [
144] for “
Global stocks of living microbial biomass” estimated fungi at 12.56 Gt C, and ) [
26] with 15 Gt C in [Ecto-]mycorrhizal hyphae alone.
Corrected estimates of global f-SOC have a particularly wide uncertainty range, but, regardless of outcome, it is now up for scientific debate and refinement, noting that a 10-fold margin of error (~340–3760 Gt C) is similar to Bar-On et al.’s ×10 microbe error margin.
Note that fungal biomass is often a component of other estimates of SOC so does not necessarily add to the total global SOC stock. However, it seems that glomalin, the fungal glycoprotein that has until recently been difficult to extract, is an important soil addition that may account for up to 52% total f-SOC and represent a proxy for the abundance and activity of AM or VAM fungi in soils, and of NPP. Glomalin added to a fungal tally again raises total living, dormant, dead, or products to well over 3000 Gt C, as speculated above.
Comparatively, ref. [
28] found marine fungi biomass just ≈0.3 Gt C.
3.7.3. Bacteria, Archaea, and Lesser Microbes
Bacteria and other microbes are also mostly counted within the total SOC values, but their actual contribution is important for understanding the processing rates and other soil factors. To a depth of 1 m, total soil microbe biomass in table S1 in ref. [
28] was ≈20 Gt C, comprised of ≈0.5 Gt C of soil Archaea, and ≈7 Gt C of Bacteria to total ≈8 Gt C compared to a total soil fungi value of ≈12 Gt C. Their soil microbial error margin was 10-fold (i.e., 2–200 Gt C?). Ref. [
28] also stated: “
≈98% of the total microbial biomass is found in the top 1 m of soil” further validating new microbial estimates to 1 m depth of soils. table 5 in ref. [
64], 2024: Appendix [
38]) confirmed global biota dominated by Bacteria then Archaea with minor contributions (just around <1–2%?) from other microbes with a biomass estimate, coinciding with Bar-On et al.’s upper range, now of ~210 Gt C.
3.7.4. Earthworms—Their Biomass and Processing of Topsoil Humus
Earthworms are intimately associated with soil microbes, increasing their abundance up to ×1000 during passage of soil through the intestines in surficial or subterranean casts; furthermore, they disperse fungal propagules throughout the soil profile [
145].
Ref. [
146] suggested primarily a terrestrial origin of detritivorous Annelida, plus it is inferred early diversification of (mainly marine) annelids occurred before the Lower Cambrian [
147]. Earliest Annelida may have emerged in the Cambrian around 518 million years ago and some late Ediacaran fossils may be older. This suggests annelids are equally likely to have originated on land or in mud then subsequently colonized littoral habitats as much as vice versa. Their emergence is thus in synchrony along with land plants during co-evolution between soils, fungi, and microbes.
For earthworms (terrestrial Annelida), ref. [
28] had ≈0.2 Gt C biomass based on 10 mg dry weight for a “
characteristic” earthworm [
148]. However, studies by [
38,
67] allowing for terrain and based on biomass values from [
145] as well as Fierer et al. are ×20 greater at ~4.0 Gt C.
In a recent article, ref. [
149] suggested 0.9 Gt of earthworm dry matter available globally, but these authors note: “
An illustration of the academic uncertainty is a report by Blakemore, which concluded that the global earthworm dry biomass amounts to 4.5 gigatonnes, fivefold higher than the estimate calculated above”. At 50% carbon content, this is 2.25 Gt C in earthworms. Subsequent values ranged 2.33.6 Gt C, and a latest estimated mean value is 3.8 Gt C earthworm biomass based upon the totals from [
148], simply doubled for terrain. table 9 in ref. [
38] noted: “
Earthworm biomass at 3.8 Gt C and Microbes at 209.6 Gt C are slightly higher than 2.3–3.6 Gt C and 200 Gt C, respectively, estimated by Blakemore (2023: tab.
2) confirming importance of both groups to Soil Ecology”.
It is interesting that as well as the earthworm biomass in
Figure 4 now being much more than Fish, with new values of ~4.0 Gt C vs. ≈0.7 Gt C, earthworm abundance and biodiversity (with ~35,000 expected earthworm species) are also much higher than fishes, indicating a need for a major shift in focus (or a “
sea change”?). The Fish value of ≈0.7 Gt C from [
28] compares to their estimate of total global fish biomass before human civilization across all sea depths at just ≈0.8 Gt C. This suggests there is not an ocean emergency so great nor so urgent as is often implied. Conversely, worms are dying, and populations have declined inordinately. This is not new information as [
150,
151] found them eliminated completely from some agrichemical plots at Rothamstead that were acidified. If earthworm declines under global agrichemical [
108] and UK forest habitats [
152] are representative at −83% and −77%, respectively, then policies and practices for their restoration may offer practical solutions not just to biodiversity, but to topsoil loss and excess atmospheric CO
2.
Revisiting [
153] work a Century later, ref. [
145] had mean earthworm surface casts dry mass of 105 t/ha/yr and about equal subsoil casting to sum 210 t/ha/yr. With 24 Gha of topsoil mantle, this is 5040 Gt/yr humus processing. At average cast carbon content around 4% (Blakemore, 2019—
https://vermecology.wordpress.com/2019/11/11/earthworm-cast-carbon-storage-eccs/, accessed on 11 November 2024) implies 201.6 Gt C/yr, or the processing of nearly the entire terrestrial NPP, as to be expected for balanced Nature. An 83% earthworm loss is a disruptive effect that also offers remedy if field populations are restored five times, or to their former abundance glory.
Inorganic SIC, although often discounted, may be of biotic origin (e.g., ~1 Gt C/yr in earthworm CaCO3 secretions alone) so should now be considered as partly of biotic origin.
3.8. Soil SOC and Biota Summary
Summary of the global SOC status prior to the current paper is updated herein, new values are shown below for the global SOC and Biota Biomass calculation (values in braces are often or generally included within SOC values, thus they should not be counted twice):
Mineral soil (~1500 Gt C + 20–30% glomalin, 26% for saprock, × 4 =)—10,000 Gt SOC.
Permafrost (>4200 Gt C plus glomalin that may add 25–50%?)—>5000 Gt SOC.
Peat (total 3000 + 3000 lignite = 6000 Gt); just peat alone to depth—3000 Gt p-SOC.
Sediment Carbon in Lakes & Rivers (820 + ~1640 Gt =)—~2500 Gt SeOC.
Above-ground Vegetation—>1100, or Rodin et al. above-ground value—1272 Gt C.
Roots, often overlooked or undervalued, range: 916–1128 Gt C, median —1022 Gt C.
Litter/logs, included with SOC, reported separately, usually ignored—600 Gt l-SOC.
Biocrust and Phytomenon rarely included, mostly ignored—10–20 Gt b-SOC.
DOC sometimes included in superficial SOC, possibly added for depth—52 Gt DOC?
SIC and DIC (4600–7400 Gt C?); 2300 + 1400, possibly doubled—7400 Gt SIC/DIC.
Fungi typically included in total SOC (raised from 12–15 to >300–3600 Gt f-SOC).
Bacteria and Similar Microbes usually included in SOC (raised from 8 to ~210 Gt C).
Earthworms almost always removed and excluded from soil samples, now—~4 Gt C.
In total ~10,000 mineral, >5000 Permafrost, 3000 Peat, 2500 SeOC, 600 litter, 15 biocrust, and 52 DOC = >21,167 Gt SOC that is slightly above initial 20,000 Fermi guess and closer to the CO
2 NOE drawdown median value in range 5000–40,000 of 23,000 Gt C. If inorganic 7400 SIC/DIC are added, then a total approaches ~30,000 Gt as is alluded to in the Abstract. This is about ten times the SOC plus SIC total of 3000 Gt shown in
Figure 5.
Additionally, 2400 in above- and below-ground vegetation plus 5000–10,000 Gt fossil fuels, give a total (21,169 + 2400 + 5000–10,000 =) ~31,000 Gt terrestrial biomass carbon. This corresponds well to the NOE drawdown as estimated above of ~30,000 Gt C. (Q.E.D.).
Table 2 highlights the most important review changes from prior “best guess” values.
3.9. Primary Productivity (NPP), Soil Respiration (SR), and CO2 Drawdown
Global Gross Primary Productivity (GPP) mainly on land (
Figure 9) is ~440 Gt C/year, which, less plant respiration, gives about 220 Gt C/yr Net Primary Productivity (NPP, with only around 5–20 Gt C/yr Ocean NPP, or just ~2–8%) after [
16]. This also implies ~890 Gt C currently in atmospheric CO
2 is recycled in (890/440 =) ~2-year cycles on land via land-plant photosynthesis fixation and soil respiration/decomposition mainly by the soil biota. Despite “official” estimates of just 60–70 Gt C/yr land NPP (as in
Table 1), isotopic evidence supports these much higher rates and [
59] imply terrestrial NPP as much as 232.5–275 Gt C/yr, exceeding a value of 220 Gt C/yr NPP.
Critical comments on [
59] are that although they cite 1.5 years, they also state: “
the entire atmospheric CO2 turnover time is not much longer than the tropospheric mixing time (less than ~ 5 months)”, implying a much shorter time. Moreover, they are inconsistent in their data with terrestrial surface flux (F
sur) either 465 ± 60 Gt C/year or “
terrestrial gross flux is quantified to be 550 ± 60 PgC/year”. This latter value, if correct, supports raising NPP (and other land fluxes). They state: “
our best estimate for tGPP is ~ 170–200 PgC/year” [my bolding] and that “
the [current climate]
models should be revisited to achieve a full understanding of ecosystem changes due to the changing climate and environmental factors”.
Indirect support is also provided by global levels of photosynthetic Rubisco enzymes. Recently, ref. [
79] doubled Rubisco on land to about 0.7 Gt (96%) vs. 0.03 Gt (4%) in marine environments. The land component is based upon flat biomes and thus may be readily doubled to 1.4 Gt (or 98%). Relating to rates of NPP, their contrived catalysis rates are unconvincing if not patently false (as shown above for marine NPP). These authors’ land NPP starting assumptions of just 60 Gt, now raised to 220 Gt C/yr, or about 96–98% of global total which is roughly commensurate with their 96–98% Rubisco level. An Oceanic value of 2–4% then equates to NPP reduced to just about 5–10 Gt C/yr.
Rationale for raised land values is shown in self-explanatory images (
Figure 13 and
Figure 14).
Figure 13.
After NOAA (
https://gml.noaa.gov/ccgg/trends/global.html, accessed 11 November 2022) mean CO
2 globally averaged over marine surface sites (i.e., remote from immediate land influences), showing median (black) and seasonal (red) CO
2 fluxes mainly attributed to continual Soil Respiration (brown) or boreal spring/summer land plant Drawdown (green) factors. Note lack of any signal of COVID-19 transport reductions with industry shutdowns from 2020–2022. (Source: [
154], 2022—
https://vermecology.wordpress.com/2020/08/31/barrow/, accessed 11 November 2024).
Gradual increase in atmospheric CO
2 in the 120 years 1900–2020 was estimated at 280 ppm to 412 ppm, or a 32% rise, while terrestrial GPP increased 35% over the same period, mainly due to a CO
2 greening effect [
47]. The inability of plants to drawdown excess CO
2 is likely due to forest clearance for crops and stock, erosion, and topsoil loss. That soil respiration and land plant drawdown are most influential are clearly demonstrated by boreal fluxes (where there is most land) being most extreme, whereas much more constant and massive tropical fluxes cancel out, and the southern fluxes (mainly oceanic), despite some slight seasonality, have minimal effect on global NPP flux.
Is higher NPP justifiable? Evidence for the Northern Extra-Tropics (30–90° N), or boreal region, are fluxes of 60–80 Gt C/yr (median ~70 Gt C/yr). This is supported as figure 7 in ref. [
155] model a boreal flux of ±62 Gt C/yr mainly from the steppe, then from forest, so the whole temperate North may be higher, at least 100 Gt C, and if this flux is about half, then global NPP comes out at well over 200 Gt C/yr. Indeed, ref. [
47] claim: “
land north of 35° N contributes less than 25% to global GPP”, so the total may be at least (62 × 4 =) 248 Gt C/yr for global NPP. Comparatively, table 5 in ref. [
17] have proportion of NPP in polar, boreal, and temperate/sub-boreal zones combined as just 14.8% (vs. 60% in tropics) or, for Continental NPP alone, this is 20% (vs. 80% in tropics). A northern contribution of just a fifth suggests a much higher (viz., 62 × 5 =) >310 Gt C/yr total land NPP.
Table 1 in ref. [
74] estimated seasonal NPP flux on (flat!) land of 33.7 Gt C (or 60%) in northern summers (April to Sept) and 22.7 (or 40%) for the rest of the year in the rest of the world; thus, their summer spike accounts for (33.7 − 22.7 =) 11.0 Gt C (or 20%) above background NPP. As NOAA’s Barrow site measures a real 20 ppm summer drawdown equating to an NPP spike of ~40 Gt C, perhaps doubled for simultaneous soil respiration to ~80 Gt. Thus, logically, if this represents at most 20% of total annual NPP, then global total NPP is at least (5 × 40 =) >200 Gt C/yr, possibly much higher at (5 × 80 =) 400 Gt C/yr? All this evidence—yet again—heralds a need to revise NPP estimates upwards as per [
16], 2020—
https://veop.files.wordpress.com/2020/06/veop-4-5.pdf accessed on 11 November 2024) [
154].
With atmospheric carbon values at the time of their publication, ref. [
80] had CO
2 turnover of “
approximately every 2 yr”,
https://orgprints.org/38139/1/Veop-4.pdf, accessed on 11 November 2024, implying (885/2 Gt C =) 443 Gt C/yr processed mostly on land. This can be explained by supporting higher NPP values of 220 Gt C/yr, or near the same as table 15 in ref. [
16] NPP for × 2 terrain of 218 Gt C/yr. [
59] concur but with a shorter turnover time at 1.5 yrs requiring (890/1.5 Gt C =) 593 Gt C/yr GPP that would correspond with a higher NPP of 296 Gt C/yr. This is lower than table 15 in ref. [
16] for × 4 terrain of 436 Gt C/yr, but similar to table 5 in ref. [
17] and figure 7 in ref. [
155] data, giving an even higher terrestrial NPP of >310 Gt C/yr which may be equally justifiable.
Furthermore, as noted above, this NPP is processed constantly, mainly through the intestines of earthworms and via microbial decomposition, supporting an entire atmospheric CO2 turnover in just about 2 yr cycles by these agents in the litter, in the topsoil humus, and at depth in subsoils. Maintaining this vital workforce of synergistic interactions between earthworms, microbes, and fungi in healthy soils should be a major priority.
4. Summary, Conclusions, and Recommendations
This study supports [
59] view of: “
Representations of the changing global carbon cycle under climatic and environmental perturbations require highly detailed accounting of all atmosphere and biosphere exchange”. The summary of total soil and terrestrial biomass stocks show them to be the greatest global repository for active organic carbon. It may be further realized that as these stocks are ancient and are being lost at increasing rates, then they likely contribute more to CO
2 increases than do fossil fuels. Figure 7 in ref. [
155] noted: “
measures taken by the world community to reduce greenhouse gas emissions are of less importance than preservation of wild natural resources”. If emissions stopped tomorrow (as indeed they were during COVID-19 Lockdowns), the greenhouse gasses (GHGs) yet remain. While [
156] supports soil as the only feasible way to remove excess CO
2 (98.5%), compared to costly and un-natural carbon capture and storage (CCS at 1.1%) or overhyped Ocean (at 0.4%), they do not provide practical mechanisms on how to do this, unlike herein with compost and organic farming.
Although decomposition and microbial respiration from compost releases large amounts of CO
2, the net product is high in SOM/SOC. Moreover, composts were shown by [
118,
157] to be enriched in Nitrogen above the input levels due to activity of N-fixing microbes. Carbon loss from composting averages 26–44% based on a recent meta-analysis [
158] implying more than half or three quarters is preserved in resilient carbon compounds, e.g., in humus which, as early as 1881, Darwin showed was so important for soils, plants, and food. Earthworm processed vermi-compost is yet more enhanced, is entirely natural thus well proven, and completely cost-free.
Food production is intrinsically linked to soils as manifest by an estimated 9.7% of daily calories consumed by humans from soils, whereas only 0.3% is from aquatic sources (FAO 2003 Statistical Databases—
http://faostat.fao.org/site/368/default.aspx#ancor accessed on 1 August 2013). At the same time, precious topsoil is eroding at unsustainable levels (e.g., [
13]) as also reported on by [
34,
37,
63].
Certainties are CO2 is rising, land is not flat, and our ignorance of soil outweighs knowledge. Although not definitive, this study is more realistic than claims by proponents of 60 Gt C/yr NPP, 15 Gha terrain, or 1500 Gt SOC, who must now raise their low values.
Casting more light on basic soil factors like global carbon stocks and cycles is required, especially when it realized that very few, if any, of the AR6 nor GCB report compilers are affiliated with soil research institutions; this partly because—unlike the myriad, well-funded Marine, Aquatic, or Air research facilities—not a single, dedicated “Soil Ecology Institute” exists anywhere on Earth. This deficit needs urgent redress as a priority.
Our global triage imperative is to halt species extinctions mainly due to poor agricultural practices and over-consumption, only in some countries, of meat products. The proven solution to poisoning and increasing erosion, acidification and desertification of soils is restoration of organic husbandry under practices of Permaculture [
68]. Permaculture supports efficiency in food production and housing design (e.g., solar-passive, heat pumps, and insulation) as well as appropriate energy sources such as geothermal (direct, enhanced, or binary systems) and trompe (compressed air). A brief summary of such energy sources is outlined in [
154]—
https://vermecology.wordpress.com/2020/07/30/ame-power/ accessed on 11 November 2024). These complement or help replace, reduce, or at least conserve fossil/biomass energy in a more circular economy.
A supposed limitation to organics is the stock of biomass that is the foundation of composts but is often redirected as a fuel source, either for heating or electricity generation, or else is merely dumped or incinerated. However, as the current study clearly shows, annual biomass production (NPP) and global biomass stores are massively underestimated. Such conclusions are now open for testing at local and wider scales. For example, practical implementation of [
156] aims is made via re-greening of Australia by implementing practical soil restoration policies [
64].
Valid criticisms and corrections to the work presented here are encouraged to help progress these salient issues. However, detractors who fail to provide their estimate of land surface area or depth of soil are automatically invalidated, unless they can prove that the Earth is flat, soil is shallow, and Darwin was wrong to consider earthworms important.


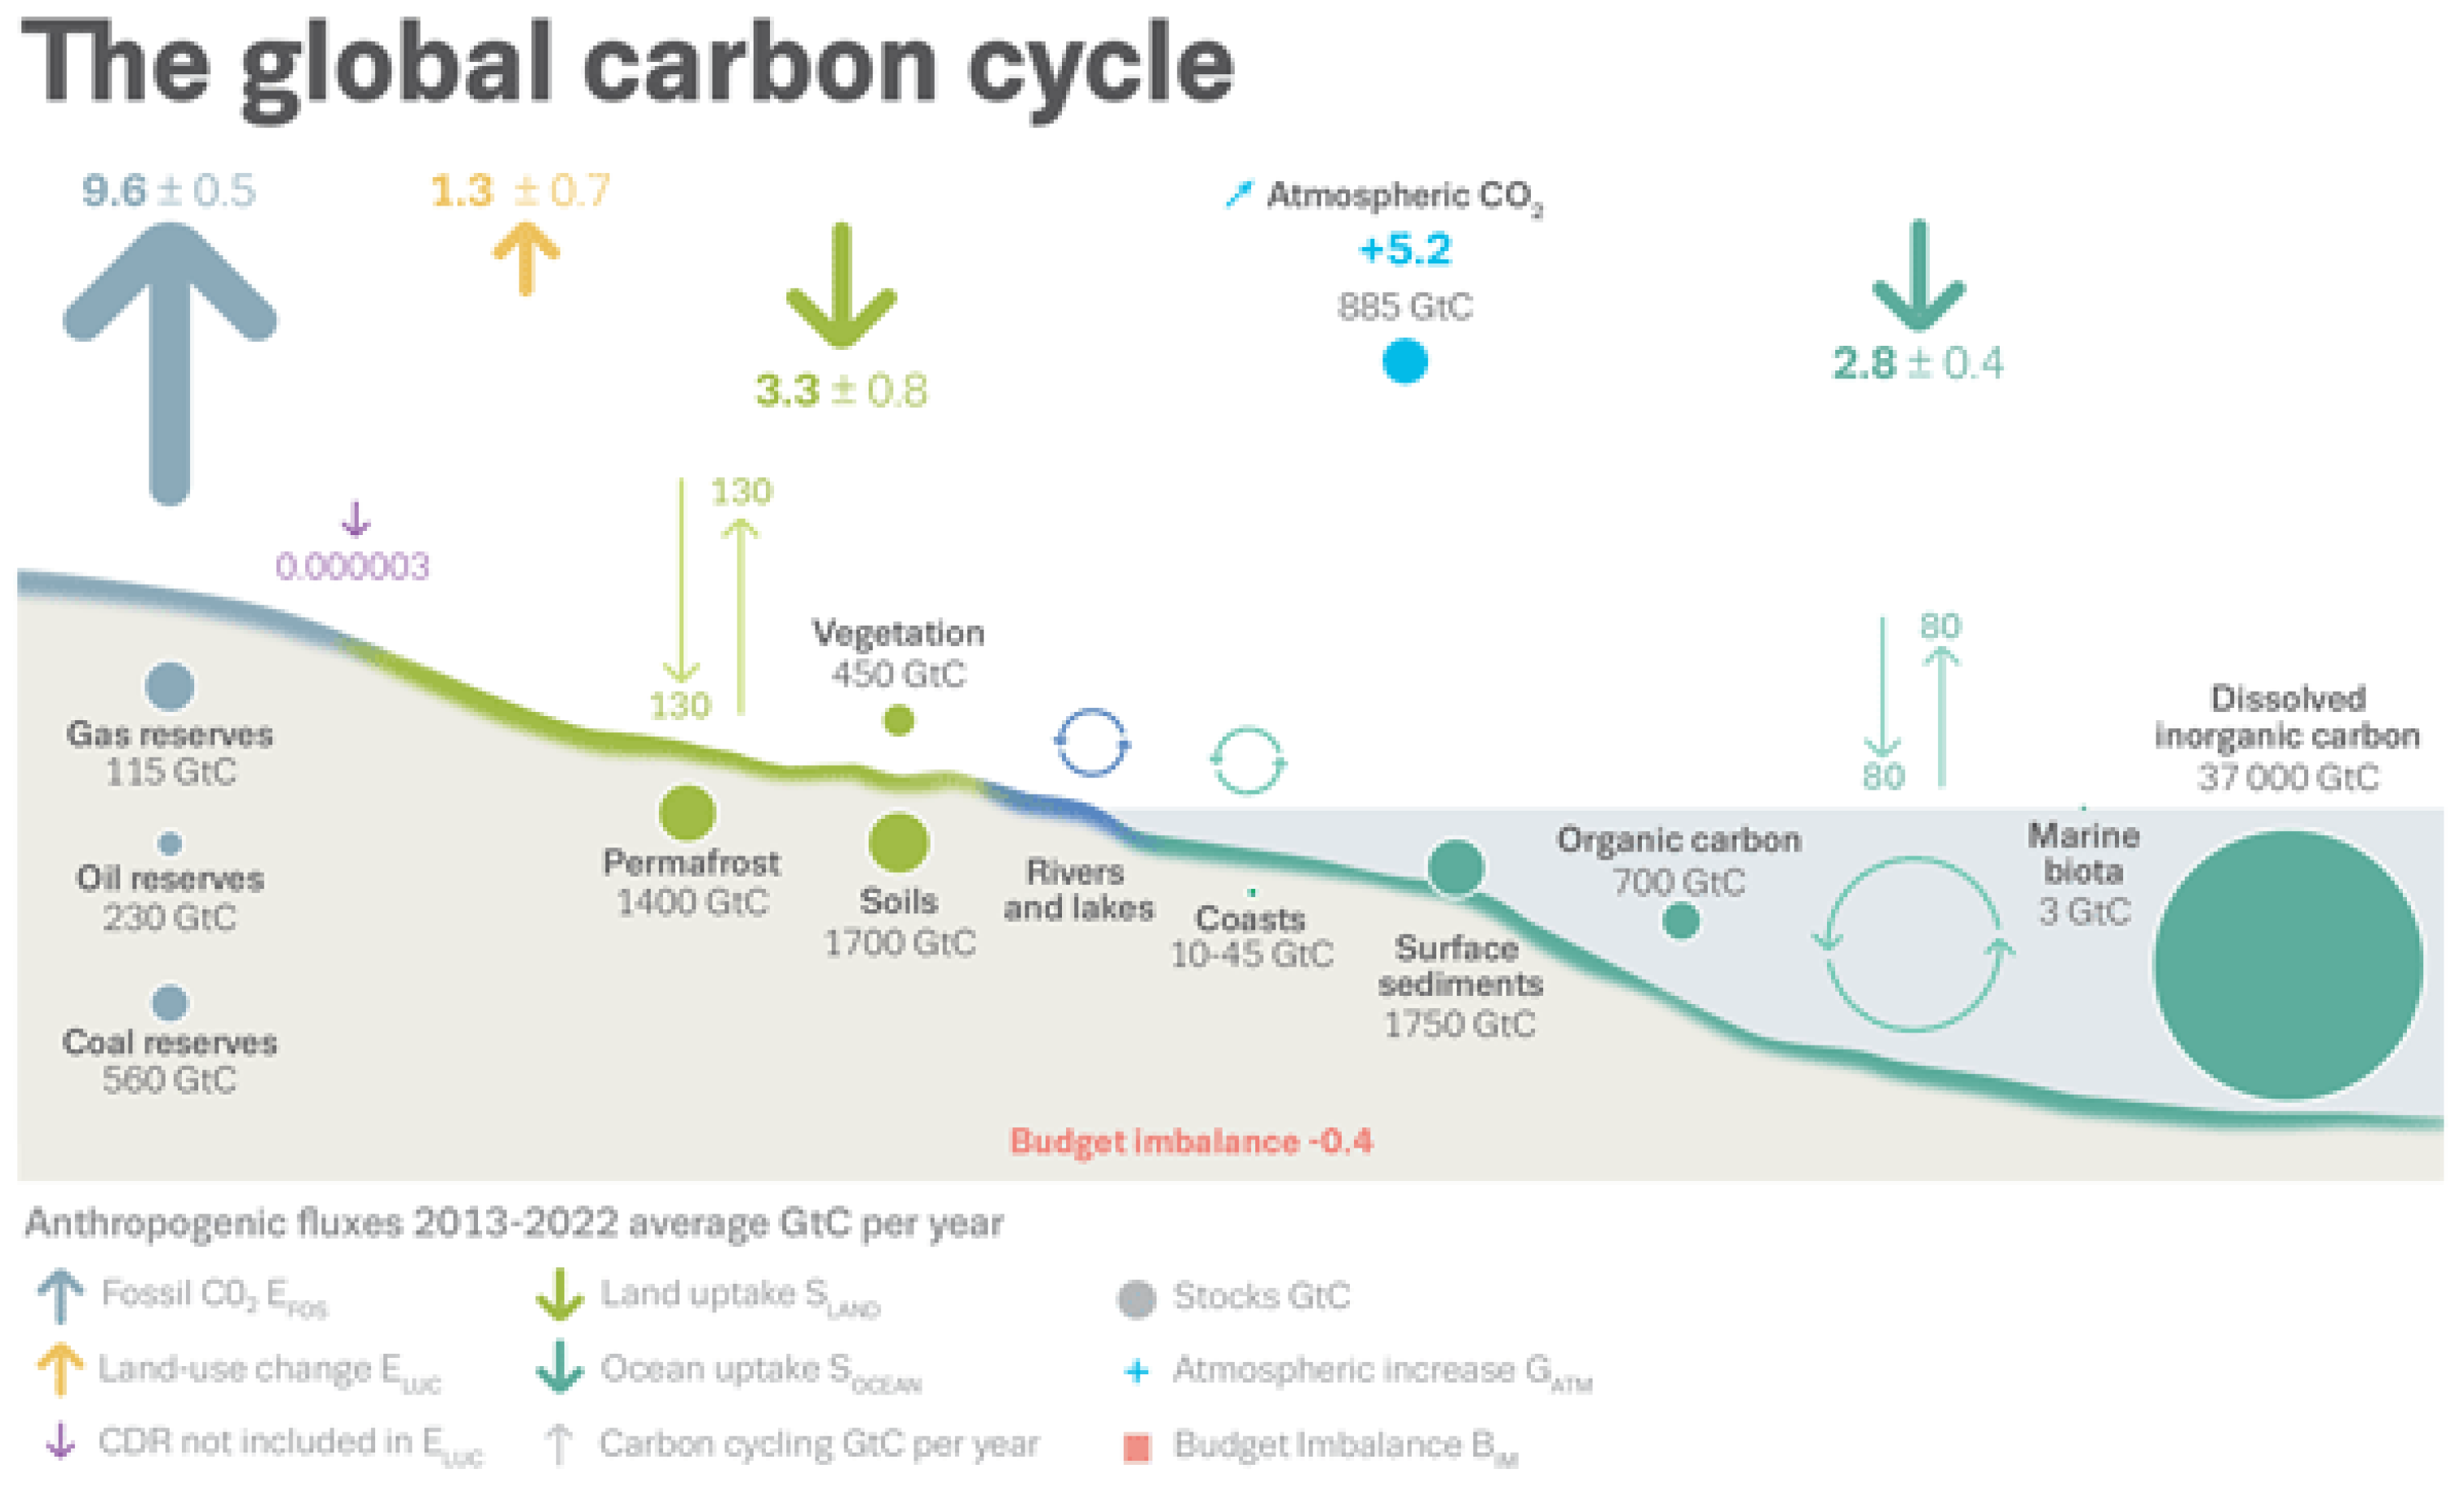


