Article

Estimating Herbaceous Aboveground Biomass Using an Indirect Method Based on the Herbaceous Layer Characteristics

1
Zootechnical Research Center, Senegalese Agricultural Research Institute, Dahra BP 01, Senegal
2
Department of Plant Science, Sciences and Technics Faculty, Cheikh Anta Diop University, Dakar BP 5005, Senegal
3
Joint Research Unit—Mediterranean and Tropical Livestock Systems, Center for International Cooperation in Agricultural Research for Development, Dakar, Senegal
4
Mediterranean and Tropical Livestock Systems, University of Montpellier, Center for International Cooperation in Agricultural Research for Development, National Research Institute for Agriculture, Food and Environment, Agro Institure, F-34398 Montpellier, France
5
Department of Physical Geography and Ecosystem Science, Lund University, SE-22362 Lund, Sweden
6
Department of Geosciences and Natural Resource Management, University of Copenhagen, Øster Voldgade 10, DK-1350 Copenhagen, Denmark
*
Author to whom correspondence should be addressed.
Biomass 2024, 4(4), 1191-1199; https://doi.org/10.3390/biomass4040066
Submission received: 20 August 2024 / Revised: 11 October 2024 / Accepted: 5 November 2024 / Published: 15 November 2024
(This article belongs to the Special Issue Innovative Systems for Biomass Crop Production and Use)

Abstract

:
Background: In the Sahel, one of the largest semi-arid areas in the world, pastoral livestock is the main source of protein for the local population. The quantification of herbaceous biomass in the Sahelian rangelands is of major importance since it provides food for the livestock. The main method used to monitor the biomass consists of cutting, drying, and weighting it. However, indirect methods are available and allow a reliable biomass estimation. Methods: In this study, we developed a non-destructive method for estimating herbaceous biomass for the Sahelian rangelands based on measurements of its height and coverage. Results: Results show that the fit is better in the fenced area. The volume index (height × coverage) provides a better biomass prediction with relative differences between measured and predicted biomass of 11% in 2017 and 8% in 2019. Conclusions: Monitoring herbaceous biomass without destroying it is possible by measuring only its height and coverage.

1. Introduction

The Sahel is a 6000 km long and 600 km wide strip between the Sahara Desert in the North and the Sudanian Savanna in the South [1]. The area has long dry and short rainy seasons from late June to October. The average annual rainfall ranges from 100 to 600 mm, following a north-to-south gradient [2]. This rainfall gradient and the inter-annual rainfall variability are the main climatic factors that govern the natural forage production of the rangelands [3]. The contrasting rhythm of the monsoon on forage resources constraints and protects the pastoral vocation of the Sahel [1]. Under the combined effect of trampling and grazing by livestock, wind, and herbivorous insects, the herbaceous biomass is generally available from June/July to March of the following year but insufficient to feed the livestock for the full year. Fodder trees are therefore used to feed livestock until the next rainy season. That reveals the importance of knowing the biomass availability for farmers and managers since they can then take preventive measures for the period without fodder availability, such as keeping certain areas as fodder reserves. Efficient methods for monitoring biomass availability are therefore important for rangeland management and thus for the availability of protein and food for people throughout the Sahel. There have been numerous studies on fodder availability in the Sahelian rangelands [4,5], but most of them used destructive methods to estimate the herbaceous biomass, notably the integral harvest described by [6]. This direct method is time-consuming and requires a great deal of effort, severely limiting the number of measurements that can be performed. Indirect methods of biomass monitoring are also available [7]. Unlike destructive methods, these are less time-consuming, but at the expense of being less accurate.
Remote sensing is increasingly used to measure vegetation indirectly. This relies on the reflectance of the vegetation. Different studies show an interest in grazing land vegetation [8]. However, remote sensing can only assess the vegetation on the size of the pixel that varies based on the size of the pixel ranging from the meter (Sentinel II at 10 m) to one kilometer for older satellite images. The pixel’s size is still too large to deal with Sahelian rangeland’s spatial heterogeneity, especially due to the presence of trees. UAVs could be an option to deal with the spatial heterogeneity of rangeland [9]. But they require buying adapted UAVs and processing capacity. Furthermore, UAVs are regulated (in some countries, the use of UAVs is forbidden; in others, it requires a flight license) and so can be limited.
Some indirect methods are based on simplified measurements, such as plant height [7]. These works are carried out mainly in temperate biomes, but no such method has been developed or applied in semi-arid regions such as the Sahel. Thus, this study aims to develop a method for estimating herbaceous biomass availability based on height and/or vegetation coverage as input data, being simpler and faster to measure in the field. In addition to herbaceous height and cover, several other factors are important for biomass production. However, this study aims to focus on the morphological characteristics of the herbaceous layer that are easier to measure.

2. Materials and Methods
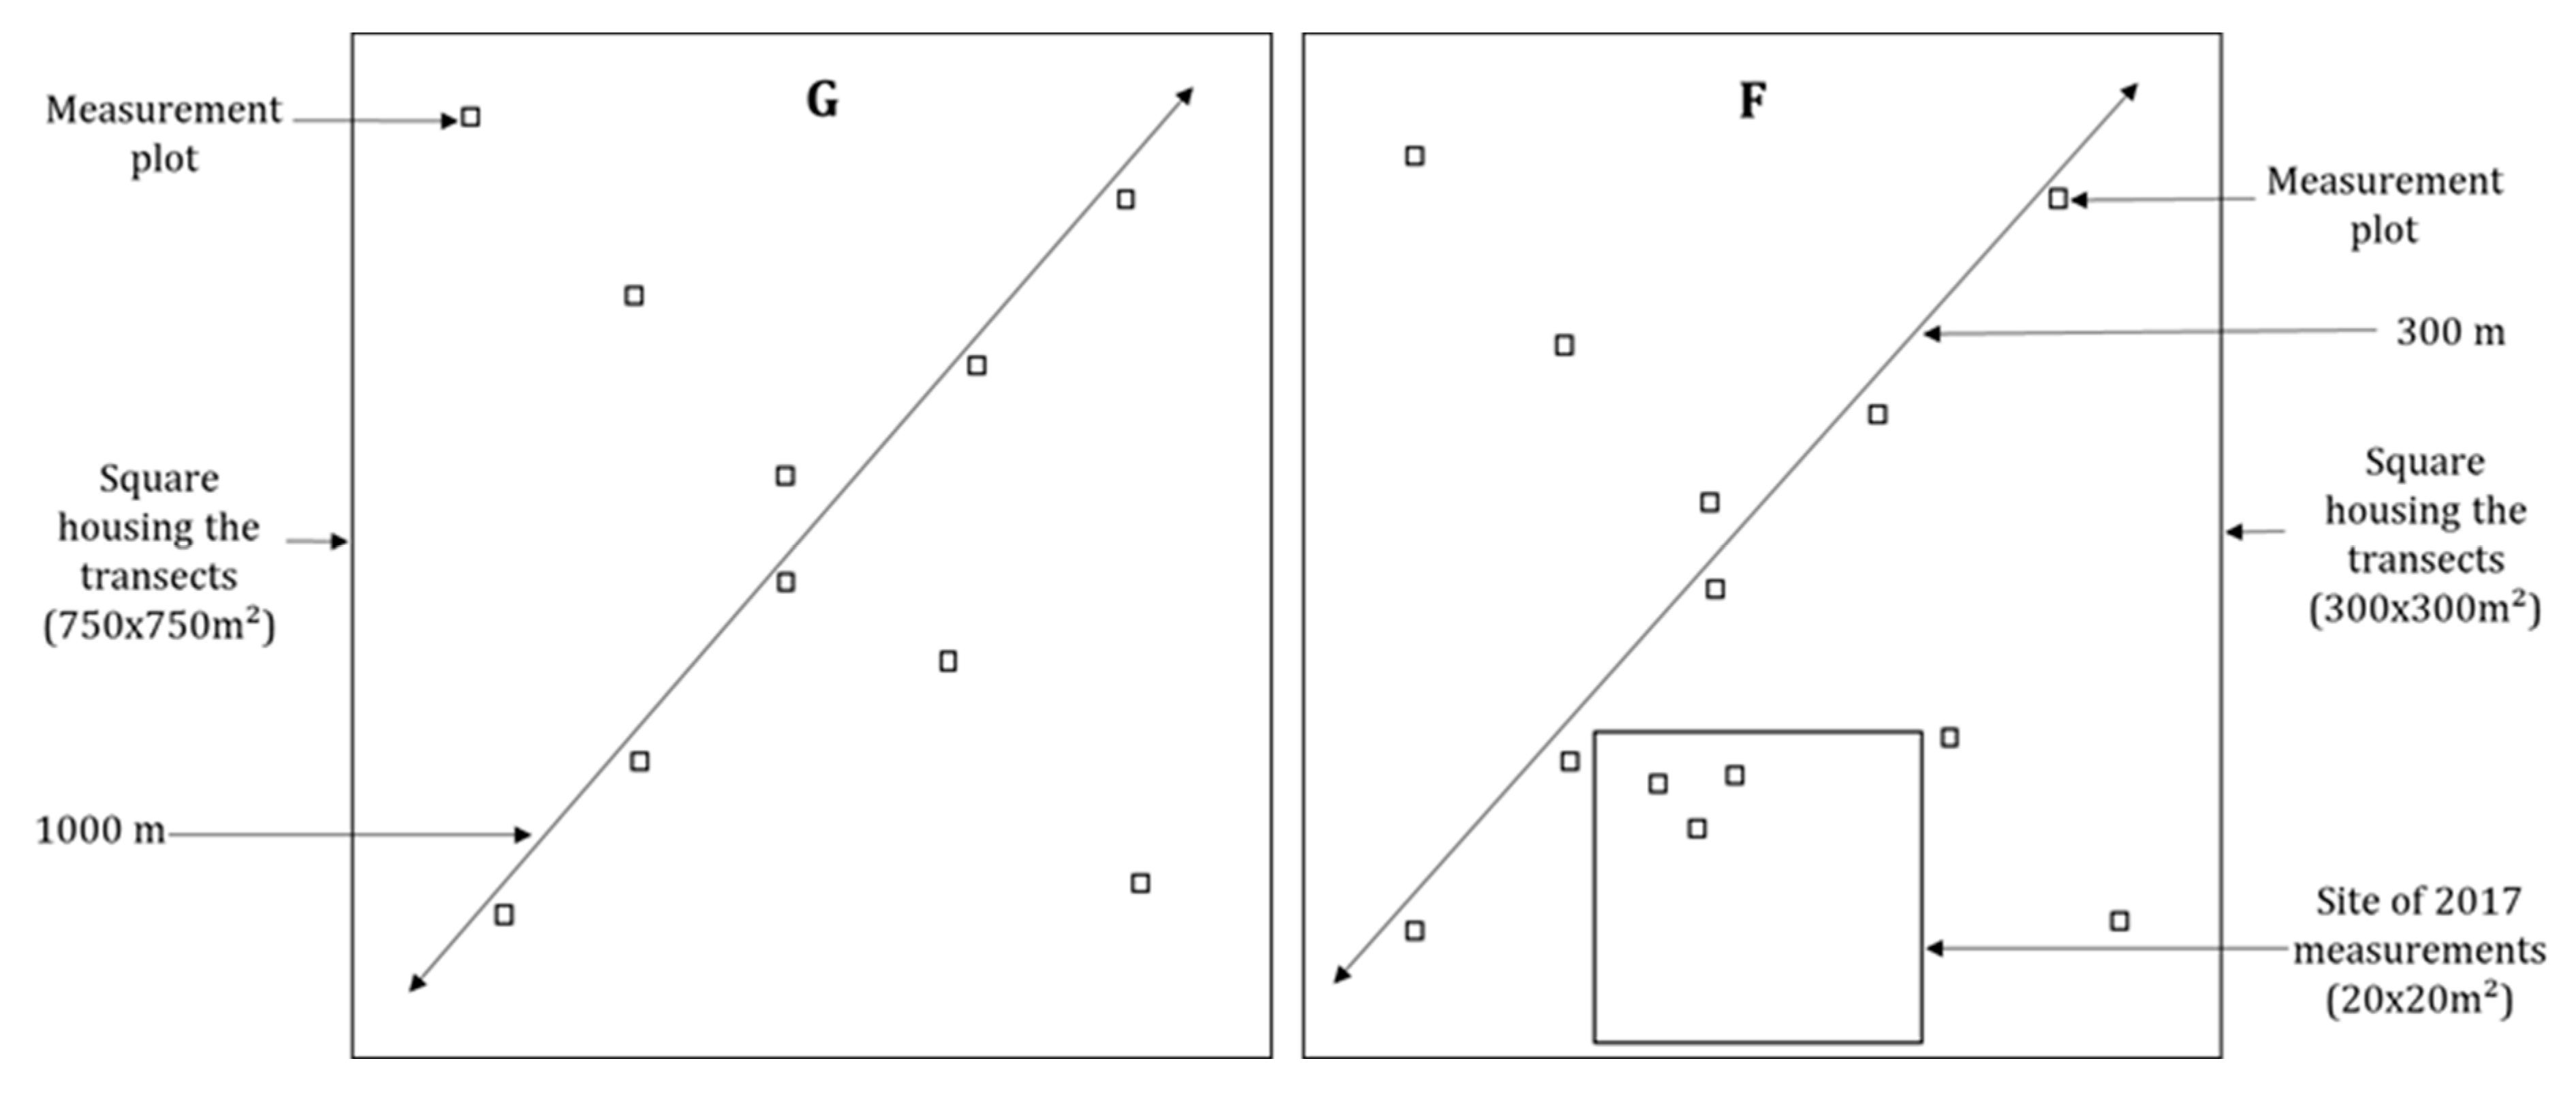
2.1. Study Area

This study was conducted at the Centre de Recherches Zootechniques (CRZ) of the Institut Sénégalais de Recherches Agricoles in the commune of Dahra (15°20 N; 15°29 W). Dahra is located in the region of Louga in the northern part of Senegal and has a Sahelian climate [10]. The annual average temperature can exceed 40 °C in May in the Ferlo area [11]. The average rainfall from 1964 to 2013 was 371.67 mm, with high inter-annual variability [5]. The rainfall is concentrated during a short rainy season of 3 months, of which August and September are the wettest [12]. The soils are mainly sandy, but lateritic and fluvial soils are also present [13].

2.2. Data Collection

Herbaceous biomass was collected during the three rainy seasons of 2017, 2018, and 2019. In 2017, herbaceous biomass was sampled in randomly selected one m2 plots within a 20 × 20 m2 quadrat within a 300 × 300 m2 fenced (F) area. The site has been fenced since 2012 to ensure no grazing. Measurements started 7 days after the first 10 mm rainfall and were thereafter performed every week until the end of the rainy season (late October). Three plots were measured each week, generating a total of 48 plots (16 sets of 3 measurements) over the entire rainy season.
From 2018 to 2019, herbaceous biomass was collected at two different sites (Figure 1). First, in the same fenced area (F) as used in 2017, but also at a nearby 750 × 750 m2 site open to livestock grazing (G). Each site contains 10 measurement plots located along two perpendicular transects. Measurements were started 10 days after the first rainfall of 10 mm and were then made at a 10-day interval until the end of October. The quadrats of the different measurement dates were separated by a distance of one meter to ensure that measurements were not disturbed by the previous biomass harvesting. This made a total of 120 points collected per site (10 quadrats measured 12 times).
At each of the 1 m2 sample plots, we measured the following:
  • The dry weight of the herbaceous biomass (unit: kg dry mass (DM) per hectare) following [6], obtained after drying the harvested fresh biomass in an oven at 65 °C between 24 and 72 h depending on the amount of biomass;
  • The plant height (between the ground and the upper part of the plant) as the average height of 10 randomly selected plants (unit: cm);
  • The vegetation coverage (unit: %) is visually estimated as the percentage of ground covered by the herbaceous plants. The visual estimation of the ground coverage is generally well correlated with that obtained based on photos (correlation coefficient between visual estimates and photos equal to 0.94) and can therefore be used in the field [3];
  • A volume index calculated by multiplying the height with the vegetation coverage [7].

2.3. Data Analysis

Data analysis was performed in R studio (R-4.1.2) [14]. We first performed simple linear models predicting biomass through the plant height, the coverage, and the volume index in both grazed and fenced areas. Then, models with high R2 were compared between grazed and fenced sites to see if grazing affects biomass prediction. In the end, models were used to predict biomass from different years to appreciate their performance. Models were developed based on data collected in 2018 and thereafter validated with data collected in 2017 and 2019. The validation was performed only for the models with a coefficient of determination (R2) greater than 0.5. The simple linear model was preferred to non-parametric methods because it gives better results. Fitted regressions were then applied to the input data for 2017 and 2019, and the model’s predictive power was quantified by estimating the bias, the relative difference, and Pearson’s correlation coefficient between measured and predicted values [7]. The prediction of the 2017 and 2019 biomass was realized with the data of the fenced site only because in 2017, the biomass data were measured in this site. It would have been possible to predict only the biomass of 2019 if the prediction had been made on data measured in the grazed site.

3. Results

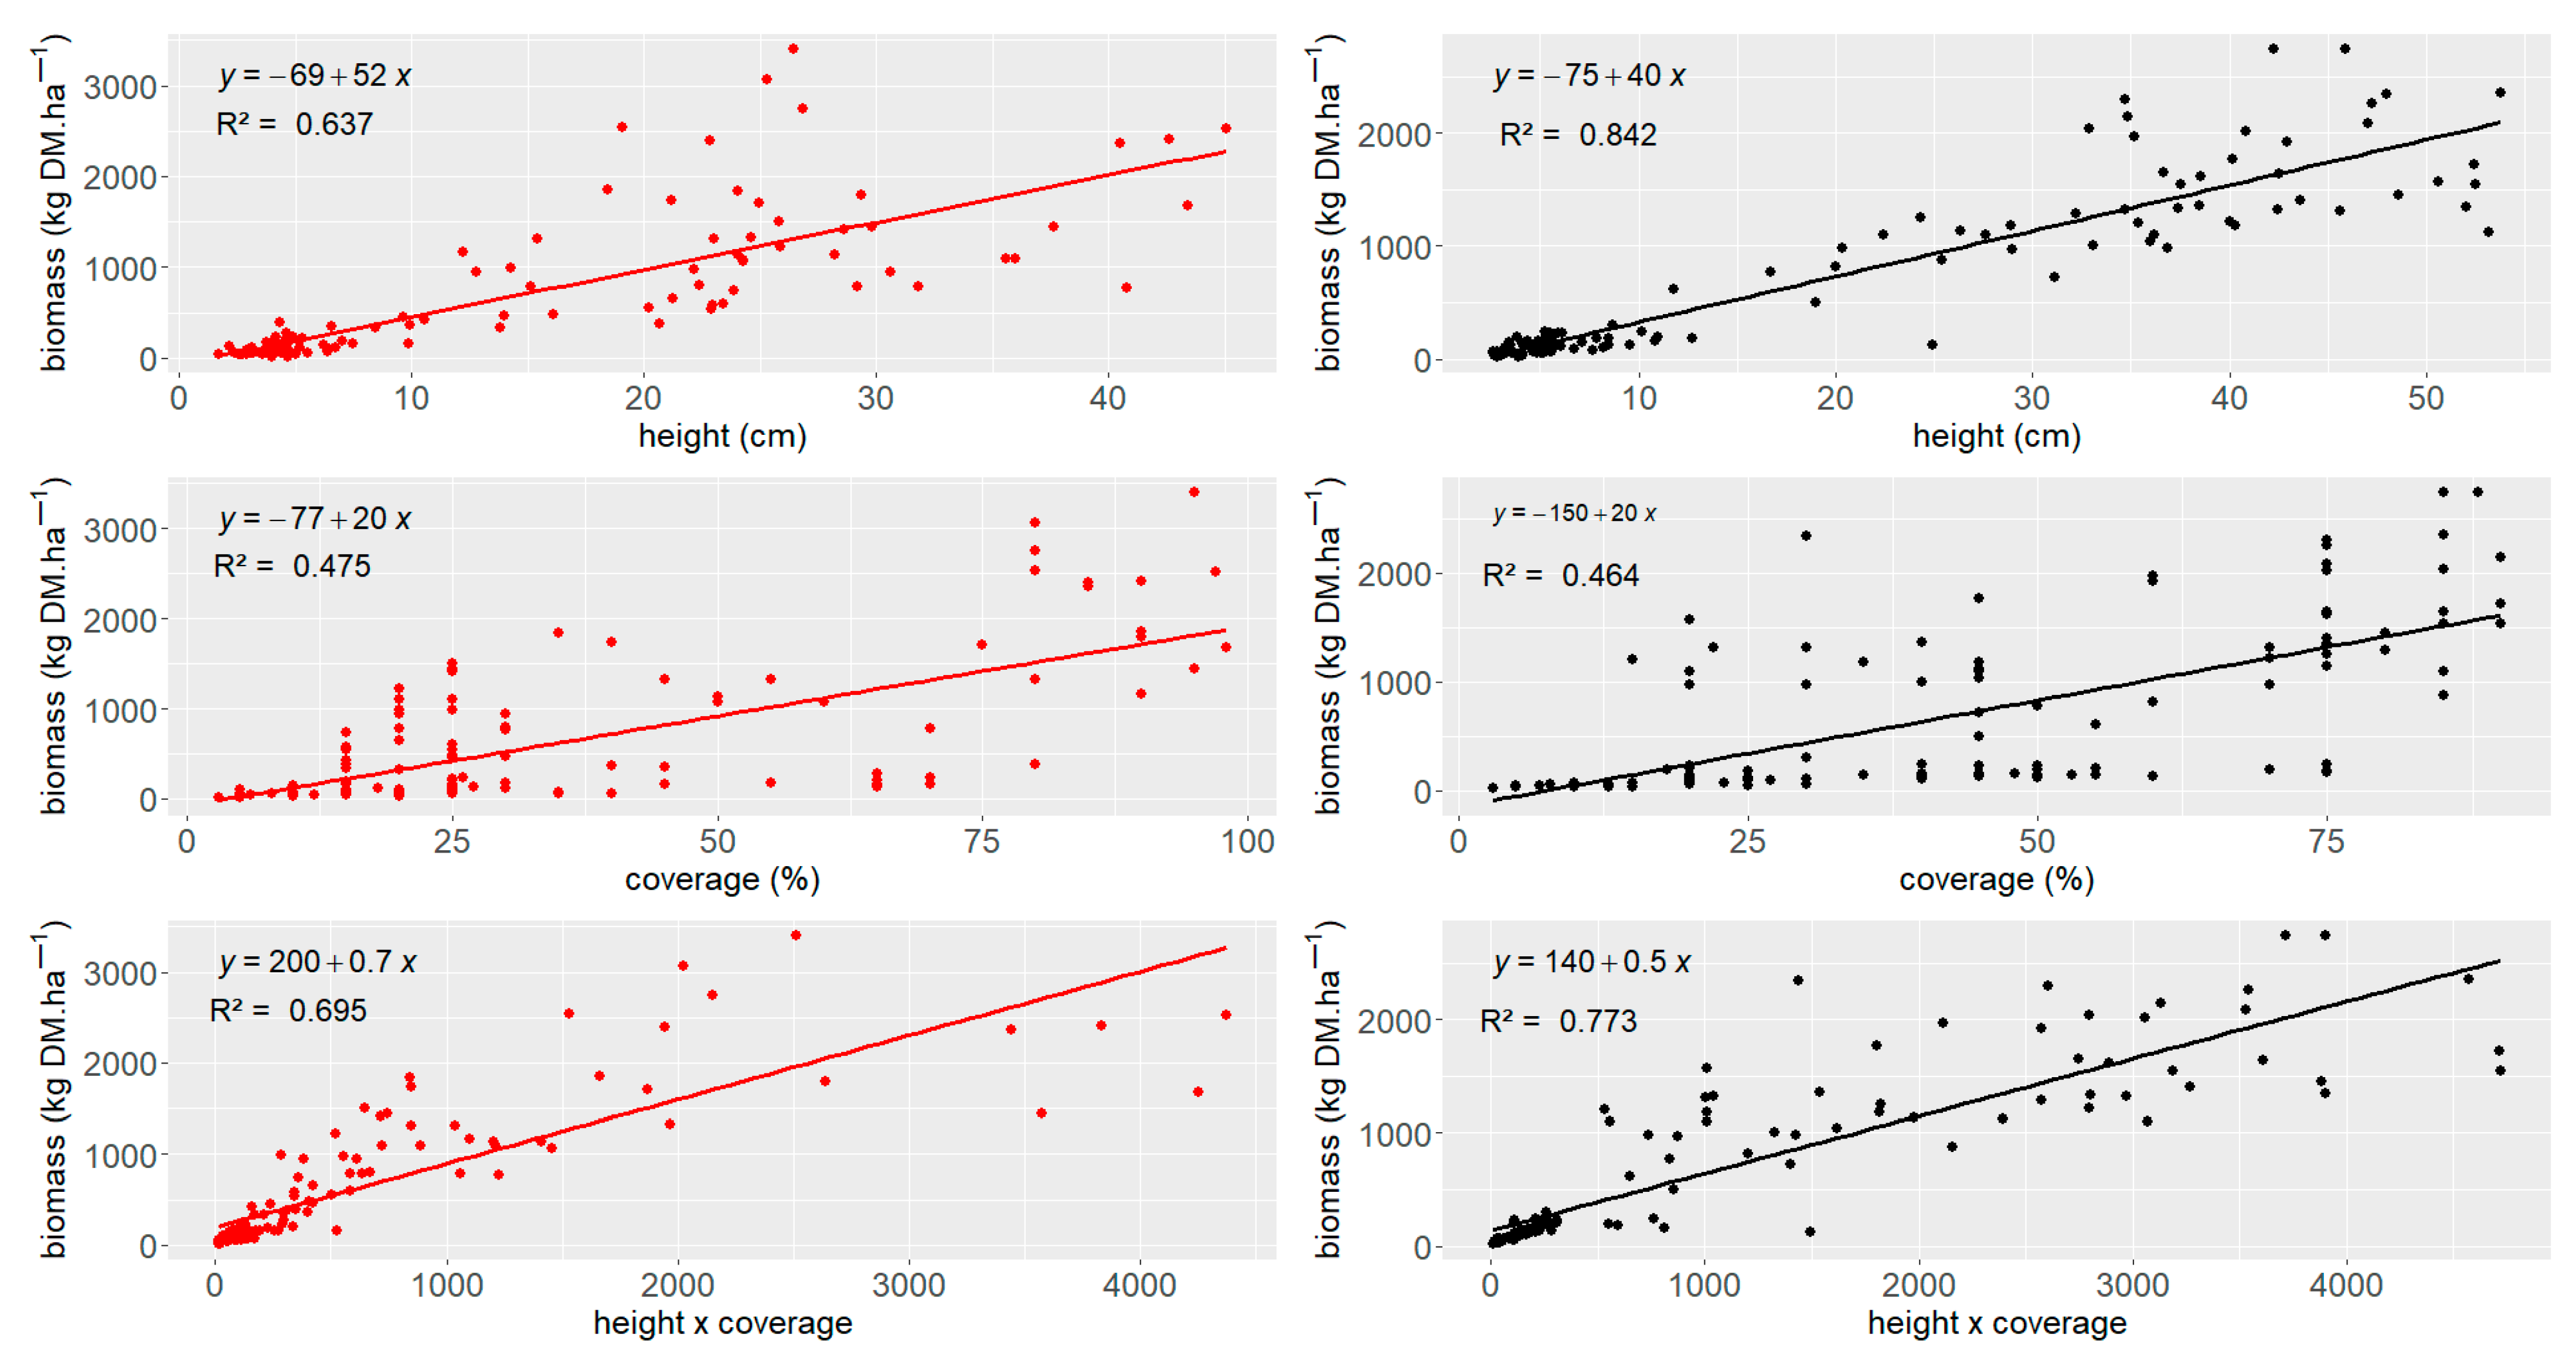
3.1. Relationships of Herbaceous Biomass with Height, Vegetation Coverage, and Volume Index in 2018

According to the R2, the height of the stratum and the volume index are more correlated to the biomass than the vegetation coverage. The herbaceous biomass was strongly correlated with the height of the stratum and the volume index. Still, the regression was substantially stronger for the fenced area’s herbaceous biomass than the grazed area. The herbaceous biomass was also correlated with the vegetation coverage, even though the regression determined herbaceous biomass less well due to low R2 (Figure 2).

3.2. Comparison of the Models Between Grazed and Fenced Sites

The models with volume index, coverage, and plant height (Figure 2) as explanatory variables were significantly different between the grazed and fenced sites (Table 1).

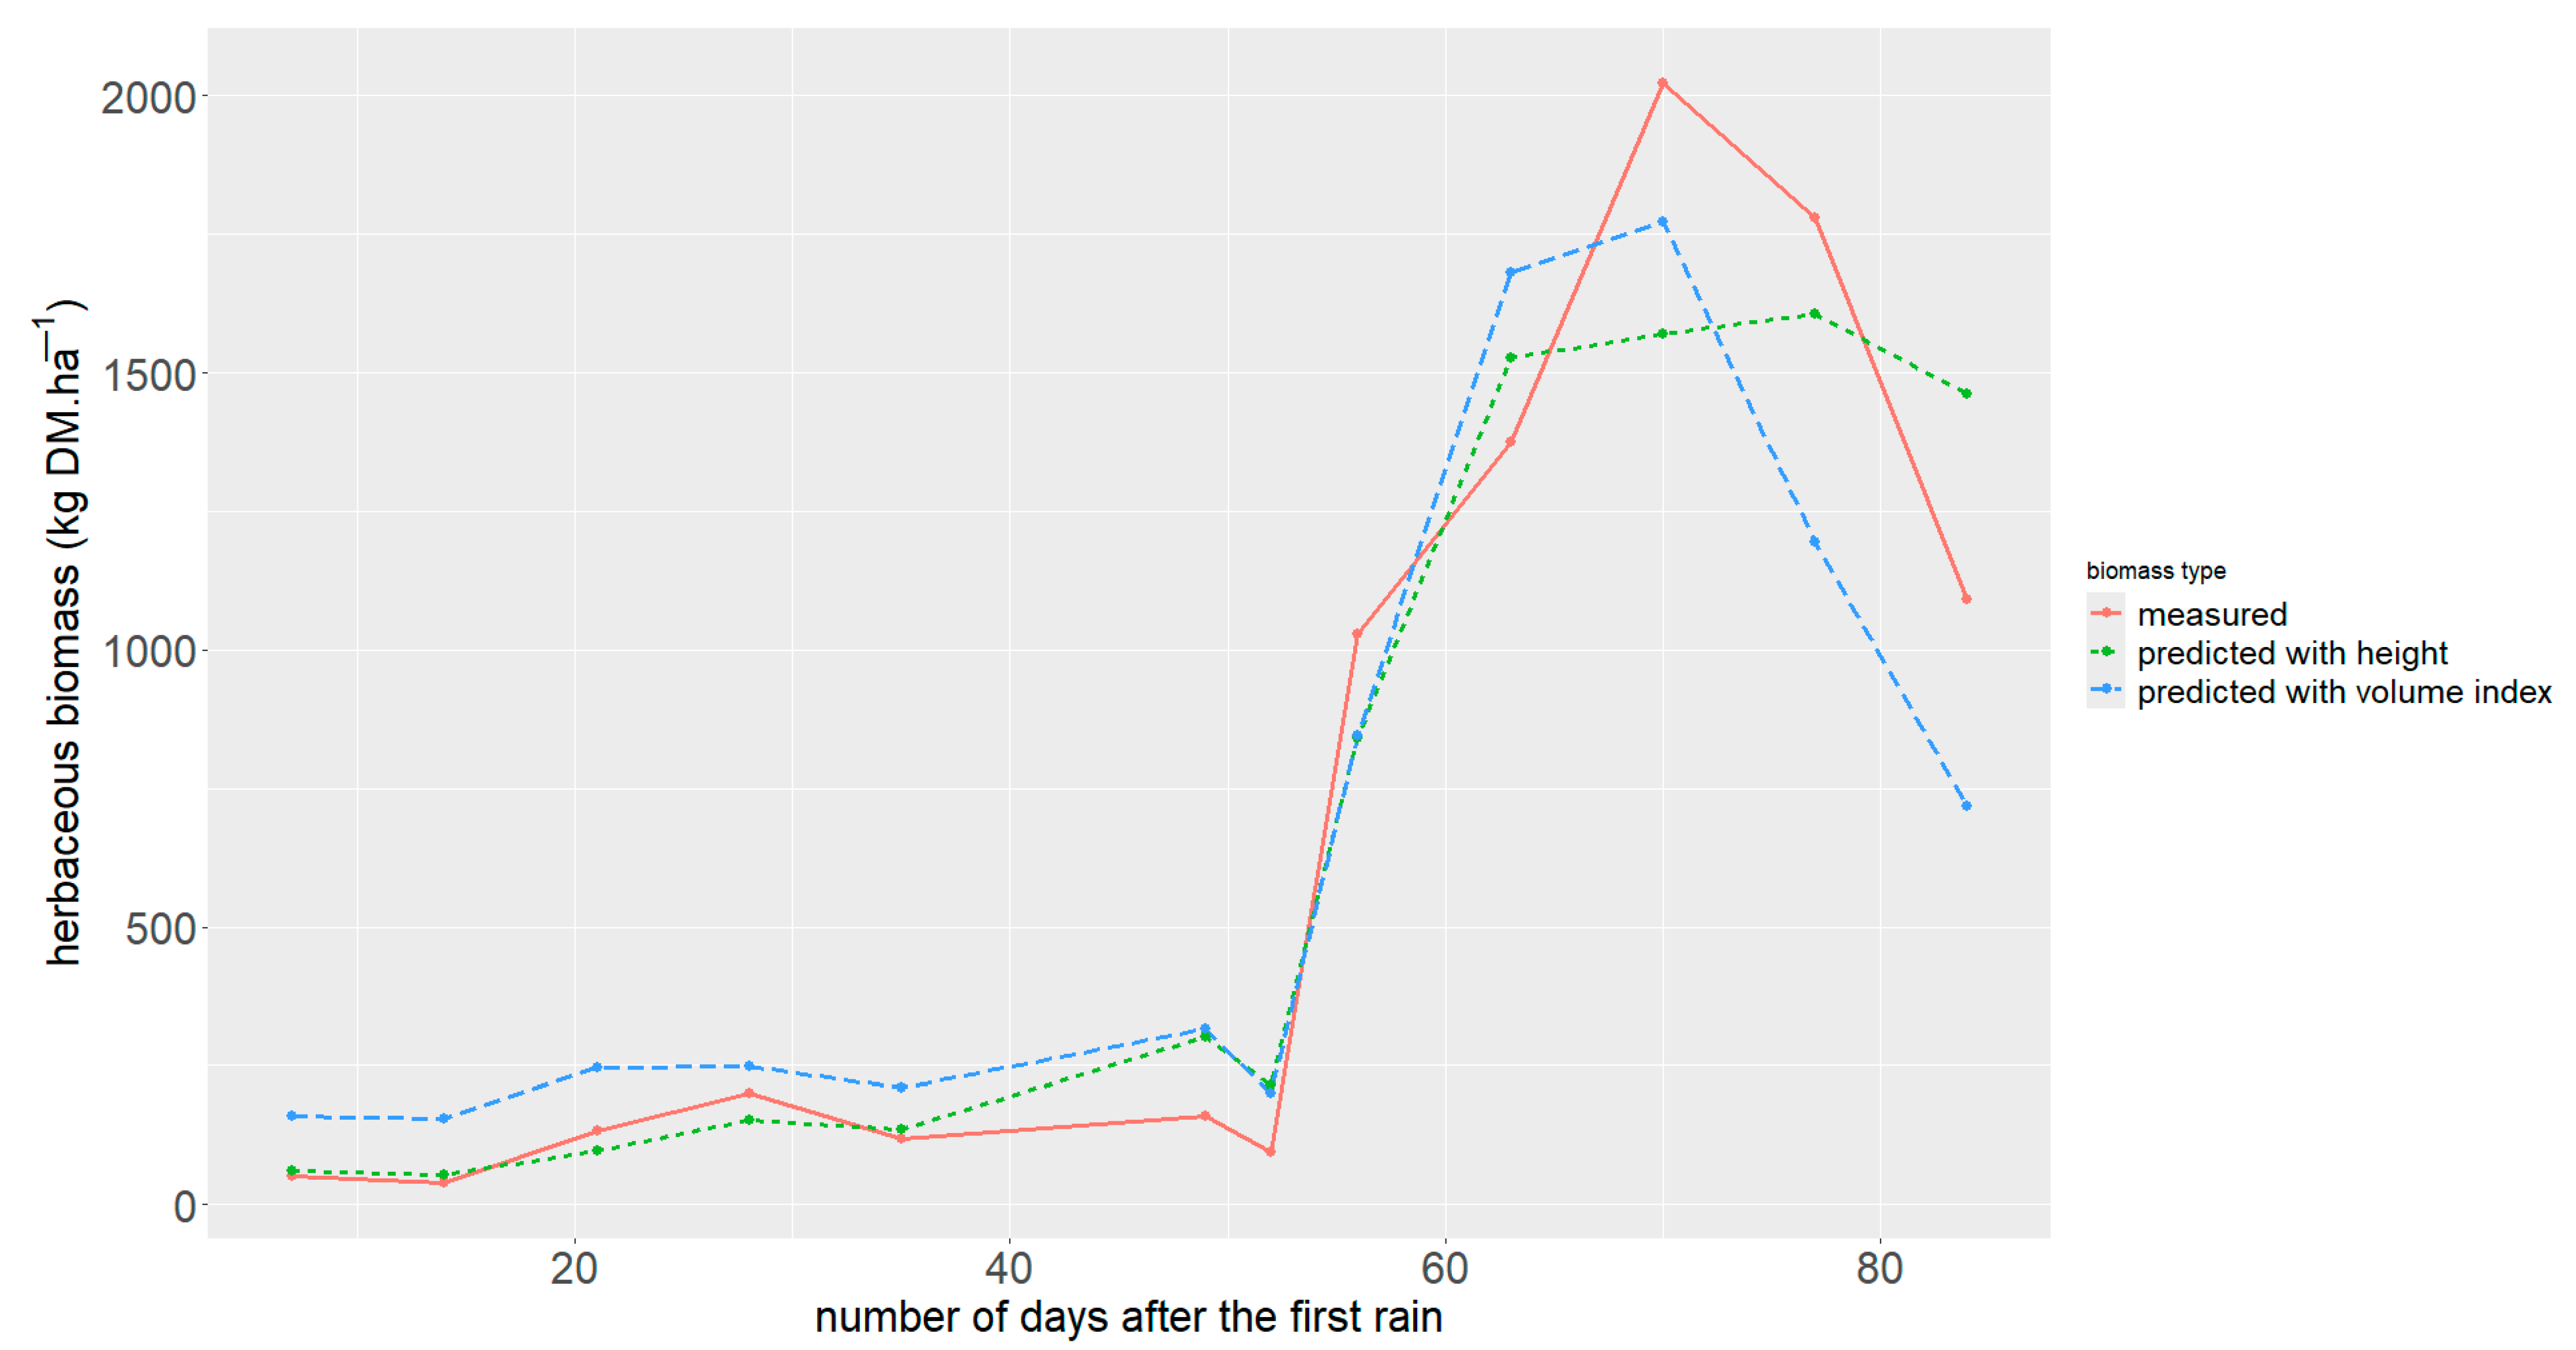
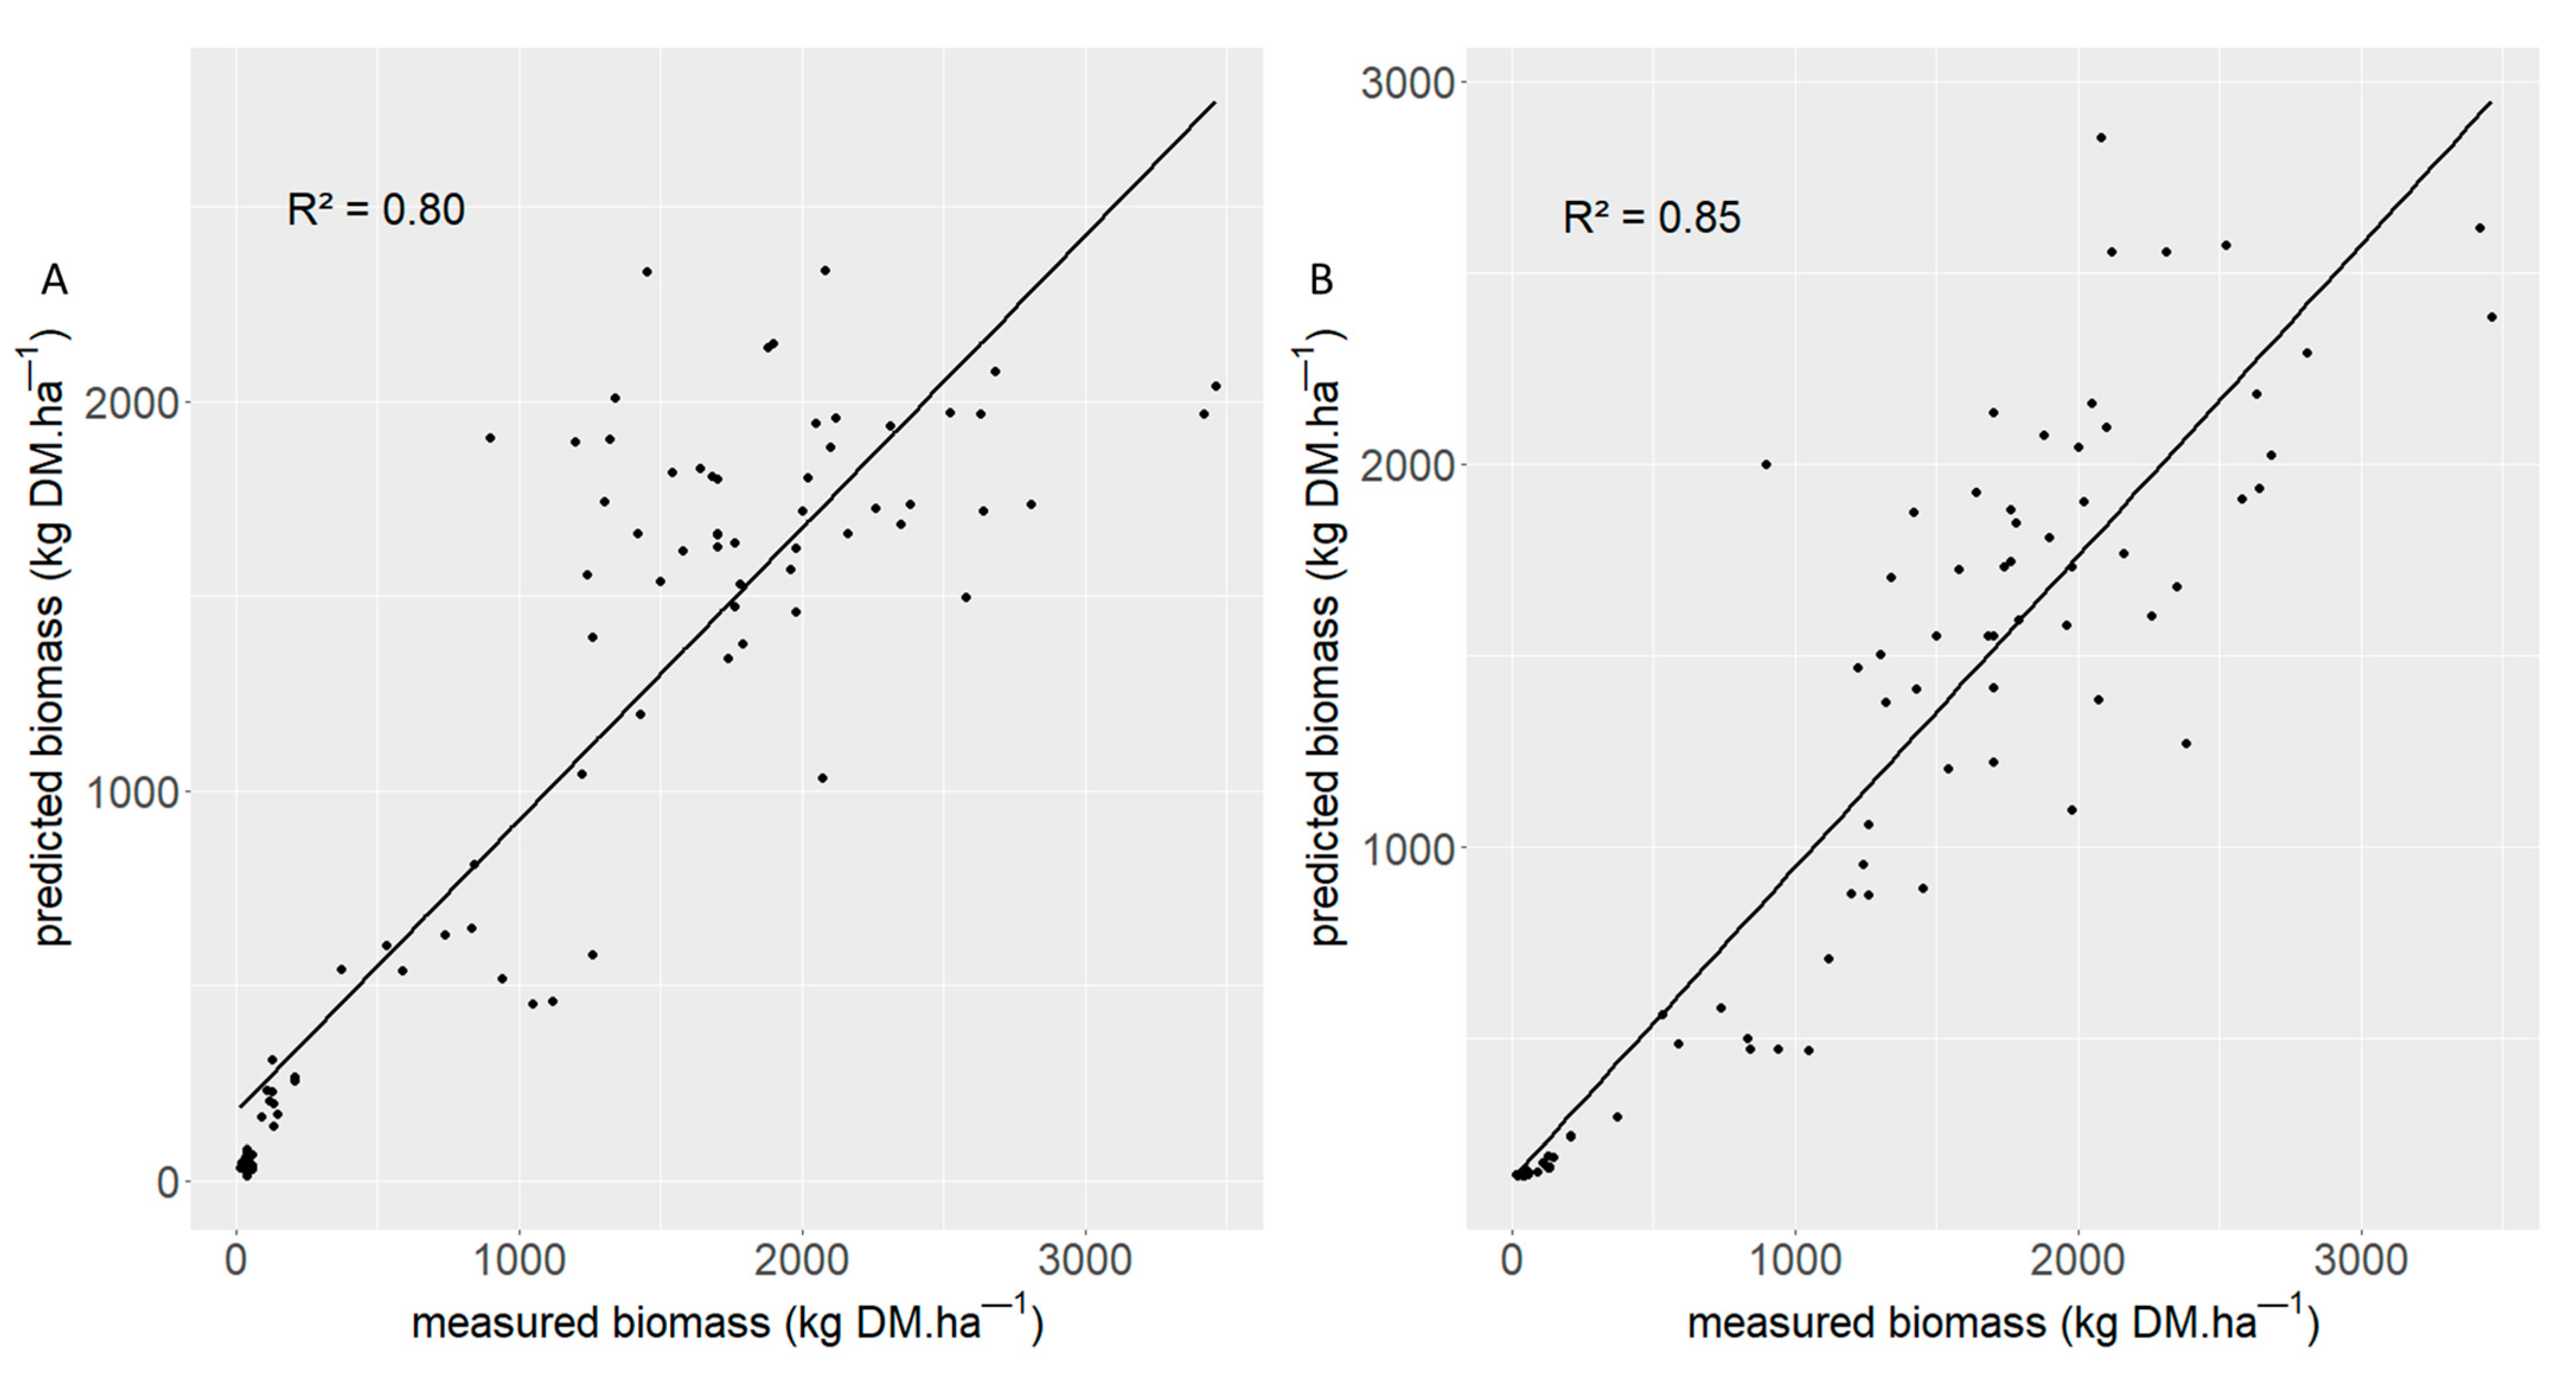
3.3. Model Evaluation Against Measured Herbaceous Biomass in 2017

The modeled herbaceous biomass shows the same seasonal dynamics in 2017 as the measured biomass. However, herbaceous biomass modeled based on plant height was substantially lower than the measured biomass, whereas that modeled based on the volume index was substantially closer to the measured biomass (Figure 3 and Figure 4).

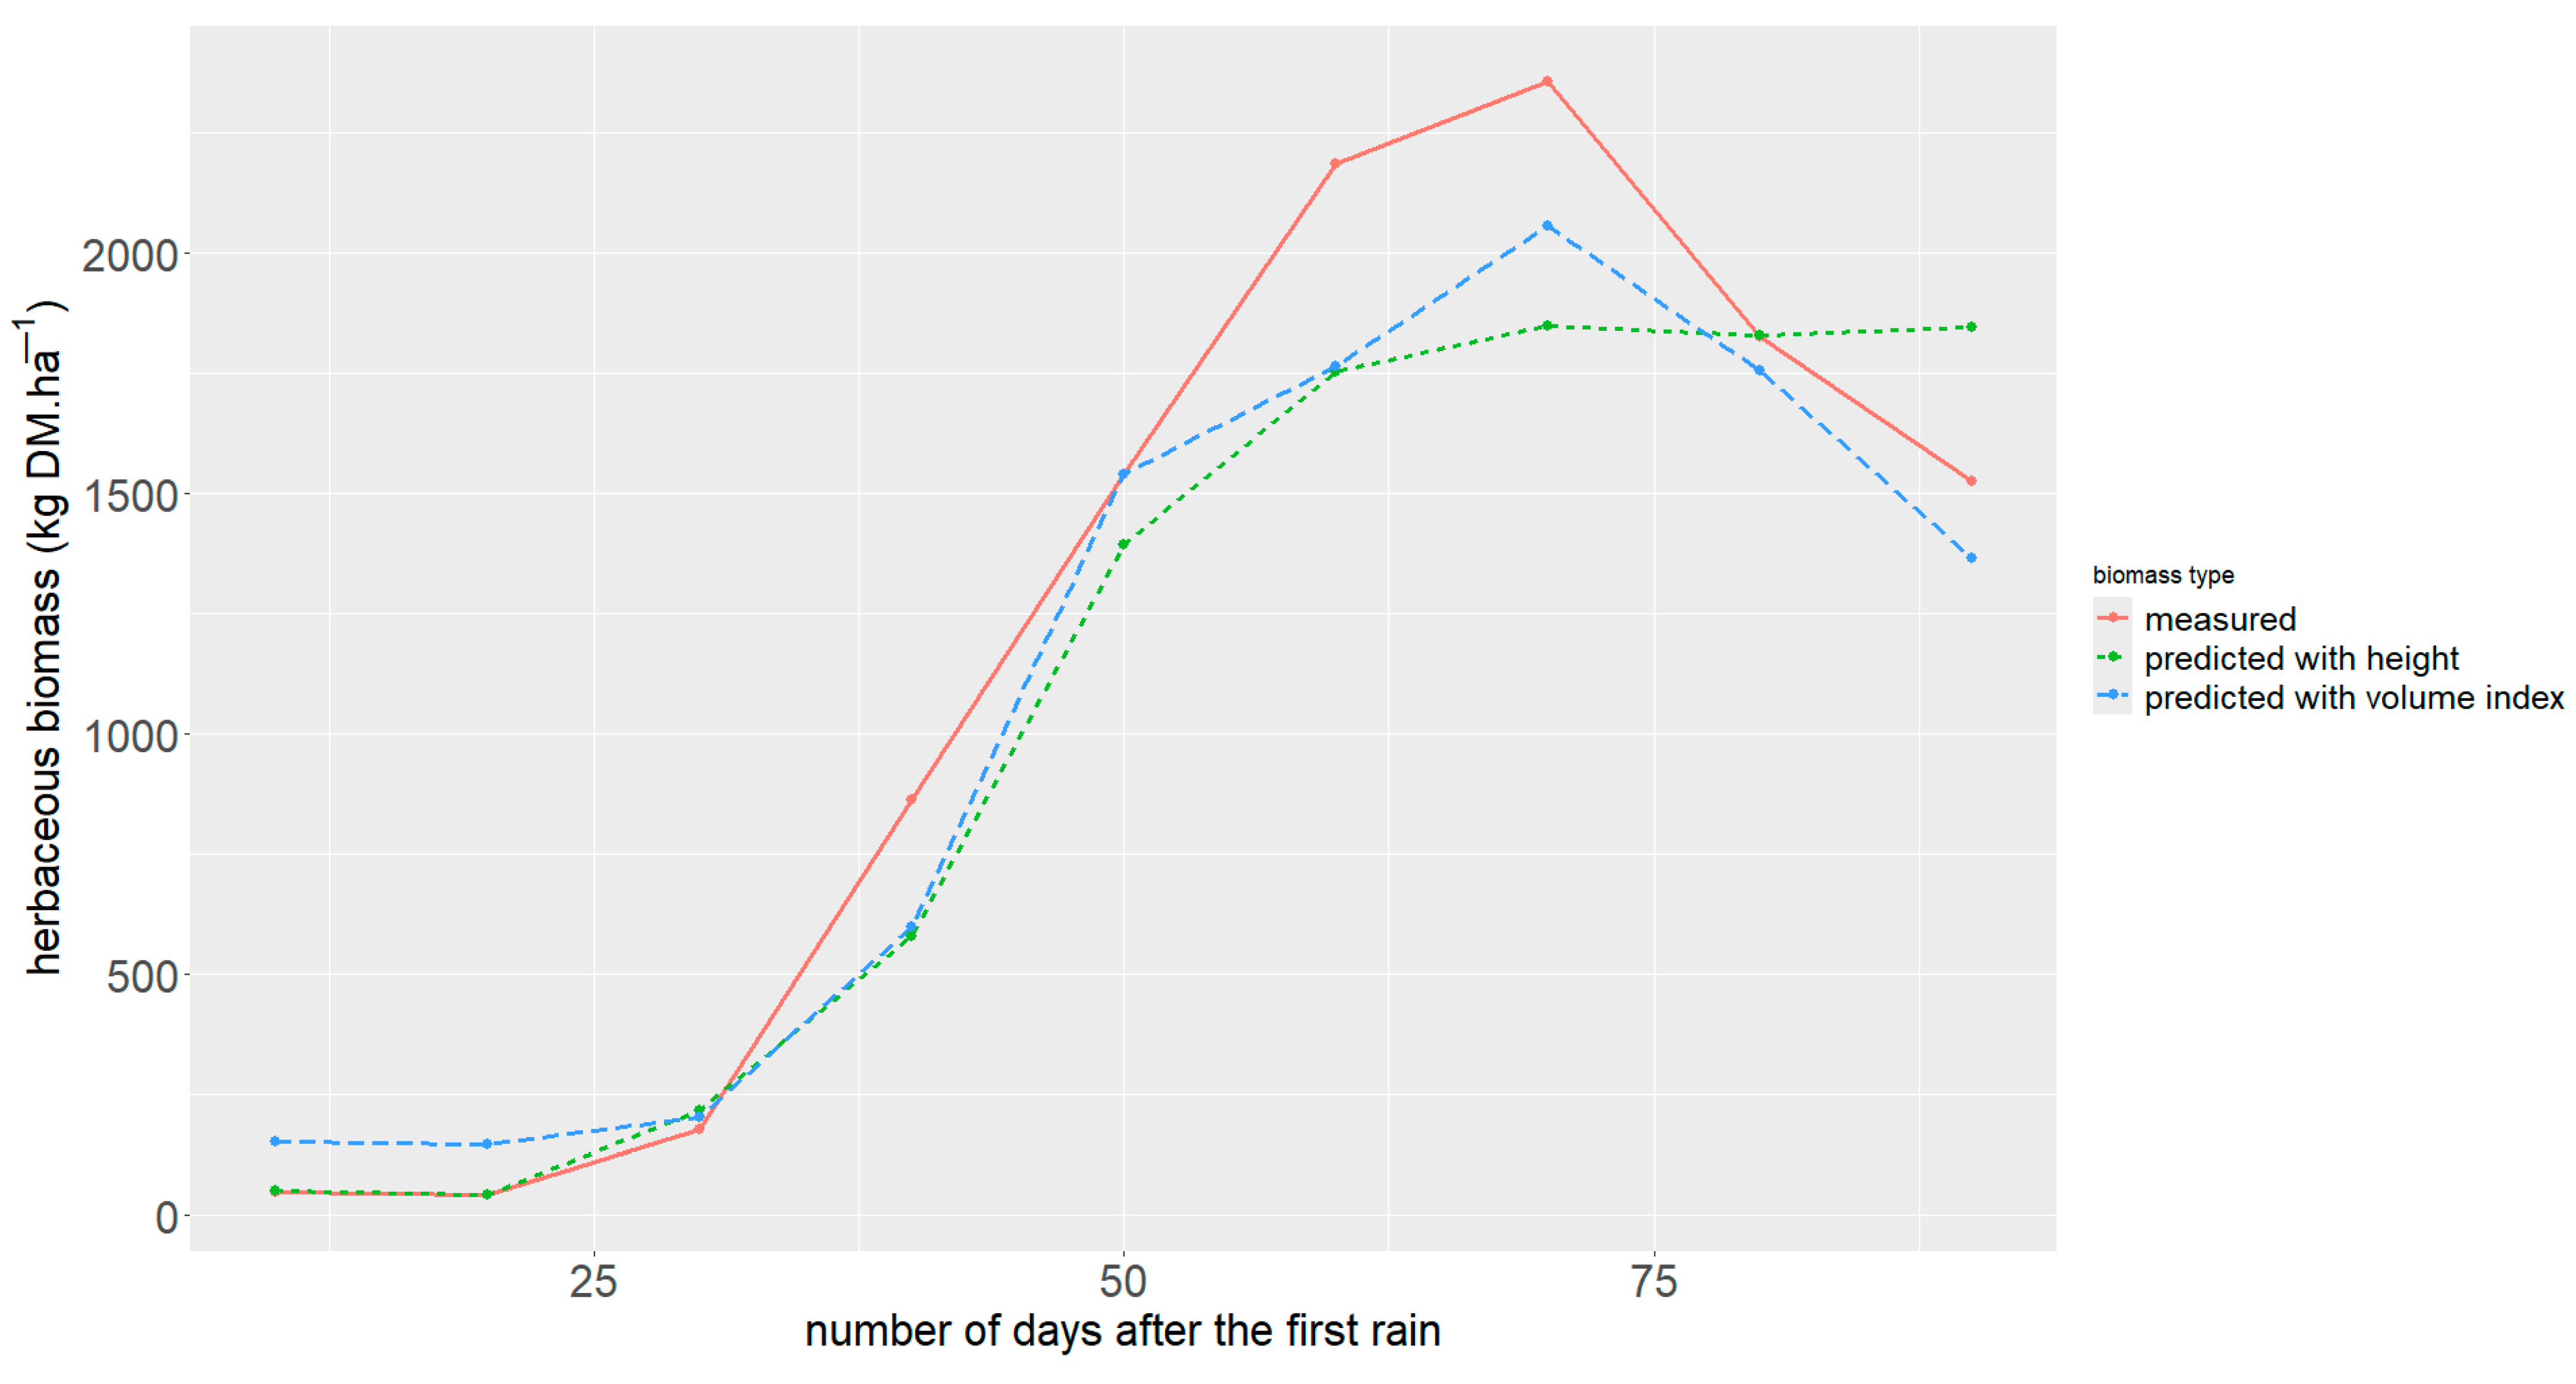
3.4. Model Evaluation Against Measured Herbaceous Biomass in 2019

In 2019, the modeled biomass’s seasonal dynamic followed the measured values again. However, herbaceous biomass modeled based on plant height was again substantially lower than the measured values, whereas the model based on the volume index is substantially closer to the measured (Figure 5). The model evaluation thereby indicated a closer fit to the field observations for the model based on volume index than for the model based on plant height only (Figure 6).

3.5. Models Validation

The Pearson’s coefficient of correlation (r), the absolute difference, and the relative difference between measured biomass and their predicted equivalents are presented in Table 2.

4. Discussion

Height and coverage are parameters whose dynamics allow the observation of seasonal variations in herbaceous biomass [4]. Indeed, plant germination is followed by a moment of slowed growth, allowing the tillering of grasses, the installation of the root system of already germinated plants, and the germination of later plants [15]. Then, the rapid growth phase begins, during which the plants grow in height and laterally (coverage). Our results confirm the positive correlation of herbaceous biomass with height and coverage, similar to those of [7], who found correlations of 0.68 for height and 0.75 for volume index under grazing. They also confirm that the best predictions are obtained with the volume index. The product of height and coverage is a volume index that, like the NDVI (Normalized Difference Vegetation Index), provides a better account of the available biomass. This shows that the simultaneous consideration of these two parameters allows a better biomass prediction [7]. On the other hand, [16] found that height alone was a poorer predictor but improved the predictive power slightly when added to multispecies models that already included diameter. Indeed, biomass is the combined effect of many variables, never just one. On the equation power, the linear equation (among other types of equations) between cover and biomass has a coefficient of determination (R2) of 0.95, with a p-value for the same model, but across all the quadrats, lower than 0.001 [17]. Our study is consistent with the latter in confirming the strong link between the plant height and coverage and the aboveground herbaceous biomass. This is true as plants grow upwards (height) and sideways (coverage, diameter).
The rangeland on which this study was conducted is grazed by cattle, sheep, goats, camelids, equines, etc. Grazing disrupts the dynamics of the biomass produced during the year. As biomass removal by livestock varies from day to day, there may be biases in the prediction models. Biomass prediction models developed with height and volume index differed between grazed and fenced areas. In this case, one hypothesis would be that grazing would disrupt the biomass–height and biomass–volume index relationships. The relationships of the fenced area thereby better reflected these relationships (fenced: 0.84 using plant height and 0.77 using the volume index; grazed: 0.63 for height and 0.69 for the volume index). In addition, the animal’s choice of grazing the tallest plants (Dumont, 1996) [18] could reinforce the spreading of plants instead of their growth in height, creating more heterogeneity. Even if the model gives the best results in the fenced area, it is still significant in the grazed area and shows the biomass dynamics during the rainy season. This shows the importance of the volume index parameter even in disturbed areas.
At the beginning of the rainy season, during the germination-installation phase, plant height is generally less than 10 cm [4]. This results in low forage harvesting by livestock. Given the hypothesis of a probable disruptive effect of grazing on the biomass–height and biomass–volume index relationships, this low removal at this time would justify that the lowest biomass values were better predicted than the highest biomass values. Indeed, if grazing affects the biomass–height and biomass–volume index relationships, it is obvious that this effect will be more pronounced where forage removal is greatest. This is what our results show with more difference between measured and predicted biomass on the highest biomass values, in line with the results of [7].
Despite a higher coefficient of determination between biomass and height (0.84) than the one between biomass and volume index (0.77), the predicted biomass was closer to the measured biomass when the volume index was used to make the prediction. Despite a slightly lower R2, the regression model between biomass and volume index can be more efficient in predicting biomass because of the introduction of an additional explanatory variable, in this case, the coverage, which captures important interactions between explanatory variables, better corresponding to the reality of the data. This is true as, despite coefficients of determination just below 0.5, the regression shows a positive trend between biomass and coverage (Figure 2).
The choice of establishing the herbaceous height from the height of ten individuals taken at random from each quadrat instead of measuring the height of the entire individuals in each quadrat was a good method. It allows us to observe height dynamics similar to biomass dynamics over the season [4] and to predict the available biomass.
This study was realized based on almost the same study made in a temperate region. This broadens the scope of the method (use of the herbaceous height and coverage to estimate the aboveground biomass) by applying it in a region with a different climate.

5. Conclusions

The plant’s height of 10 random individuals in a one-meter square sample plot and the coverage of the herbaceous layer are easy to measure and non-destructive parameters, allowing the prediction of biomass with acceptable accuracy. The models developed between biomass and height and between biomass and volume index were specific to the type of site (grazed or fenced). The use of the method developed in this study will be most meaningful when the volume index (height × coverage) is measured. Even if the model based on the coverage shows a low coefficient of correlation, it reveals that the coverage dynamic has a similar trend as the herbaceous biomass.
This method is innovative in that it is different from the destructive methods often used to quantify herbaceous biomass. It could be very helpful in herbaceous stratum monitoring by saving time and making the herbaceous biomass assessment in research activities and rangeland management easier.
Since rainfall is highly variable from one year to the next, the models could be improved if the parameters tested in this study were measured over a larger number of years. We also recommend taking into account more variables involved in herbaceous biomass production.

Author Contributions

Conceptualization, O.D., A.A.-J.N. and C.F.; methodology, O.D. and S.T.; software, O.D.; validation, A.A.-J.N., C.F., P.S., O.N., S.D., D.N. and T.T.; formal analysis, O.D.; investigation, O.D., A.A.-J.N. and C.F.; resources, Not applicable; data curation, O.D.; writing—original draft preparation, O.D.; writing—review and editing, O.D., A.A.-J.N., C.F., P.S., O.N., S.D., D.N., T.T. and S.T.; visualization, Not applicable; supervision, S.T.; project administration, S.T; funding acquisition, ST PS ON. All authors have read and agreed to the published version of the manuscript.

Funding

This research received no external funding.

Data Availability Statement

The current study’s data are accessible from the corresponding author upon reasonable request.

Acknowledgments

Thanks to Mamadou Diémé and Pathé Lô for their support during data collection.

Conflicts of Interest

The authors declare no conflicts of interest.

References

  1. Hiernaux, P.; Le Houérou, H.N. Les parcours du Sahel. Sécheresse 2006, 17, 51–71. [Google Scholar]
  2. Le Houérou, H.N. The Rangelands of the Sahel. J. Range Manag. 1980, 33, 41–46. [Google Scholar] [CrossRef]
  3. Ndiaye, C.; Guèye, E.F.; Ngom, S.; Traoré, E.H.; Akpo, L.E. Impact of rainfall on grassland biomass production in the Sahel: A case in Matam Region, Northern Senegal. Livest. Res. Rural. Dev. 2015, 27, 55. [Google Scholar]
  4. Diatta, O. Dynamique Saisonnière et Interannuelle de la Strate Herbacée des Parcours Sahéliens du Sénégal (Crz-Dahra, Nord-Sénégal). Ph.D. Thesis, Université Cheikh Anta Diop, Dakar, Senegal, 2021; 105p. [Google Scholar]
  5. Ndiaye, O. Déterminants de la Dynamique de la Végétation d’un Milieu Pâturé en Région Sahélienne du Sénégal. Ph.D. Thesis, Université Cheikh Anta Diop, Dakar, Senegal, 2015; 133p. [Google Scholar]
  6. Levang, P.; Grouzis, M. Methods of studying the herbaceous biomass of Sahelian formations: Application to the Oursi pond, Upper Volta. Acta Oeco/Oecol Plant 1980, 3, 231–244. [Google Scholar]
  7. Büchi, L.; Mouly, P.; Amossé, C.; Bally, C.; Wendling, M.; Charles, R. Méthode non destructive d’estimation de la biomasse de couverts végétaux. Rech. Agron. Suisse 2016, 7, 136–143. [Google Scholar]
  8. Reinermann, S.; Asam, S.; Kuenzer, C. Remote sensing of grassland production and management-A review. Remote Sens. 2020, 12, 1949. [Google Scholar] [CrossRef]
  9. Taugourdeau, S.; Diedhiou, A.; Fassinou, C.; Bossoukpe, M.; Diatta, O.; N’Goran, A.; Audebert, A.; Ndiaye, O.; Diouf, A.A.; Tagesson, T.; et al. Estimating herbaceous aboveground biomass in Sahelian rangelands using structure from motion data collected on the ground and by UAV. Ecol. Evol. 2022, 12, e8867. [Google Scholar] [CrossRef] [PubMed]
  10. Ruster, J. Evolution du Couvert Végétal de la Région de Téssékré au Sénégal, par le Biais de la Télédétection. Master’s Thesis, Université Diderot-Paris 7, Paris, France, 2009; 60p. [Google Scholar]
  11. Bakhoum, A. Dynamique des Ressources Fourragères: Indicateur de Résilience des Parcours Communautaires de Tessekere au Ferlo, (Nord-Sénégal). Ph.D. Thesis, Université Cheikh Anta Diop, Dakar, Senegal, 2013; 115p. [Google Scholar]
  12. Sarr, M.A. Évolution Récente du Climat et de la Végétation au Sénégal (Cas du Bassin Versant du FERLO) (Vol. 3). Ph.D. Thesis, Université de Lyon, Université Cheikh Anta Diop, Dakar, Senegal, 2009; 384p. [Google Scholar]
  13. Casenave, A.; Valentin, C. Les états de surface de la zone sahélienne. In Influence Sur L’infiltration; Collection Didactiques; Orstom: Paris, France, 1989; 229p. [Google Scholar]
  14. R. C. Team. R: A Language and Environment for Statistical Computing; R Foundation for Statistical Computing: Vienna, Austria, 2021; Available online: https://www.R-project.org/ (accessed on 4 November 2024).
  15. Cornet, A. Le Bilan Hydrique et Son Rôle Dans la Production de la Strate Herbacée de Quelques Phytocénoses Sahéliennes au Sénégal. Ph.D. Thesis, Université des Sciences et Techniques du Languedoc, Montpelliern, France, 1981; 351p. [Google Scholar]
  16. Nafus, A.M.; McClaran, M.P.; Archer, S.R.; Throop, H.L. Multispecies allometric models predict grass biomass in semidesert rangeland. Rangel. Ecol. Manag. 2009, 62, 68–72. [Google Scholar] [CrossRef]
  17. Gupta, A.; Sagar, R.; Pandey, A. Unraveling the Relationship between Percentage Cover and Biomass of Various Herbaceous Species in the Dry Tropical Grassland. Int. J. Plant Environ. 2023, 9, 133–142. [Google Scholar] [CrossRef]
  18. Dumont, B. Préférences et Sélection Alimentaire au Pâturage. INRA Prod. Anim. 1996, 9, 359–366. [Google Scholar] [CrossRef]
Figure 1. Plots along the transects for the measurements in 2018 and 2019 of the grazed site (G) and the fenced site (F), as well as for 2017 measurements.
Biomass 04 00066 g001
Figure 2. Relationships between herbaceous biomass with height, vegetation coverage, and volume index in 2018. The red color indicates the grazed area and the black color indicates the fenced area.
Biomass 04 00066 g002
Figure 3. Dynamics of measured and modeled herbaceous biomass in 2017 with height and volume index in the fenced area.
Biomass 04 00066 g003
Figure 4. Relationship between measured values in 2017 and their predicted equivalents with height (A) and volume index (B).
Biomass 04 00066 g004
Figure 5. Dynamics of measured and modeled herbaceous biomass in 2019 with height and volume index in the fenced area.
Biomass 04 00066 g005
Figure 6. Relationship between measured biomass values in 2019 and their predicted equivalents with height (A) and volume index (B).
Biomass 04 00066 g006
Table 1. Significance of models according to grazed and fenced sites.
Modelsp-Value (Between Grazed and Fenced Sites)
Biomass × height<2.2e−16
Biomass × coverage<2.2e−16
Biomass × volume index<2.2e−16
Table 2. Model validation parameters.
20172019
Measured Biomass/Predicted Biomass with HeightMeasured Biomass/Predicted Biomass with Volume IndexMeasured Biomass/Predicted Biomass with HeightMeasured Biomass/Predicted Biomass with Volume Index
Person coefficient (r)0.9530.9550.8930.923
Absolute average difference
(kg DM·ha−1)
211.4496.69120.6287.61
Relative difference (%)30.511.9611.358
Disclaimer/Publisher’s Note: The statements, opinions and data contained in all publications are solely those of the individual author(s) and contributor(s) and not of MDPI and/or the editor(s). MDPI and/or the editor(s) disclaim responsibility for any injury to people or property resulting from any ideas, methods, instructions or products referred to in the content.

