Abstract
The red seaweed Kappaphycus alvarezii is an economically important gelling agent κappa carrageenan source. Phytochemical analysis has pointed to the presence of various other inorganic and organic compounds, which are expanding the application of biomass as a biostimulant in the agroindustry and as a source of new bioactive molecules in the food, chemical, and pharmaceutical industries. Native to Southeast Asia, K. alvarezii has been introduced as an exotic species in Brazil for commercial large-scale farming. Nowadays, legal farming areas are located in the South and on the South-East coast, but with initiatives to be authorized in the country’s Northeast. The biomass yield in a large-scale farming system can be affected by cultivation techniques and environmental stressors, such as temperature, salinity, water quality, disease, and predators. The use of high-resolution images obtained with unmanned aerial vehicles (UAV or drones) is becoming a popular technology in agriculture, and it has the potential to be employed in seaweed farming to extract a variety of variables and features to predict biomass yield throughout the cultivation period. The present study was conducted to analyze and select multispectral indices obtained from images collected by drone for the detection and quantification of K. alvarezii in a commercial cultivation environment in Brazil. Frequency analysis of pixel values, statistical analyses, and visual interpretations for 24 pre-selected indices was applied according to scores attributed to the efficiency of image segmentation. This analysis resulted in the selection of four indices (ABDI1, ABDI2, CIG, and GNDVI) as the best ones for the segmentation of images in the K. alvarezii commercial farms analyzed. The data obtained are the first step in improving the analysis process of images generated by drones, which will facilitate decision-making and better management, and help scale-up K. alvarezii farming in Brazil.
1. Introduction
Seaweed farming, i.e., the cultivation of seaweed on a commercial scale, has gained attention worldwide because of its broad biotechnological applications, including agribusiness and the food, pharmaceutical, cosmetic, textile, and manufacturing industries [1]. In Brazil, one of the most common seaweed species found in commercial crops is Kappaphycus alvarezii (Rhodophyta, Gigartinales), which is mainly used for the production of carrageenan, a colloid widely used in the pharmaceutical and food industries [2,3].
This species of macroalgae has a variable color, which defines three basic morphotypes: green, red, and brown. However, depending on pigment concentration, it can vary between reddish, yellowish, brown, and green colors. Native to Southeast Asian countries like Malaysia and the Philippines, it became one of the most cultivated seaweeds in tropical regions of the world [4]. In Brazil, the commercial cultivation of this seaweed was started in São Paulo in 1998 and was later authorized on the coasts of Rio de Janeiro and Santa Catarina states [2]. There are also initiatives to be authorized in the Northeast of the country. One reason for choosing this species is its rapid growth rate with a cultivation cycle (planting to harvest) that usually lasts from 35 to 60 days, depending on the time of the year. Depending on the cultivation method, the seaweed biomass can increase rapidly during this period and reach an average relative growth rate of 7.24%/day [5,6].
According to FAO [7], the reported global production of K. alvarezii in 2020 was 1.604 million tons (fresh weight), accounting for 4.6% of total algal production. In Brazil, according to the Ministry of Fisheries and Aquaculture, production was estimated to be 545 tons in the year 2022 [8].
Since the commercial cultivation of K. alvarezii is a relatively new economic activity still not widespread in Brazil, producers face various challenges. Commercial crops in the southern coastal region of the State of Rio de Janeiro and northern São Paulo have been implemented with a high proportion of manual labor, a low degree of computerization of processes and controls, and practically no type of automation.
Fixing the seaweed using tubular netting or tie–tie techniques in floating linear modules is one of the main methods of rational cultivation of K. alvarezii. These structures are usually set up in coastal areas where the depth of the sea does not exceed 20 m, and relatively close to the mainland. This approach provides sufficiently controlled cultivation conditions in terms of insolation, ease of inspection and repair of the structures, and monitoring of predators (mainly turtles and crustaceans) or competitors, among other advantages [9]. However, the location of the cultivation modules in the semi-open sea impairs overall monitoring. Access is by boat or barge, restricting mobility among modules. Under Brazilian production conditions, the quantification and monitoring of growth are mainly based on visual criteria and, therefore, depend on the producer’s practical experience. Thus, no scientifically proven correlations or indirect measurement methods would allow mass, area, or volume quantification. In addition, the damage caused by the action of predators is also difficult to quantify.
In qualitative terms, there are still no consolidated instruments or methodologies for standardizing the colors or levels of pigments present in cultured seaweed. This fact hinders the segregation of produced batches based on the levels of chlorophyll or other commercially important pigments.
Santos et al. (2022) [10] list some reasons for the relative delay in the consolidation of commercial seaweed cultivation in the southeast region of Brazil, including the need for mechanization of the production process, the lack of management of marine seaweed farms, and the lack of researchers focusing on seaweed production technology. On the other hand, the use of small unmanned aerial vehicles (UAVs), commonly known as drones, has increased over recent years with the expansion of their application to the most diverse sectors. Prominent sectors include agriculture and other economic exploitation of natural resources, such as mining and forestry. In addition, computer techniques for processing the images obtained via cameras embedded in drones have provided relevant data on the monitored activities.
There is an urgent need to generate technological information for the operational support, improvement of management, and optimization of commercial seaweed crops in Brazil. Within this context, remote sensing techniques for seaweed mapping are important for complementing and enhancing conventional field methods (collection of samples from the sea), which are accurate but limited to small areas and expensive [11]. On the other hand, remote sensing techniques permit the simultaneous photographing of large areas (and at different wavelengths) at a relatively small cost per unit of monitored area. Remote sensing enables the mapping and classification of shallow marine waters, the detection and monitoring of kelp forests, the differentiation between different types of aquatic vegetation, the classification of macroalgae, the detection of submerged seaweed habitats, and even the mapping of benthic macroalgae habitats in turbid coastal waters [11].
Recent developments in drone technology and transitioning from military applications to environmental research have opened the door to drone-based monitoring of algal blooms [12]. Although drones currently cannot compete with the spatial extent and spectral capacity offered by satellite or aircraft sensors, they enable greater temporal revisitation and better spatial resolution, thus facilitating real-time monitoring.
The use of drones as a data-collection tool has led to significant advances in the field of algal monitoring for the most diverse purposes because of the increasing flight autonomy, possibility of access to remote locations, payload capacity, and easy adaptation of sensors, among other advantages [13,14,15]. Within this context, the present study aims to analyze and select multispectral indices obtained from images collected by drone for the detection and quantification of the seaweed K. alvarezii in a commercial cultivation environment in Brazil.
The present paper is part of a larger study that aims to develop a platform to manage algae production, mostly based on drone imagery. Nowadays, practically all the steps in the cultivation process are done manually; the grower must take a vessel and go to the cultivation, grab the algae lines out of the water to check or estimate the growing rate, weight, predator signs, etc. Selecting a proper index to segregate the algae biomass in the cultivation is the first step towards using drone imagery to manage K. alvarezii cultivation.
2. Materials and Methods
2.1. Contextualization
The use of drones allows the remote collection of data and details of the surfaces of interest. Professional drones of larger size and operational capacity can be equipped with different cameras, depending on the analysis to be carried out. Drones are usually equipped with RGB cameras (or “sensors”), which record images only in the visible range of the light spectrum, specifically blue (450 ± 50 nm), green (550 ± 50 nm) and red (650 ± 50 nm) [16]. However, there are multispectral and hyperspectral cameras that, in addition to the visible spectrum, also record images in the non-visible spectrum, specifically the infrared spectrum (700–15,000 nm).
Multispectral indices are dimensionless radiometric parameters that combine and transform the spectral reflectance response of the target (seaweed) into numerical values, enabling the study and modeling of spectral data in conjunction with other interesting data. In the case of seaweed, the spectral reflectance behavior cannot be explained only by the intrinsic characteristics of their components (thalli) but must also include the interference from other variables, such as the turbidity of seawater, depth of seaweed, predominant color, and scattering of sunlight.
The thalli of macroalgae are the main fixation organ that absorbs electromagnetic radiation, which depends on their composition, pigment content, level of photosynthetic activity, morphology, and internal structure [17]. Due to their photosynthetic function, the absorption spectra of solar radiation of macroalgal thalli differ according to the pigments present (Figure 1). Figure 1 illustrates the wavelengths of light absorbed by different pigments during photosynthesis. Blue wavelengths possess higher energy and shorter wavelengths than red wavelengths, which are longer and have lower energy. In aquatic environments, red wavelengths are absorbed near the surface, while blue wavelengths can penetrate more deeply into the water. Green, red, and brown seaweed all contain carotenoids and chlorophyll a, however, they differ in their photosynthetic accessory pigments [18]. The absorption peaks for Chlorophyll a (blue line), Chlorophyll b (red line), and Chlorophyll c (green line) are approximately 430 nm and 662 nm, 453 nm and 642 nm, and 460 nm and 630 nm, respectively. For Carotenoids (purple line), Phycocyanin (light blue line), and Phycoerythrin (orange line), the absorption peaks are around 450 nm and 480 nm, 620 nm, and 565 nm, respectively.
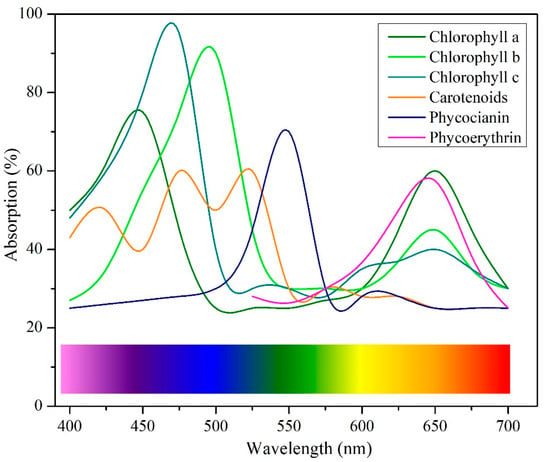
Figure 1.
Spectral absorption behavior in the visible range according to the pigments (adapted from [18]).
However, like the leaves of taller plants, healthy macroalgae reflect most of the infrared radiation (Figure 2a). As mentioned earlier, the depth of seaweed is also an important factor affecting their spectral response. The spectrum reflectance, as depicted in Figure 2a, demonstrates the reflective properties of various materials across different wavelengths (nm). Green seaweed exhibits a notable increase in reflectance beyond 700 nm, indicating a higher reflectance in the near-infrared region. Similarly, red seaweed shows an enhanced reflectivity above 700 nm, although to a lesser extent than green seaweed. In contrast, brown seaweed displays a reflectance that progressively rises with increasing wavelengths. Regarding mineral reflectance, stones present a relatively stable reflectance curve, with a slight upward trend at longer wavelengths. Sand, however, shows a consistent increase in reflectance over the entire wavelength spectrum. The reflectance of clay also rises steadily and smoothly across the wavelength range. These distinct reflectance patterns are fundamental for various applications, such as vegetation and soil analysis via remote sensing. They enable the differentiation of vegetation types, minerals, and other materials based on their spectral signatures.
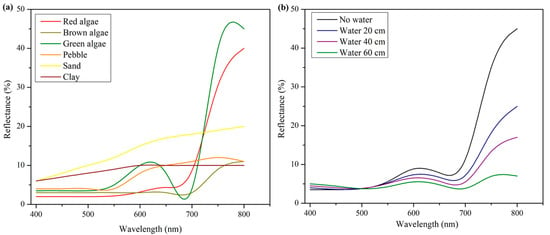
Figure 2.
Spectral reflectance behavior of macroalgae in the visible and infrared range (a) and in function of depth in the water column (b) (adapted from [19]).
Figure 2b shows how the presence of water at different depths affects the reflectance of seaweed. It can be seen that reflection by the macroalgae in the infrared spectral range (<700 nm) decreases as the depth increases. Longer wavelengths (about 700–800 nm) without water have increased reflectance, particularly in the near-infrared. This increased reflectance is expected, as a dry surface reflects more light directly. As the water depth increases (20 cm, 40 cm, 60 cm), the reflectance decreases, especially at longer wavelengths. This reduction occurs because deeper water absorbs more light, leading to a decline in reflectance. Variations in spectral signatures can be utilized in remote sensing studies to detect the presence of water and estimate its depth.
In the present study, multispectral indices were analyzed in orthomosaics derived from drone images to indirectly measure the cultivated K. alvarezii area. Once the surface area of the seaweed is obtained, other parameters, such as volume and weight, can easily be correlated and calibrated from field measurements.
An orthomosaic is the product of the superimposed unification of isolated aerial images obtained by orthorectification and orthomosaicking. To achieve a high-quality orthomosaic with minimal distortions and high spatial resolution (measured in centimeters per pixel), careful planning of the drone image acquisition process is crucial. This planning, known as a flight plan, involves determining the flight altitude, camera angle, horizontal travel speed, image exposure time (aperture setting), and the percentage of front and side overlap between images.
2.2. Study Area
In the present study, two commercial K. alvarezii crops were analyzed, located in Paraty/RJ, Brazil (co-ordinates 23°13′39.6″ S and 44°37′25.6″ W), as shown in Figure 3.
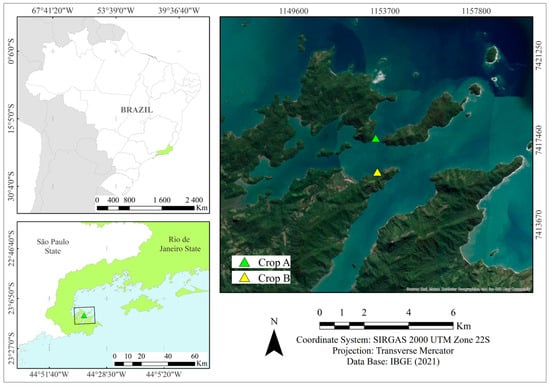
Figure 3.
The green and yellow polygons indicate sites A and B of commercial cultivation of Kappaphycus alvarezii on the coast of Paraty/RJ.
2.3. Image Sampling and Equations
Images were collected on 29 April 2023. A total of 380 images, among RGB and multispectral images, were collected. This day was chosen because it was sunny, with clear water and adequate seaweed biomass for generating images that could be used in comparing methods. Also, the K. alvarezii cultivation presented several development classes according to the different days of replication in each block, providing a variety of tali dimensions and biomass volume categories. The hardware used for image collection consisted of one DJI Matrice 300 RTK drone (SZ DJI Technology Co., Shenzhen, Guangdong, China) equipped with a Micasense Altum-PT multispectral camera (AgEagle Aerial Systems Inc., North Wichita, KS, USA), DLS2 sensor, and radiometric calibration panel. A DJI D-RTK2 GPS base (SZ DJI Technology Co., Shenzhen, Guangdong, China) was used to position the images spatially. The spectrum bands of the multispectral Micasense Altum-PT camera used in this study are shown in Table 1.

Table 1.
Spectral bands of the multispectral Micasense Altum-PT camera used in this research.
No correction was applied to the RGB images. The drone was equipped with the Downwelling Light Sensor (DLS 2), an incident light sensor connecting directly to the multispectral sensor. During the flights, the DLS 2 measured the ambient light and sun angle for each camera band and recorded this information in the metadata of the TIFF images captured by the camera. This information was then used during the image processing step to correct global lighting changes in the middle of a flight, such as those that can happen due to clouds covering the sun.
The following flight parameters were used: flight altitude of 100 m, horizontal speed of 8 m/s, camera angle of 100% nadir, and frontal and lateral overlap of 75%. The initial processing of the images and generation of the orthomosaics were carried out using the Agisoft Metashape® 1.8.4 software (64-bit, Agisoft, St. Petersburg, Russia). This software provides alignment of points at the highest accuracy and depth maps at high resolution and moderate filtering, and generates dense point clouds, resulting in multispectral orthomosaics with spatial resolution (GSD) of 1.97 cm/pixel. The orthomosaics were georeferenced in the SIRGAS 2000 UTM 23S system. Pan-sharpening was carried out, as well as raster transformation, to obtain reflectance values in each band. The processed orthomosaics were then exported in TIFF format to a single file.
Flying drones over bodies of water is a hard task considering the image collection and next step, which is orthomosaicking the images in order to map a larger area. This is because the waves on the water’s surface constantly move the target, making the process of stitching neighbor images difficult. Technically, the moving surface decreases the number of tie points among the images, making the orthomosaicking process a challenge. As shown in Figure 3, the studied area is formed by various islands and rock formations, and the seaweed cultivations are installed beside these areas. When flying at lower altitudes (20–50 m above sea level), more details are registered, although the images only capture the constantly moving algae cultivation itself and the seawater. Flying higher (around 100 m above sea level), not only is the algae cultivation captured in the images, but so are the fixed rocks and other static formations surrounding the algae blocks. These static features in the images allow higher-quality orthomosaics, with perfect stitching between neighboring images.
The next processing step was performed using the QGIS 3.26.2 software (open source), with calculation of the multispectral indices. Table 2 shows the 24 indices calculated.

Table 2.
Multispectral indices analyzed and their respective calculation equations.
All the steps, from collecting to processing the images, were executed using professional tools and the recommended techniques. As mentioned, flying over bodies of water is challenging, and all the obstacles, such as moving water surfaces or sun glint, were overcome to obtain high-quality images and ensure the replicability of the study.
2.4. Statistical Analysis
Data derived from the steps above were analyzed directly in QGIS software using the tools “Zonal Statistics” and “Basic Statistics for Fields”. Complementarily, linear regression analysis and the coefficient of determination R2 were calculated using the software RStudio 2023.03.
3. Results and Discussion
Raster images were then generated for each multispectral index. These indices, which record different light wavelengths that reflect various aspects and characteristics of the seaweed, were used to evaluate and monitor the seaweed’s growth and quality. The symbology of each raster was adjusted to maximize contrast and allow visualization of the cultivated seaweed. Figure 4 illustrates the results obtained with some of the calculated indices.
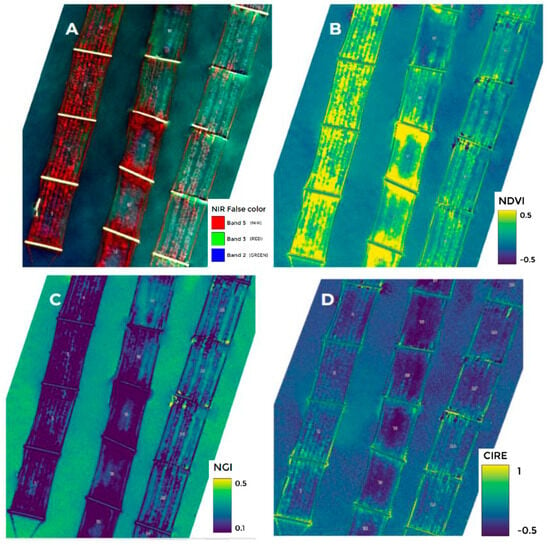
Figure 4.
Visualization of the multispectral indices obtained. (A) NIR false color, (B) NDVI, (C) NGI, and (D) CIRE.
When combined, the individual indices offer a whole perspective of the crop, each contributing distinct information. Areas of higher NIR reflectance (Figure 4A) appear in shades of red or other colors, and indicate seaweed cultivation. Variations in crop NDVI values are visible (Figure 4B), suggesting variations in seaweed density. The brighter yellow sections in the image most likely indicate denser seaweed. The CIRE is handy for monitoring chlorophyll content, thus providing information on the physiological state of the seaweed. Different colors are seen in growing areas; brighter or more colorful tones indicate denser or healthier seaweed. The seaweed patches appear in different shades; brighter hues could indicate healthier seaweed with a higher chlorophyll content (Figure 4C,D).
The multispectral indices were calculated to obtain the best contrast between cultivated seaweed, cultivation structures (ropes and buoys), and seawater. The higher the contrast between elements, the more efficient their segmentation in the next step of image processing. Frequency distribution graphs of the pixel values for each calculated index were generated and analyzed for this purpose (Figure 5).
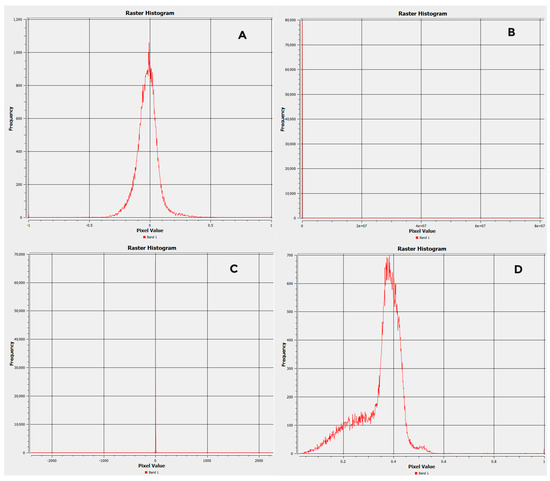
Figure 5.
Frequency distribution graphs of pixel values. (A) NDRE, (B) CIRE, (C) SIPI, and (D) NGI.
The joint visual analysis of the graphs and the raster layers of the generated indices allowed the selection of multispectral indices with greater contrast between elements of the images. The indices that resulted in graphs with a concentration of pixels of the same value were eliminated because of the inefficiency in distinguishing the elements of the images, notably the cultivated seaweed. Using this process, the NDVI, NDRE, CIG, MTCI, GNDVI, REDVI, NGI, ABDI1, ABDI2, MTVI2, and EVI indices were selected, and the threshold of the algal detection ranges was defined for each index. Based on the frequency distribution graphs of pixel values of each selected index, maximum and minimum limits were tested for optimization of segmentation and detection of the seaweed.
These tests were carried out by filtering pixels whose values were present in the threshold intervals defined in the previous step. This process generated new raster layers of filtered pixels for each index and range of thresholds of values tested. Each filtered raster layer was then vectorized, thus generating vector layers of the threshold values.
In parallel, the perimeter of the cultivation modules, which are the units that form each cultivation raft, manually vectorized in each cultivation unit. Next, the useful area of each cultivation module was calculated. Table 3 shows the characteristics of the modules in each commercial crop analyzed.

Table 3.
Characteristics and parameters of Kappaphycus alvarezii algal modules in the commercial crops analyzed.
Finally, the layers of threshold value vectors and vectors of the useful cultivation area of the modules were superimposed. This approach permitted extracting the useful area of each module where seaweed occupation occurred. Table 4, Table 5 and Table 6 show the results of the parameters and statistics for each index selected in the previous step in each commercial K. alvarezii crop analyzed.

Table 4.
Parameters and statistics of multispectral indices in crop A.

Table 5.
Parameters and statistics of multispectral indices in crop B.

Table 6.
Visual analysis factors of the selected multispectral indices and the respective scores assigned to the segregation of each parameter.
The results of Table 4 and Table 5 show that most multispectral indices had a high coefficient of determination (R2), except EVI. Two other indices of low performance are REDVI and NDRE, which had a high coefficient of variation (CV%). Thus, the EVI, REDVI, and NDRE indices were discarded, and a new processing step was initiated.
The remaining indices were submitted for visual analysis of the vectorization results compared to the RGB and NIR false color compositions of the crops. This process allowed the identification of multispectral indices with low efficiency when segregating the seaweed from the other components of the images (cultivation structures and seawater). Since this subjective analysis depends on the analyst’s interpretation, it was decided to structure the analysis factors, which received scores ranging from 1 (little or no occurrence) to 5 (high or total occurrence). The analysis factors and the respective scores for each parameter are shown in Table 6.
Figure 6 shows aspects that illustrate the interpretation of the visual analysis factors of the indices and the attribution of occurrence scores.
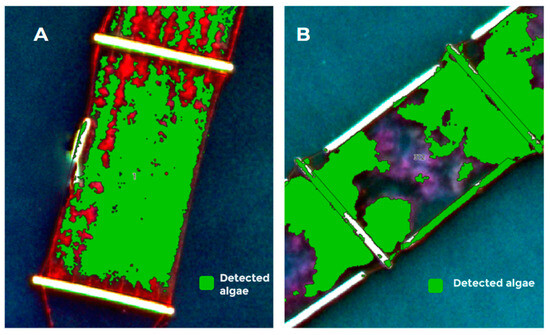
Figure 6.
(A) Low algal detection and segmentation capacity at high density based on the MTCI index. (B) Medium-low capacity for segmenting seaweed in deeper waters and high occurrence of detection of cultivation structures based on the NGI index.
The MTCI and NGI indices showed both limitations and strengths. The MTCI presented difficulties in areas with a high density of seaweed, while the NGI’s challenges were deeper waters and distinguishing between seaweed and cultivation structures. These findings suggest that, while both indices are valuable tools, they could require additional techniques or calibration to identify and classify seaweed in various aquatic habitats more precisely.
Considering the results obtained by the team involved in this project, the most considerable limitation of the study was the necessity of using expensive devices to achieve reliable results. One of the team’s aims is to test the viability of using less expensive drones directly, or with adapted infrared filters on the native camera, to relate the images with the algae biomass.
Other limitations are related to the natural environment where the algae are cultivated. The sunglint, the waves, and the algae block movement on the water surface, as well as the challenge of properly stitching good-quality orthomosaics, are the main examples of obstacles that must be overcome.
In this paper, we selected potential multispectral indices with good results when segregating the algae inside the cultivation blocks. Thus, once the algae biomass was derived from the drone imagery, no bias could influence the results. The bias in the results, considering the present study, could only originate from erroneously defining the index value threshold to segment the algae properly.
The results obtained to date have shown that selected multispectral indices can be used in the segmentation step of the algae analysis. As shown, ABDI1, ABDI2, CIG, and GNDVI could do that task. However, different algae have different ways of developing, and different tali structures or ideal depths in the seawater for good development, for instance. All these variables need to be studied in order to apply the results of this study to other kinds of algae. More studies and different approaches must be developed to extend the present results to other algae species.
4. Conclusions
In this study, we aimed to select multispectral indices derived from images collected by drones that have practical applications in the operational and production management of commercial cultivation of K. alvarezii in Brazil. In summary, the aim was to increase efficiency when segmenting the seaweed in the images so that their exposed surface (area) could be calculated, and subsequently allow the calculation of other production parameters related to the growth rate of the algal biomass. Success in this process will lead to gains in automating the cultivation process, reducing manual activities, improving production management, and facilitating decision-making by seaweed farmers.
Starting from a set of 24 pre-selected indices, a series of image-processing steps were carried out, including frequency analysis of pixel values, statistical analyses, and visual interpretations according to scores attributed to the efficiency of seaweed segmentation. The last step of index analysis included only eight indices. Given the low efficiency of seaweed segmentation, represented by low sensitivity scores between limit values and detection of seaweed in deeper waters, the MTCI, MTVI2, NDVI, and NGI indices do not represent the best options for achieving the outlined objectives. We conclude that the multispectral ABDI1, ABDI2, CIG, and GNDVI indices provided the best segmentation results for K. alvarezii in the commercial crops analyzed. However, further studies are necessary to increase the definition of limit ranges of the selected multispectral indices.
Author Contributions
Conceptualization, M.M.I. and M.M.; methodology, M.M.I.; validation, M.M.I.; formal analysis, M.M.I. and E.F.R.; investigation, M.M.I.; resources, L.S. and M.M.; data curation, M.M.I. and E.F.R.; writing—original draft preparation, M.M.I.; writing—review and editing, M.M.I., E.F.R., J.K.M., E.C.C., L.S. and M.M.; supervision, M.M.; project administration, M.M.I.; funding acquisition, M.M. All authors have read and agreed to the published version of the manuscript.
Funding
This research was funded by the Coordination for the Improvement of Higher Education (CAPES)—PROSUP scholarship granted to M.M.I. and J.K.M.
Informed Consent Statement
Not applicable.
Data Availability Statement
The original contributions presented in the study are included in the article, further inquiries can be directed to the corresponding author/s.
Acknowledgments
We acknowledge the contribution of Kerstin Markendorf for English translation and revision. This work was supported by the Biotechnology Unit, Ribeirão Preto University, Brazil.
Conflicts of Interest
Author Juliano K. Mathion and Mozart Marins were employed by the company Algastech Aquiculture, Research and Development, Ubatuba, SP, Brazil. The remaining authors declare that the research was conducted in the absence of any commercial or financial relationships that could be construed as a potential conflict of interest.
References
- Zhang, L.; Liao, W.; Huang, Y.; Wen, Y.; Chu, Y.; Zhao, C. Global Seaweed Farming and Processing in the Past 20 Years. Food Prod. Process. Nutr. 2022, 4, 23. [Google Scholar] [CrossRef]
- Hayashi, L.; Reis, R.P. Cultivation of the Red Algae Kappaphycus Alvarezii in Brazil and Its Pharmacological Potential. Rev. Bras. Farmacogn. 2012, 22, 748–752. [Google Scholar] [CrossRef]
- Rudke, A.R.; de Andrade, C.J.; Ferreira, S.R.S. Kappaphycus Alvarezii Macroalgae: An Unexplored and Valuable Biomass for Green Biorefinery Conversion. Trends Food Sci. Technol. 2020, 103, 214–224. [Google Scholar] [CrossRef]
- Cabrera, R.; Umanzor, S.; Díaz-Larrea, J.; Araújo, P.G. Kappaphycus Alvarezii (Rhodophyta): New Record of an Exotic Species for the Caribbean Coast of Costa Rica. Am. J. Plant Sci. 2019, 10, 1888–1902. [Google Scholar] [CrossRef]
- Aslin, L.O.; Supryiono, E.; Nirmala, K.; Nurjanah, D.; Soelistyowati, T. The Effects of Planting Distances and Seedling Sources on Kappaphycus Alvarezii Growth. IOP Conf. Ser. Earth Environ. Sci. 2019, 278, 012007. [Google Scholar] [CrossRef]
- Simatupang, N.F.; Pong-Masak, P.R.; Ratnawati, P.; Agusman; Paul, N.A.; Rimmer, M.A. Growth and Product Quality of the Seaweed Kappaphycus Alvarezii from Different Farming Locations in Indonesia. Aquac. Rep. 2021, 20, 100685. [Google Scholar] [CrossRef]
- FAO. The State of World Fisheries and Aquaculture 2022; FAO: Rome, Italy, 2022; ISBN 978-92-5-136364-5. [Google Scholar]
- MPA. BOLETIM DA AQUICULTURA EM ÁGUAS DA UNIÃO—2022; MPA: Brasília, Brazil, 2023. [Google Scholar]
- Hurtado, A.Q.; Neish, I.C.; Critchley, A.T. Phyconomy: The Extensive Cultivation of Seaweeds, Their Sustainability and Economic Value, with Particular Reference to Important Lessons to Be Learned and Transferred from the Practice of Eucheumatoid Farming. Phycologia 2019, 58, 472–483. [Google Scholar] [CrossRef]
- Santos, A.A.; Hayashi, L. Sistema de Cultivo Da Macroalga Kappaphycus Alvarezii Em Santa Catarina; EPAGRI: Florianópolis, Brazil, 2022. [Google Scholar]
- Olmedo-Masat, O.M.; Raffo, M.P.; Rodríguez-Pérez, D.; Arijón, M.; Sánchez-Carnero, N. How Far Can We Classify Macroalgae Remotely? An Example Using a New Spectral Library of Species from the South West Atlantic (Argentine Patagonia). Remote Sens. 2020, 12, 3870. [Google Scholar] [CrossRef]
- Kislik, C.; Genzoli, L.; Lyons, A.; Kelly, M. Application of UAV Imagery to Detect and Quantify Submerged Filamentous Algae and Rooted Macrophytes in a Non-Wadeable River. Remote Sens. 2020, 12, 3332. [Google Scholar] [CrossRef]
- Nurdin, N.; Alevizos, E.; Syamsuddin, R.; Asis, H.; Zainuddin, E.N.; Aris, A.; Oiry, S.; Brunier, G.; Komatsu, T.; Barillé, L. Precision Aquaculture Drone Mapping of the Spatial Distribution of Kappaphycus Alvarezii Biomass and Carrageenan. Remote Sens. 2023, 15, 3674. [Google Scholar] [CrossRef]
- Chan, S.N.; Fan, Y.W.; Yao, X.H. Mapping of Coastal Surface Chlorophyll-a Concentration by Multispectral Reflectance Measurement from Unmanned Aerial Vehicles. J. Hydro-Environ. Res. 2022, 44, 88–101. [Google Scholar] [CrossRef]
- Tamondong, A.; Nakamura, T.; Kobayashi, Y.; Garcia, M.; Nadaoka, K. INVESTIGATING THE EFFECTS OF RIVER DISCHARGES ON SUBMERGED AQUATIC VEGETATION USING UAV IMAGES AND GIS TECHNIQUES. ISPRS Ann. Photogramm. Remote Sens. Spat. Inf. Sci. 2020, V-5-2020, 93–99. [Google Scholar] [CrossRef]
- Száz, D.; Takács, P.; Bernáth, B.; Kriska, G.; Barta, A.; Pomozi, I.; Horváth, G. Drone-Based Imaging Polarimetry of Dark Lake Patches from the Viewpoint of Flying Polarotactic Insects with Ecological Implication. Remote Sens. 2023, 15, 2797. [Google Scholar] [CrossRef]
- Pereira, L. Macroalgae. Encyclopedia 2021, 1, 177–188. [Google Scholar] [CrossRef]
- Yarish, C.; Redmond, S.; Kim, J.K. Gracilaria Culture Handbook for New England. Wrack Lines 2012, 72. Available online: https://digitalcommons.lib.uconn.edu/wracklines/72 (accessed on 10 June 2024).
- Tuominen, J.; Lipping, T. Assessment of Hyperspectral Classification Methods for Benthic Cover Type Mapping. In Proceedings of the 2012 IEEE International Geoscience and Remote Sensing Symposium, Munich, Germany, 22–27 July 2012; pp. 4837–4840. [Google Scholar]
Disclaimer/Publisher’s Note: The statements, opinions and data contained in all publications are solely those of the individual author(s) and contributor(s) and not of MDPI and/or the editor(s). MDPI and/or the editor(s) disclaim responsibility for any injury to people or property resulting from any ideas, methods, instructions or products referred to in the content. |
© 2024 by the authors. Licensee MDPI, Basel, Switzerland. This article is an open access article distributed under the terms and conditions of the Creative Commons Attribution (CC BY) license (https://creativecommons.org/licenses/by/4.0/).