Figure 1.
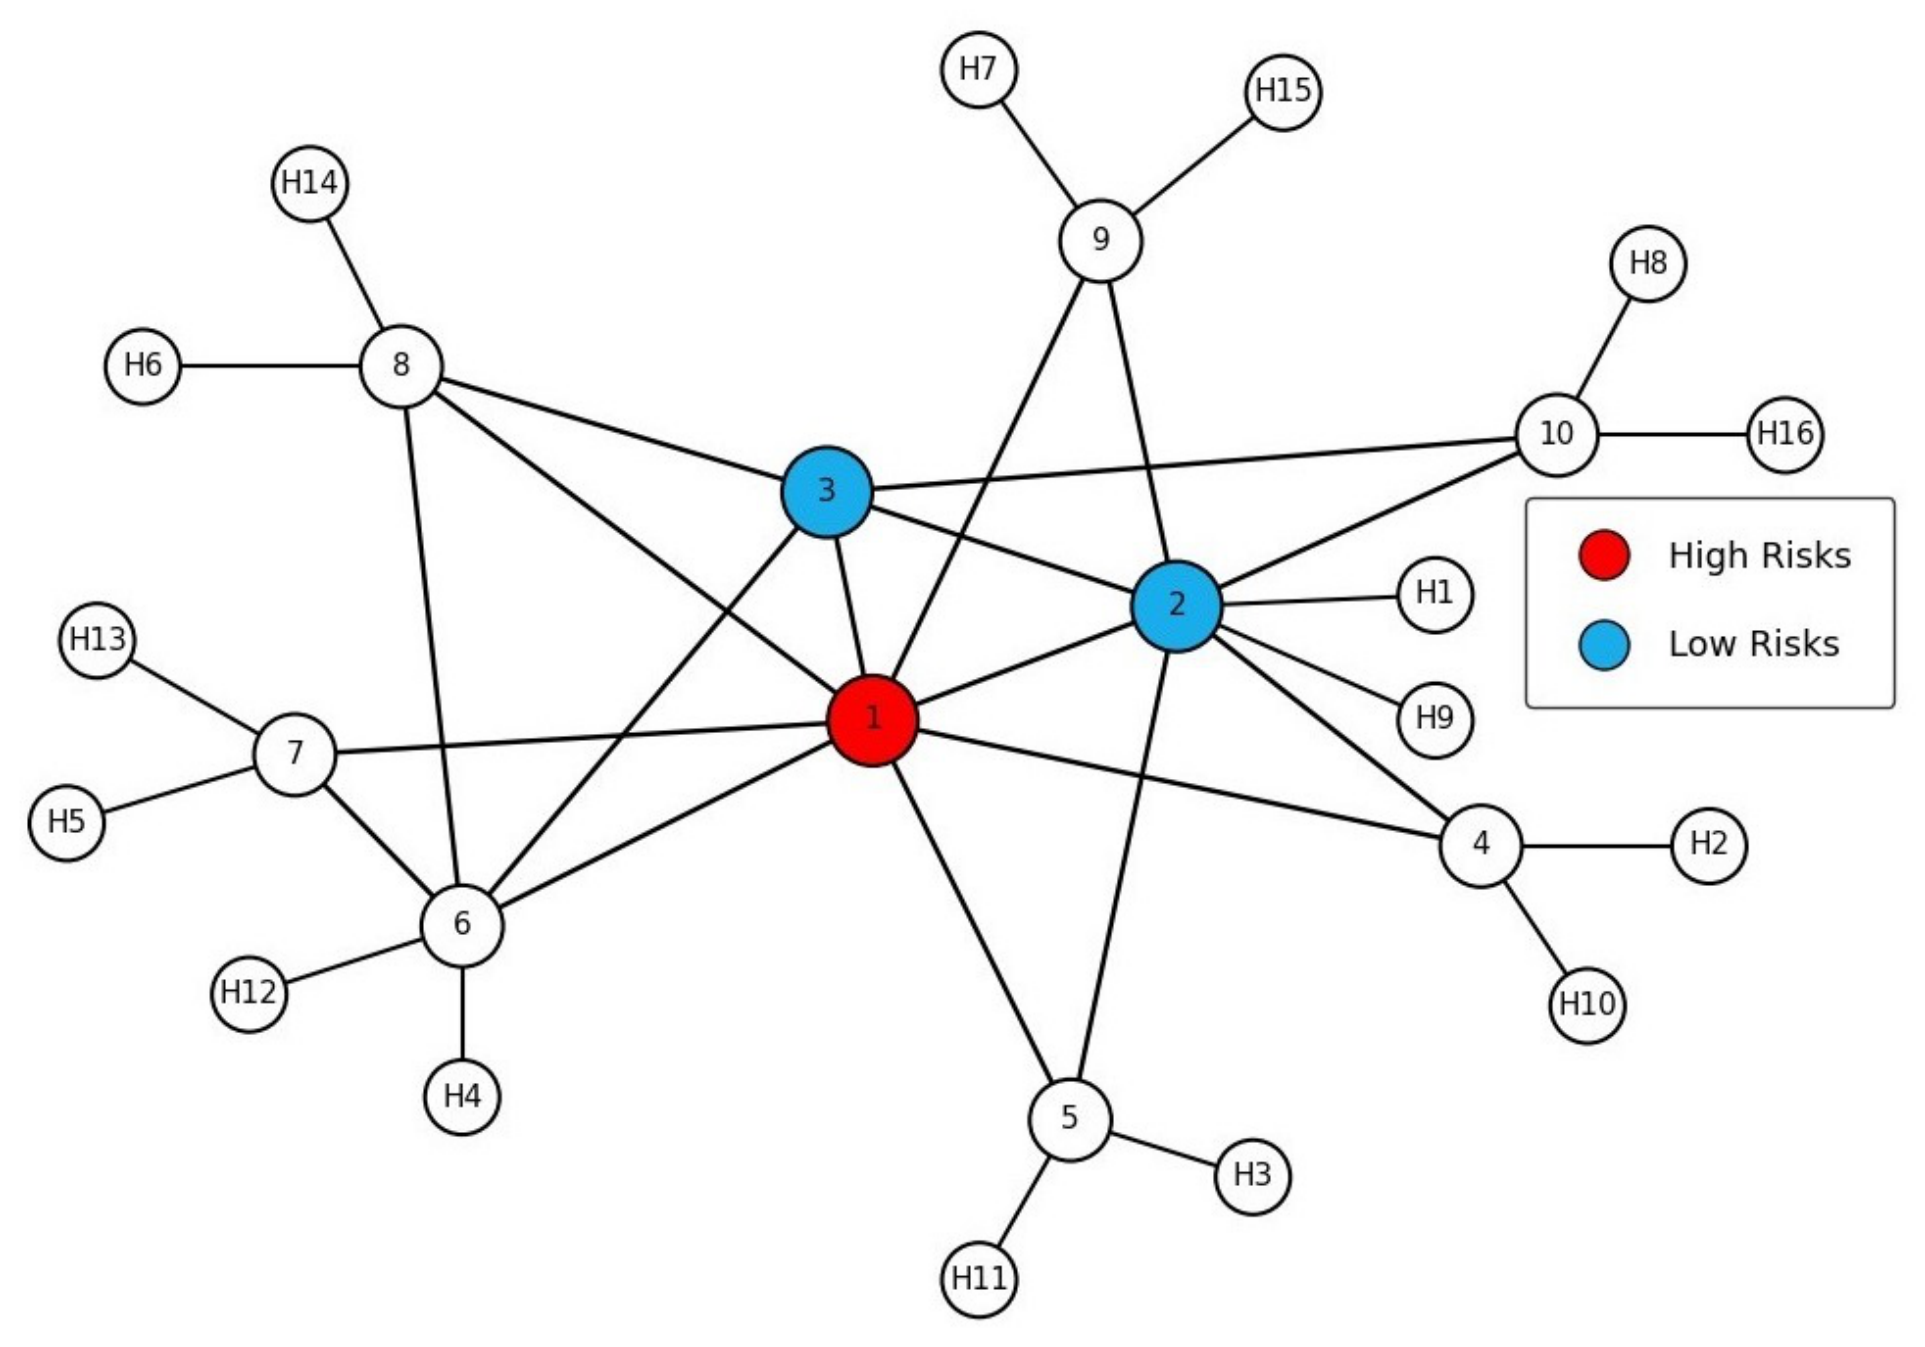
Barabási–Albert topology used in simulations, consisting of 10 core routers and 16 host nodes (H1–H16), totaling 26 nodes, Node 1 (red) classified as high-risk, Nodes 2–3 (blue) as low-risk, and all remaining nodes (white) as neutral based on degree-driven performance analysis.
Figure 1.
Barabási–Albert topology used in simulations, consisting of 10 core routers and 16 host nodes (H1–H16), totaling 26 nodes, Node 1 (red) classified as high-risk, Nodes 2–3 (blue) as low-risk, and all remaining nodes (white) as neutral based on degree-driven performance analysis.
Figure 2.
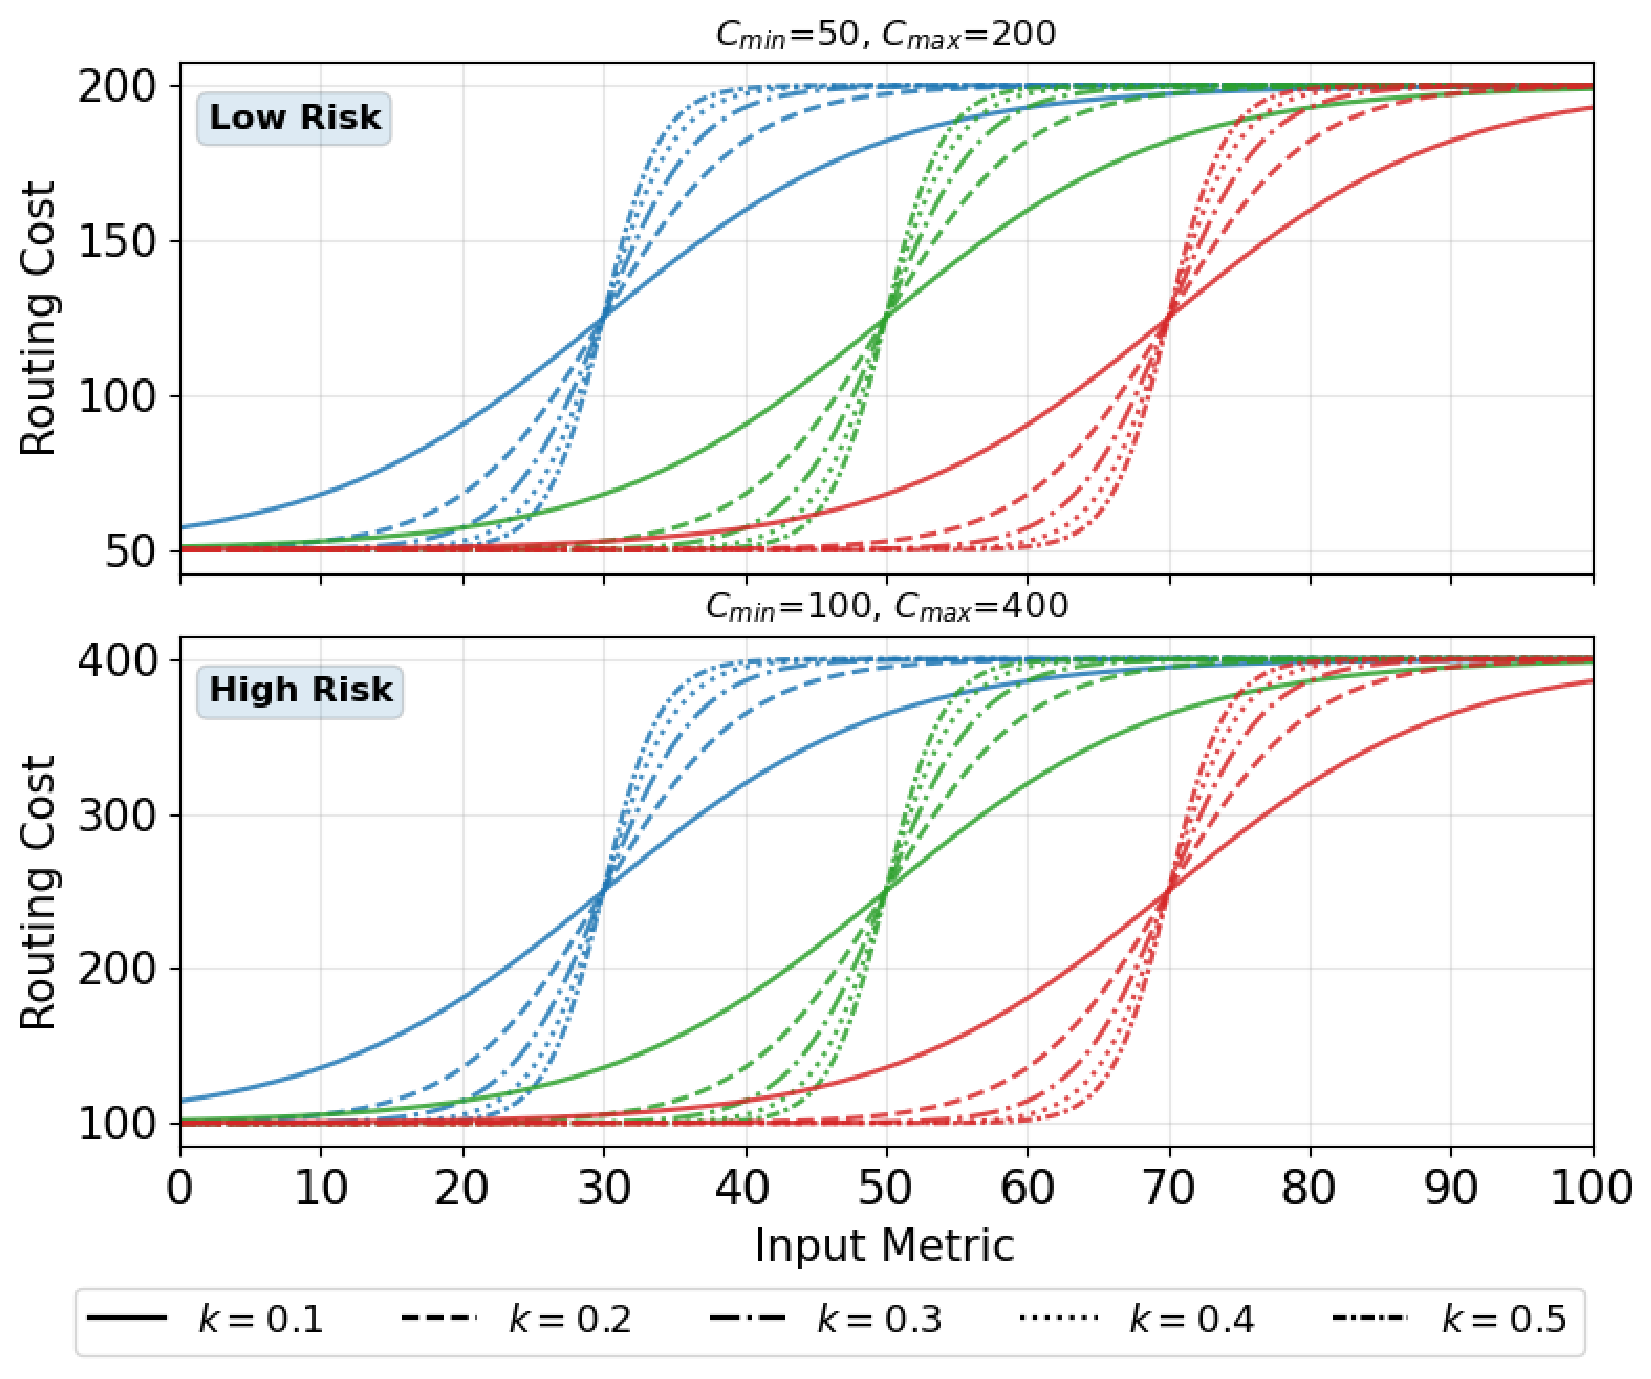
Sigmoid-based routing cost under different midpoint () and steepness (k) parameters. The upper figure shows the low-risk configuration (, ), while the lower figure represents the high-risk configuration (, ). The midpoint parameter determines the cost escalation threshold, and the steepness parameter controls the transition sharpness.
Figure 2.
Sigmoid-based routing cost under different midpoint () and steepness (k) parameters. The upper figure shows the low-risk configuration (, ), while the lower figure represents the high-risk configuration (, ). The midpoint parameter determines the cost escalation threshold, and the steepness parameter controls the transition sharpness.
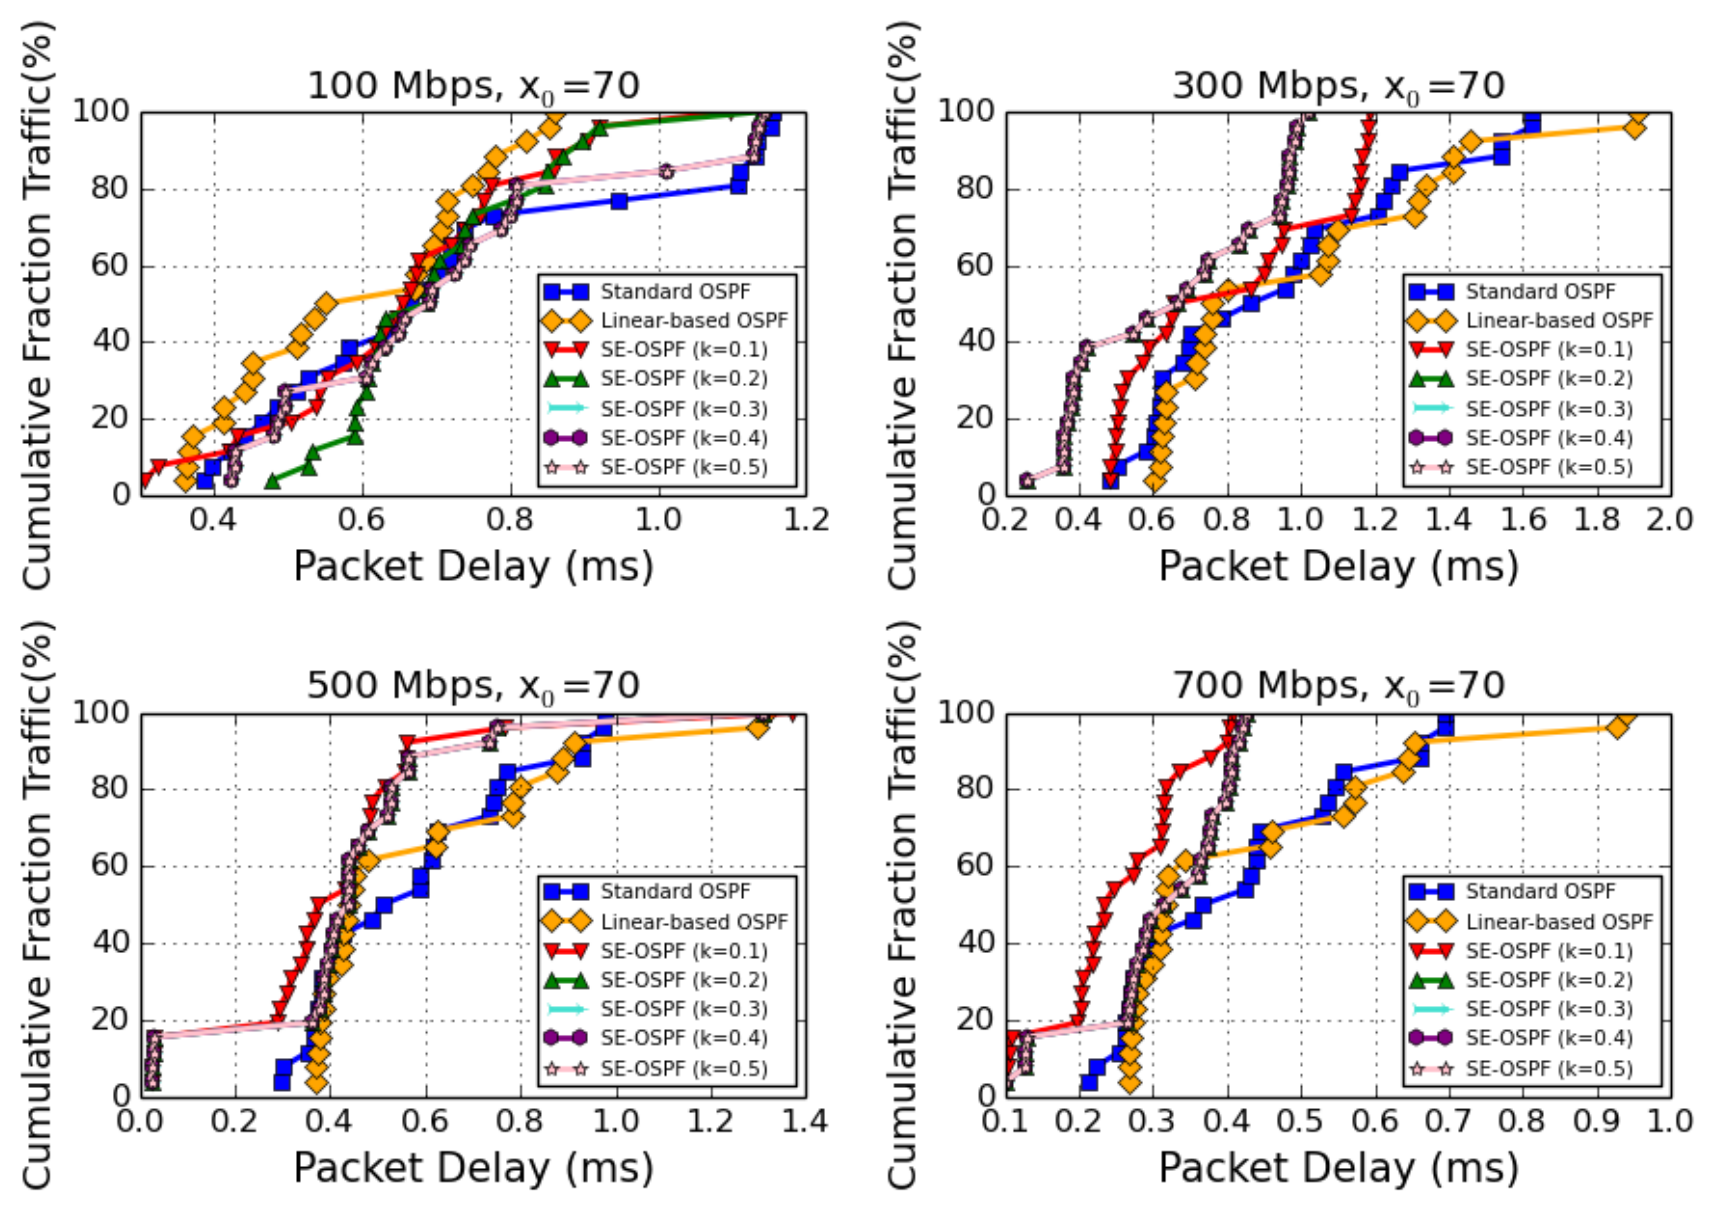
Figure 3.
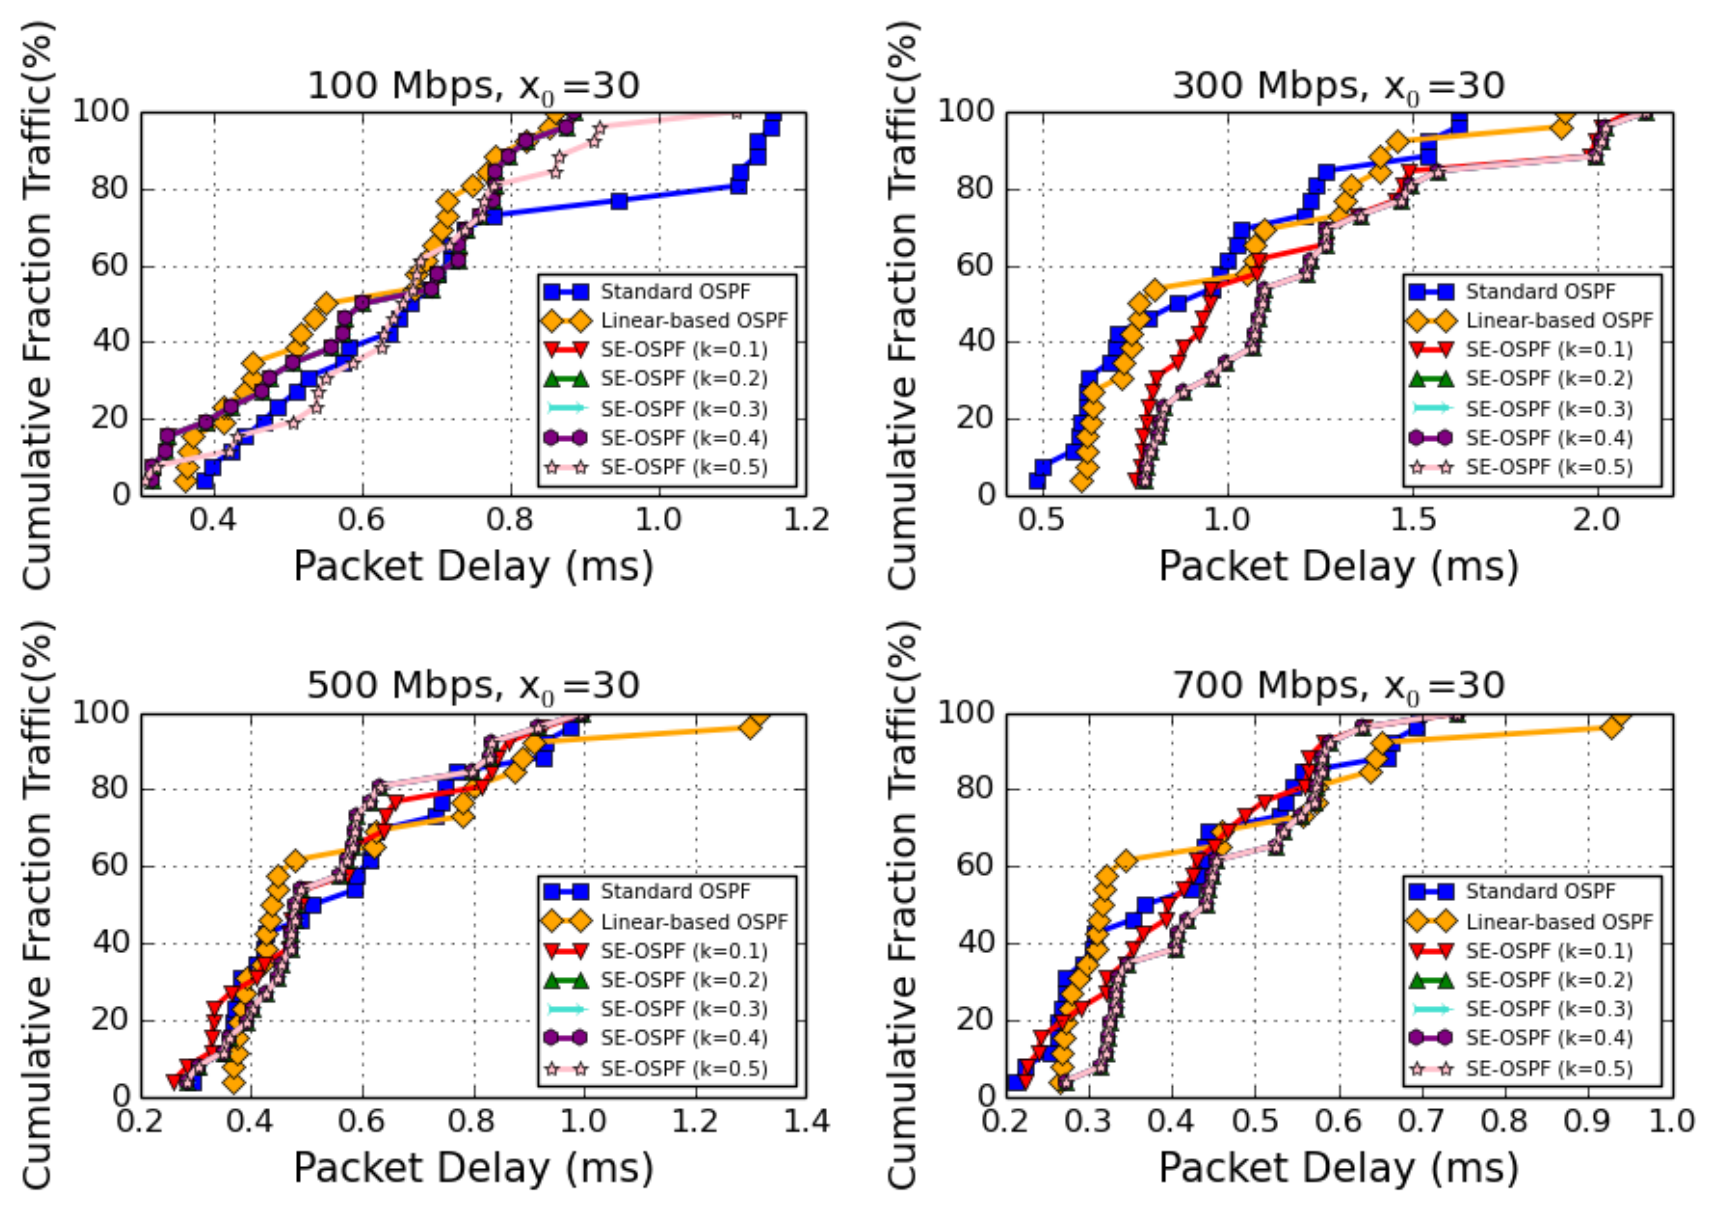
Cumulative distribution functions (CDFs) of end-to-end packet delay for Standard OSPF, Linear-OSPF, and SE-OSPF under bandwidths of 100, 300, 500, and 700 Mbps with a sigmoid midpoint of and varying steepness values (–0.5).
Figure 3.
Cumulative distribution functions (CDFs) of end-to-end packet delay for Standard OSPF, Linear-OSPF, and SE-OSPF under bandwidths of 100, 300, 500, and 700 Mbps with a sigmoid midpoint of and varying steepness values (–0.5).
Figure 4.
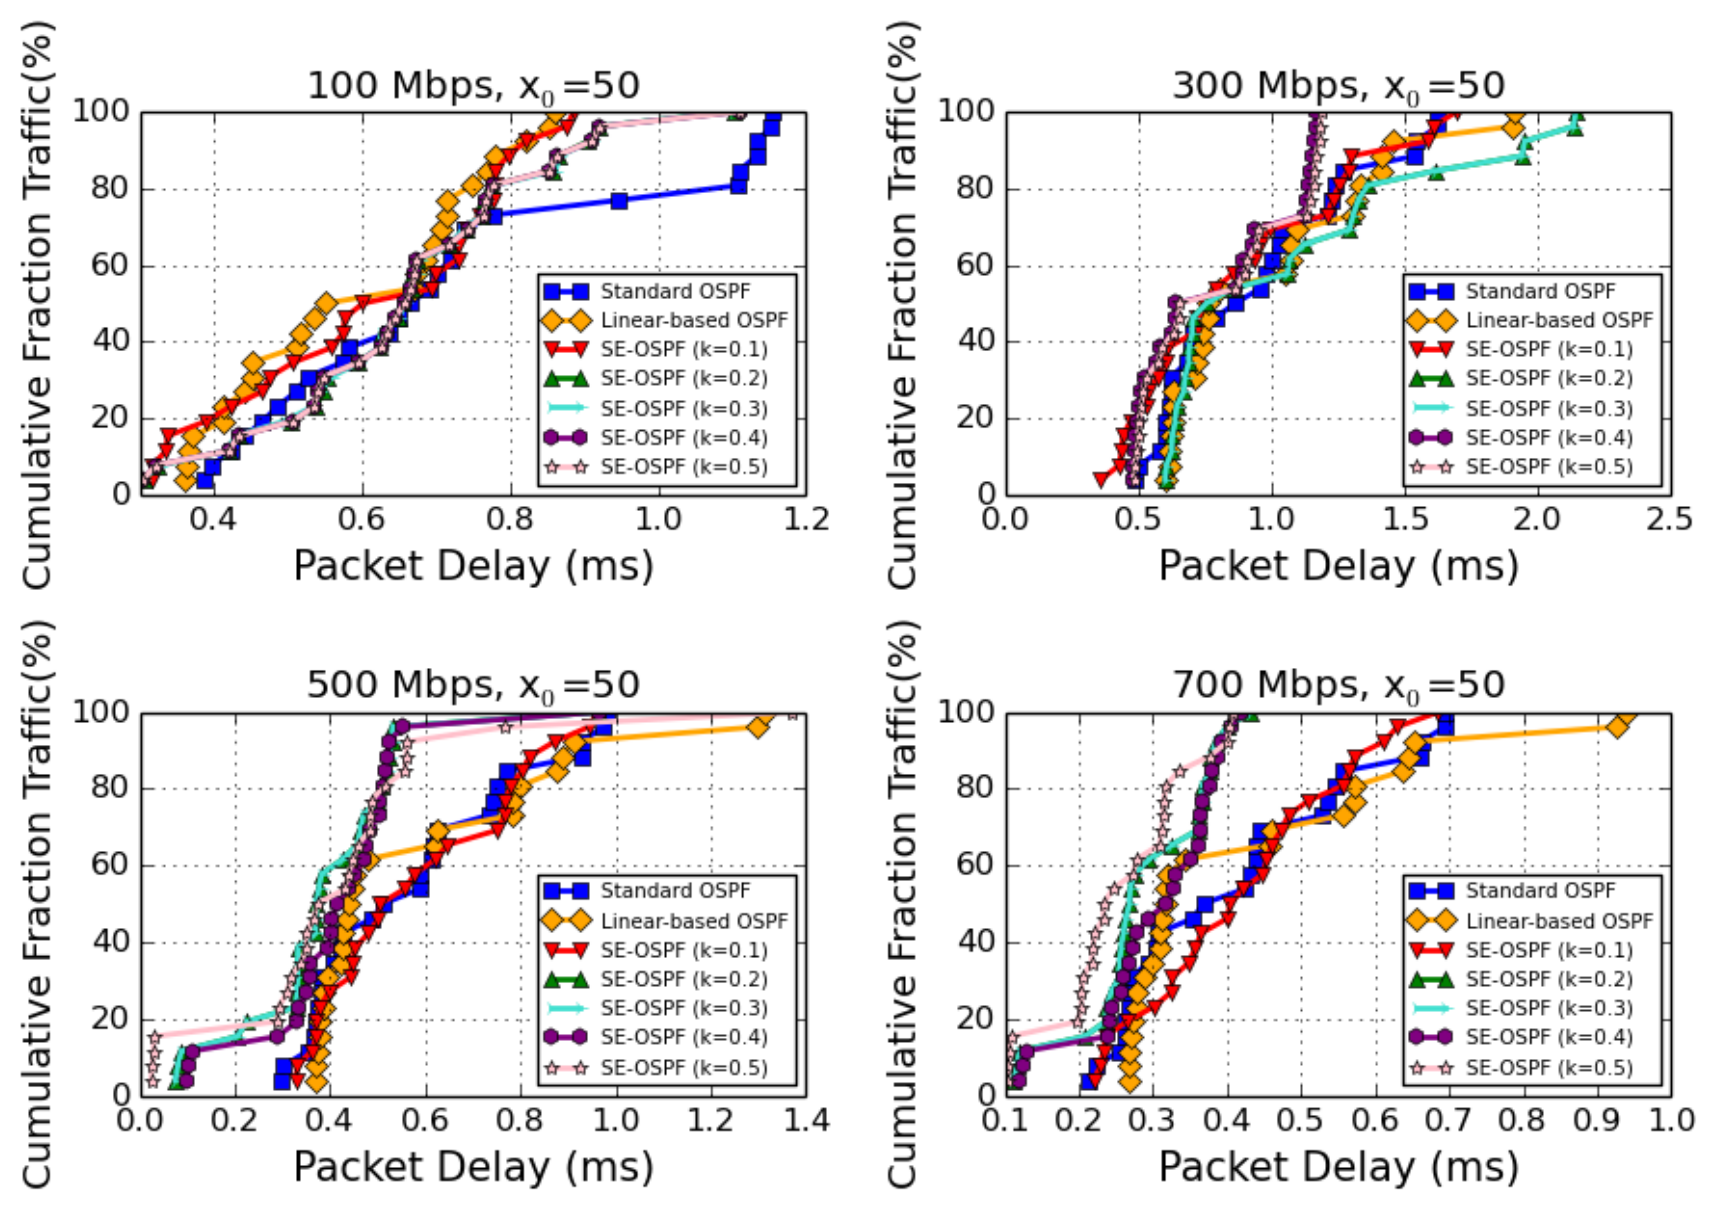
Cumulative distribution functions (CDFs) of end-to-end packet delay for Standard OSPF, Linear-OSPF, and SE-OSPF under bandwidths of 100, 300, 500, and 700 Mbps with a sigmoid midpoint of and varying steepness values (–0.5).
Figure 4.
Cumulative distribution functions (CDFs) of end-to-end packet delay for Standard OSPF, Linear-OSPF, and SE-OSPF under bandwidths of 100, 300, 500, and 700 Mbps with a sigmoid midpoint of and varying steepness values (–0.5).
Figure 5.
Cumulative distribution functions (CDFs) of end-to-end packet delay for Standard OSPF, Linear-OSPF, and SE-OSPF under bandwidths of 100, 300, 500, and 700 Mbps with a sigmoid midpoint of and varying steepness values (–0.5).
Figure 5.
Cumulative distribution functions (CDFs) of end-to-end packet delay for Standard OSPF, Linear-OSPF, and SE-OSPF under bandwidths of 100, 300, 500, and 700 Mbps with a sigmoid midpoint of and varying steepness values (–0.5).
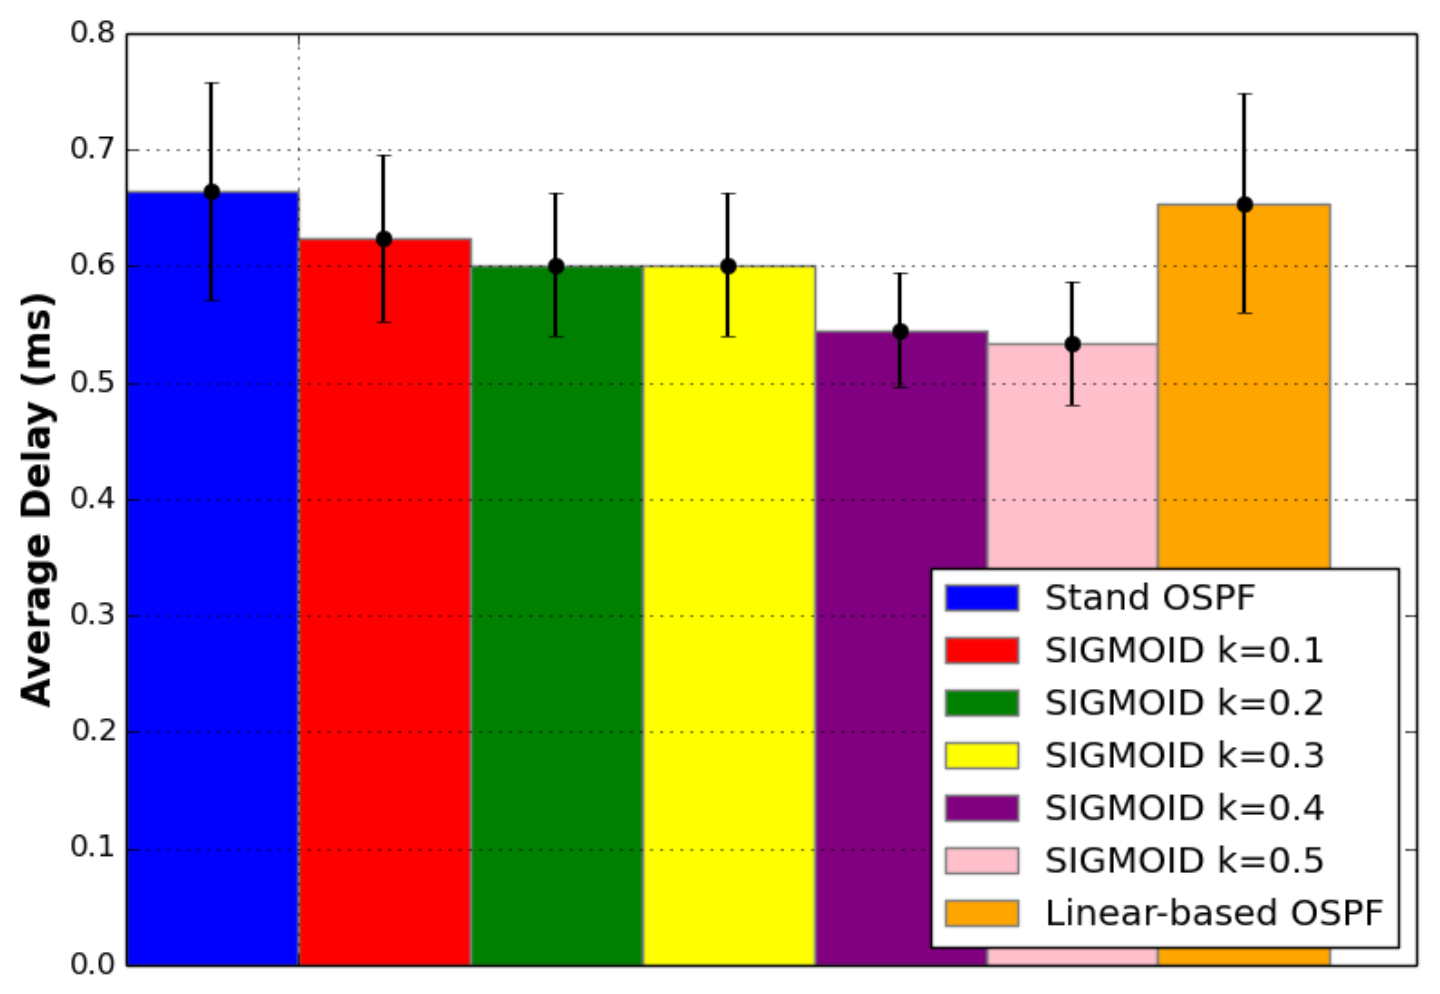
Figure 6.
Average end-to-end delay for Standard OSPF, Linear-OSPF, and SE-OSPF under different sigmoid steepness values (–0.5). Error bars represent the standard deviation of the measured end-to-end delay across the simulation runs.
Figure 6.
Average end-to-end delay for Standard OSPF, Linear-OSPF, and SE-OSPF under different sigmoid steepness values (–0.5). Error bars represent the standard deviation of the measured end-to-end delay across the simulation runs.
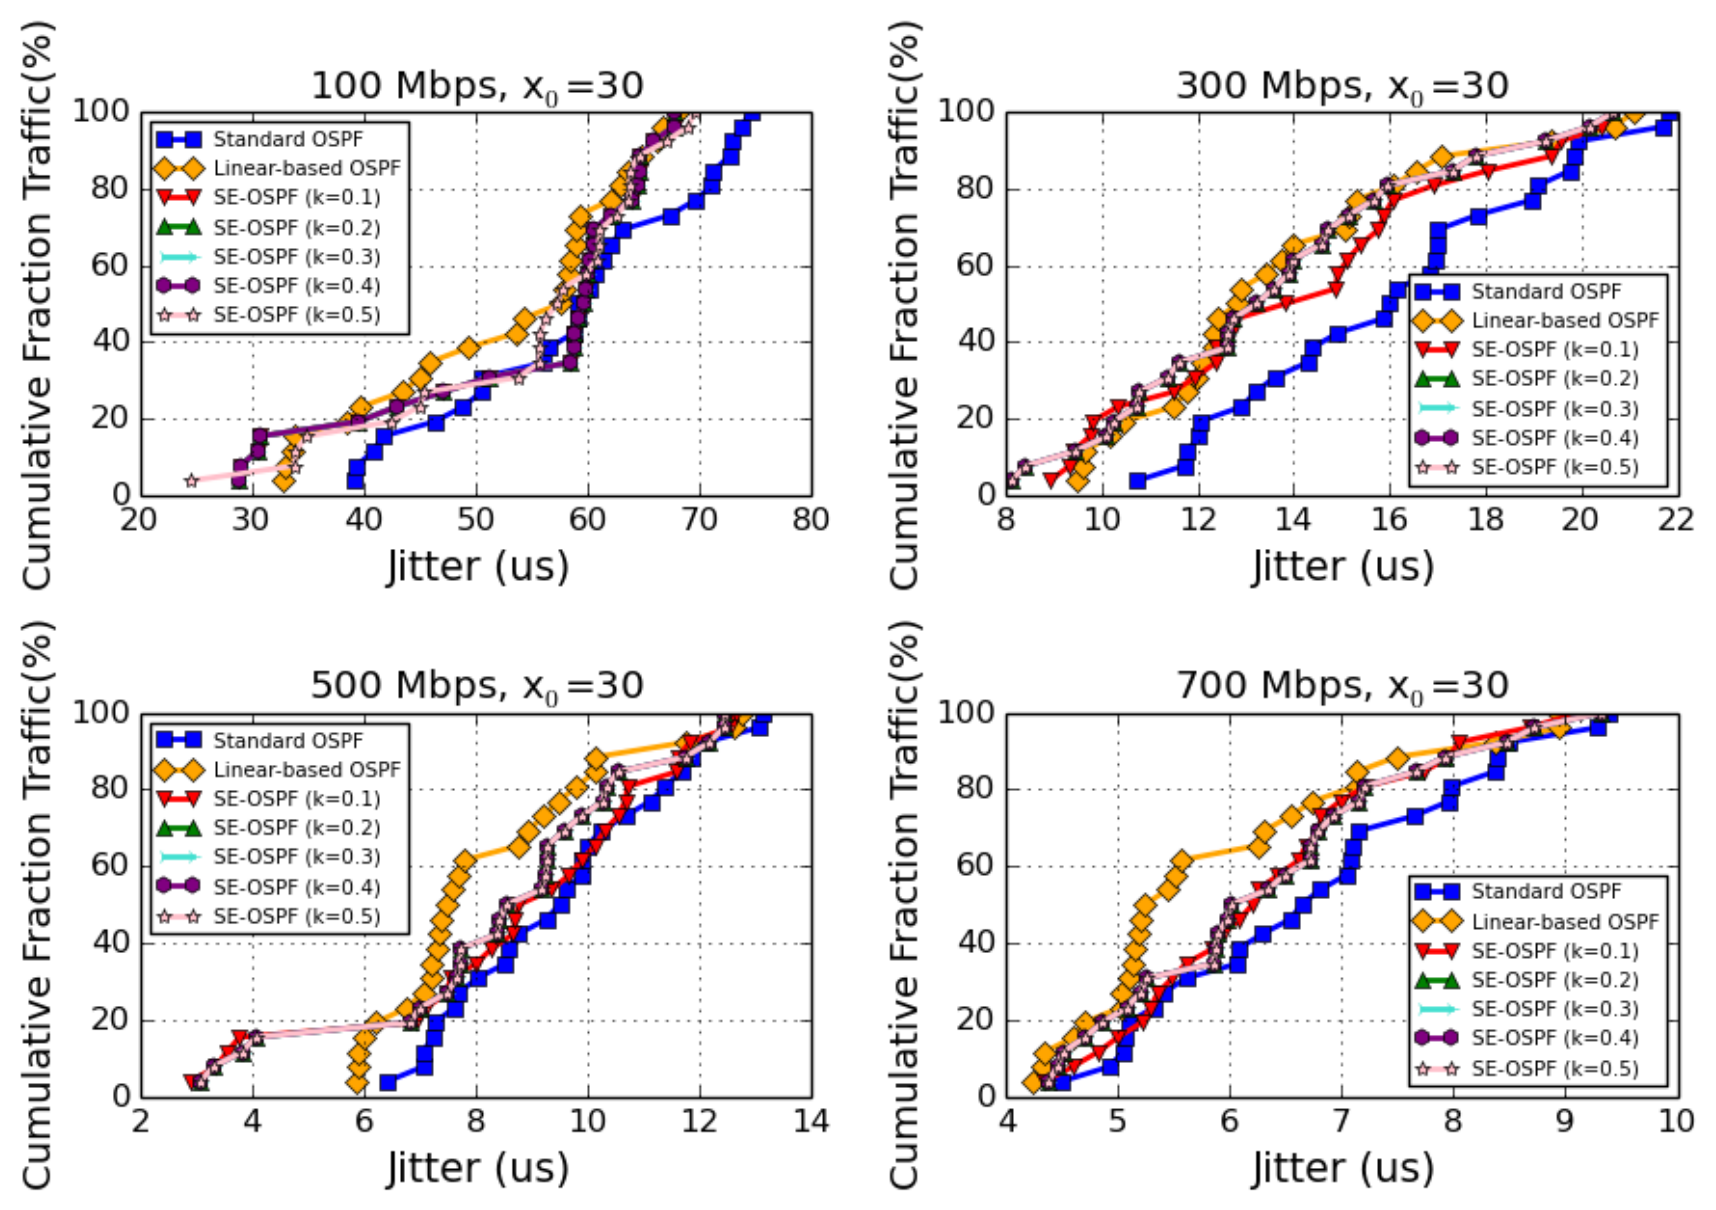
Figure 7.
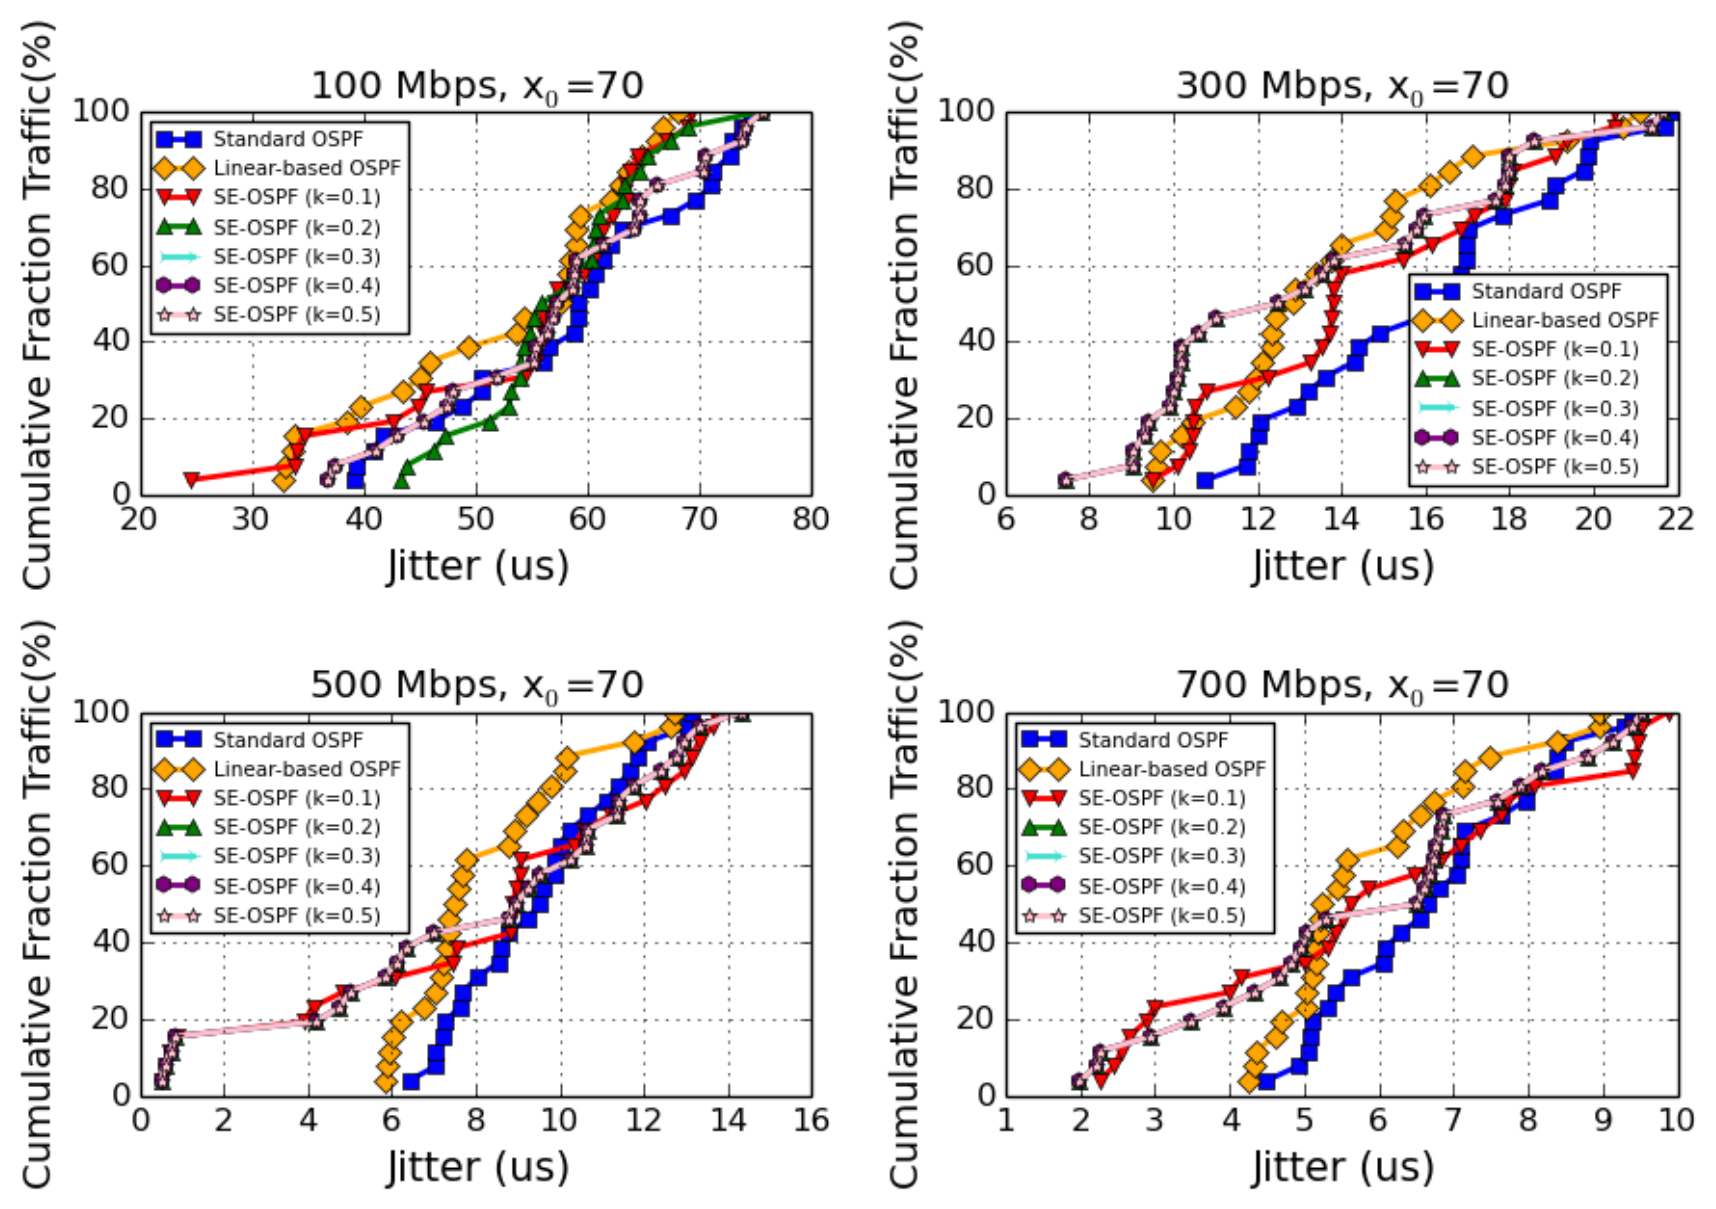
Cumulative distribution functions (CDFs) of packet jitter for Standard OSPF, Linear-OSPF, and SE-OSPF under bandwidths of 100, 300, 500, and 700 Mbps, with the sigmoid midpoint fixed at and the steepness parameter varied from to .
Figure 7.
Cumulative distribution functions (CDFs) of packet jitter for Standard OSPF, Linear-OSPF, and SE-OSPF under bandwidths of 100, 300, 500, and 700 Mbps, with the sigmoid midpoint fixed at and the steepness parameter varied from to .
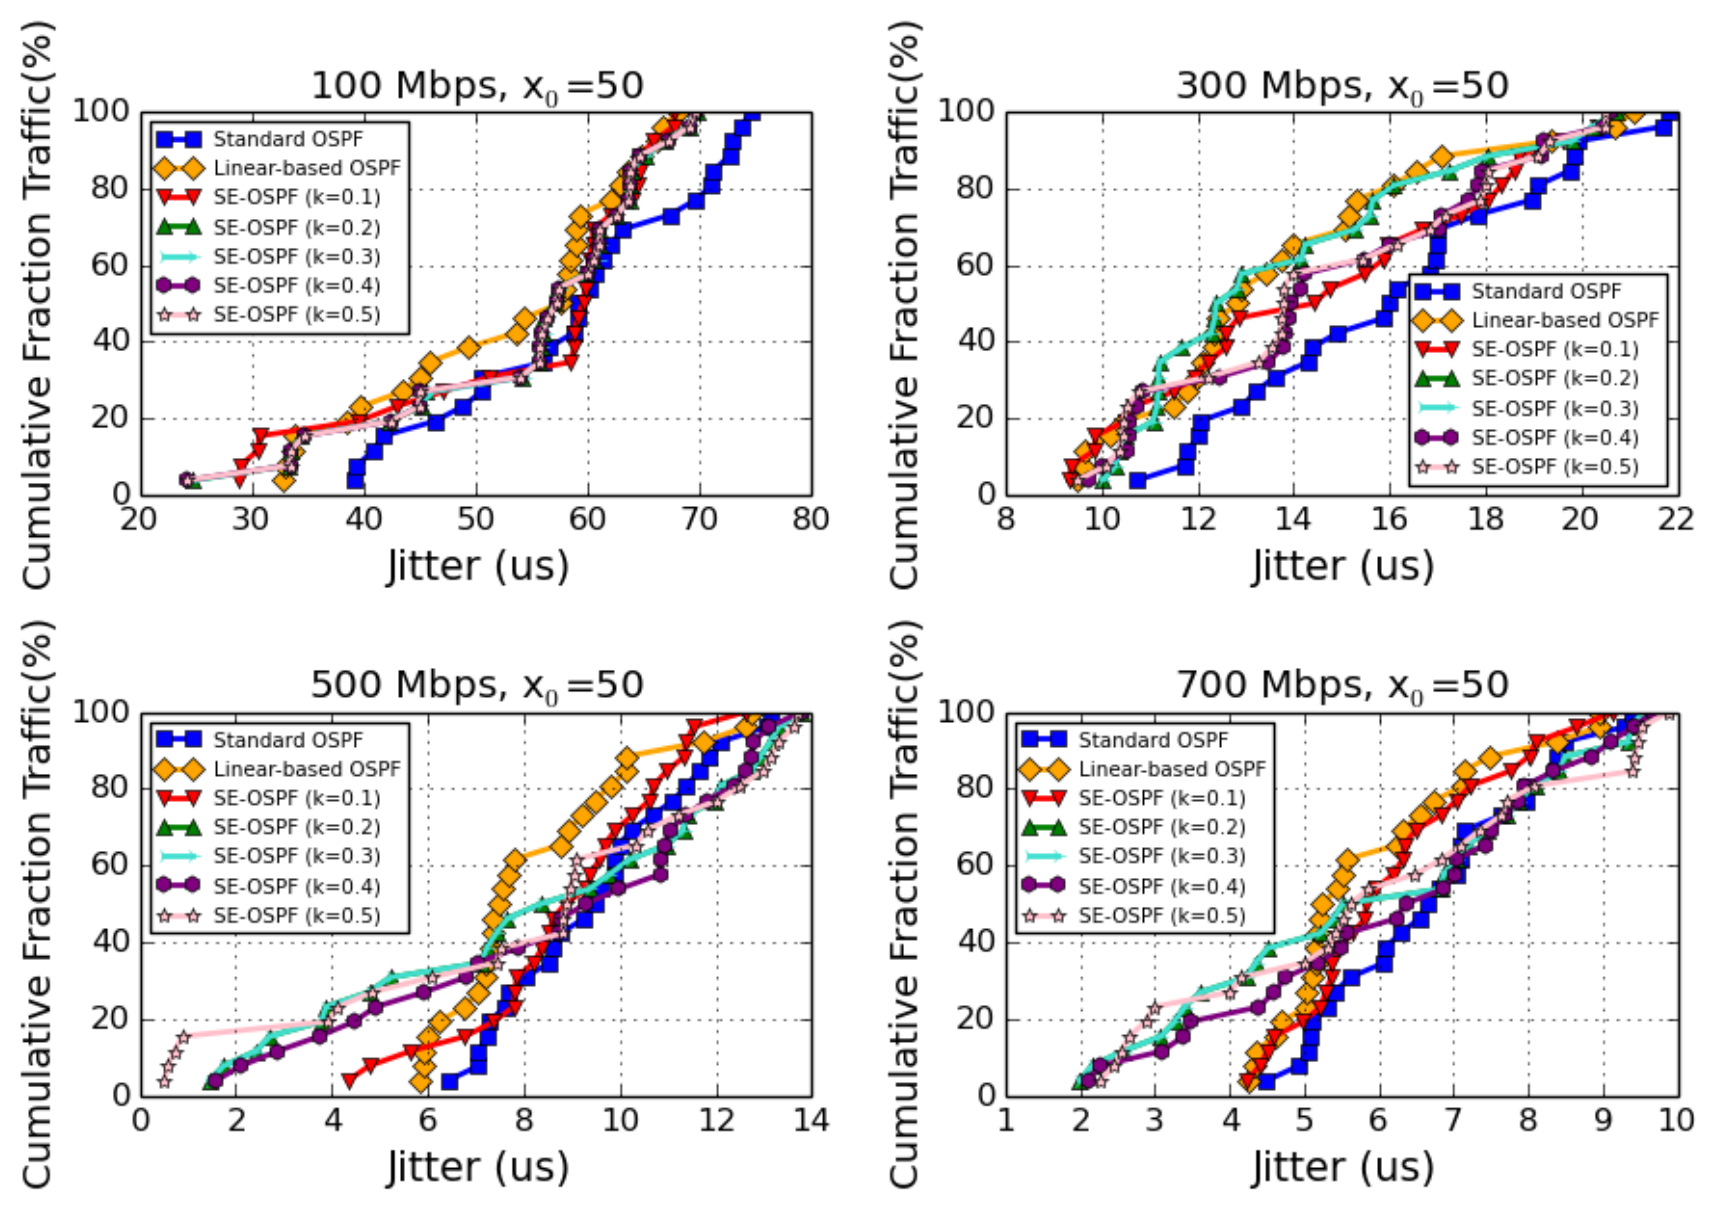
Figure 8.
Cumulative distribution functions (CDFs) of packet jitter for Standard OSPF, Linear-OSPF, and SE-OSPF under bandwidths of 100, 300, 500, and 700 Mbps, with the sigmoid midpoint fixed at and the steepness parameter varied from to .
Figure 8.
Cumulative distribution functions (CDFs) of packet jitter for Standard OSPF, Linear-OSPF, and SE-OSPF under bandwidths of 100, 300, 500, and 700 Mbps, with the sigmoid midpoint fixed at and the steepness parameter varied from to .
Figure 9.
Cumulative distribution functions (CDFs) of packet jitter for Standard OSPF, Linear-OSPF, and SE-OSPF under bandwidths of 100, 300, 500, and 700 Mbps, with the sigmoid midpoint fixed at and the steepness parameter varied from to .
Figure 9.
Cumulative distribution functions (CDFs) of packet jitter for Standard OSPF, Linear-OSPF, and SE-OSPF under bandwidths of 100, 300, 500, and 700 Mbps, with the sigmoid midpoint fixed at and the steepness parameter varied from to .
Figure 10.
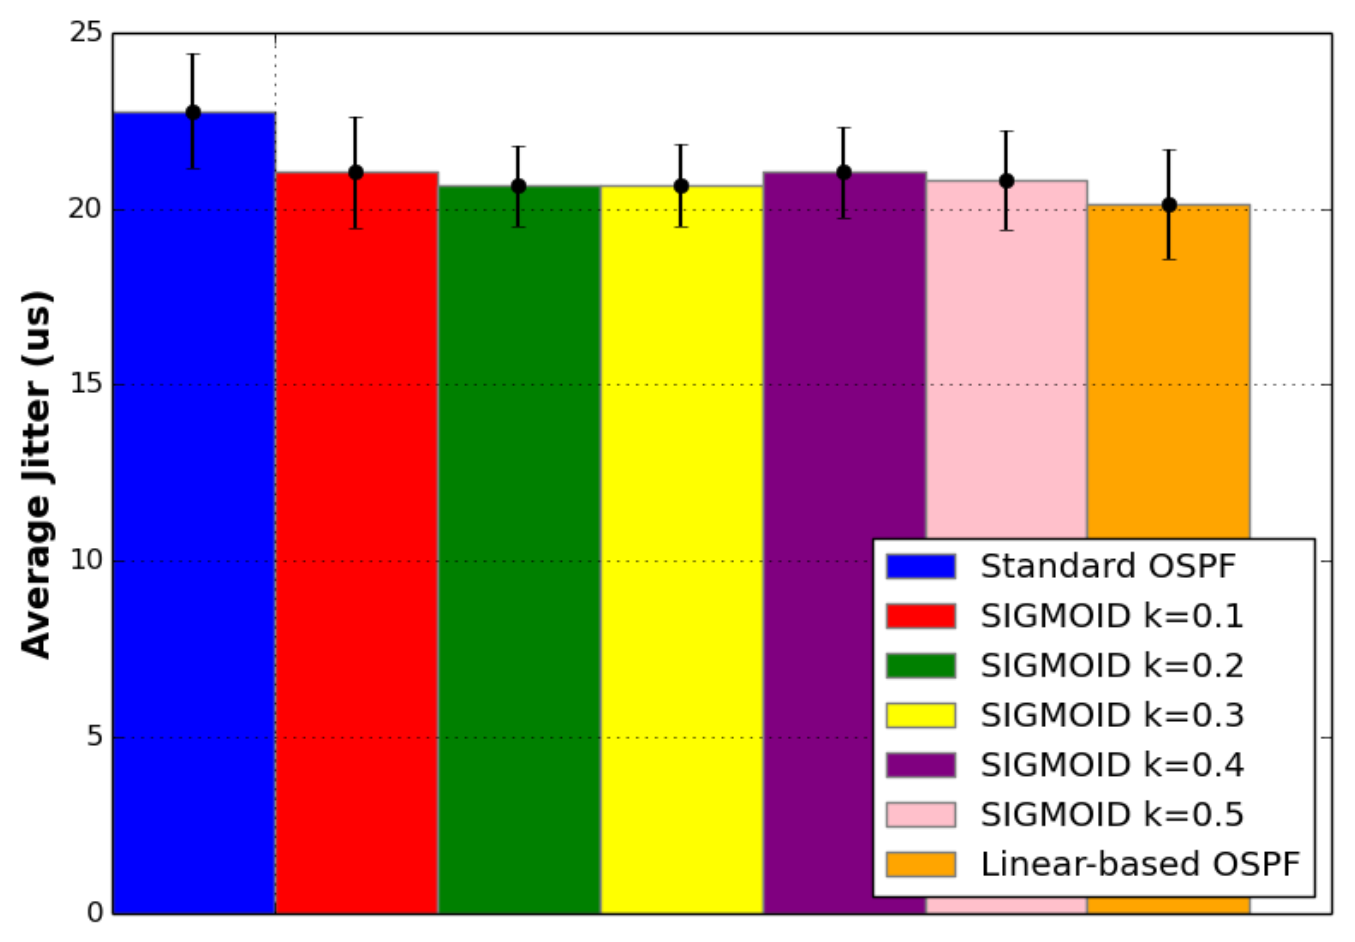
Average packet jitter for Standard OSPF, Linear-OSPF, and SE-OSPF under different sigmoid steepness values (–0.5). Error bars represent the standard deviation of jitter measurements across the simulation runs.
Figure 10.
Average packet jitter for Standard OSPF, Linear-OSPF, and SE-OSPF under different sigmoid steepness values (–0.5). Error bars represent the standard deviation of jitter measurements across the simulation runs.
Figure 11.
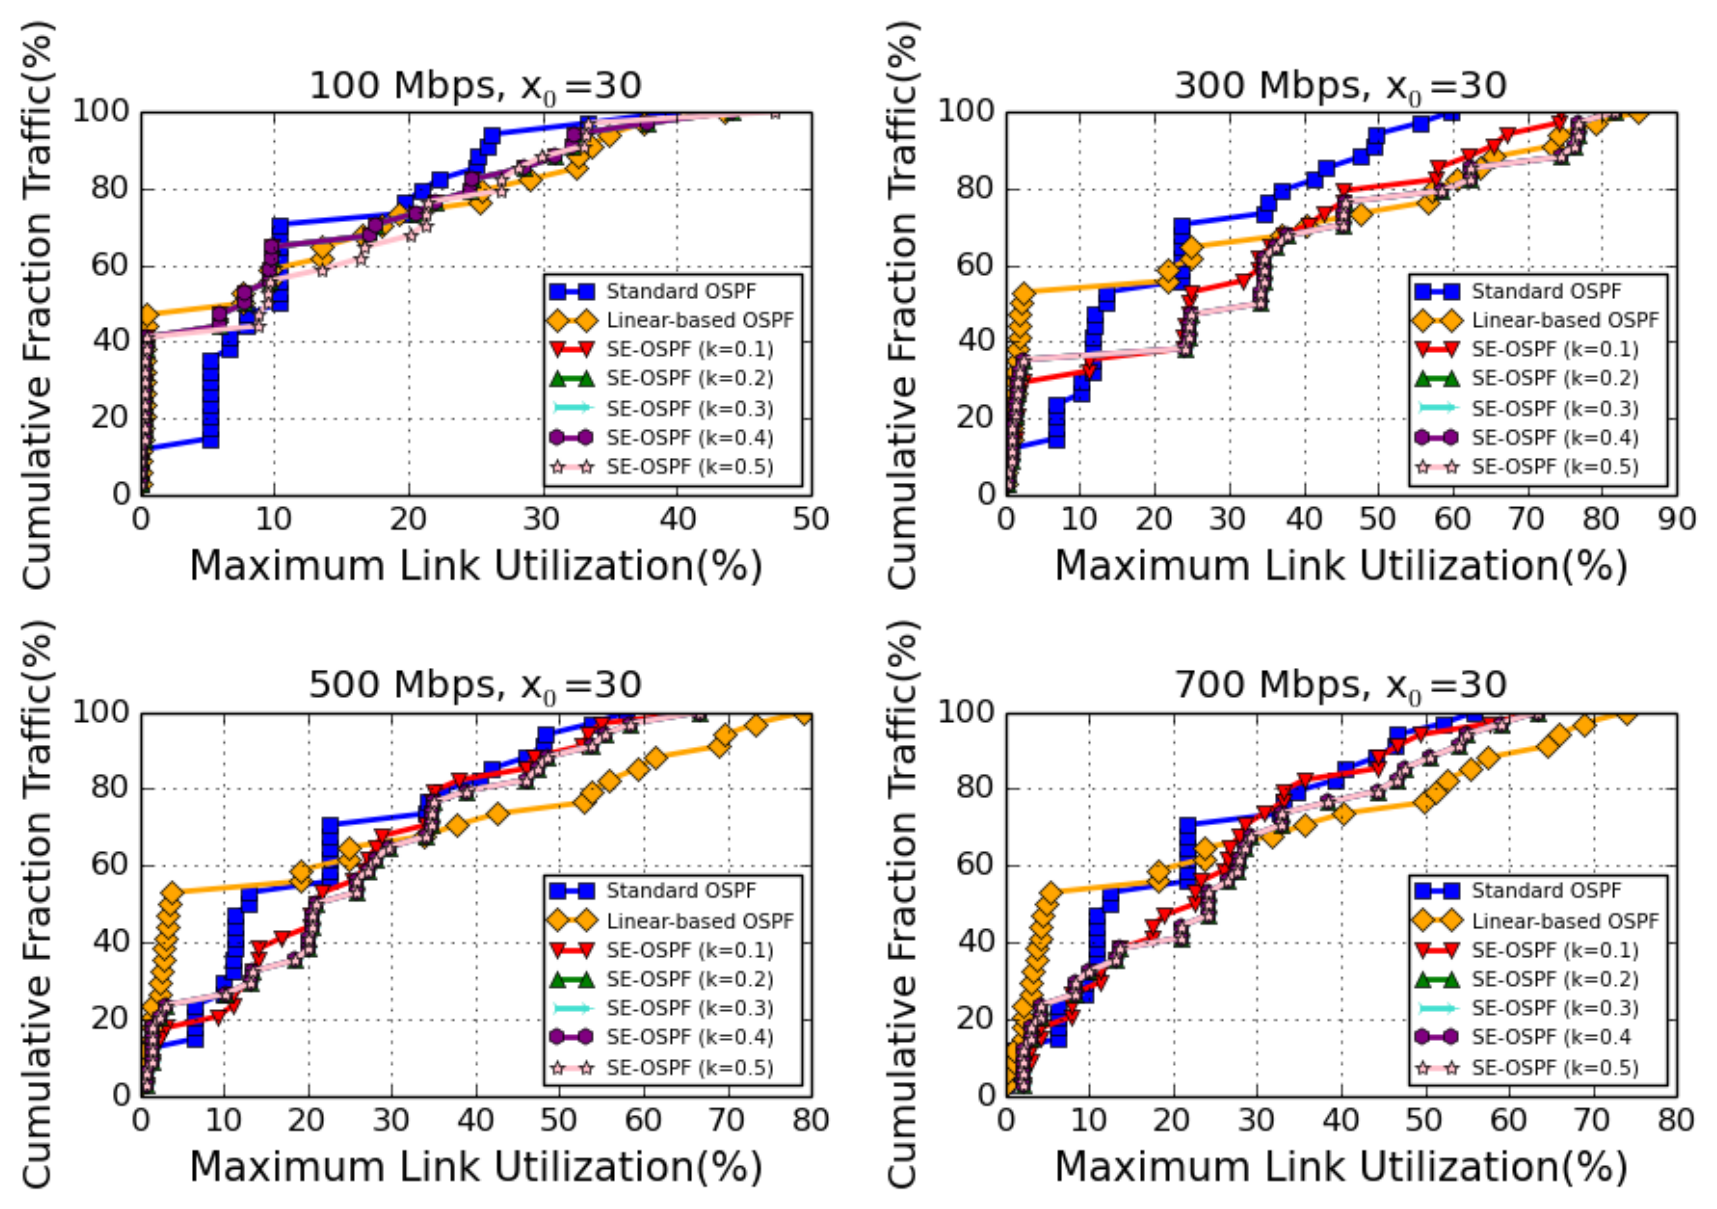
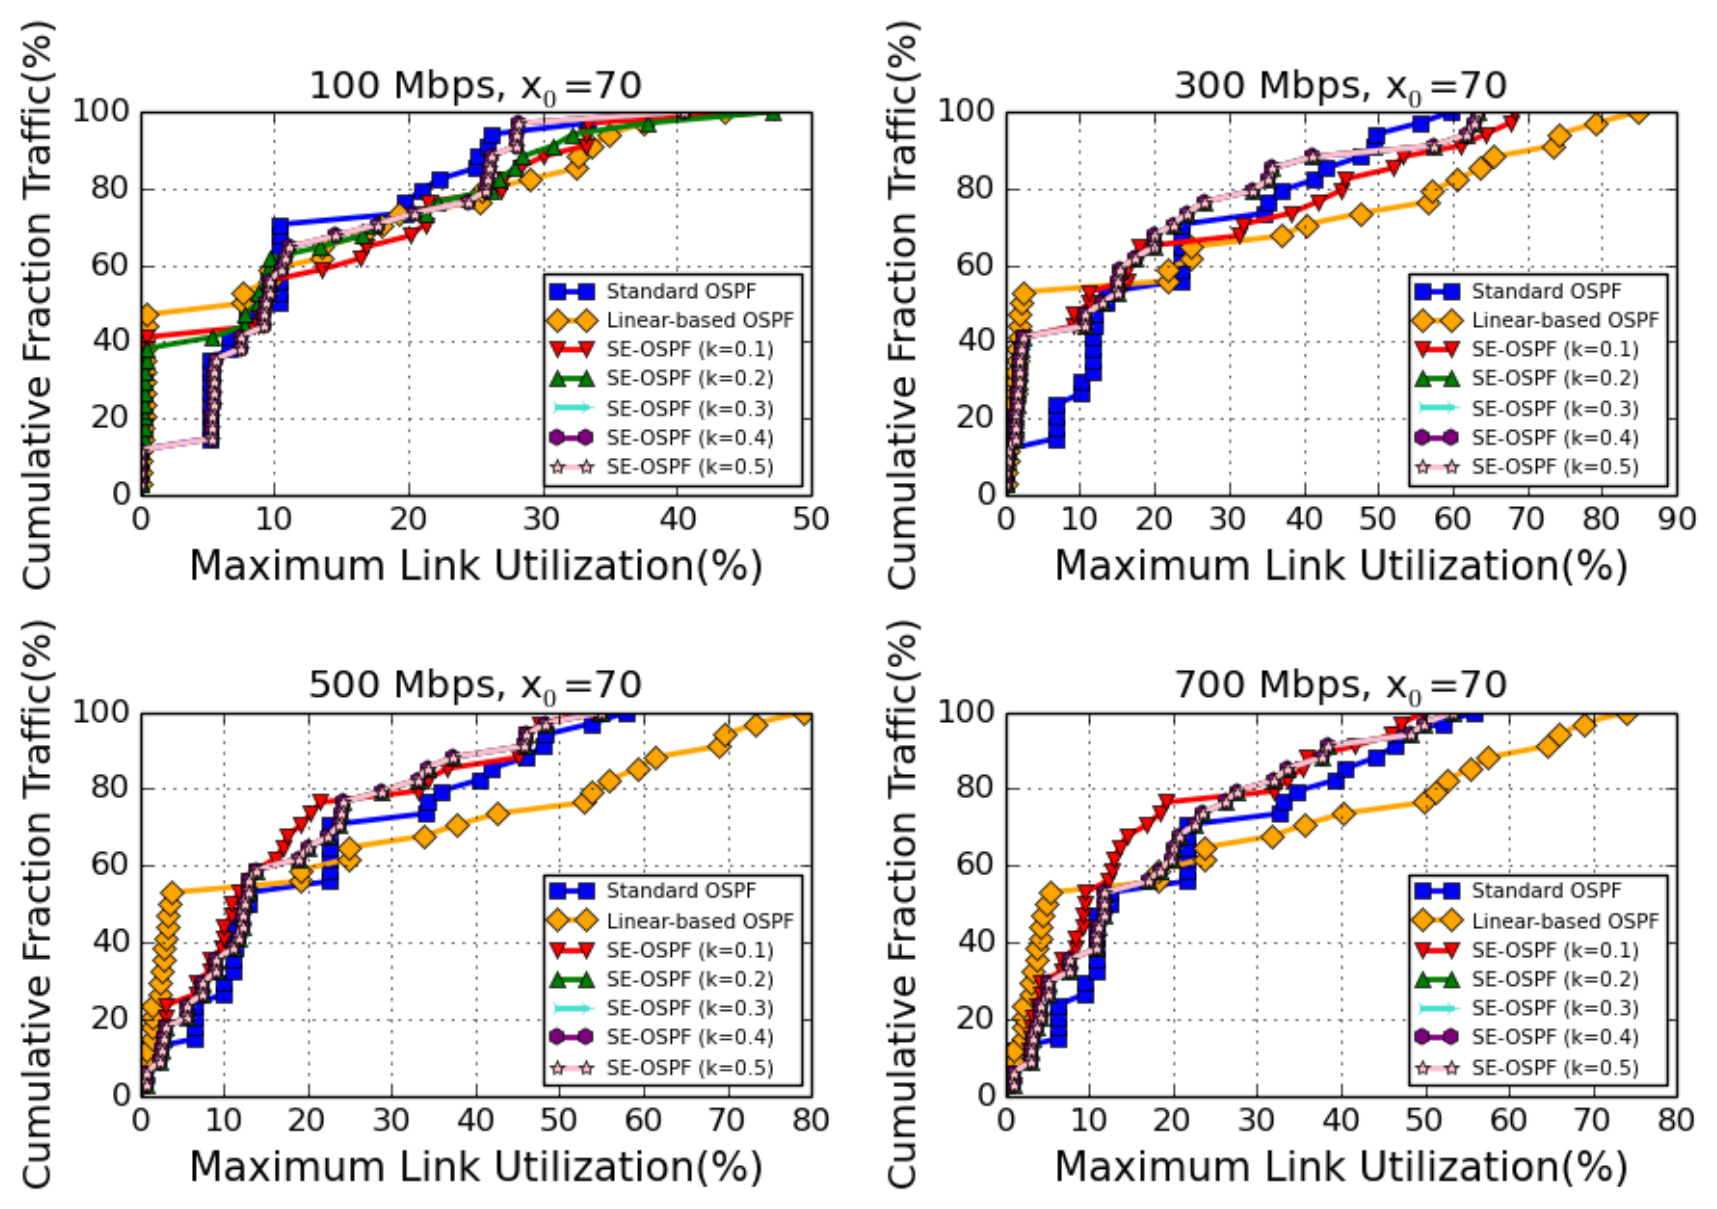
Cumulative distribution functions (CDFs) of Maximum Link Utilization (MLU) for Standard OSPF, Linear-OSPF, and SE-OSPF under bandwidths of 100, 300, 500, and 700 Mbps, with the sigmoid midpoint fixed at and the steepness parameter varied from to .
Figure 11.
Cumulative distribution functions (CDFs) of Maximum Link Utilization (MLU) for Standard OSPF, Linear-OSPF, and SE-OSPF under bandwidths of 100, 300, 500, and 700 Mbps, with the sigmoid midpoint fixed at and the steepness parameter varied from to .
Figure 12.
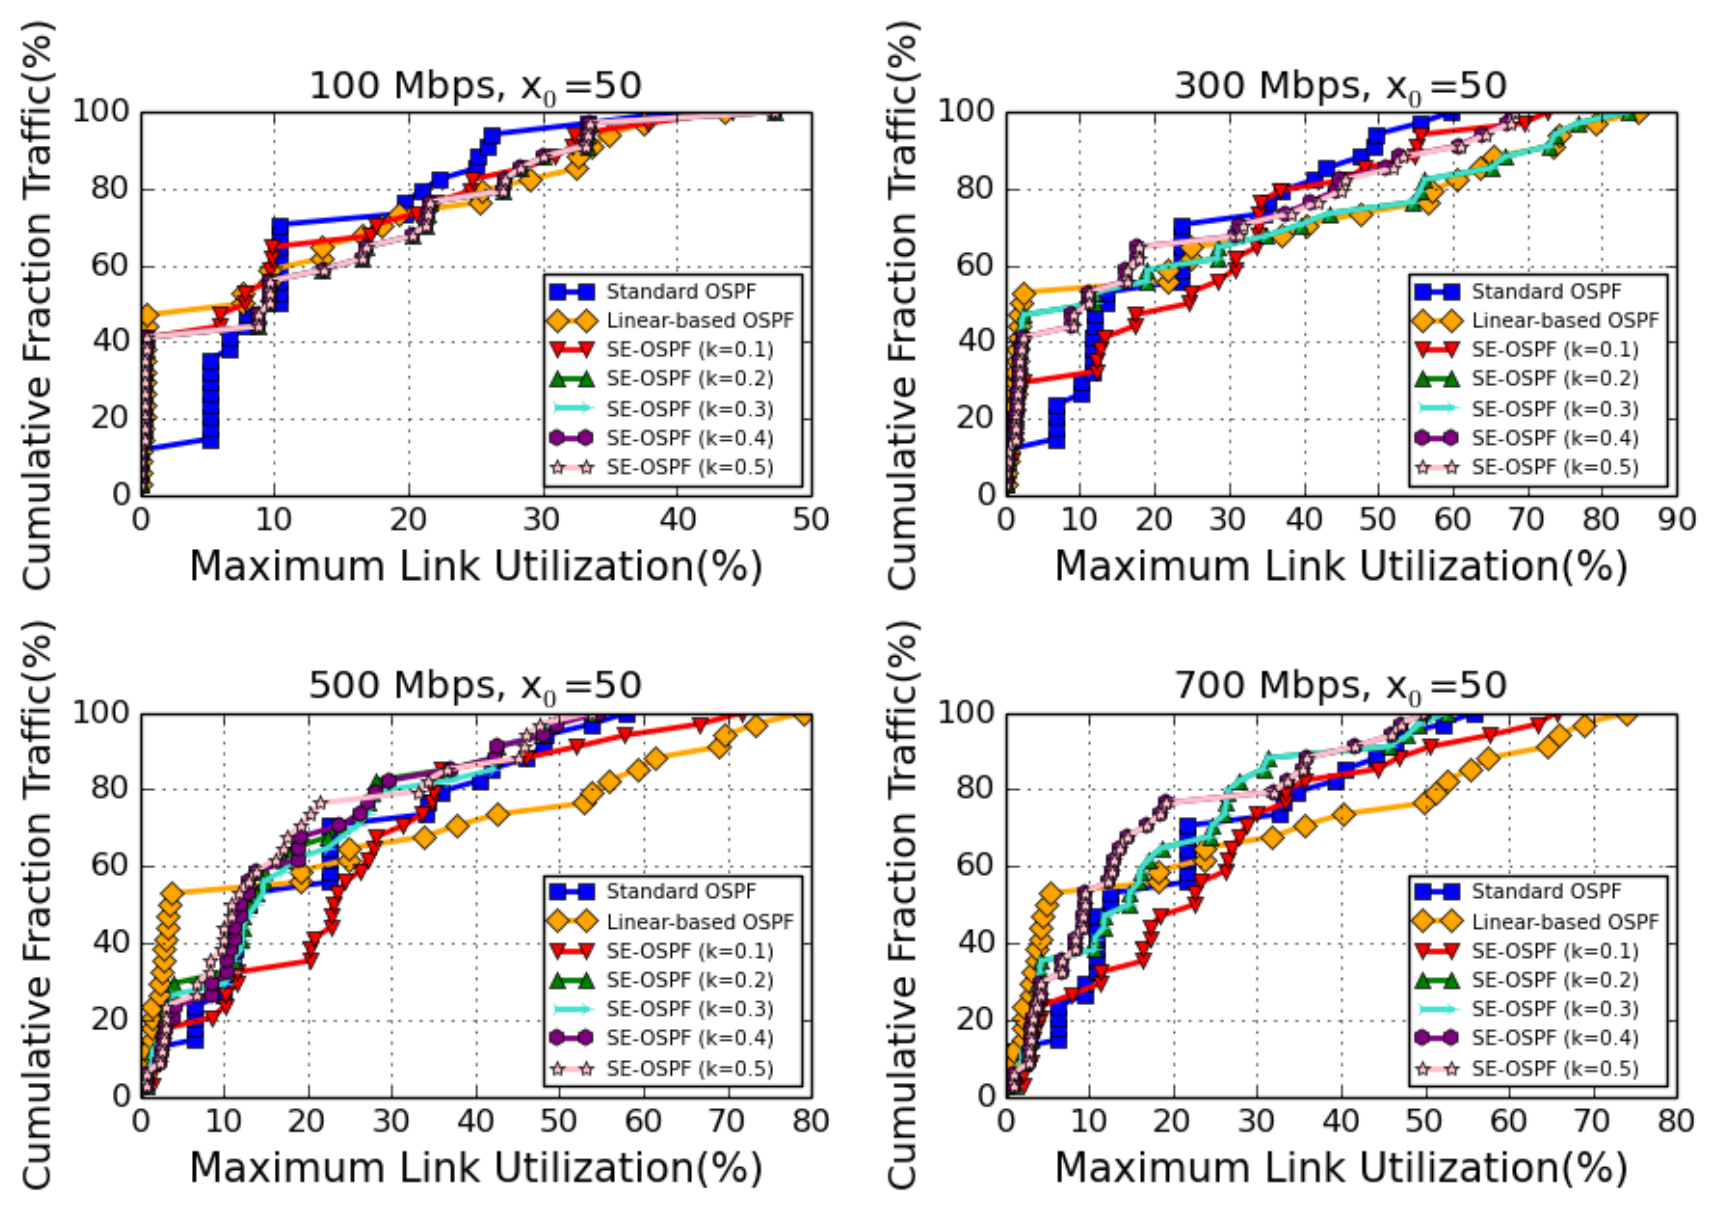
Cumulative distribution functions (CDFs) of Maximum Link Utilization (MLU) for Standard OSPF, Linear-OSPF, and SE-OSPF under bandwidths of 100, 300, 500, and 700 Mbps, with the sigmoid midpoint fixed at and the steepness parameter varied from to .
Figure 12.
Cumulative distribution functions (CDFs) of Maximum Link Utilization (MLU) for Standard OSPF, Linear-OSPF, and SE-OSPF under bandwidths of 100, 300, 500, and 700 Mbps, with the sigmoid midpoint fixed at and the steepness parameter varied from to .
Figure 13.
Cumulative distribution functions (CDFs) of Maximum Link Utilization (MLU) for Standard OSPF, Linear-OSPF, and SE-OSPF under bandwidths of 100, 300, 500, and 700 Mbps, with the sigmoid midpoint fixed at and the steepness parameter varied from to .
Figure 13.
Cumulative distribution functions (CDFs) of Maximum Link Utilization (MLU) for Standard OSPF, Linear-OSPF, and SE-OSPF under bandwidths of 100, 300, 500, and 700 Mbps, with the sigmoid midpoint fixed at and the steepness parameter varied from to .
Figure 14.
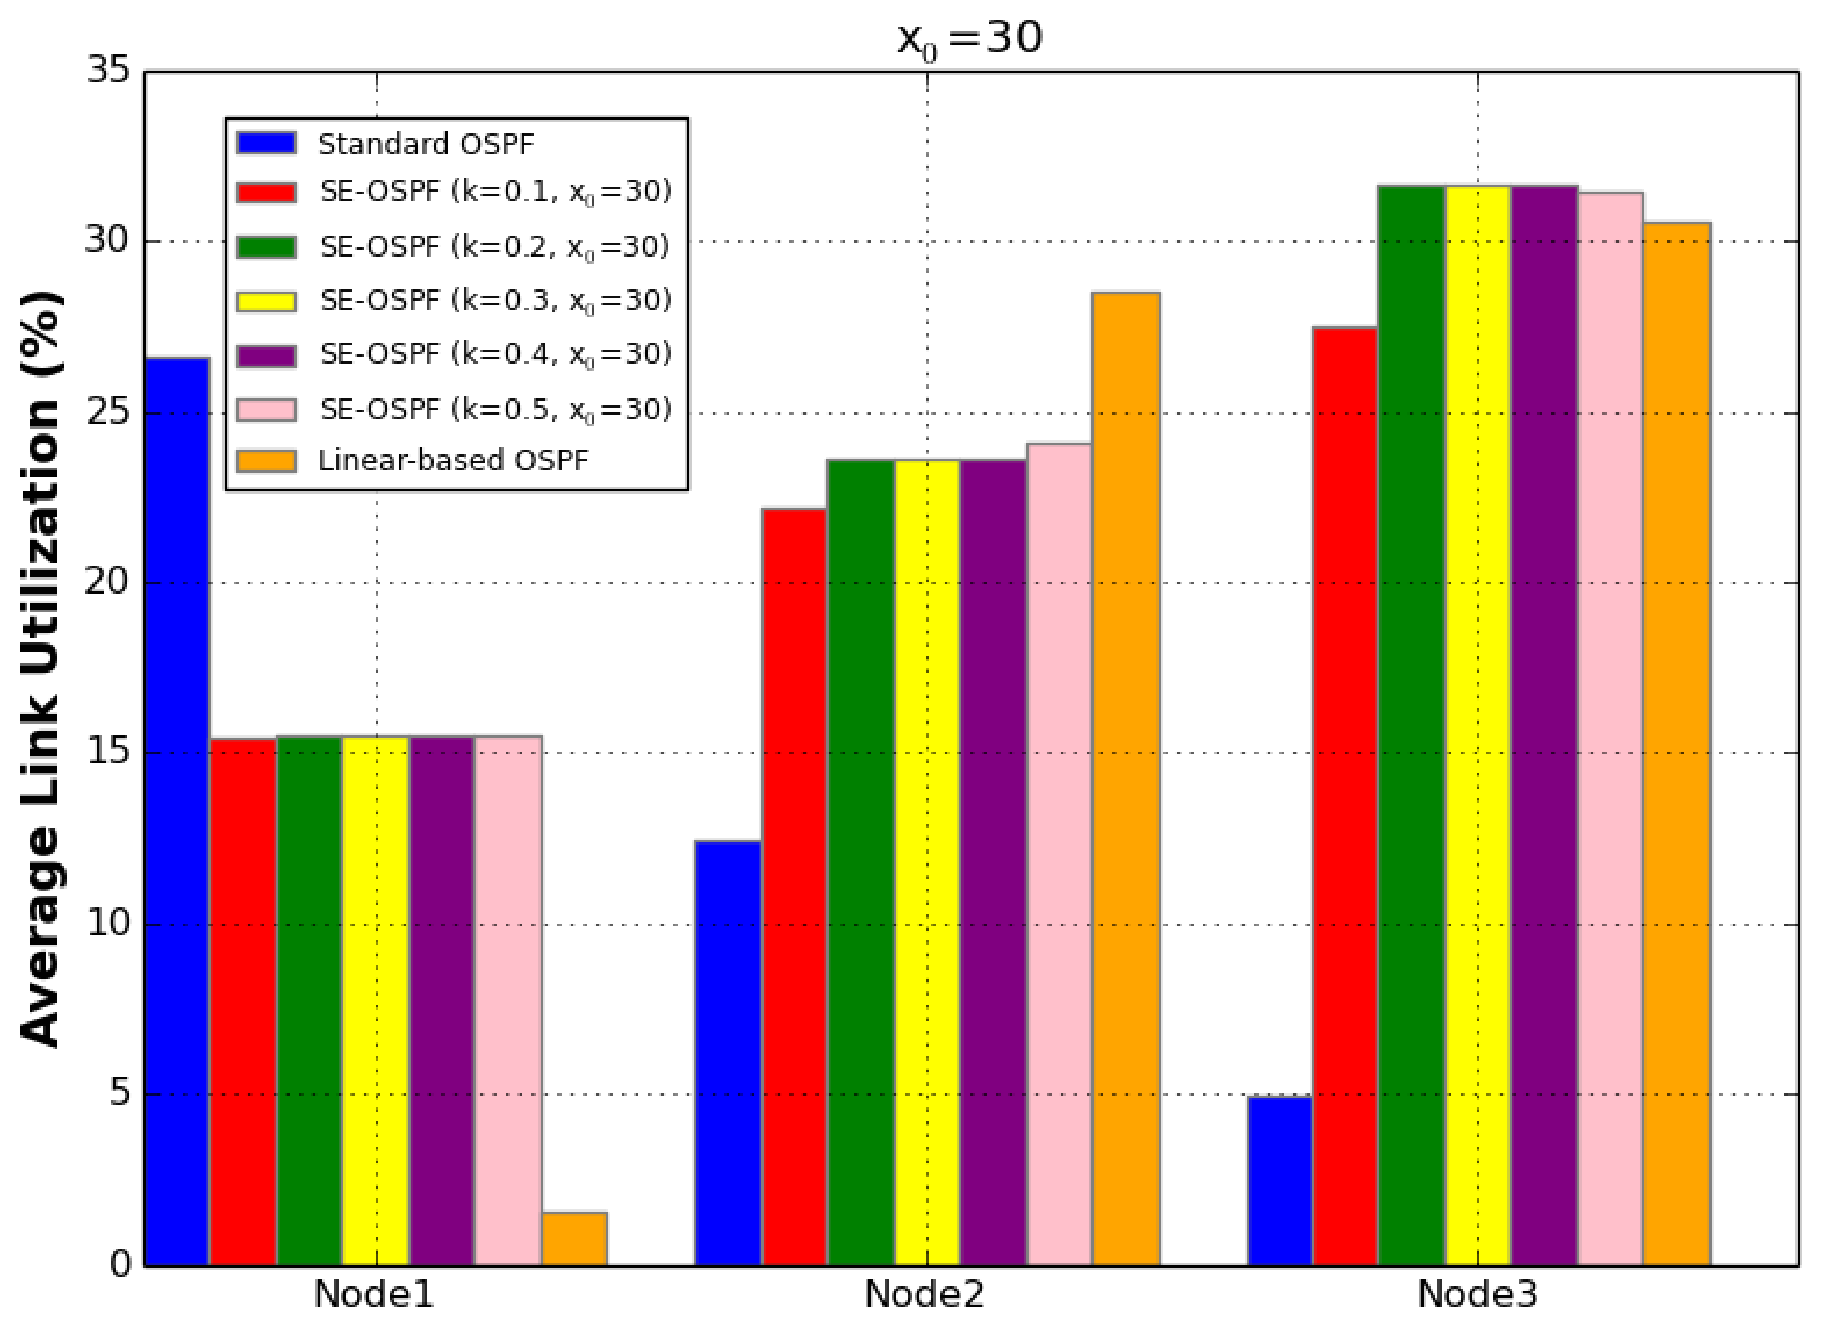
Average link utilization for Standard OSPF, Linear-OSPF, and SE-OSPF under different sigmoid steepness values (–0.5) with the sigmoid midpoint fixed at .
Figure 14.
Average link utilization for Standard OSPF, Linear-OSPF, and SE-OSPF under different sigmoid steepness values (–0.5) with the sigmoid midpoint fixed at .
Figure 15.
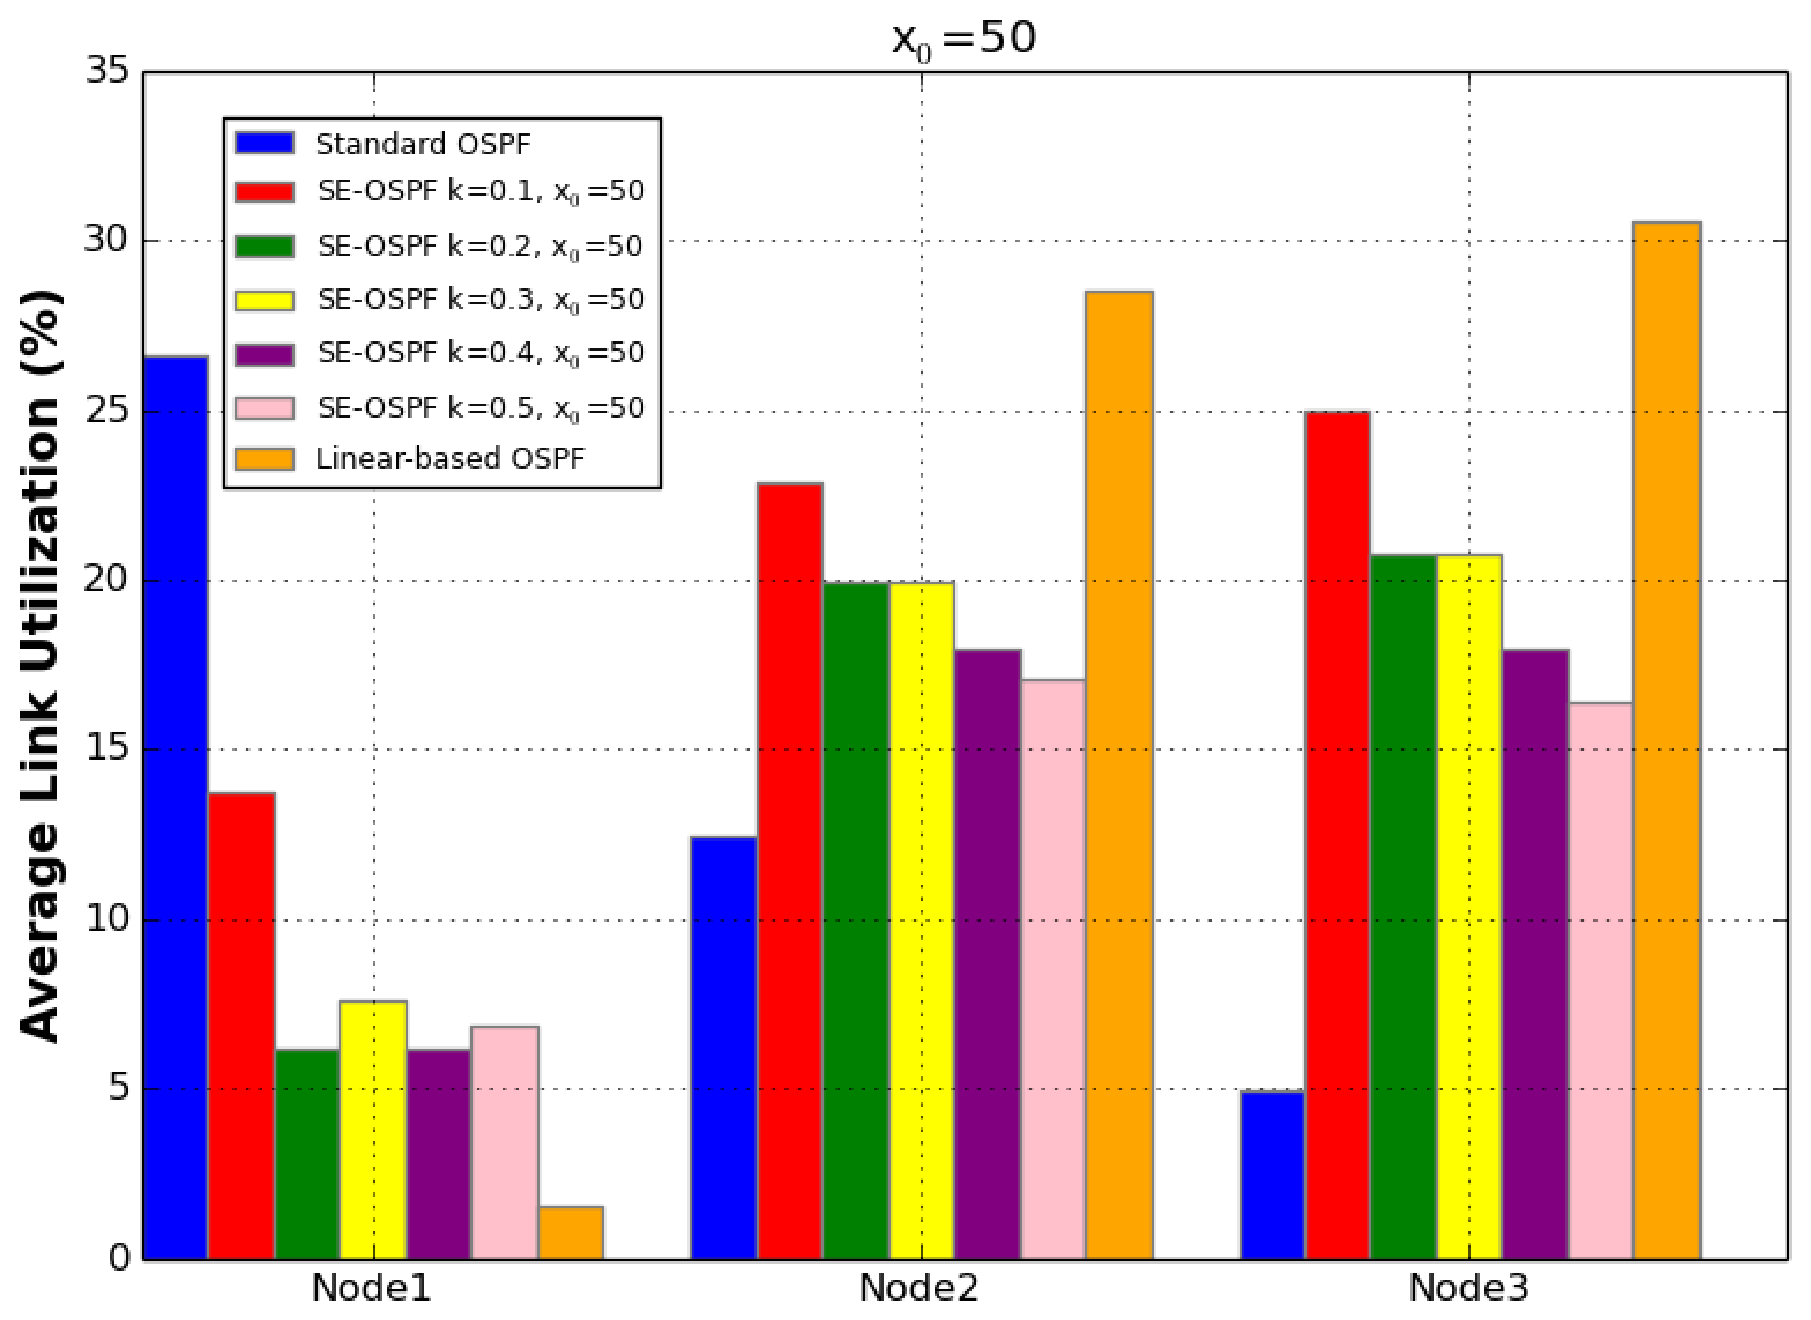
Average link utilization for Standard OSPF, Linear-OSPF, and SE-OSPF under different sigmoid steepness values (–0.5) with the sigmoid midpoint fixed at .
Figure 15.
Average link utilization for Standard OSPF, Linear-OSPF, and SE-OSPF under different sigmoid steepness values (–0.5) with the sigmoid midpoint fixed at .
Figure 16.
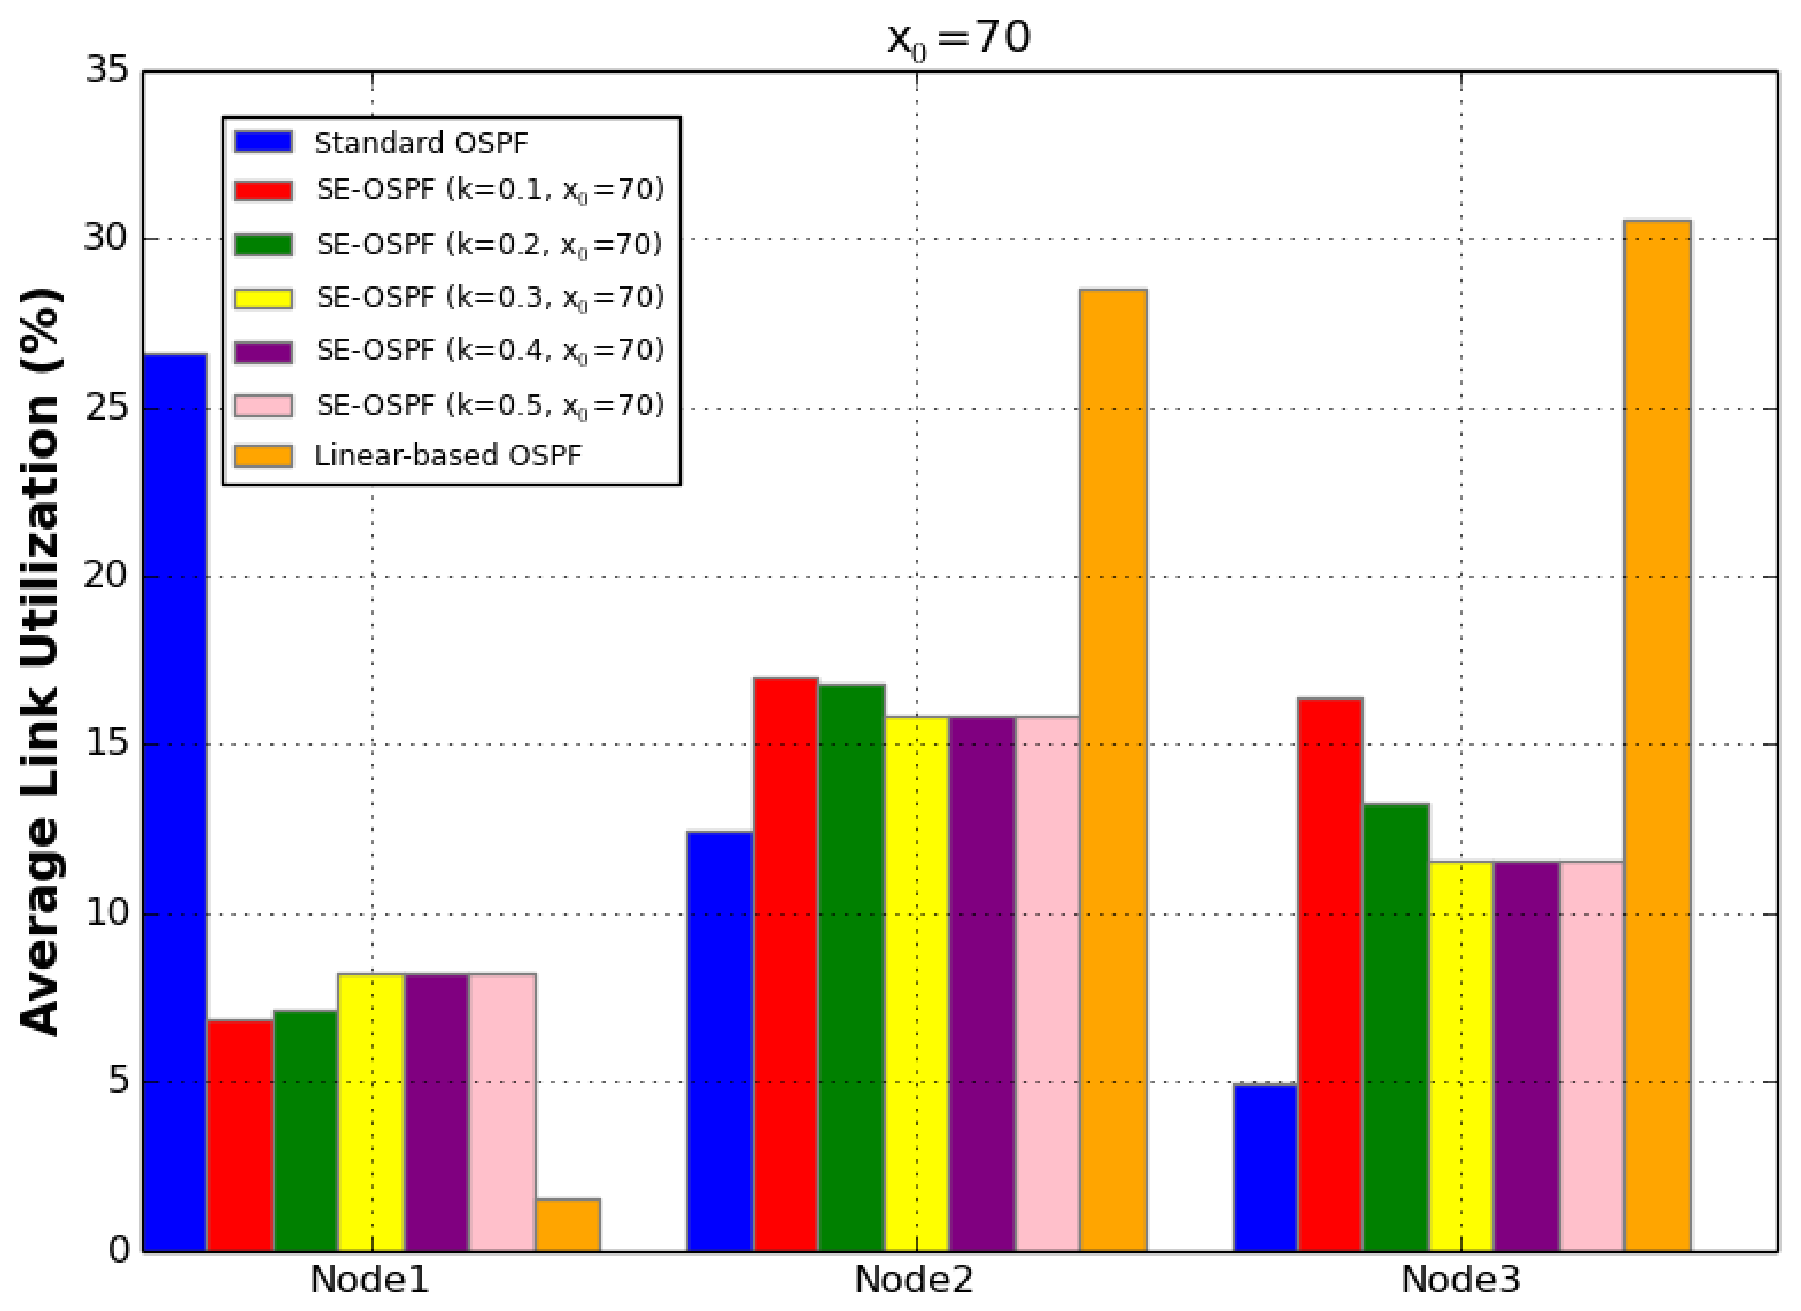
Average link utilization for Standard OSPF, Linear-OSPF, and SE-OSPF under different sigmoid steepness values (–0.5) with the sigmoid midpoint fixed at .
Figure 16.
Average link utilization for Standard OSPF, Linear-OSPF, and SE-OSPF under different sigmoid steepness values (–0.5) with the sigmoid midpoint fixed at .
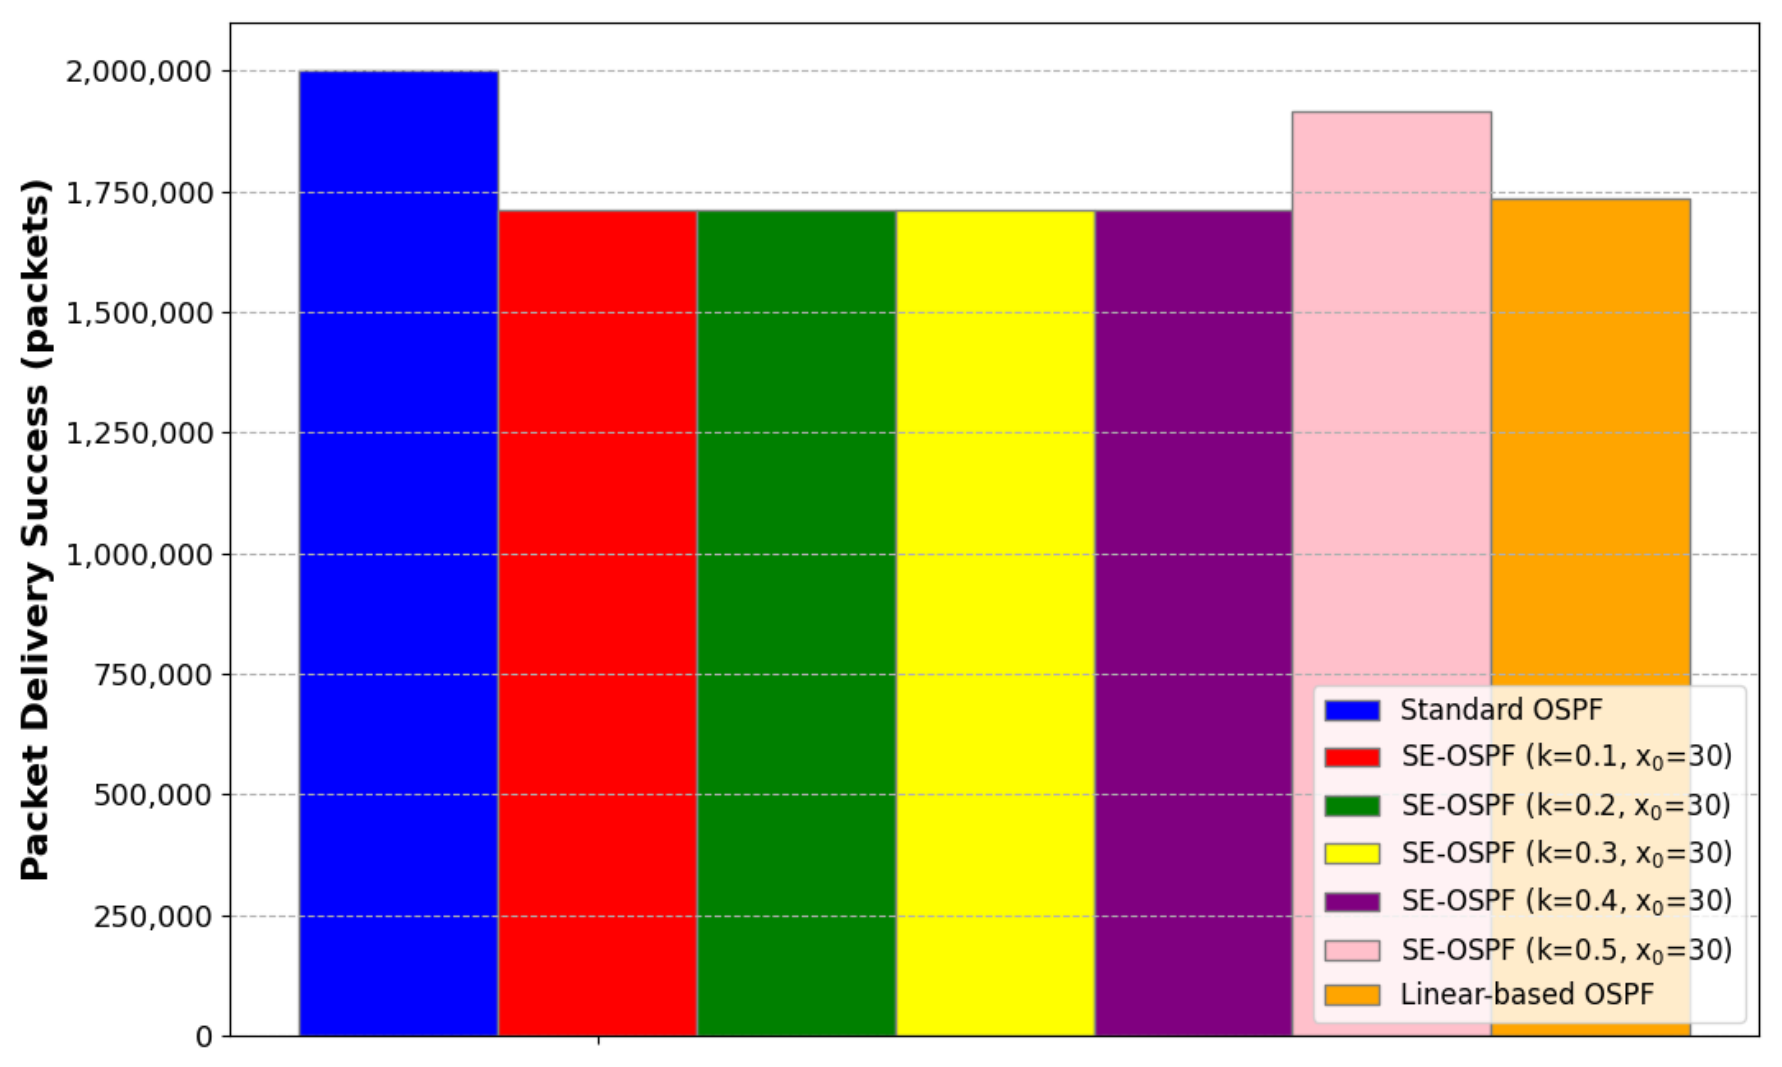
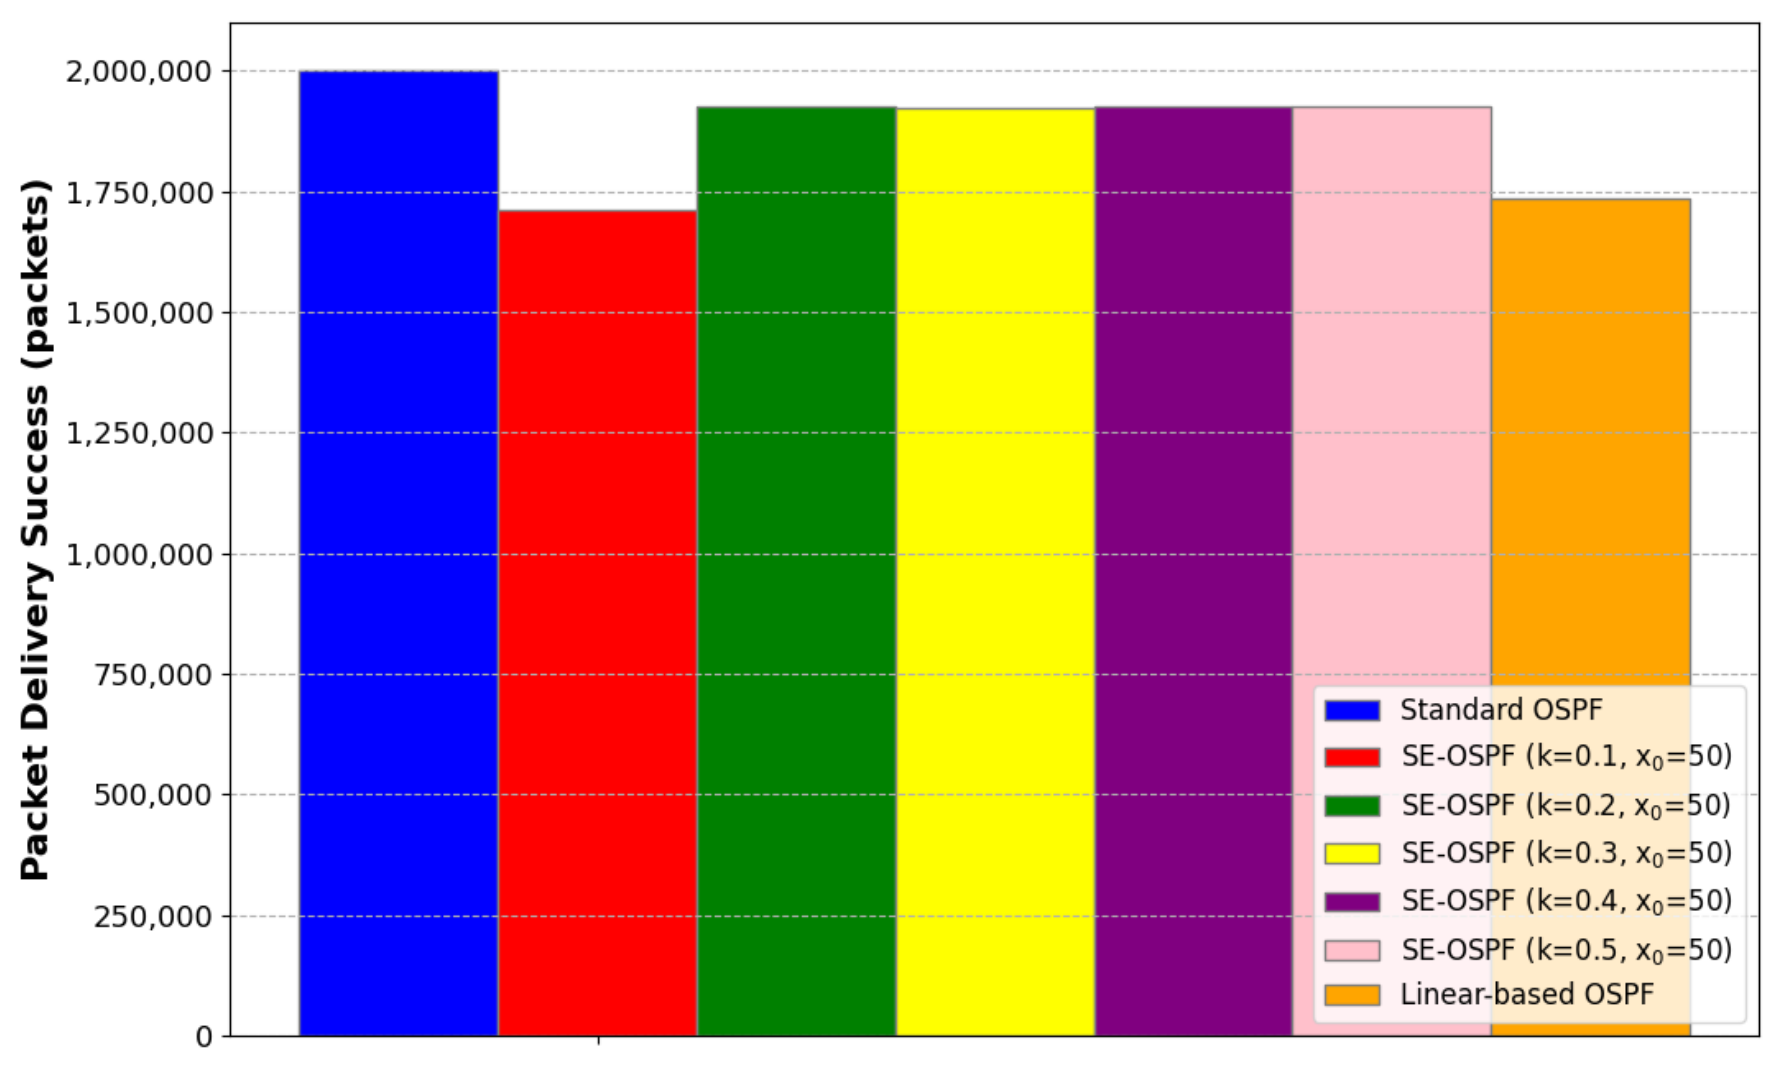
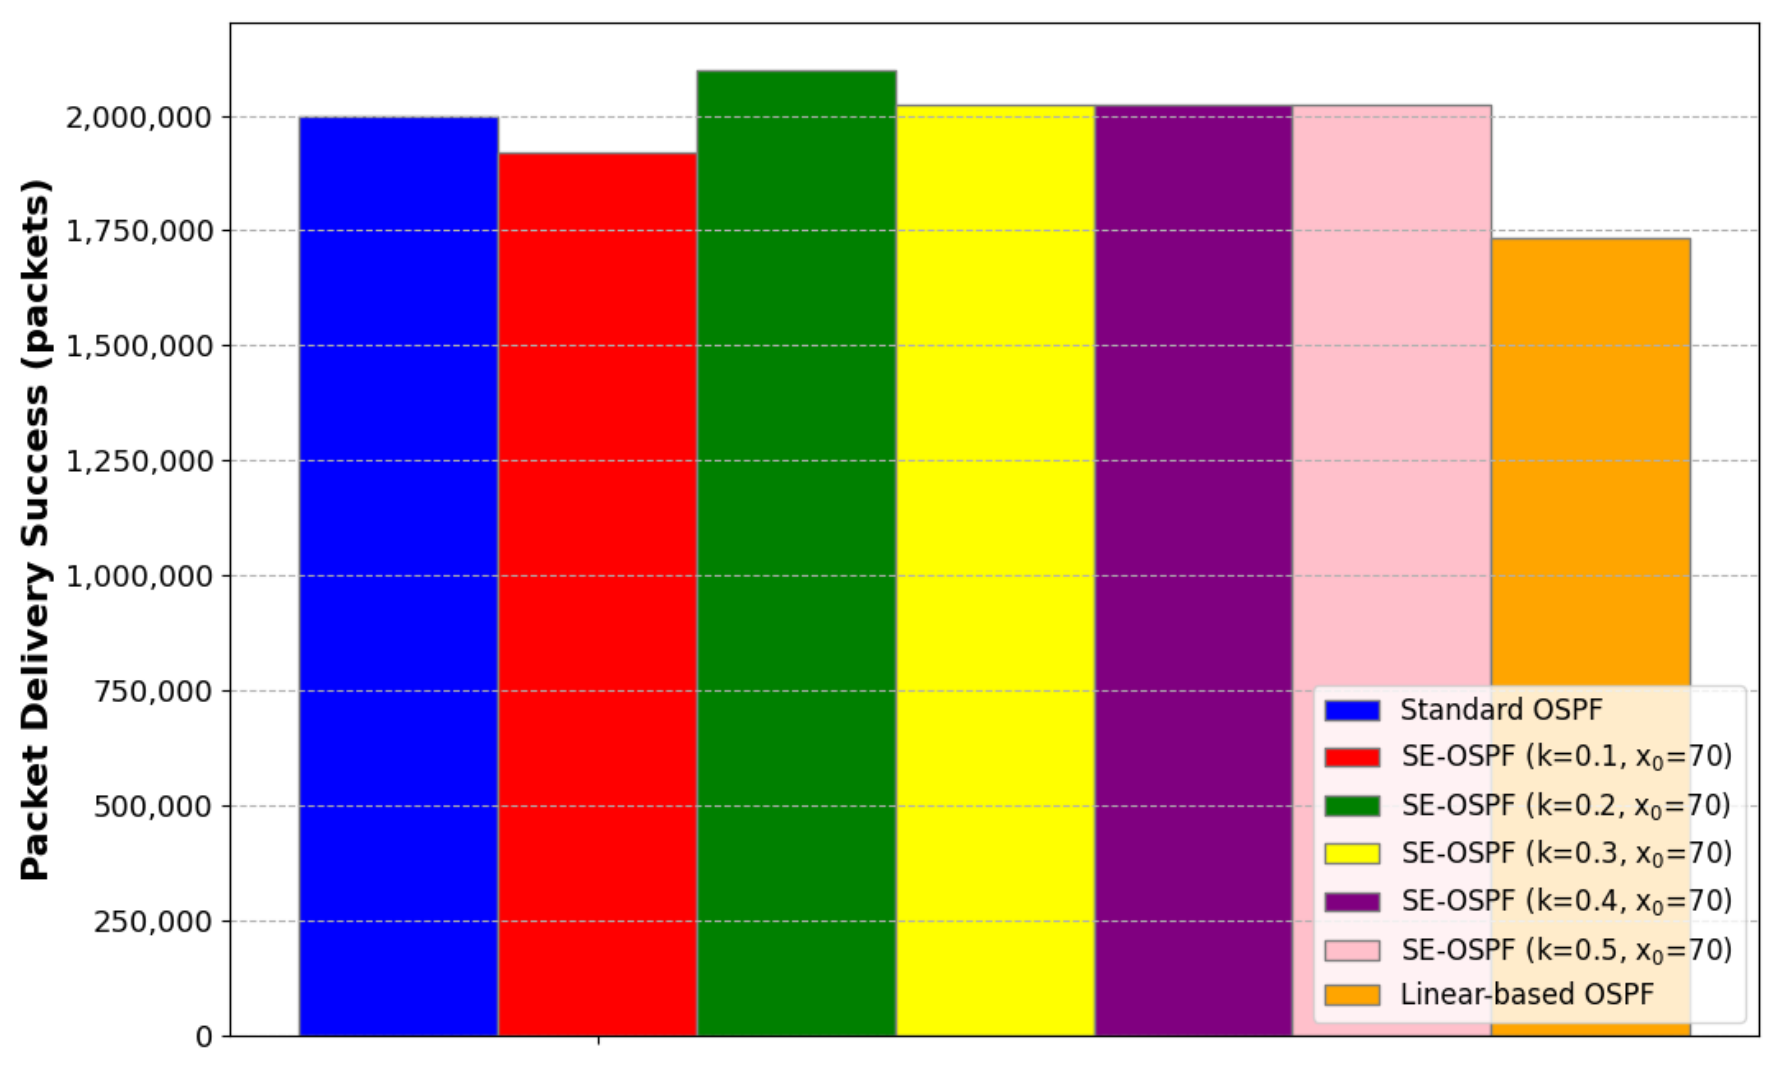
Figure 17.
Packet delivery success (PDS) for Standard OSPF, Linear-OSPF, and SE-OSPF under different sigmoid steepness values (–0.5) with the sigmoid midpoint fixed at .
Figure 17.
Packet delivery success (PDS) for Standard OSPF, Linear-OSPF, and SE-OSPF under different sigmoid steepness values (–0.5) with the sigmoid midpoint fixed at .
Figure 18.
Packet delivery success (PDS) for Standard OSPF, Linear-OSPF, and SE-OSPF under different sigmoid steepness values (–0.5) with the sigmoid midpoint fixed at .
Figure 18.
Packet delivery success (PDS) for Standard OSPF, Linear-OSPF, and SE-OSPF under different sigmoid steepness values (–0.5) with the sigmoid midpoint fixed at .
Figure 19.
Packet delivery success (PDS) for Standard OSPF, Linear-OSPF, and SE-OSPF under different sigmoid steepness values (–0.5) with the sigmoid midpoint fixed at .
Figure 19.
Packet delivery success (PDS) for Standard OSPF, Linear-OSPF, and SE-OSPF under different sigmoid steepness values (–0.5) with the sigmoid midpoint fixed at .
Table 1.
Comparison between the previous sigmoid-based OSPF study [
18] and the proposed SE-OSPF framework.
Table 1.
Comparison between the previous sigmoid-based OSPF study [
18] and the proposed SE-OSPF framework.
| Aspect | Previous Work [18] | This Work |
|---|
| Objective | Sigmoid routing metric | Risk-aware SE-OSPF |
| Routing input | QoS metrics | Structural risk () |
| Risk model | None | BA topology |
| OSPF | Metric evaluation | Risk-aware cost |
| Parameters | k | k, |
Table 2.
Comparison of OSPF-ICSA, QKD-Enabled OSPF, and SE-OSPF.
Table 2.
Comparison of OSPF-ICSA, QKD-Enabled OSPF, and SE-OSPF.
| Aspect | OSPF-ICSA | QKD-Enabled OSPF | SE-OSPF (This Work) |
|---|
| Primary Goal | Fast convergence | Quantum key relay | Risk-aware routing |
| Optimization Layer | Control-plane timing | Key-resource routing | Routing metric adaptation |
| Secure Basis | Reliability | QKD cryptography | Network-layer risk awareness |
| Routing Resource | Hello/dead intervals | Key pool and SKR | Risk indicators |
| Metric Modification | No cost change | Discrete key thresholds | Continuous sigmoid cost |
| OSPF Integration | Hello interval tuning | QKD-specific LSAs | Standard LSAs, cost only |
| Path Selection | Shortest path | Avoid low-key links | Avoid high-risk paths |
| Performance Focus | Convergence time | Key sustainability | Delay, jitter, utilization, PDS |
| Hardware | None | QKD hardware | None |
| Key Limitation | No risk awareness | High cost | Risk modeling accuracy |
Table 3.
Conceptual interpretation of linear and sigmoid-based metrics.
Table 3.
Conceptual interpretation of linear and sigmoid-based metrics.
| Property | Linear Metric | Sigmoid Metric |
|---|
| Cost growth | Constant rate | Adaptive rate |
| Sensitivity | Uniform | Threshold-based |
| Adaptability | Moderate | High |
| Congestion response | Gradual | Rapid near threshold |
Table 4.
Simulation parameters.
Table 4.
Simulation parameters.
| Parameter | Value |
|---|
| Simulator | NS-3 |
| Topology model | Barabási–Albert scale-free topology |
| Number of core routers | 10 |
| Number of host nodes | 16 |
| Total nodes | 26 |
| Link type | Point-to-point wired links |
| Link bandwidth | 1 Gbps (link capacity) |
| Link propagation delay | 1 ns |
| Traffic type | UDP Poisson traffic |
| Number of active traffic flows | 26 |
| Packet size | 560 bytes |
| Traffic rate | 100, 300, 500, and 700 Mbps (application rate) |
| Maximum packets per flow | 100,000 packets |
| Queue type | NS-3 default |
| Queue size | NS-3 default |
| Simulation length | 200 s |
| Routing update time | 0.06 s |
| Routing update mechanism | Routing table recomputation |
| Risk update mechanism | Static topology-based structural risk |
| Random seeds | 1–3 |
| Repeated runs | 5 simulation runs |
| Compared protocols | Standard OSPF, Linear-OSPF, and SE-OSPF |
Table 5.
Effects of sigmoid parameters on routing behavior.
Table 5.
Effects of sigmoid parameters on routing behavior.
| Parameter | Effect | Benefit | Trade-Off |
|---|
| Small () | Early penalty | Less congestion | Longer paths |
| Large () | Late penalty | Better hub usage | Higher delay |
| Small (k) | Smooth transition | Stable routing | Slow adaptation |
| Large (k) | Sharp transition | Fast adaptation | Longer paths |
Table 6.
Effects of sigmoid parameters on jitter performance.
Table 6.
Effects of sigmoid parameters on jitter performance.
| Parameter | Effect | Benefit | Trade-Off |
|---|
| Small () | Early adaptation | Lower jitter | Less stable routes |
| Large () | Late adaptation | Stable routing | Higher jitter |
| Small (k) | Smooth transition | Stable routing | Slow adaptation |
| Large (k) | Sharp transition | Lower jitter | Frequent updates |
Table 7.
Effects of sigmoid parameters on maximum link utilization.
Table 7.
Effects of sigmoid parameters on maximum link utilization.
| Parameter | Effect | Benefit | Trade-Off |
|---|
| Small () | Early adaptation | Lower MLU | Less stable routes |
| Large () | Late adaptation | Stable routing | Higher MLU |
| Small (k) | Smooth transition | Stable routing | Slower load balancing |
| Large (k) | Fast adaptation | Lower MLU | Higher routing sensitivity |
Table 8.
Summary of maximum link utilization comparison. The dash (–) indicates that the comparison is not applicable.
Table 8.
Summary of maximum link utilization comparison. The dash (–) indicates that the comparison is not applicable.
| Routing Scheme | ALU (%) | vs. Standard | vs. Linear |
|---|
| Standard OSPF | 21.76 | – | – |
| Linear OSPF | 25.18 | +15.7% | – |
| SE-OSPF (Avg) | 30.84 | +41.7% | +22.5% |
Table 9.
Effects of sigmoid parameters on packet delivery success.
Table 9.
Effects of sigmoid parameters on packet delivery success.
| Parameter | Effect | Benefit | Trade-Off |
|---|
| Small () | Early | Less congestion | Lower PDS |
| Large () | Late | Higher PDS | Higher congestion risk |
| Small (k) | Smooth | Stable routing | Slow congestion response |
| Large (k) | Fast | Better congestion avoidance | More route changes |
Table 10.
Unified effects of sigmoid parameters on routing performance. Arrows indicate the relative change in each metric (↑: increase; ↓: decrease).
Table 10.
Unified effects of sigmoid parameters on routing performance. Arrows indicate the relative change in each metric (↑: increase; ↓: decrease).
| Parameter | Behavior | Delay | Jit./MLU | PDS | Trade-Off |
|---|
| Small () | Early | ↓ | ↓ | ↓ | Fast adaptation |
| Large () | Late | ↑ | ↑ | ↑ | Stable routing |
| Small (k) | Smooth | ↑ | Stable | Moderate | Slow response |
| Large (k) | Fast | ↓ | ↓ | Moderate | Frequent updates |
Table 11.
Performance comparison of routing schemes.
Table 11.
Performance comparison of routing schemes.
| Metric | Std. OSPF | Linear OSPF | SIGMOID () |
|---|
| Delay (s) | 0.66 | 0.65 | 0.53 |
| Jitter (ms) | 22.76 | 20.11 | 20.81 |
| Packet Delivery (Avg) | 1,999,595 | 1,734,813 | 2,023,200 |
| Adaptivity | Low | Medium | High |