Abstract
Cloud computing faces growing challenges in energy consumption due to the increasing demand for services and resource usage in data centers. To address this issue, we propose a novel energy-efficient virtual machine (VM) placement strategy that integrates reinforcement learning (Q-learning), a Firefly optimization algorithm, and a VM sensitivity classification model based on random forest and self-organizing map. The proposed method, RLVMP, classifies VMs as sensitive or insensitive and dynamically allocates resources to minimize energy consumption while ensuring compliance with service level agreements (SLAs). Experimental results using the CloudSim simulator, adapted with data from Microsoft Azure, show that our model significantly reduces energy consumption. Specifically, under the lr_1.2_mmt strategy, our model achieves a 5.4% reduction in energy consumption compared to PABFD, 12.8% compared to PSO, and 12% compared to genetic algorithms. Under the iqr_1.5_mc strategy, the reductions are even more significant: 12.11% compared to PABFD, 15.6% compared to PSO, and 18.67% compared to genetic algorithms. Furthermore, our model reduces the number of live migrations, which helps minimize SLA violations. Overall, the combination of Q-learning and the Firefly algorithm enables adaptive, SLA-compliant VM placement with improved energy efficiency.
1. Introduction
In the early days of computing, processing power was both scarce and costly. The emergence of cloud computing, however, has completely reshaped this landscape by making computational resources more accessible and affordable [1]. This shift has played a key role in democratizing access to digital services and transforming not just the ICT sector but also a wide range of industries.
Yet, the growing reliance on cloud infrastructure brings with it new challenges—particularly in terms of energy consumption. While cloud computing is generally cost-effective, the rapid expansion of digital services and data storage has contributed to a sharp increase in the energy demands of data centers and telecommunications networks [2]. According to the International Energy Agency (IEA), these facilities account for roughly 1% of global electricity use—a figure that could climb to between 3% and 13% by 2030 [3].
Reports from Greenpeace and research institutions such as the Lawrence Berkeley National Laboratory highlight this upward trend. For instance, U.S. data centers alone consumed nearly 2% of the country’s electricity in 2020. As the demand for cloud services continues to rise, addressing this growing energy footprint has become a pressing concern. Promoting sustainable cloud infrastructure calls for targeted actions such as improving hardware efficiency, increasing the use of renewable energy, and enhancing server utilization rates [4].
One of the key challenges in data center optimization is deciding where to place virtual machines (VMs). When VMs are poorly distributed across servers, it can cause thermal imbalances, inefficient cooling, and congested network paths—all of which increase energy consumption and degrade system performance [5]. For example, concentrating VMs in one area can cause hotspots, increasing cooling needs. On the other hand, uneven placement might result in underused resources or excessive data traffic.
Moreover, poor VM placement can affect a provider’s ability to meet service level agreements (SLAs). Hosting critical workloads on servers that are either overburdened or underused can lead to performance issues, service interruptions, and potential SLA violations [6]. To avoid these risks, placement strategies must not only aim to consolidate resources efficiently but also maintain performance, respect thermal constraints, and uphold service quality [7].
To address these challenges, researchers have developed intelligent placement algorithms capable of dynamically adjusting VM allocation based on system conditions [8]. Techniques such as Software-Defined Networking (SDN) and Network Function Virtualization (NFV) offer more agility in managing traffic, reducing latency, and improving system responsiveness. Additionally, methods like live migration and workload balancing help optimize energy use and reduce the likelihood of thermal hotspots [9].
Server consolidation is often used to reduce energy use, but it sometimes overlooks how applications interact with users, especially in terms of latency sensitivity [10]. Moving a latency-critical VM without considering its communication patterns can degrade service quality and lead to SLA breaches. To prevent this, VM placement must go beyond simple resource metrics and take into account the specific behavior and requirements of each workload.
This paper aims to fill this gap by proposing an innovative hybrid strategy that combines machine learning, reinforcement learning, and metaheuristic optimization to dynamically and intelligently manage energy consumption in cloud environments. Unlike traditional approaches that primarily rely on static rules or simple metrics, our approach integrates workload behavior, particularly the sensitivity to latency, to optimize VM placement decisions. By using reinforcement learning, our system can adapt to changing conditions in real time, thereby optimizing energy consumption while respecting SLAs. Additionally, the integration of the Firefly algorithm into this process expands the search space and avoids local optima, contributing to a better exploration of potential solutions.
The remainder of the paper is organized in this way: Section 2 presents background information and an overview of the principal algorithms used in the current study. Section 3 gives a detailed analysis of a number of proposed solutions that are relevant to our subject. In Section 4, the dataset and system model are explained. Section 5 provides a clear foundation for this inquiry by outlining the methodology and suggested technique. In Section 6, the results are thoroughly analyzed and presented in detail. Section 7 concludes the article by summarizing the key findings and suggesting potential avenues for future research.
2. Background
In the following sections, we will implement and evaluate several models from deep learning (DL) and reinforcement learning (RL). Before proceeding, it is useful to define these approaches within this framework to better understand their practical application to our problem.
- Random forests: Random forests are a robust and versatile supervised learning method that combines several decision trees to improve the quality of predictions. During training, several decision trees are generated and their results aggregated, either by majority voting for classification tasks or by averaging predictions for regression tasks. By leveraging this ensemble approach, random forests improve accuracy and reduce the risk of overfitting. Thanks to their ability to handle large-scale, complex datasets, they are widely used in applications such as feature recognition, economic forecasting, medical diagnosis, predicting CPU utilization [11], and many other fields [12].
- Self-organizing maps (SOMs): The self-organizing map (SOM) is a type of artificial neural network designed to function in an unsupervised manner. It is effective for both dimensionality reduction and clustering tasks. SOMs project high-dimensional data onto a lower-dimensional (typically 2D) grid, revealing the underlying structure and relationships within the dataset. Competitive learning is used, in which grids deform at the input, where grid neurons compete to represent data. SOMs improve understanding of structures and relationships in data, with all their benefits for data visualization, pattern recognition, and other exploratory activities [13].
- Firefly: The Firefly optimization algorithm is a metaheuristic inspired by the flashing behavior of fireflies [14]. It uses the fireflies’ brightness level to indicate candidate solutions in which brighter fireflies attract others, causing them to move toward better solutions in the search space. Two key parameters are the attractiveness coefficient and the light absorption coefficient; the two guide the fireflies towards the best possible solutions with minimal effort [15]. The total time complexity of the Firefly algorithm is as follows: , where
- ✔
- t: The number of iterations the algorithm runs.
- ✔
- n: The number of fireflies in the population.
- ✔
- d: The number of dimensions in the search space.
- Q-learning: Q-learning is a reinforcement learning algorithm that tries to select the optimum action according to the current state of the environment. It is a model-free algorithm. The basic concept of Q-learning is to learn a policy that tells an agent what action to take under what circumstances. In order to achieve this, a Q-function is formed that computes the utility or expected reward from performing a certain action in a certain condition and applying the optimal policy afterward. The Q-function is updated applying this formula [16].where
- represents the current Q-value for state and action at.
- is the learning rate, indicating how quickly data on new states will be considered in subsequent steps .
- is the reward received after taking action at in state .
- is the Discount factor, a parameter that determines the importance of future rewards.
- is an estimation of the optimal Q-value in the future.
- If , the agent does not learn to improve its future actions.
- If , the agent relies entirely on the most recent experiences to guide its actions.
- If , it means that the agent is only concerned with immediate rewards and does not consider future rewards at all.
- If , this means the agent fully considers future rewards, values them equally to immediate ones, and treats them with the same importance as immediate rewards.
When the agent receives the state again, it chooses the action with the maximum Q-value. A policy for selecting the best action in state is defined as follows.
Thus, the goal of the learning agent is to find the optimal policy mapping states (S) to actions (A) in a way that maximizes the expected long-term reward for action execution. To choose the control action, the learning agent can use either of two techniques: (i) random action selection at the beginning of the management process (training period) or (ii) action selection defined by the policy.
3. Related Work
Jeong et al. [17] introduced an innovative approach to virtual machine (VM) consolidation, employing a Transformer-based Deep Reinforcement Learning (DRL) method to tackle the complexity and inefficiency inherent in operating Software-Defined Network-enabled Network Function Virtualization (SDN-enabled NFV). The common practice of distributing Virtual Network Functions (VNFs) as VMs across servers often results in energy loss due to irregular deployment patterns. The proposed methodology focuses on enhancing energy efficiency while concurrently optimizing the performance of Service Function Chains (SFCs). Through a refined VM consolidation process and the utilization of a more sophisticated DRL method, this approach holds the promise of providing a significantly more efficient solution to VM consolidation challenges within SDN-enabled NFV environments.
Mikram et al. [18] discuss the significance of task scheduling and assignment in cloud computing due to the migration of applications from traditional environments. They emphasize the challenges of efficiently utilizing shared resources while ensuring quality of service and minimizing the carbon footprint. The paper underscores the importance of employing effective task strategies tailored to client requirements and IT resource capacities. Additionally, it highlights the relevance of optimizing resource utilization and task execution times. The article introduced optimization techniques such as artificial bee colony (ABC), cuckoo search (CS), and particle swarm optimization (PSO) for task distribution. The objective of the paper is to analyze these algorithms based on energy consumption and resource utilization.
Saadi et al. [19] focus on addressing the challenges of workload balancing and resource utilization in cloud scheduling to maximize the effectiveness and performance of cloud computing systems. Workload balancing ensures that computing workloads are evenly distributed across available resources, reducing the likelihood of resource constraints and enhancing system performance. Resource utilization aims to utilize processing power, memory, and network bandwidth to their fullest capacity, improving the efficacy and cost-effectiveness of the cloud infrastructure. To tackle these challenges, the study proposes a novel optimization technique called CHPSO (Chi-squared particle swarm optimization). The proposed algorithm demonstrates its effectiveness in optimizing resource utilization compared to other algorithms such as PSO (particle swarm optimization) and CS (cuckoo search).
Hilali et al. [20] emphasize the pivotal role of virtualization technology in cloud systems, which are among the fastest-growing energy consumers globally. Virtualization technology plays a critical role in resource management, offering solutions to various challenges in this area. Resource consolidation stands out as a widely used technique for developing more efficient resource management policies. Specifically, virtual machine packing enables cloud data centers to transition from one state to a more optimized state. The emergence of container-based cloud and containerized workloads has further expanded consolidation opportunities. In their article, the authors focus on the consolidation of data centers within distributed cloud systems. They provide a comprehensive overview of IT consolidation across different levels of cloud services, including virtualized data centers and consolidation techniques. Additionally, they offer a thematic taxonomy and discuss consolidation solutions from the literature. The article concludes with a discussion of research questions and proposed future directions in the field, highlighting their importance.
Gholipour et al. [21] address the growing demand for computational and storage resources due to the increasing volume of computation and big data analysis. While purchasing additional resources can be costly, cloud computing offers a solution through its “pay as you go” plans, allowing users to pay only for the resources they utilize. However, leveraging cloud technology presents challenges, particularly in resource management. Resource management focuses on allocating resources to users efficiently, minimizing waste. In their paper, the authors propose a novel energy-aware resource management technique. This approach combines joint virtual machine (VM) and container consolidation methods with the deep Q-learning algorithm to promote green computing in cloud data centers. The aim is to reduce resource waste, migration rates, and energy consumption through optimized resource allocation strategies.
Tran et al. [22] explore the challenges of efficiently managing virtual machines in cloud data centers to balance economic costs and ensure quality of service (QoS) while increasing end-user demands. They highlight the benefits of virtual machine migration, such as cost savings, energy efficiency, improved performance, stability, and availability. However, stakeholders’ objectives often conflict with each other, and the optimal resource allocation problem in cloud infrastructure is typically NP-hard or NP-complete. In their paper, the authors formulate the virtual migration problem using game theory to achieve both load balance and resource utilization. They propose the V2PQL algorithm, which integrates Markov decision processes and the Q-learning algorithm. Simulation results demonstrate the efficiency of their proposal, which consists of training and extraction phases. The V2PQL algorithm is benchmarked against other algorithms such as Round-Robin, inverse Ant System, Max–Min Ant System, and Ant System, highlighting its strength and feasibility in the extraction phase.
Yao Qin et al. [23] discuss the importance of multi-objective virtual machine (VM) placement in data centers for achieving various goals. While this is an NP-hard problem, numerous approaches have been proposed to address it. However, many existing methods overlook the selection of weights, which is crucial for multi-objective optimization. Poorly chosen weights can lead to solutions deviating from the Pareto optimal set. The authors propose a solution to this problem using the Chebyshev scalarization function in multi-objective reinforcement learning (RL). Their proposed VM placement algorithm, VMPMORL, leverages the Chebyshev scalarization function to find a Pareto approximate set that minimizes both energy consumption and resource wastage simultaneously. Unlike other multi-objective RL algorithms in VM placement, VMPMORL tackles the weight selection problem and utilizes the concept of the Pareto set. Comparative evaluations against state-of-the-art algorithms demonstrate that VMPMORL achieves superior performance.
The approaches outlined in the literature address various aspects of virtual machine (VM) consolidation and resource management, primarily focusing on energy efficiency, task scheduling, and load balancing. As summarized in the Table 1, most previous works (e.g., [18,19]) rely on heuristic or metaheuristic algorithms to optimize energy consumption. However, they often neglect other critical factors such as SLA compliance and VM sensitivity.

Table 1.
Comparison of related methods for VM consolidation according to RL/DRL adoption, energy optimization, SLA minimization, and VM sensitivity consideration.
Despite the emergence of reinforcement learning-based solutions in recent studies ([21,22,23]), these methods often overlook the heterogeneity and sensitivity of VMs. This oversight can result in suboptimal decisions, particularly for services that require high availability and performance guarantees.
In contrast, our proposed framework introduces a context-aware and adaptive architecture that effectively addresses these limitations. Initially, we utilize random forest (RF) and self-organizing maps (SOMs) to classify VMs according to their sensitivity levels. This classification step allows the system to differentiate between critical and non-critical workloads. Subsequently, we apply Deep Reinforcement Learning (DRL) for dynamic consolidation decisions, with its policy optimized by the Firefly algorithm to improve convergence speed and avoid local minima.
This integrated pipeline not only improves adaptability to workload variations but also strikes a better balance between energy consumption, SLA compliance, and service quality. By reducing unnecessary migrations and accurately identifying VM importance, our approach ensures more efficient resource management compared to previous work.
4. System Model
4.1. Power Model and QoS Metrics
4.1.1. Power Model
In our system model, a data center is defined as a collection of physical machines (PMs). Each PM can host multiple VMs. The power model in a data center is determined by the CPU, memory, storage, and cooling system, which primarily govern the energy consumption of a server. Numerous studies [24] have shown that server energy consumption is defined as a linear relationship to its CPU utilization:
where
- ▪
- represents the energy consumed by a fully utilized server.
- ▪
- represents the average consumption by an idle server.
- ▪
- represents the CPU utilization.
Since CPU utilization can fluctuate over time due to workload variability, it is treated as a time-dependent function, denoted as . Therefore, to estimate a server’s total energy consumption, the following formula is used:
4.1.2. QoS Metrics
A service level agreement (SLA) is a contract between an IT service provider and a customer or client that outlines the services to be provided and the expected quality of service. In cloud computing, SLA breaches occur when the service provider fails to meet the agreed-upon terms. SLAs are critical as they establish specific security standards for managing and storing data. To ensure compliance with the SLA, certain quality indicators must be clearly defined, measured, analyzed, and regularly monitored. If the service provider fails to fulfill their obligations, penalties may be applied. SLAs are typically used to define quality of service criteria, which are essential in cloud computing, and may include limitations such as maximum response time or minimum throughput time provided by the deployed system. In [25], the authors defined SLA violation using two metrics in the IaaS model: and PDM.
(SLA violation time per active host): Represents the percentage of time in which servers experienced 100% CPU utilization. The function is shown in the equation below:
where is the number of physical machines (i.e., servers), is the total time of experiencing 100% CPU utilization by server , resulting in an SLA violation, and is the total time of server being in the active state.
PDM: The overall performance degradation by virtual machines due to live migrations (PDM) is shown in the equation below:
where is the number of virtual machines, is the estimate of performance degradation of virtual machine caused by migrations, and is the total CPU capacity requested by the virtual machine j during its life time. We set as 10% of CPU utilization in MIPS during all live migrations of virtual machine . We used the combined metric involving performance degradation due both to overloaded servers and to VM migrations. (SLA violation) is computed as follows.
4.1.3. Live Migration Cost
Hot migration negatively affects the performance of applications running within a virtual machine. An experimental study was conducted to investigate the extent of this impact and to develop a modeling approach. It was found that performance degradation and downtime depend on the application’s behavior, particularly how many memory pages are updated during its execution. For web applications, the average performance degradation and downtime are estimated to be around 10% of CPU utilization. This suggests that each migration could lead to an SLA violation. Therefore, it is crucial to minimize the number of virtual machine migrations. The duration of a hot migration depends on the total memory used by the virtual machine and the available network bandwidth. In our experiments, we define the performance degradation experienced by the VM using the following formulas.
where is the time required to complete the migration, is the amount of memory used by Bi is the available network bandwidth, is the total performance degradation by , is the time when the migration begins, and is the CPU utilization by .
4.2. The VM Classifier
4.2.1. Dataset Description
To apply machine or deep learning techniques effectively, data are essential, but they are not enough. Data must be in a specific format and filtered to retain only those features relevant to the end goal. Obtaining workload-tracking data in the cloud is a complex task due to their pertinence and customer confidentiality concerns. Microsoft Azure virtual machine traces, released in October 2017, address precisely this need by providing relevant data. For this reason, it was decided to work with the 2019 workflow traces, which contain up-to-date data [26].
Microsoft Azure, also known as Windows Azure, is Microsoft’s public cloud computing platform. It provides a variety of cloud services, including computing, analytics, storage, and networking. These services allow users to develop, scale, or manage existing applications in the public cloud.
This section describes the Azure dataset, which represents traces from Azure’s virtual machines (VMs). These traces offer a representative sample of the workloads of Azure VMs in a specific geographic region.
The dataset used in this study spans 30 consecutive days and consists of 198 files, totaling 235 GB. These files include the following:
Format description files with key-value pairs (schema.csv, category.txt, cores.txt, cpu.txt, deployment.txt, lifetime.txt, memory.txt, deployments.csv, subscriptions.csv).
Time-series files (vm-cpu-readings-file-*-of-195.csv).
A summary file of the time-series data (vm-table.csv).
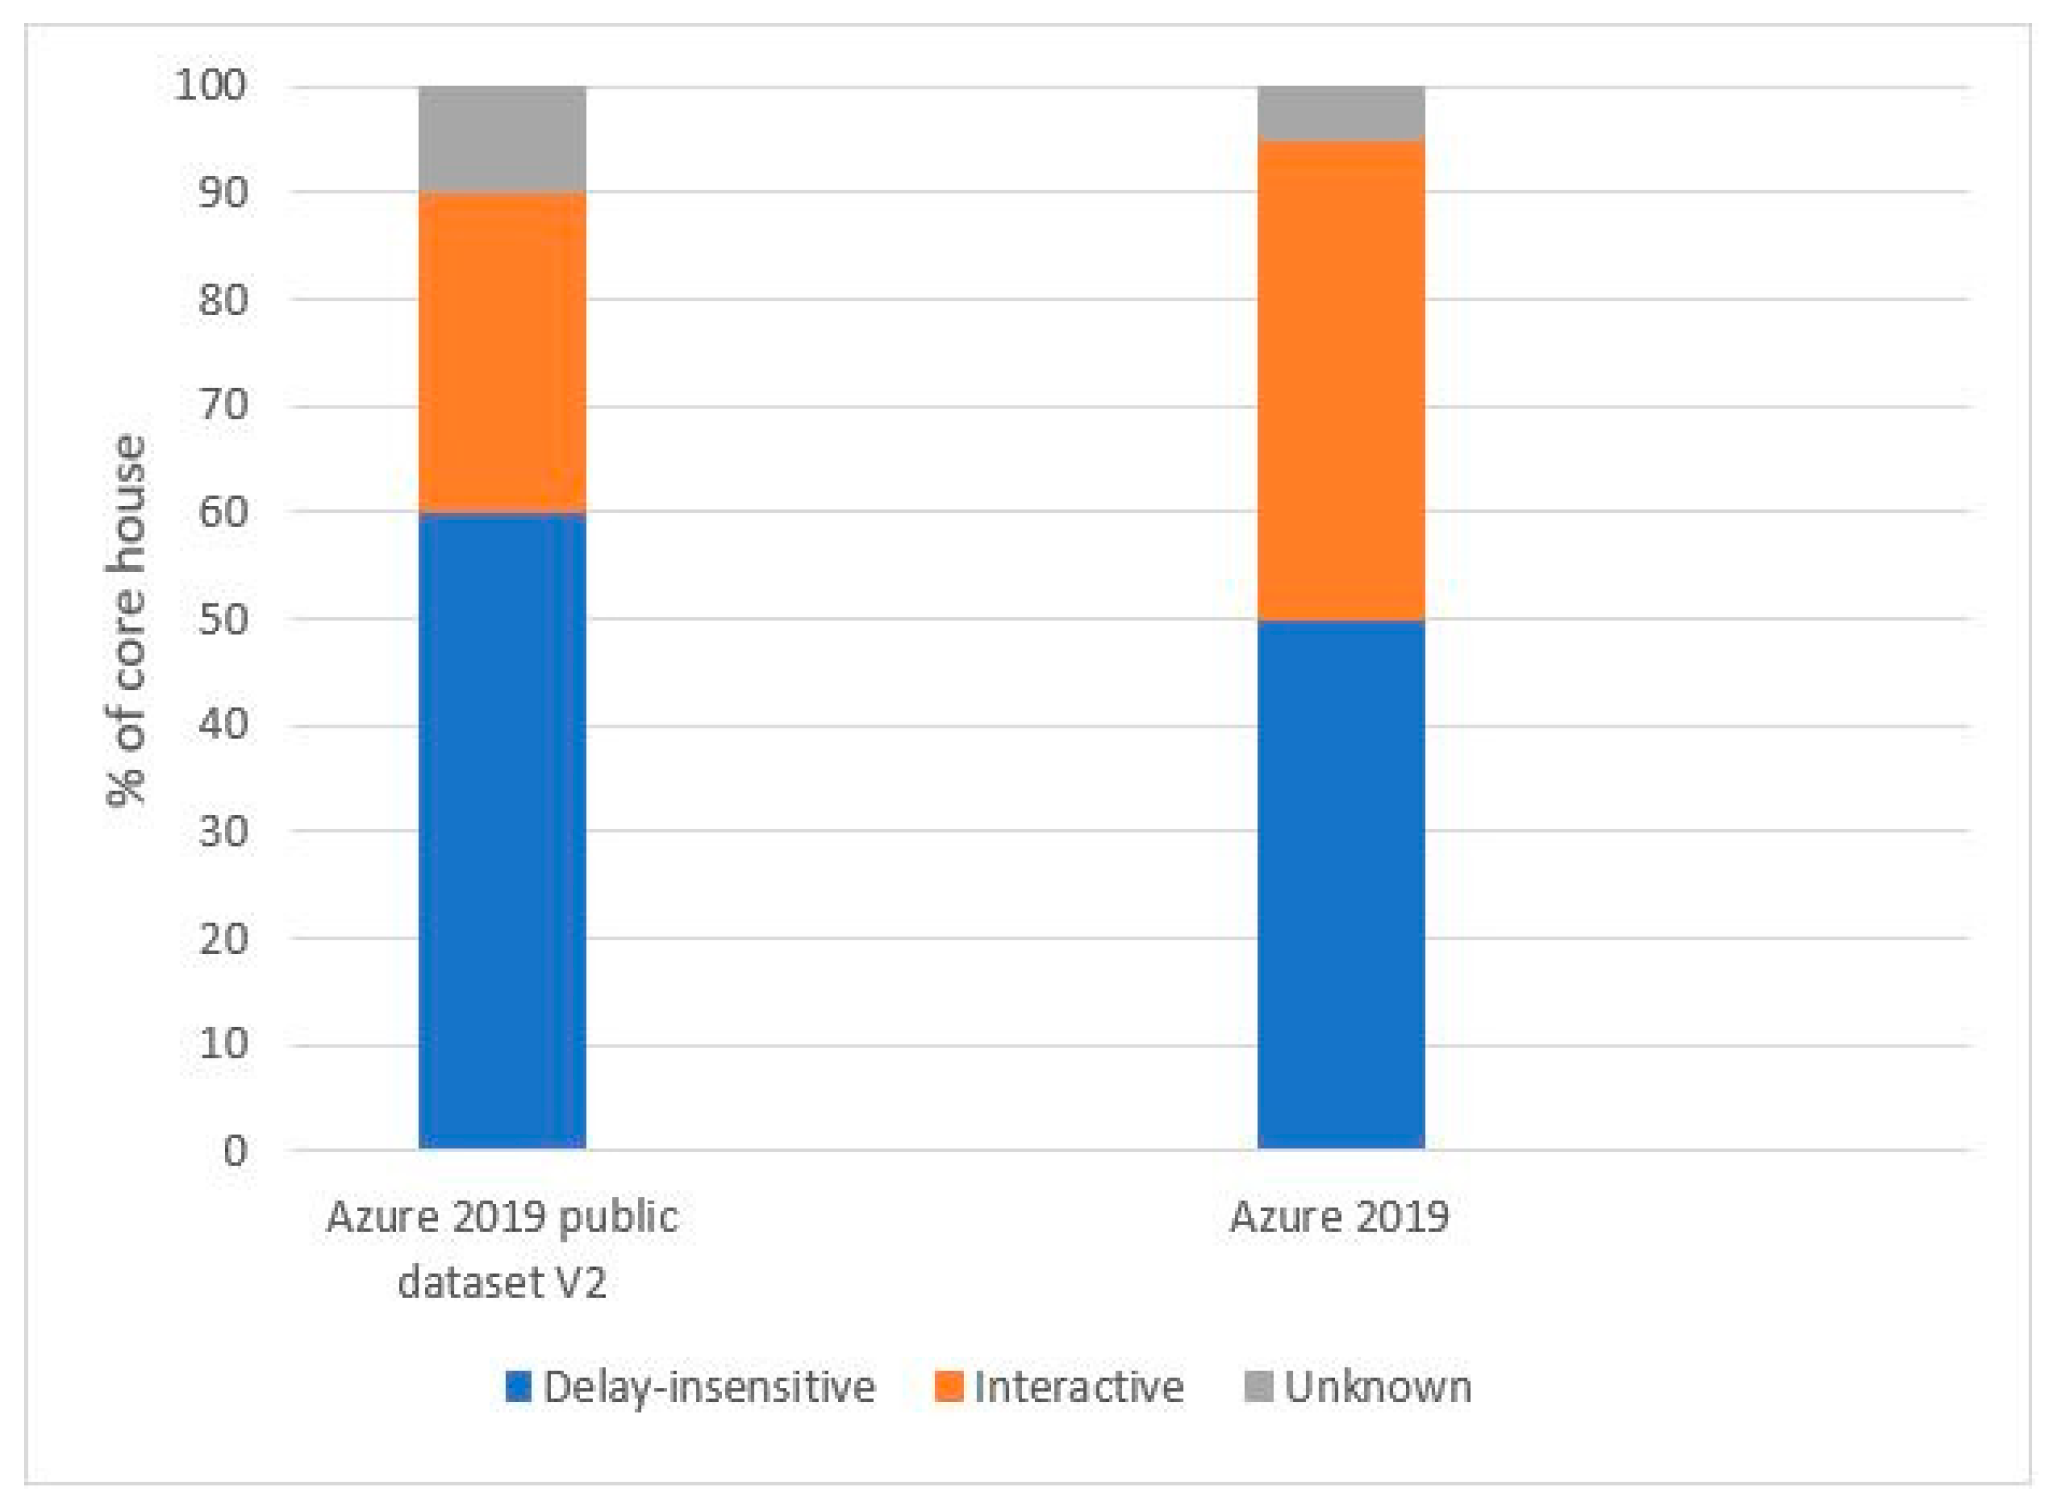
The traces represent a typical subset of the internal workloads of Azure VMs in a specific geographic region. Figure 1 illustrates a comparison of the VM rates by class in this trace against the overall Azure workload in 2019, highlighting their qualitative similarity. The next section provides a detailed description of each file.
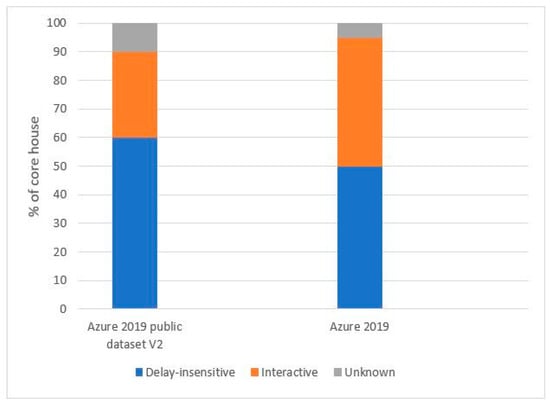
Figure 1.
Distribution of VM categories.
The vm-cpu-readings-*-of-195 file is a set of 195 files containing CPU usage traces for virtual machines (VMs) over a 30-day period. Each file contains 1,048,576 records, representing measurements taken every 5 min over a 20 min period. The difference between measurements recorded in two consecutive files (vm-cpu-readings-*-de-195) is 200 min. These files are structured in five columns, described in detail below:
- : A timestamp in seconds starting from 0, with an increment of 200 s (5 min).
- : The encrypted identifier of each virtual machine.
- : The minimum percentage of CPU usage.
- : The maximum percentage of CPU usage.
- : The average percentage of CPU usage.
Azure public dataset vmtable contains information on around 2,695,548 virtual machines, provided in the file vmtable.csv. Below is a summary of the dataset:
- 2,695,548 is the total number of virtual machines in the dataset.
- 6687 is the total number of subscriptions in the dataset.
In addition, other statistical data points are provided from this dataset. These details offer insights into the composition and characteristics of the Azure VMs in the specified dataset.
In our Q-learning module, we integrated a VM nature testing step during the VM migration phase, utilizing a classification model based on machine learning (random forest) combined with the self-organizing map (SOM) method. This model categorizes VMs into two types: sensitive and insensitive. A sensitive VM is defined as one whose performance—particularly response time and SLA compliance—is significantly affected by delays or interruptions during migration or placement. These typically include latency-critical applications such as real-time analytics or transactional databases. In contrast, insensitive VMs run background tasks or batch processes that can tolerate temporary disruptions. This classification was implemented using data from the Azure 2019 Vmtable file, enabling more intelligent and SLA-aware migration decisions based on the VMs’ sensitivity to load and performance variations.
In addition, our Q-learning module contains a dataset detailing the resource utilization of Azure VMs Data Trace. This dataset tracks the resource usage of approximately 1000 randomly chosen VMs over a 10-day timeframe from 2019. It is important to emphasize that VMs used in training the machine-learning module are not included in our approach. Below, we outline the data preparation procedure: We utilized the Azure vm-cpu-readings-file-of-195 files for our analysis. Since the dataset records measurements every 5 min for 20 min with a 200 min break, we iterated through the vm-cpu-readings-file-of-195 files to construct the day (comprising 288 measurements, each taken every 5 min), and we used the average value as the metric. Table 2 provides a clear description of the dataset used in this study.
Table 2.
Dataset description.
4.2.2. Proposed VM Classifier
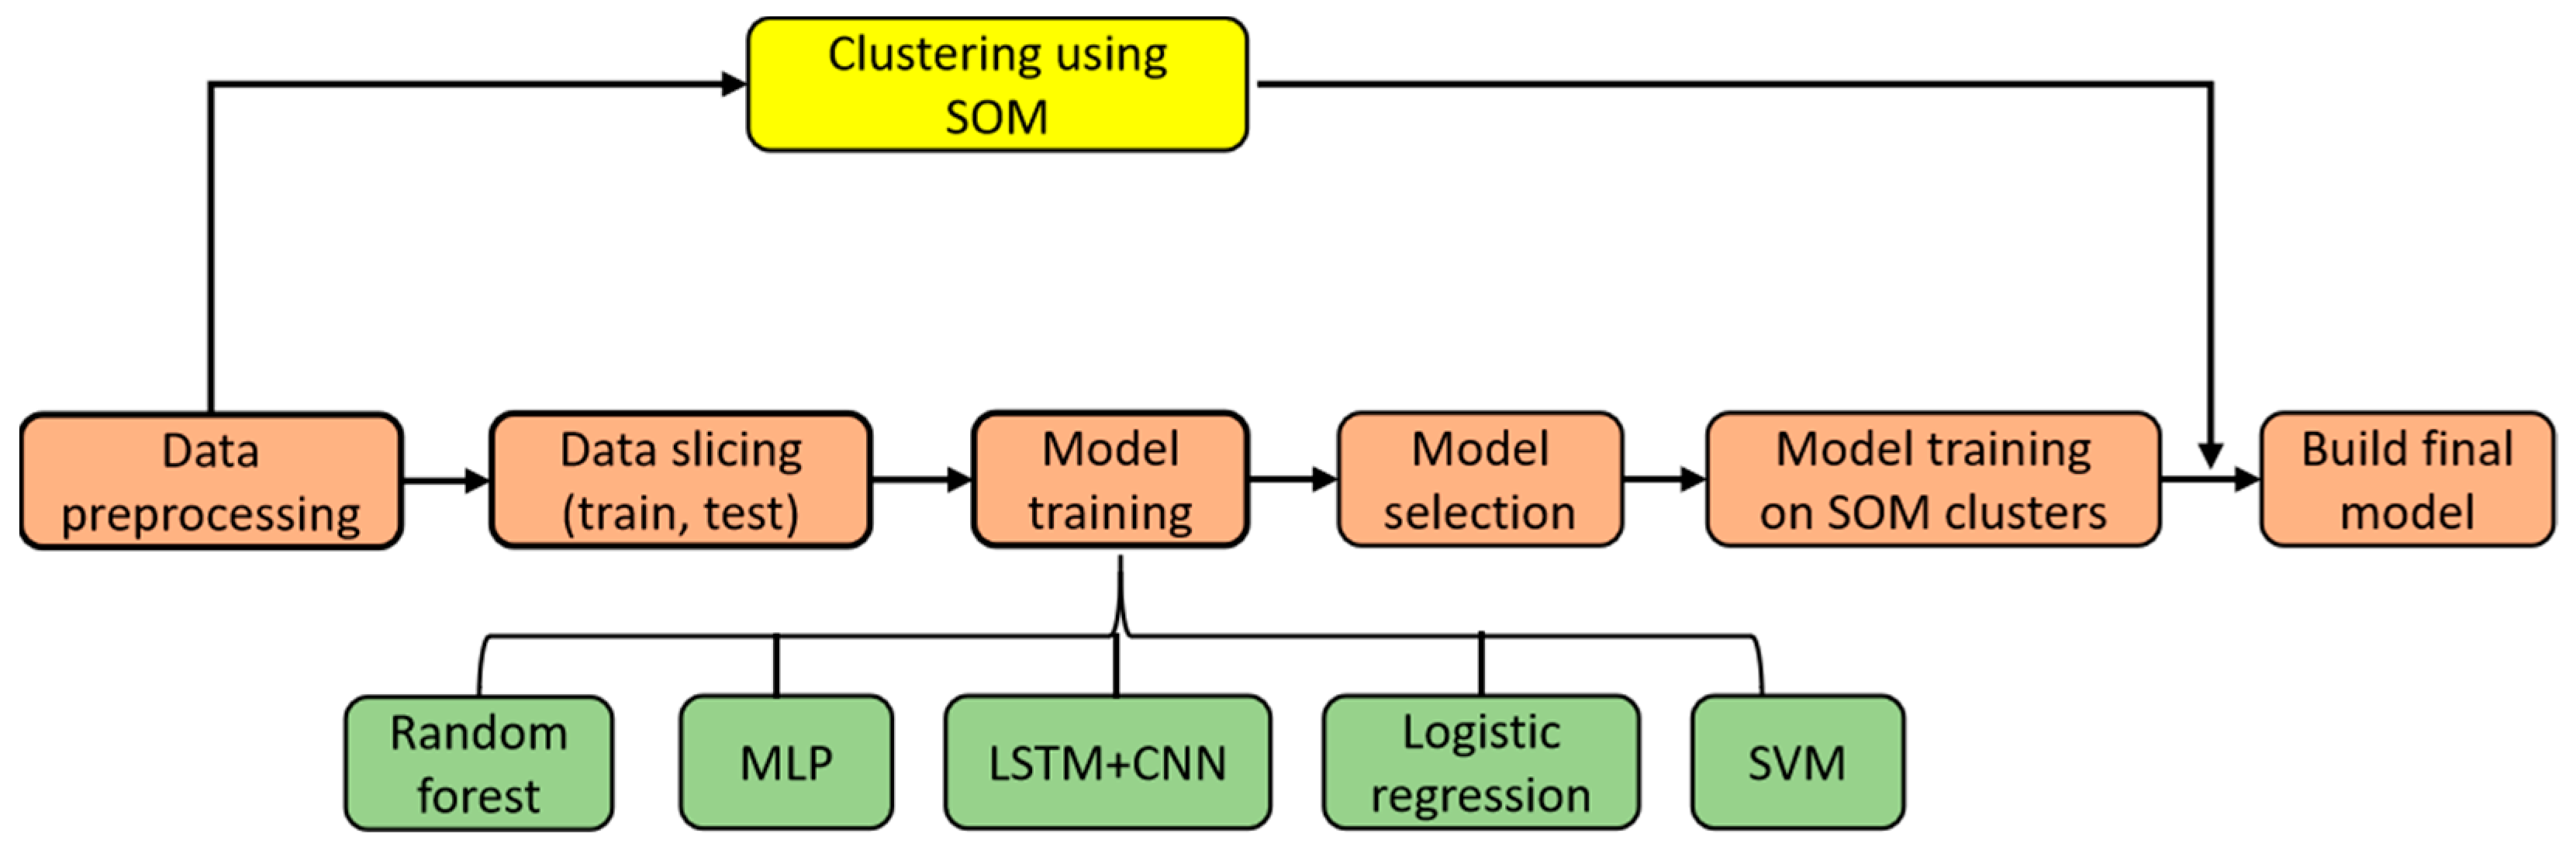
In our previous work [27], we developed a VM classifier model using machine learning techniques, specifically random forest (RF) and self-organizing maps (SOMs), as showed in Figure 2.
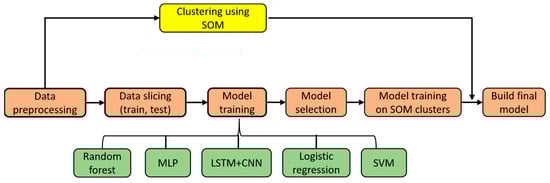
Figure 2.
Proposed VM classifier model.
This model categorizes VMs into two types: sensitive and insensitive. We utilized data from the Azure 2019 Vmtable file to implement this process, allowing us to make more informed migration decisions based on the VMs’ sensitivity to load and performance variation. Our random forest classification method combined with self-organizing maps (SOMs) produced excellent results, as shown in Table 3.
Table 3.
Classification results of the final model.
Acknowledging the imperative need for heightened classifier efficacy, we made the deliberate decision to integrate the SOM technique. This additional layer was intended to fine-tune our classification model, addressing any limitations observed in the initial performance of the employed model.
5. Proposed Reinforcement Learning-Based VM Placement in Cloud Environment Using RF_SOM Classifier
5.1. Reinforcement Learning Model
At time t, the agent observes the current state of all PMs, searches for an action using the Q-learning algorithm, and sends the decided action to the PM for execution. Each element of the state space S represents the current usage of CPU, RAM, network bandwidth, and storage I/O of each VM on each PM as follows.
where is the index id of the PM, is the number of PM in the data center, and , , , . Each resource utilization indicator is normalized with respect to the maximum volume of the corresponding PM resource. The action space is defined as a set:
Each action transitions the PM to sleep mode or active mode before the next management step . The dynamic VM consolidation algorithm changes the mode of each PM based on the agent’s decision. The agent then observes and computes the Q- value after modifying all operating modes and completing the action taken but before the next management step . The main objective of the proposed algorithm is to minimize energy consumption. The penalty for increased energy consumption can be defined as follows.
where the following are true:
- equals 0.01
- is the power consumption in the current management step.
- is the power consumption in the previous management step.
- means that, using of the (RF + SOM) model, the penalty for SLA violation can be represented by the number of sensitive VMs over the overall number of VMs.
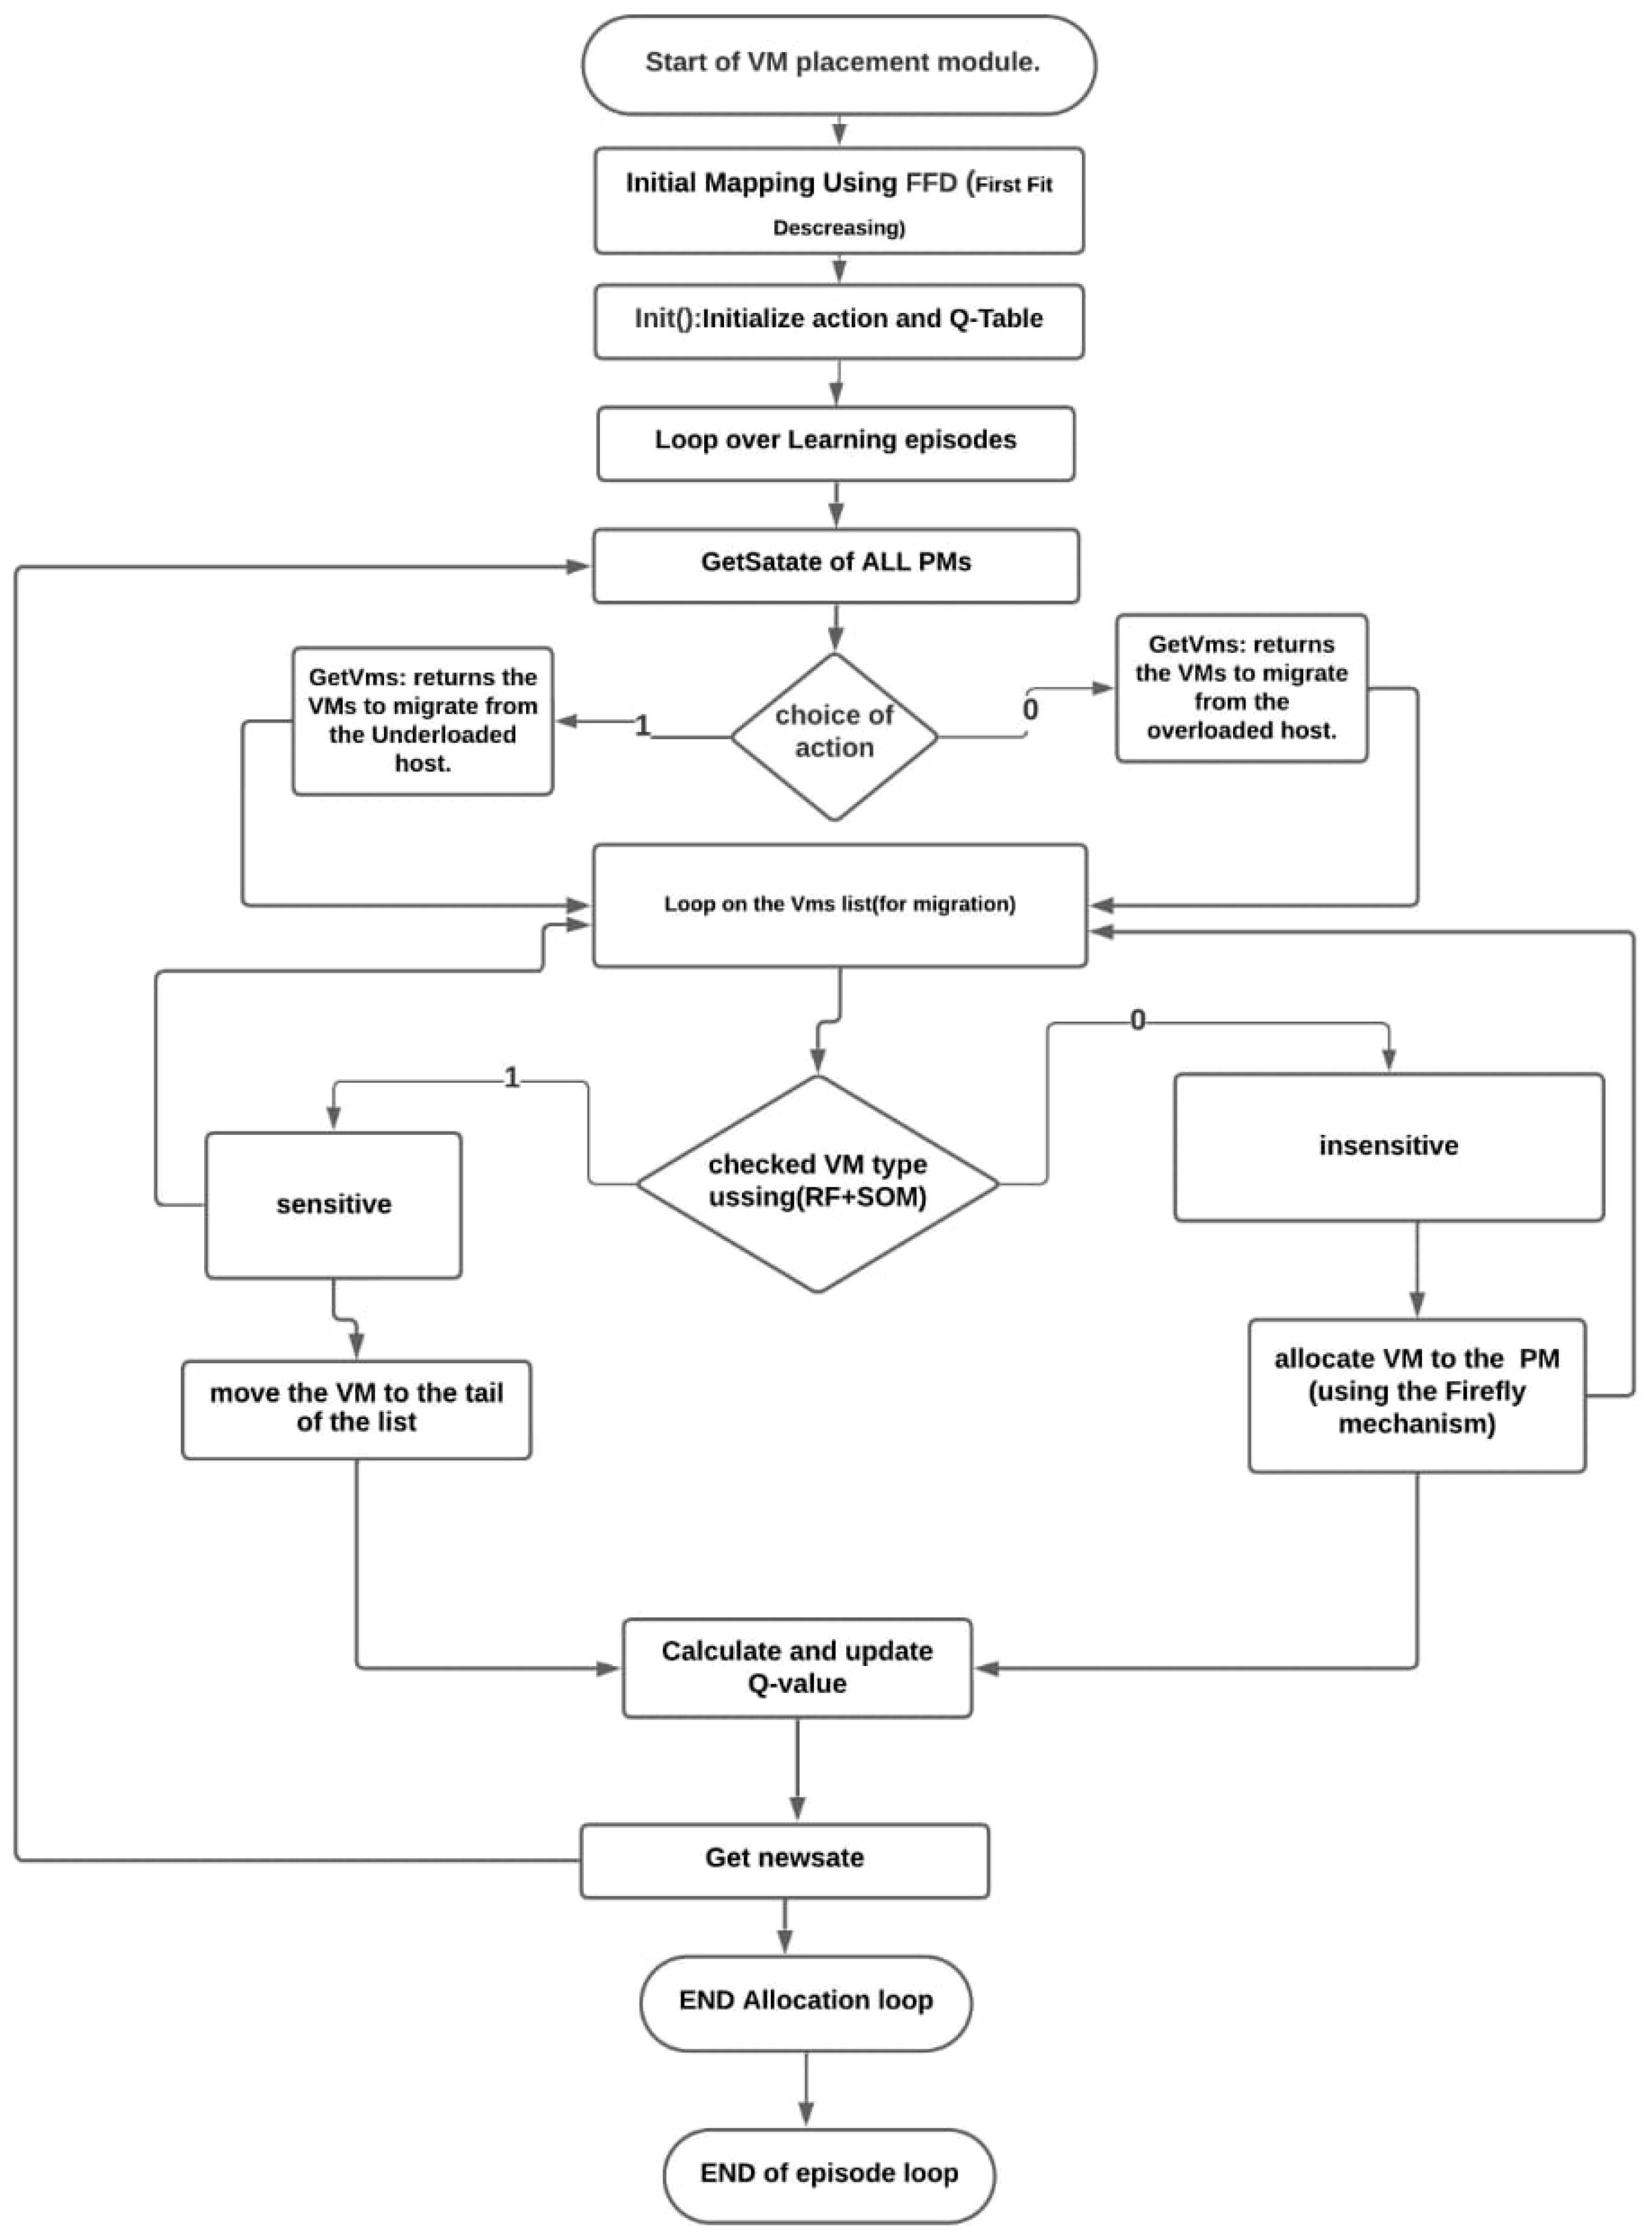
In this paper, we integrate multiple techniques—random forests (RF), self-organizing maps (SOMs), Q-learning, and the Firefly algorithm (FA)—to address the complex problem of energy-efficient VM placement and migration in cloud data centers. In Figure 3, we present the overall architecture of our hybrid approach, where each component plays a distinct role in achieving optimized resource management and SLA compliance. While this integration might appear complex at first glance, each component serves a specific role that enhances the overall system’s performance.

Figure 3.
Combined Q-learning–Firefly–VM classifier process.
RF and SOM are initially used to classify VMs based on their sensitivity to latency. This classification step improves the accuracy of the VM placement decision by distinguishing sensitive VMs from insensitive ones. This classification directly informs the Q-learning process, enabling it to adapt its policy based on VM sensitivity, thereby optimizing energy consumption while ensuring SLA compliance. The Q-learning model continuously adjusts the VM placement strategy based on real-time feedback, learning from previous placements to improve future decisions.
The Firefly algorithm is employed during the migration phase to find energy-efficient consolidation strategies, while taking into account VM sensitivity and SLA requirements. Unlike simpler heuristics such as first fit or best fit, the Firefly algorithm offers a more global search capability, effectively balancing exploration and exploitation to minimize energy consumption and migration costs while ensuring SLA adherence.
Regarding the computational overhead, we ensure that the training of RF and SOM is done offline, with the Q-learning model converging efficiently within about 200 episodes. Once trained, the RF/SOM classification and Q-learning policy application are fast, operating in the millisecond range. The Firefly algorithm’s migration phase, though computationally more intensive, is optimized to run within a reasonable time, with the migration overhead accounting for less than 5% of the total simulation time.
While the integration of these techniques adds complexity, we argue that this combination enables our approach to outperform baseline algorithms in terms of energy consumption, SLA violations, and VM migrations.
In Algorithm 1, we describe the process of allocating virtual machines using reinforcement learning, combining a Q-learning policy with the migration mechanism based on the Firefly algorithm.
| Algorithm 1: Reinforcement Learning for Vm Placement |
| 1: Input: (vmsToMigrate, excludedHosts) 2: Output: Label for any host 3: power = 0, powerLast = 0, newstate = 0, statindex = 0 4: firstFitDecreasing (vmsToMigrate, excludedHosts) ▷ Apply the initial mapping 5: init () ▷ Initialize action and Q-value 6: for episode in range (NUM_EPISODES) do 7: Restartstate () 8: for step in range (MAX_STEPS_PER_EPISODE) do 9: currentState = getState () 10: powlast = powerBeforconsumption(hostslist) 11: statindex = getStateIndex(currentState) 12: action = exploreExploit (statindex, episode) 13: if action == 0 then 14: vmslist = getVmsToMigrateFromOverHost(host) 15: FireflyAlgorithm(vmslist) 16: end if 17: if action is ==−1 then 18: vmslist = getVmsToMigrateFromUnderHost(host) 19: FireflyAlgorithm (Listevms) 20: end if 21: pow = PowerAfterconsumption(Hostslist) 22: updateQValue (statindex, action, pow, powlast, currentState, newstate) 23: currentState = newState 24: end for 25: end for |
5.2. VM Allocation with Firefly (FA)
The Firefly algorithm is a metaheuristic optimization algorithm inspired by the flashing behavior of fireflies. In this algorithm, fireflies are considered agents in the search space, and their blinking brightness is the objective function value, as shown in Algorithm 2. Fireflies are attracted to the brighter ones and move towards them in search of better solutions. This movement is governed by the attraction of other fireflies, which depends on their brightness and distance. As the algorithm progresses, the fireflies converge on the optimal solution, displaying swarm intelligence. The Firefly algorithm has been successfully applied to a variety of optimizing problems due to its simplicity, efficiency, and ability to handle complex search spaces. In our Firefly algorithm, we use the optimization equation [28].
where is the total number of PMs, represents the load of , and is the average load of all PMs.
| Algorithm 2: VM Allocation with Firefly using RF_SOM model |
| 1: Input: vmList, hostList 2: Output: Allocation of VMs 3: averageLoad←calculateAverageLoad(hostList) 4: for each vm in vmList do 5: Initialize bestHost←null and minLoadDiff←Double.MAX _VALUE 6: if vm is sensitive then ▷ Test with (RF + SOM) Model 7: for each host in hostList do 8: current Load←host.getLoad() 9: loadDiff←|currentLoad-averageLoad| 10: if loadDiff < minLoadDiff then 11: minLoadDiff←loadDiff 12: bestHost←host 13: end if 14: end for 15: else 16: vmList.add(vm) 17: continue 18: end if 19: end for |
5.3. Baseline Algorithms Form VM Placement
To validate our approach, we have opted for three basic algorithms for the placement of virtual machines. Below are brief descriptions of these algorithms.
5.3.1. Power Aware Best Fit Decreasing (PABFD) for VM Placement
The PABFD (power aware best fit decreasing) algorithm is a heuristic approach designed for the efficient placement of virtual machines in cloud computing environments, with the emphasis on minimizing energy consumption. The PABFD algorithm starts by sorting virtual machines in descending order according to their demand for resources such as CPU, memory and bandwidth. This ensures that the most demanding virtual machines are considered first, optimizing the use of available resources.
Once selected, each virtual machine is placed in the host with the lowest energy consumption, according to a “best fit” strategy. This approach not only improves energy efficiency but also maintains the performance and reliability of the cloud infrastructure.
The time complexity of the power aware best fit decreasing (PABFD) algorithm for VM placement can be analyzed by breaking down its primary steps:
Sorting VMs: sort the VMs in decreasing order based on their resource demands. If there are N VMs, the sorting step has a time complexity of .
Placement of VMs: place each VM into a physical host. Let M be the number of physical hosts. For each VM, the algorithm must check each host to determine the best fit, which involves evaluating the power consumption for each potential placement. This step has a time complexity of , as it involves iterating through all hosts for each VM.
Combining these two steps, the overall time complexity of the PABFD algorithm is In summary, the time complexity is .
The sorting step typically dominates when the number of hosts M is significantly smaller than the number of VMs n, but in scenarios where M is comparable to N, both terms contribute significantly to the complexity. The detailed steps of the PABFD algorithm are presented in the following Algorithm 3.
| Algorithm 3: PABFD for VM placement |
| 1: Input: vmLists, hostLists, nparticles, maxIter 2: Initialize particles randomly 3: for i = 1 to maxIter do 4: Evaluate energy consumption-based function for each particle based on vms and hosts 5: Update personal best positions for each particle 6: Update global best position 7: for each particle do 8: Update velocity and position based on personal and global best positions 9: end for 10: Return Best VM placement configuration found 11: end for |
5.3.2. Particle Swarm Optimization (PSO) for VM Placement
PSO (particle swarm optimization) is a computer optimization technology inspired by the social behavior of birds in flight or fish in schools. In PSO, a population of solution candidates, called particles, moves through the search space. Each individual particle adjusts its position according to its own experience and that of neighboring particles. To adapt PSO to this discrete optimization problem, we can use a binary representation in which each particle represents a possible assignment of virtual machines to hosts. The following steps outline the adaptation process.
Step 1 (particle initialization): The process starts by defining a specific number of particles for optimization. For each particle, we randomly generate an initial VM placement configuration in our CloudSim environment. Each configuration is represented by a list of maps, associating each VM with a host.
Step 2 (evaluation of solution quality): a special power consumption-based function to evaluate each VM placement configuration. This function, adapted to our CloudSim environment, is designed to measure the energy consumption of each configuration.
Step 3 (updating best positions): Each particle keeps in memory the best VM placement configuration found so far (personal best position), based on the results of the energy consumption-based function.
Step 4 (updating global best position): We find the best VM placement configuration among all the particles (best overall position), which ensures that our proposal comes close to the optimum solution in terms of minimizing energy consumption.
Step 5 (updating particle velocity and position): This step uses a power consumption-based function to evaluate each configuration. The velocity and position of each particle are then updated based on the personal best and global best positions, following the PSO update equations adapted to our CloudSim environment.
Step 6 (repeat steps 2 to 5 until convergence): We iterate the process of evaluation, using the standard PSO update equations, adapted to the discrete nature of VM placement in CloudSim.
Step 7 (obtaining the optimal solution): When the algorithm converges, the best VM placement configuration (i.e., the global best position) represents the optimal or near-optimal solution for minimizing energy consumption in our CloudSim environment, in accordance with our proposal.
The time complexity of the particle swarm optimization (PSO) algorithm is influenced by the number of particles (P), the number of dimensions (D), and the number of iterations (T). Each iteration involves evaluating the fitness function for each particle, updating their velocities and positions, and adjusting their personal and global bests. The time complexity per iteration is where F represents the cost of the fitness function evaluation. Thus, for T iterations, the overall time complexity is , which can often be approximated as if the fitness evaluation is the most computationally expensive operation. The detailed steps of the PSO-based VM placement algorithm are presented in Algorithm 4.
| Algorithm 4: PSO for VM placement |
| 1: Input: vmLists, hostLists, nparticles, maxIter 2: Initialize particles randomly 3: for i = 1 to maxIter do 4: Evaluate energy consumption-based function for each particle based on vms and hosts 5: Update personal best positions for each particle 6: Update global best position 7: for each particle do 8: Update velocity and position based on personal and global best positions 9: end for 10: Return Best VM placement configuration found 11: end for |
5.3.3. Genetic Algorithms (GAs) for VM Placement
Genetic algorithms (GAs) are a type of evolutionary algorithm inspired by the process of natural selection and genetics. They are used to solve optimization and search problems by mimicking the process of natural selection.
Initializing the population: We start by creating an initial population comprising individuals, each representing a potential solution to the VM placement problem. These individuals are characterized by a list of host identifiers for every VM, denoting feasible placement locations.
Evaluating the population: Subsequently, we evaluate each individual within the population using a designated fitness function. This function enables us to gauge the efficacy of each solution based on factors such as resource utilization and load balancing.
Selecting the best individuals: We proceed by identifying the highest-performing individuals, those exhibiting superior fitness values, for replication. Various selection strategies, including tournament selection or probability-based approaches, may be employed.
Crossing over selected individuals: Selected individuals are crossed over to produce new offspring to engender new offspring, thus amalgamating attributes from their parent individuals. Crossover mechanisms, such as single-point or two-point crossover, are employed for this process.
Mutating the new individuals: To foster genetic diversity, a small sub-set of the newly generated offspring undergoes mutation. This random mutation introduces diversity and helps avoid early convergence to suboptimal results.
Replacing the population: The new offspring subsequently supplant the existing population, helping the algorithm gradually improve its solutions. Only the most high-performing individuals are retained for each subsequent generation.
Choosing the best solution: After evaluating all the generations, we select the optimum solution from all the individuals. This solution defines the ideal placement of VMs on the available hosts.
Constructing the migration map: Based on the optimal solution, we build the migration map, associating each virtual machine with its assigned host.
Returning the migration map: In the end, we provide the migration map as the result of the genetic algorithm, offering an efficient and balanced VM placement strategy.
The time complexity of a genetic algorithm (GA) depends on the population size (P), the number of generations (G), and the complexity of the fitness function evaluation (F). Each generation involves evaluating the fitness of all individuals, which is followed by selection, crossover, and mutation operations, typically each. Therefore, the overall time complexity per generation is dominated by the fitness evaluation, making it . For G generations, the total time complexity of the GA is . This reflects that the primary computational cost arises from the repeated fitness evaluation across generations. The detailed steps of the GA-based VM placement algorithm are presented in Algorithm 5.
| Algorithm 5: GA for VM placement |
| 1: Inputs: vmsToMigrate, excludedHosts 2: Outputs: migrationMap 3: Initialize a population of populationSize individuals 4: for generation = 1 to maxGenerations do 5: Evaluate the population using a fitness function 6: Select the best individuals for reproduction 7: Cross over selected individuals to create new individuals 8: Mutate new individuals to introduce genetic diversity 9: Replace the population with the new individuals 10: end for 11: Choose the best individual from the population 12: Build migrationMap for the best solution 13: Return migrationMap |
6. Simulation Setup
We chose 10 random days in 2019 and used traces from over 1000 virtual machines. Usage measurements were recorded at 5 min intervals. The choice of these 10 random days and virtual machine traces was guided by technical considerations in order to align our calculations with CloudSim’s architecture [29]. The simulated cloud environment consists of a data center with 800 homogeneous host computers distributed over four models. The configurations of these servers, detailed in Table 4, are based on the specifications provided in [30].
Table 4.
Hosts’ specifications.
Furthermore, to implement the power model in CloudSim, the power consumption at different load levels is illustrated in Table 5 and is based on [30].
Table 5.
Power consumption (watts) at different load levels.
More than 1000 heterogeneous virtual machines were deployed in response to users’ requests. The characteristic of the VM types is shown in Table 6 and are based on Amazon EC2 [31]. All virtual machines are single core.
Table 6.
VMs’ specifications.
The initial allocation of virtual machines is based on the resource requirements defined by the virtual machine type. However, during their lifetime, virtual machines use fewer resources according to workload variation, which allows dynamic virtual machine consolidation. To conduct our experiments, we used real workload traces collected from Microsoft Azure nodes in 2019. The dataset includes CPU utilization data sampled every 5 min, covering randomly selected 10 days and involving more than 1000 virtual machines. The number of virtual machines used on each of the 10 days is summarized in Table 7.
Table 7.
Number of virtual machines per day.
7. Results and Discussion
In this study, we compare the proposed Q-learning–Firefly-based method’s three baseline algorithms: power aware best fit decreasing (PABFD), particle swarm optimization (PSO), and genetic algorithm (GA). These methods have been selected due to their prevalence in the literature and their role as standard baselines in the field of virtual machine (VM) consolidation and energy-aware resource management. PABFD serves as a classical heuristic benchmark [32], while PSO and GA represent benchmark model for metaheuristic algorithms. Although more recent techniques exist, these methods are still commonly adopted for performance comparison, providing a reliable reference for evaluating the effectiveness of our approach and the performance of the proposed Q-learning model combined with the Firefly algorithm. To ensure robustness in our evaluation, we considered two types of host behavior models: lr_1.2_mmt and iqr_1.5_mc as described in [33].
- IqrMc: Inter Quartile Range Maximum correlation. This method employs a VM allocation strategy based on the Inter Quartile Range (IQR) hotspot detection technique, combined with a policy that selects VMs with maximum correlation.
- LrMmt: Using a method derived from Cleveland (local regression), LrMmt identifies whether a host is over-utilized and whether its VMs need to be migrated. If a host is overused, LrMmt selects a VM that requires the least migration time, using the minimum migration time technique.
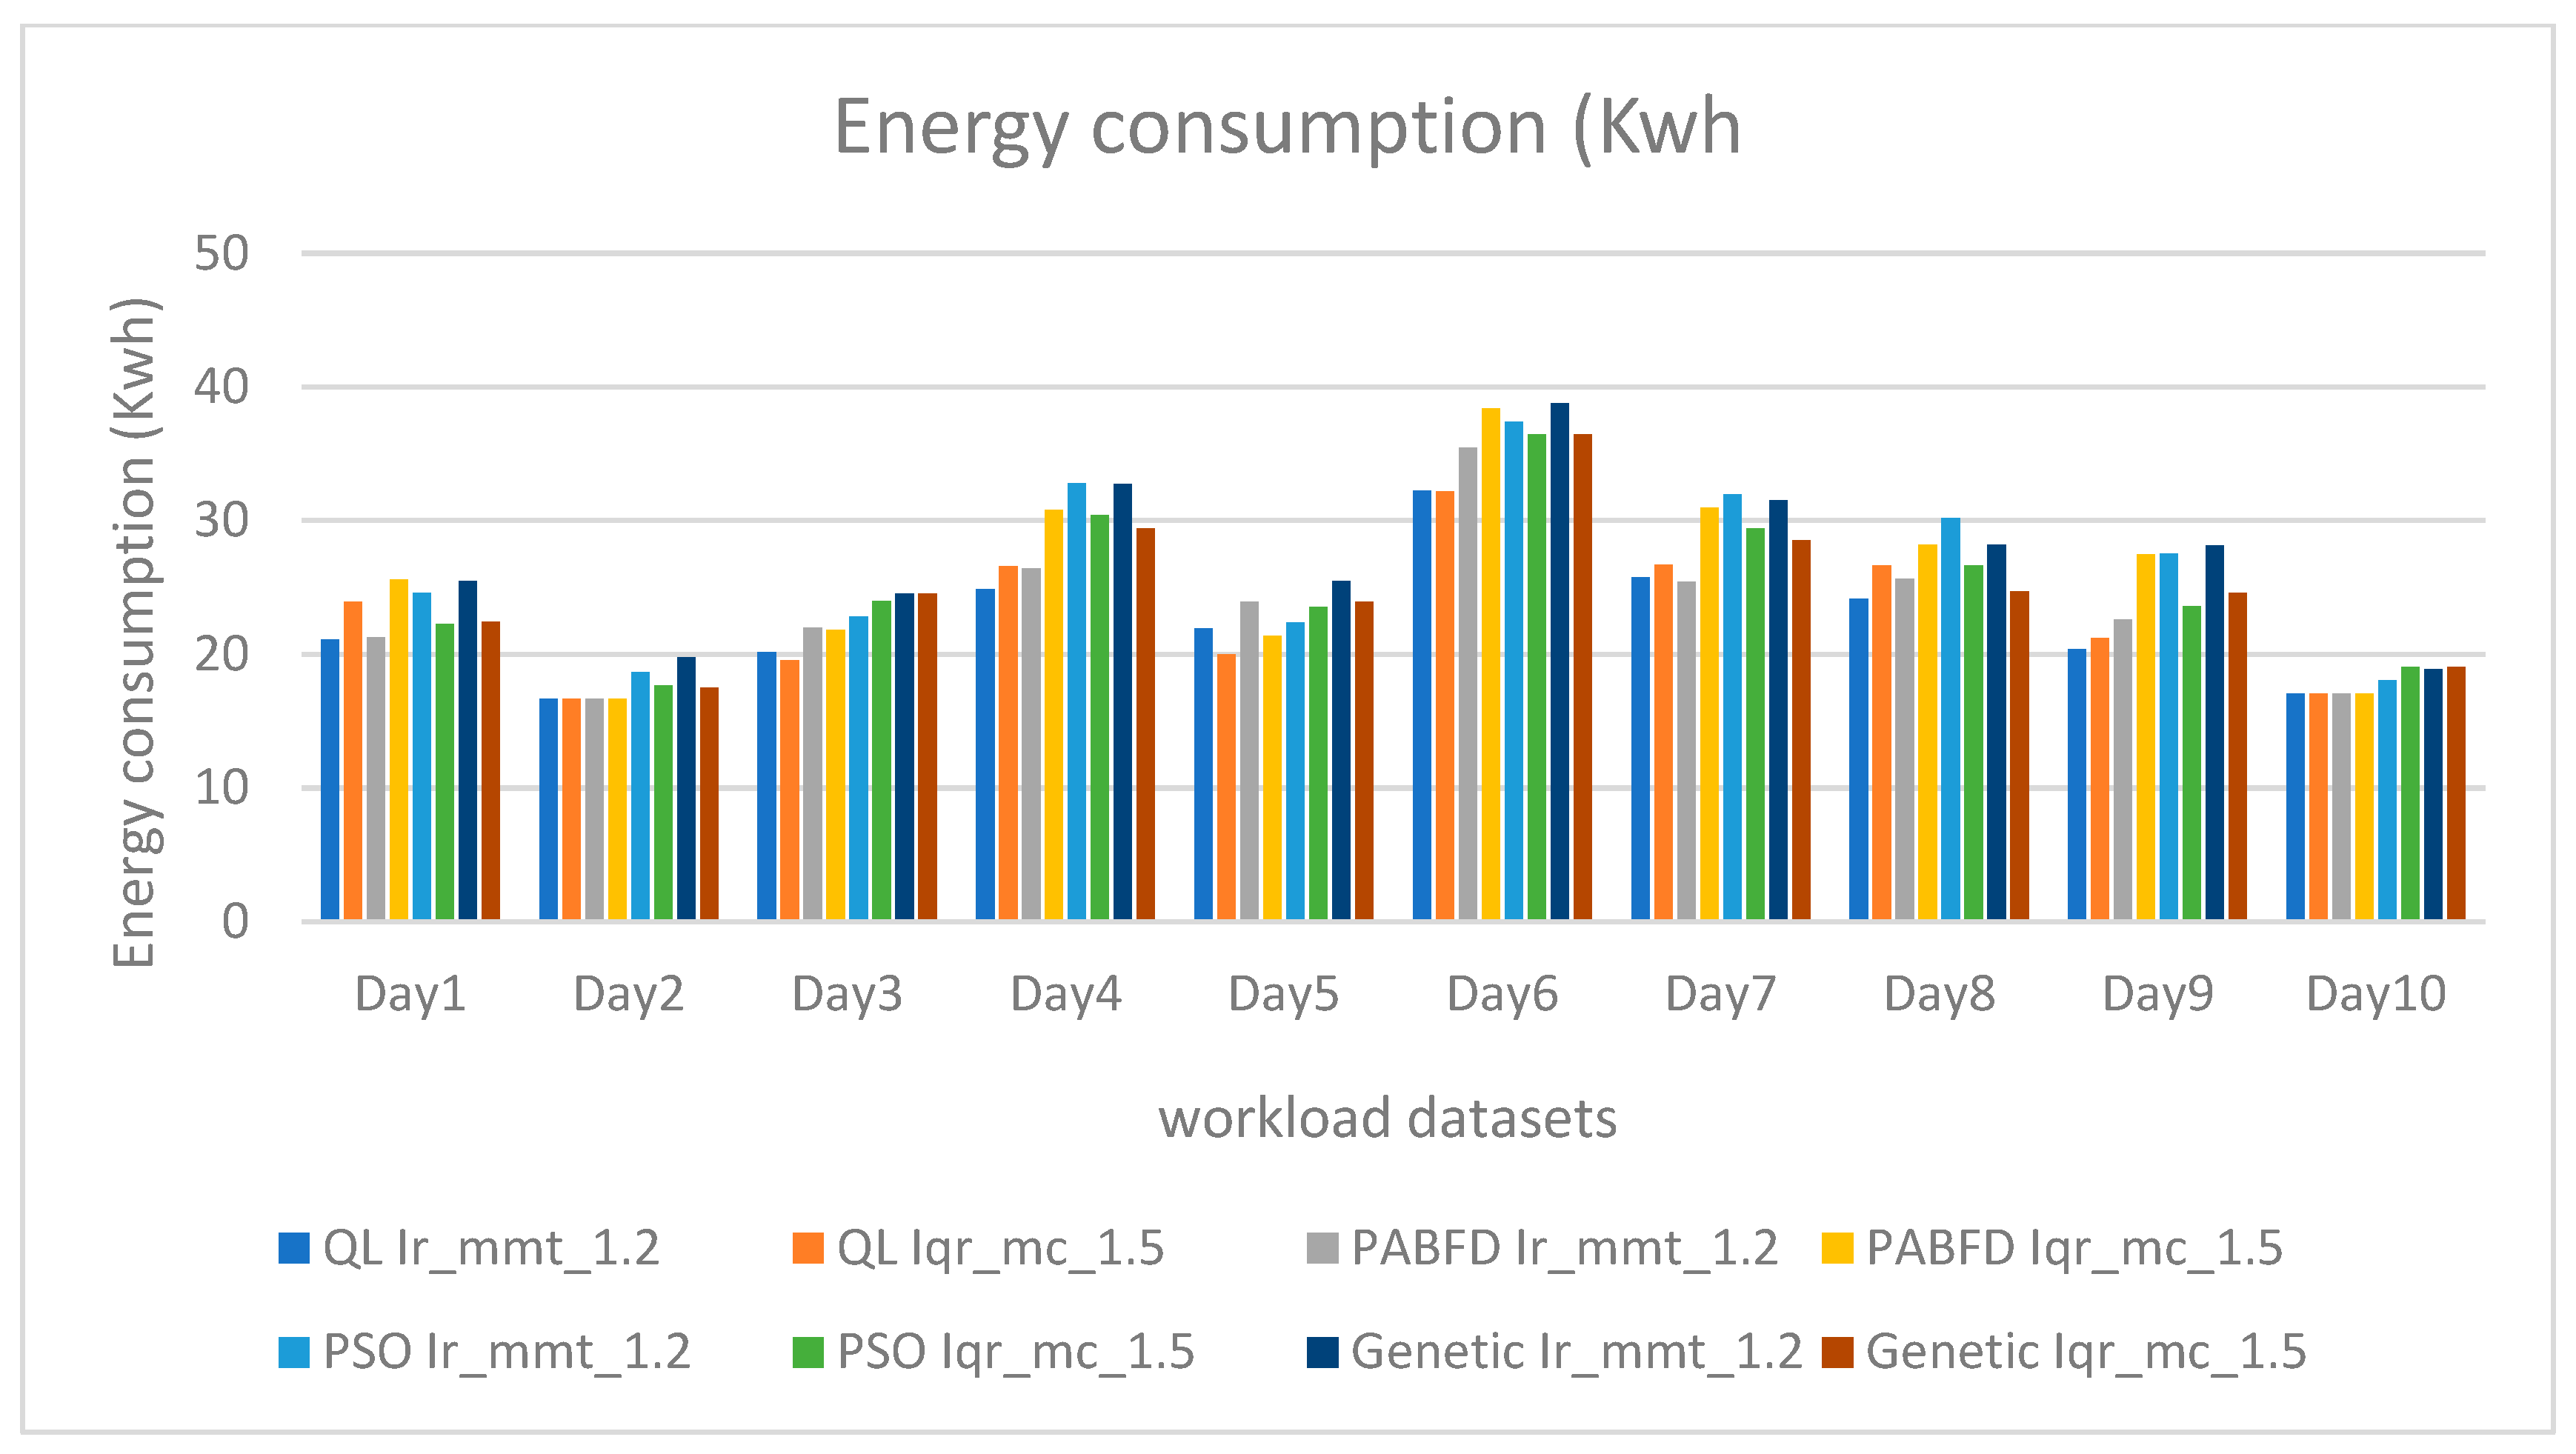
The Figure 4 illustrates that our model can significantly reduce energy consumption compared to both behaviors. Furthermore, stricter constraints positively impact energy consumption, enabling even greater energy savings.
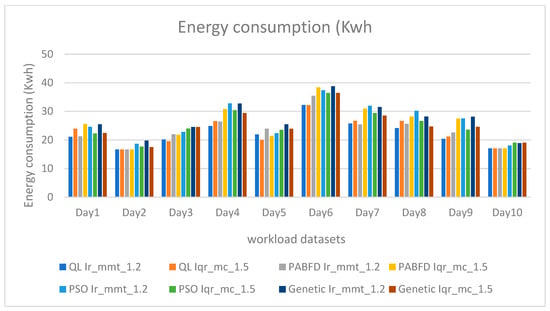
Figure 4.
Energy consumption (Kwh) under different workload datasets.
Upon analyzing Figure 4 and Figure 5, it becomes evident that leveraging VM placement through reinforcement learning with Firefly results in the lowest energy consumption among the examined methods. Specifically, under the Ir mmt 1,2 strategy, our model combining QL and Firefly achieves a reduction of 5.40% compared to PABFD, 12.80% compared to PSO, and 12% compared to genetic algorithms.
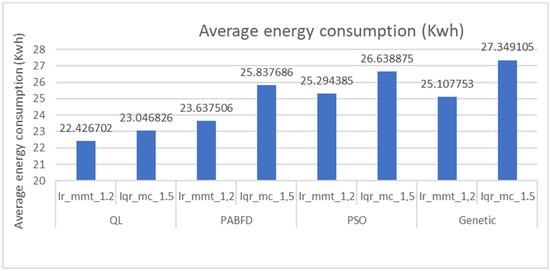
Figure 5.
Average energy consumption (Kwh).
Likewise, under the Iqr mc 1,5 strategy, our model achieves a reduction of 12.11% compared to PABFD, 15.60% compared to PSO, and 18.67% compared to genetic algorithms.
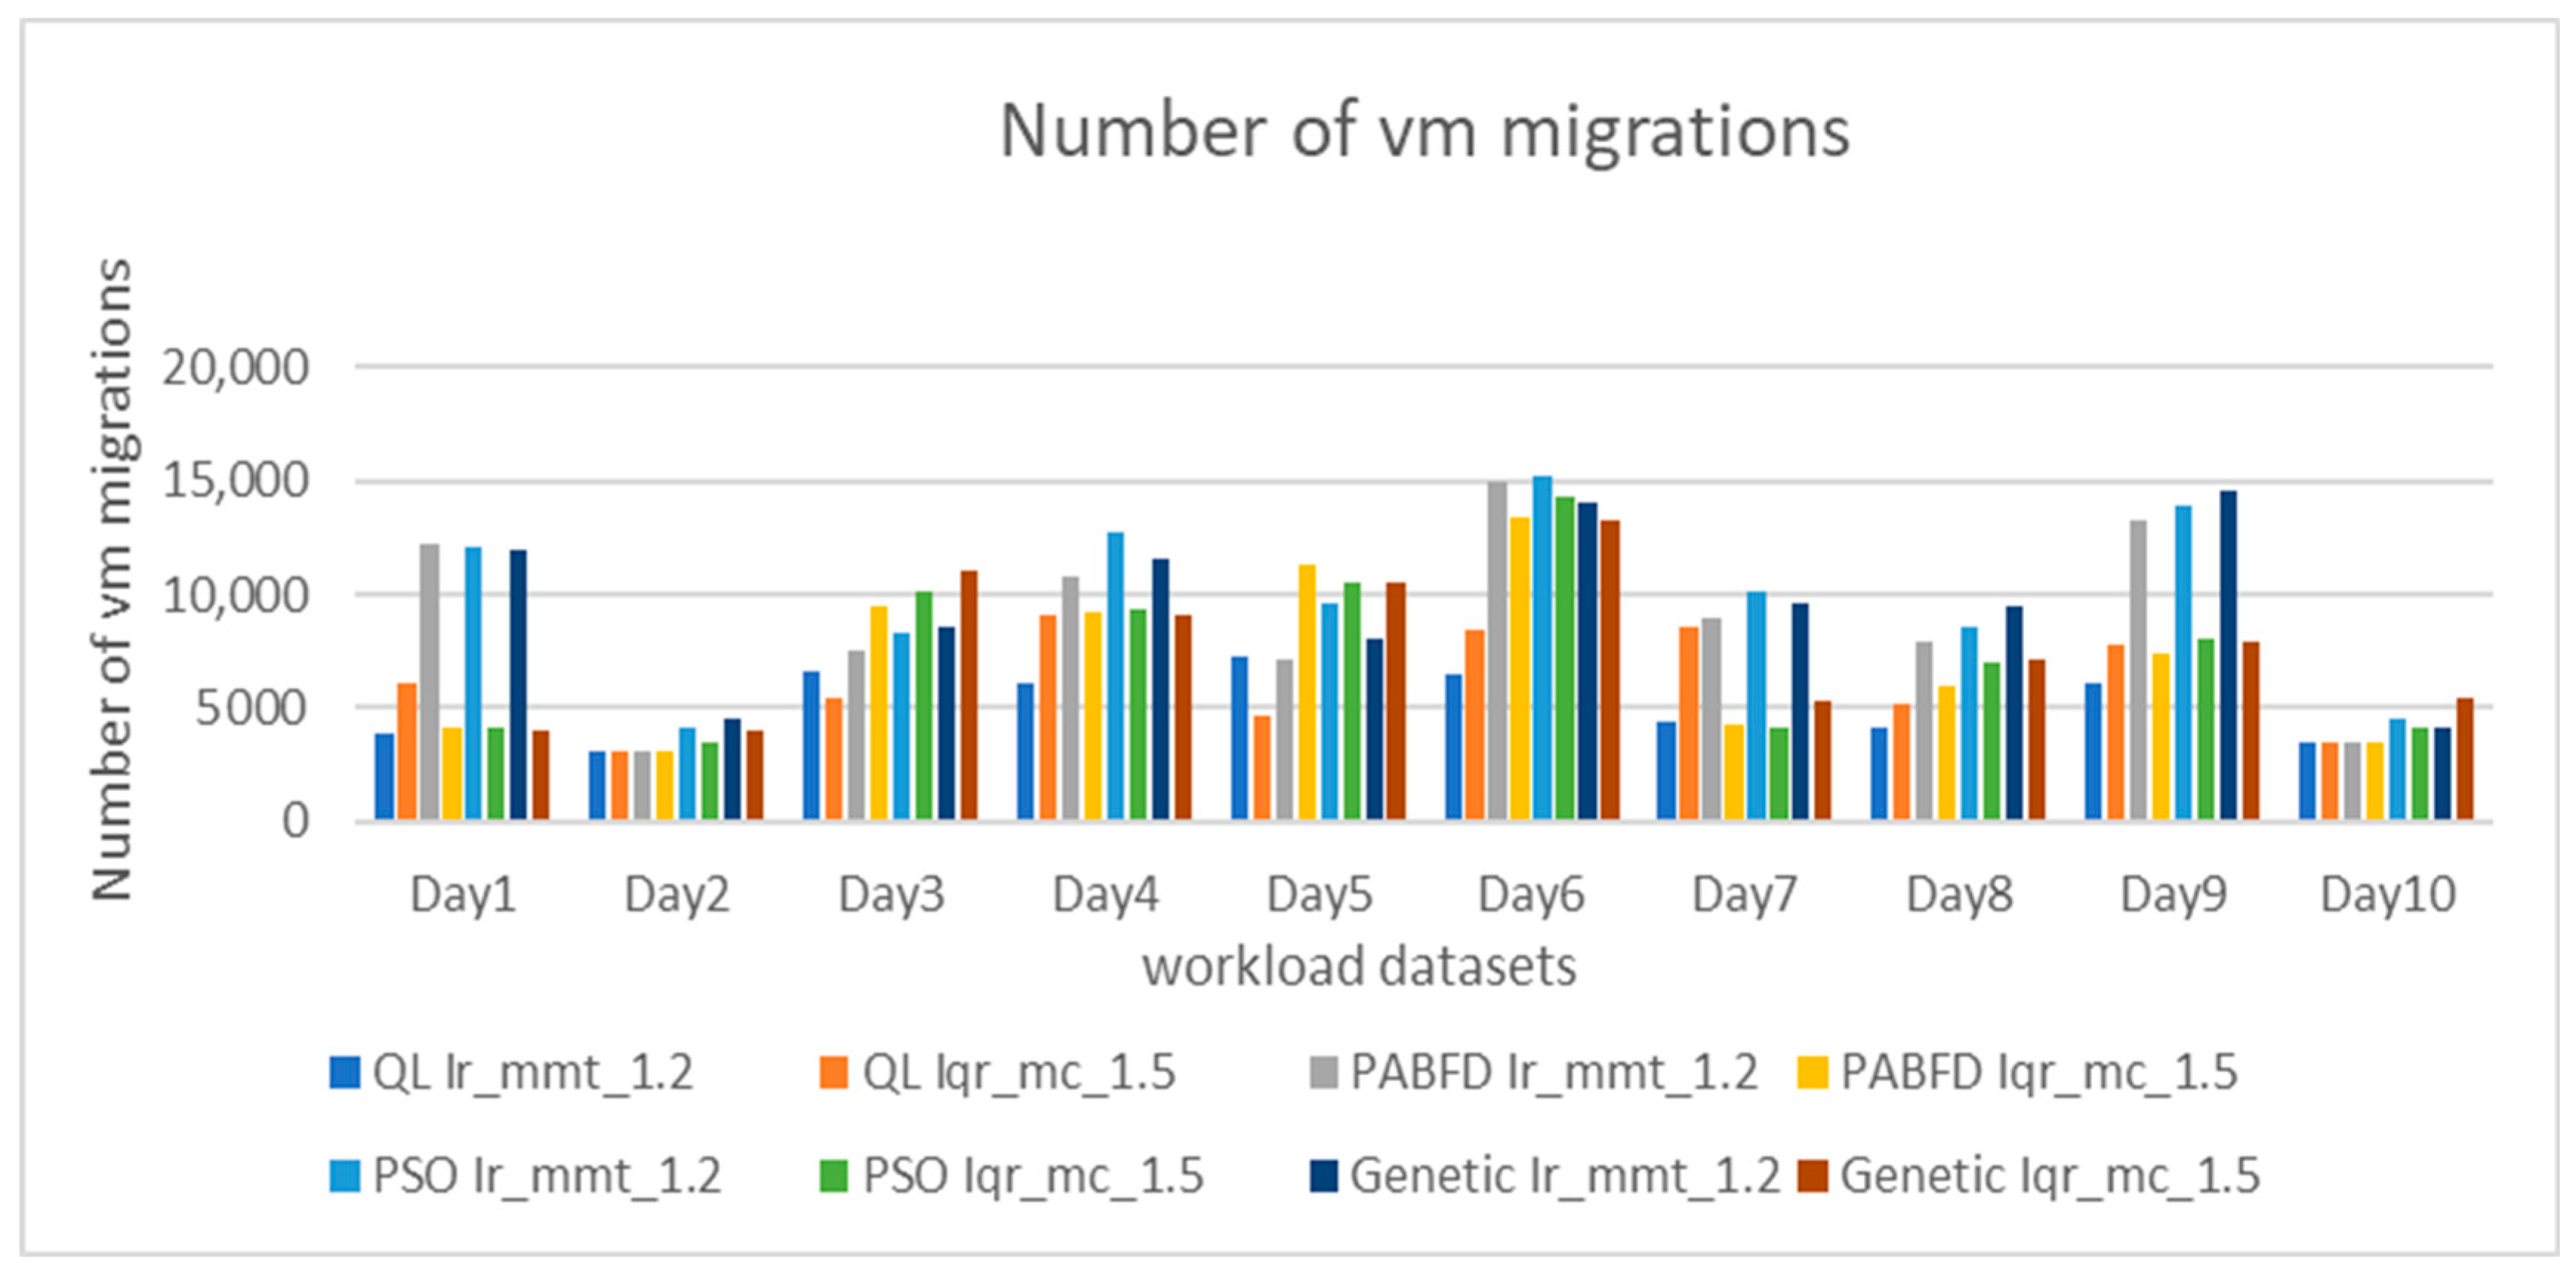
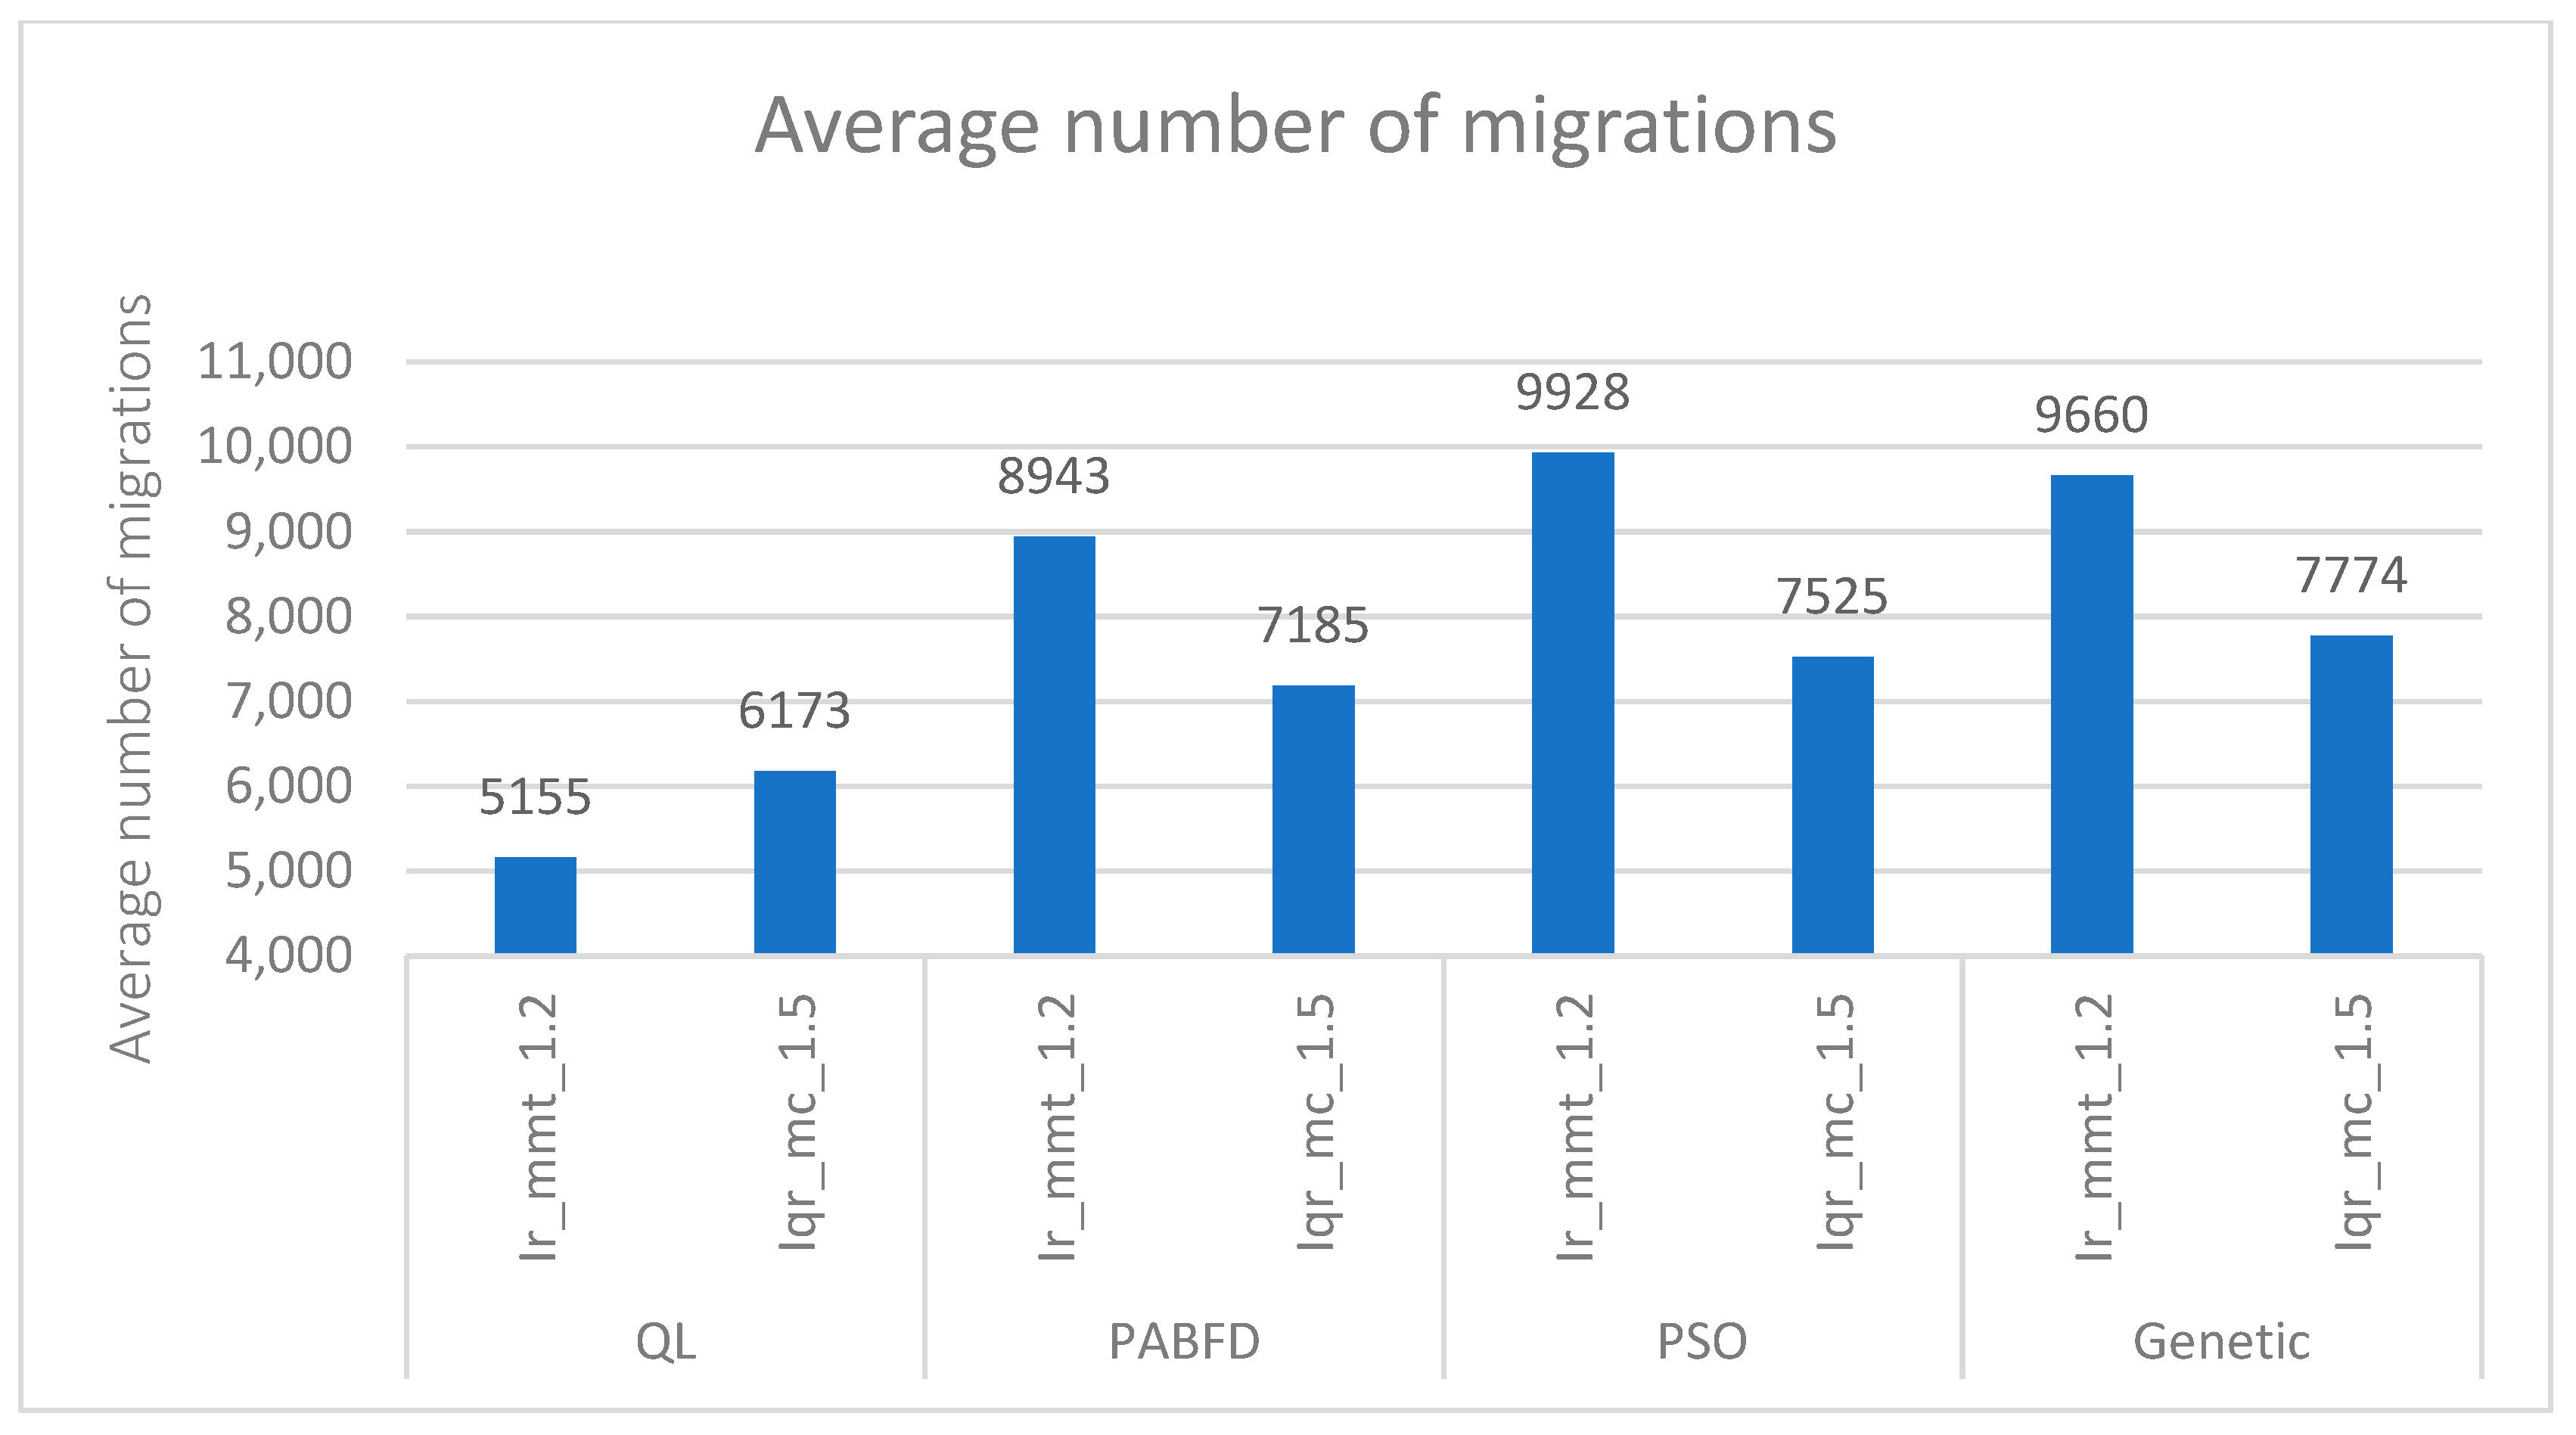
The number of live migrations remains a key factor affecting energy consumption and service level agreement (SLA) violations. Reducing this number can lessen the overall data center load, consequently reducing SLA breaches. As shown in Figure 6 and Figure 7, our approach achieves the fewest live migrations over the entire 10 days. Additionally, our VM selection policy (QL with Firefly) results in a smaller number of live migrations compared to other VM selection policies.
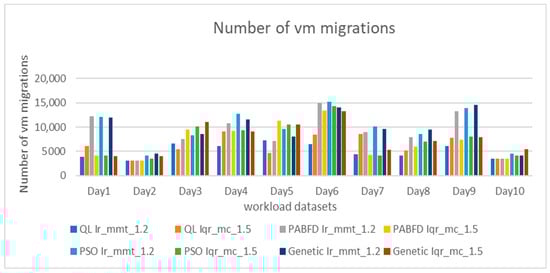
Figure 6.
Comparison of virtual machine migration counts under different loads.
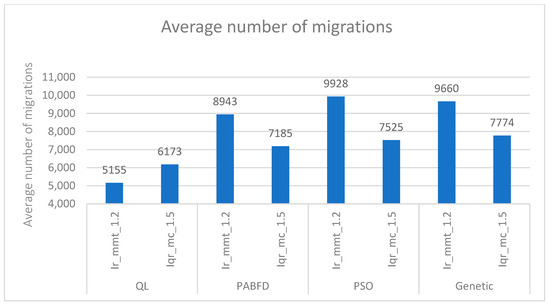
Figure 7.
Average number of migrations.
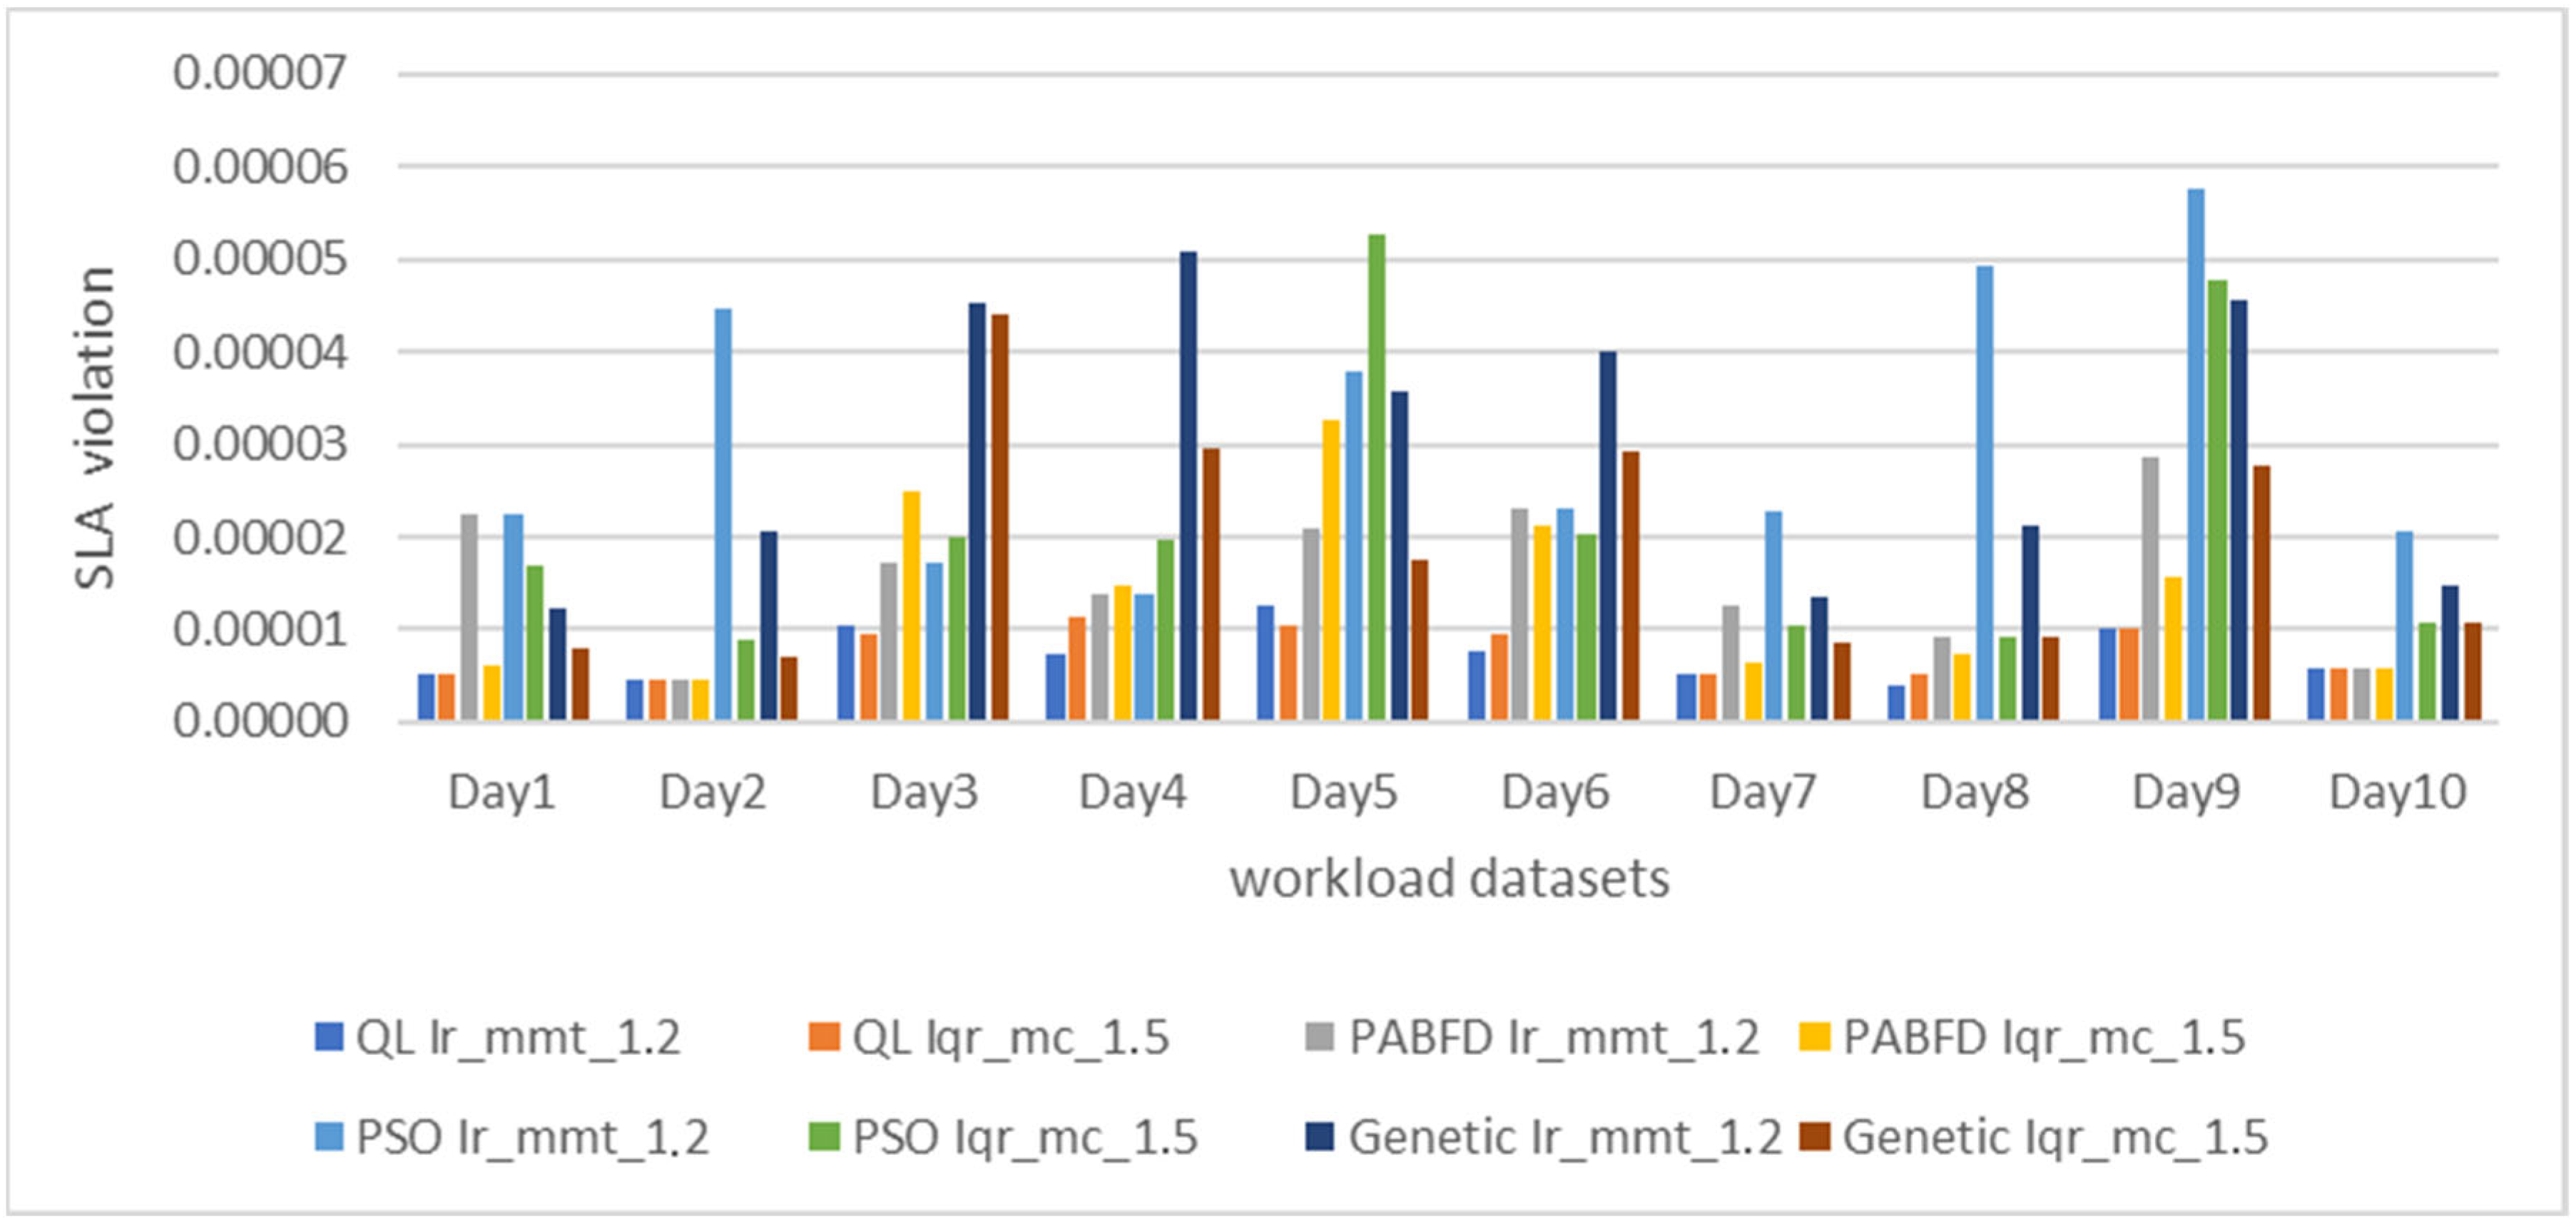
Figure 8 displays the percentage of service level agreement (SLA) violations. Our model surpasses other schemes in both iqr_1.5 mc and lr_1.2 mmt strategies, maintaining a consistently low value over the ten days. The SLA is upheld by QL with Firefly due to its lower migration count.
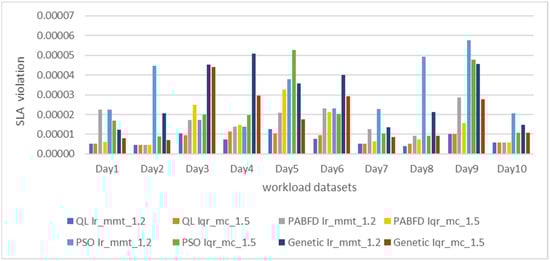
Figure 8.
SLA violation under different workload datasets.
To rigorously evaluate our approach, we conducted an in-depth statistical analysis of energy consumption over a 10-day simulation period. Table 8 summarizes several key descriptive metrics: mean, standard deviation, minimum, maximum, median, interquartile range (IQR), variance, and coefficient of variation (CV%).
Table 8.
Statistical analysis of energy consumption over 10-day simulation.
This analysis goes beyond a simple comparison of average results, offering a more comprehensive view of each method’s energy performance and robustness:
- The mean provides a general measure of energy efficiency.
- The standard deviation, variance, and CV% reveal how consistent and predictable the methods are across different workload conditions. A lower CV indicates more stable energy consumption, which is essential in real-world data center operations.
- The median and IQR give additional insight into the distribution of results, reducing the influence of occasional spikes or anomalies.
Among all the evaluated methods, QL_Ir_mmt_1_2 stands out with the lowest average consumption (22.43 kWh) and one of the most stable profiles (CV = 20.43%). This balance between efficiency and consistency highlights the strength of reinforcement learning (QL), which can dynamically adapt to changing workloads while maintaining steady energy usage. In contrast, traditional approaches such as GA and PSO not only consume more energy on average but also display higher variability (e.g., CV > 24%), suggesting a greater risk of inconsistent performance.
From a practical standpoint, these findings imply that using QL-based strategies could help cloud providers lower energy costs while improving service reliability. This marks a clear departure from conventional VM placement methods, which often depend on static or manually tuned heuristics that lack adaptability. By contrast, our RL-based approach offers a more autonomous and resilient solution—especially important in dynamic, real-world environments.
In summary, the statistical evidence not only confirms the quantitative benefits of our approach but also reinforces its practical value: methods that combine low average consumption with high stability reduce operational risks and improve cost efficiency, which is crucial for meeting service level agreements (SLAs) in modern cloud infrastructures.
Our model excels by effectively integrating reinforcement learning with the Firefly algorithm to optimize virtual machine (VM) placement. Leveraging Q-learning, our approach balances exploration and exploitation of VM placement configurations, dynamically adjusting decisions based on changing data center conditions. The Firefly algorithm complements this strategy by minimizing energy consumption through strategic configuration selection, which reduces VM migrations while maintaining high service levels. This combination enables our model to achieve superior performance in energy efficiency and SLA compliance compared to traditional approaches in data center management.
8. Conclusions and Future Work
Energy consumption is a persistent challenge in cloud data centers, which prompted us to develop an energy-sensitive management algorithm. Our approach focuses on optimizing virtual machine deployment to minimize the number of active physical machines, thereby reducing overall energy consumption in cloud environments. Leveraging reinforcement-learning techniques, our methodology aims to achieve significant energy savings, aligning with sustainable practices crucial to modern data center operations. Our research highlights the effectiveness of machine learning in achieving energy savings targets. Through rigorous experimentation and validation, we have demonstrated that reinforcement learning can adaptively optimize resource allocation, ensuring efficient use of IT resources while maintaining service level agreements (SLAs). This capability not only reduces operational costs but also contributes to environmental sustainability by reducing the carbon footprint associated with data center operations. In the future, our efforts will extend to optimizing thermal energy management and improving cooling systems in data centers. These advances are essential if we are to meet the multiple challenges posed by escalating energy demand and heat dissipation issues in cloud infrastructures. By delving deeper into these areas, we aim to develop innovative solutions that improve both the ecological footprint and operational efficiency of cloud computing environments.
In conclusion, our ongoing research seeks to advance the field of energy-efficient data center management through the integration of advanced machine learning techniques and sustainable infrastructure practices. By continuously refining our methodologies and exploring new avenues for improvement, we strive to contribute meaningfully to the long-term sustainability and performance optimization of cloud data centers worldwide.
In this study, we used the SLA_TAH metric to track hosts that experienced overload, as it is widely adopted in the literature and provides a straightforward indication based on CPU saturation. However, other factors such as memory usage, disk I/O, and network bandwidth can also contribute to host overload. In future work, we plan to adopt a more general and comprehensive metric that takes into account these multi-resource aspects, in order to better reflect the real performance state of cloud hosts and support more accurate and adaptive management decisions.
We also plan to broaden our research to include the optimization of thermal energy management and the enhancement of cooling systems within data centers. These initiatives are driven by the critical need to further address energy consumption challenges and enhance the overall efficiency of cloud computing infrastructure. By exploring these areas in depth, we aim to develop innovative solutions that not only reduce environmental impact but also bolster the sustainability and performance of data center operations. Additionally, we plan to test our approach on larger-scale simulations, potentially using tools like CloudSim Plus or iCanCloud. We are also exploring integration with real-time cloud orchestration frameworks to assess performance in production-like environments.
Author Contributions
A.A.: Conceptualization, Methodology, Software, Formal analysis, Writing-original draft, Visualization, Investigation, Data Curation. Y.S.: Conceptualization, Methodology, Supervision, Visualization, Investigation, Formal analysis, Writing—review & editing, Data Curation. S.E.K.: Conceptualization, Methodology, Visualization, Investigation, Project administration, Formal analysis, Writing—review & editing, Data Curation. All authors have read and agreed to the published version of the manuscript.
Funding
This research has no funding.
Data Availability Statement
Data is contained within the article.
Conflicts of Interest
The authors declare that they have no competing interests.
References
- Wen, J.; Chen, Z.; Jin, X.; Liu, X. Rise of the planet of serverless computing: A systematic review. ACM Trans. Softw. Eng. Methodol. 2023, 32, 1–61. [Google Scholar] [CrossRef]
- de Lima, E.C.; Rossi, F.D.; Luizelli, M.C.; Calheiros, R.N.; Lorenzon, A.F. A neural network framework for optimizing parallel computing in cloud servers. J. Syst. Archit. 2024, 150, 103131. [Google Scholar] [CrossRef]
- Lima, J. Data Centres of the World Will Consume 1/5 of Earth’s Power by 2025; Data Economy: London, UK, 2017. [Google Scholar]
- Buyya, R.; Ilager, S.; Arroba, P. Energy-efficiency and sustainability in new generation cloud computing: A vision and directions for integrated management of data centre resources and workloads. Softw. Pract. Exp. 2024, 54, 24–38. [Google Scholar] [CrossRef]
- Kotteswari, K.; Dhanaraj, R.K.; Balusamy, B.; Nayyar, A.; Sharma, A.K. EELB: An energy-efficient load balancing model for cloud environment using Markov decision process. Computing 2025, 107, 81. [Google Scholar] [CrossRef]
- Rasoulpour Shabestari, E.; Shameli-Sendi, A. An Intelligent VM Placement Method for Minimizing Energy Cost and Carbon Emission in Distributed Cloud Data Centers. J. Grid Comput. 2025, 23, 12. [Google Scholar] [CrossRef]
- Qazi, F.; Kwak, D.; Khan, F.G.; Ali, F.; Khan, S.U. Service Level Agreement in cloud computing: Taxonomy, prospects, and challenges. Internet Things 2024, 25, 101126. [Google Scholar] [CrossRef]
- Singh, J.; Walia, N.K. A Comprehensive Review of Cloud Computing Virtual Machine Consolidation. IEEE Access 2023, 11, 106190–106209. [Google Scholar] [CrossRef]
- Ma, Z.; Ma, D.; Lv, M.; Liu, Y. Virtual machine migration techniques for optimizing energy consumption in cloud data centers. IEEE Access 2023, 11, 86739–86753. [Google Scholar] [CrossRef]
- Rahmani, S.; Khajehvand, V.; Torabian, M. SPP: Stochastic process-based placement for VM consolidation in cloud environments. Computing 2025, 107, 43. [Google Scholar] [CrossRef]
- Yin, S. Random Forest-Based Load Prediction for Cloud Data Centers. In Proceedings of the 2024 IEEE 7th International Conference on Information Systems and Computer Aided Education (ICISCAE), Dalian, China, 27–29 September 2024; IEEE: New York, NY, USA, 2024; pp. 945–950. [Google Scholar]
- Peng, P. Predicting residential building cooling load with a machine learning random forest approach. Int. J. Interact. Des. Manuf. (IJIDeM) 2025, 19, 3421–3434. [Google Scholar] [CrossRef]
- Abdelaziz, A.; Santos, V.; Dias, M.S.; Mahmoud, A.N. A hybrid model of self-organizing map and deep learning with genetic algorithm for managing energy consumption in public buildings. J. Clean. Prod. 2024, 434, 140040. [Google Scholar] [CrossRef]
- Kumar, V.; Kumar, D. A systematic review on firefly algorithm: Past, present, and future. Arch. Comput. Methods Eng. 2021, 28, 3269–3291. [Google Scholar] [CrossRef]
- Qasim, M.; Sajid, M. An efficient IoT task scheduling algorithm in cloud environment using modified Firefly algorithm. Int. J. Inf. Technol. 2024, 17, 179–188. [Google Scholar] [CrossRef]
- Aghasi, A.; Jamshidi, K.; Bohlooli, A.; Javadi, B. A decentralized adaptation of model-free Q-learning for thermal-aware energy-efficient virtual machine placement in cloud data centers. Comput. Netw. 2023, 224, 109624. [Google Scholar] [CrossRef]
- Jeong, E.D.; Yoo, J.H.; Hong, J.W.K. Sdn lullaby: Vm consolidation for sdn using transformer-based deep reinforcement learning. In Proceedings of the 2023 19th International Conference on Network and Service Management (CNSM), Niagara Falls, ON, Canada, 30 October–2 November 2023; IEEE: New York, NY, USA, 2023; pp. 1–5. [Google Scholar]
- Mikram, H.; El Kafhali, S.; Saadi, Y. Metaheuristic Algorithms Based Server Consolidation for Tasks Scheduling in Cloud Computing Environment. In Proceedings of the International Conference on Artificial Intelligence and Computer Vision, Marrakesh, Morocco, 5–7 March 2023; Springer Nature: Cham, Switzerland, 2023; pp. 477–486. [Google Scholar]
- Saadi, Y.; Jounaidi, S.; El Kafhali, S.; Zougagh, H. Reducing energy footprint in cloud computing: A study on the impact of clustering techniques and scheduling algorithms for scientific workflows. Computing 2023, 105, 2231–2261. [Google Scholar] [CrossRef]
- Helali, L.; Omri, M.N. A survey of data center consolidation in cloud computing systems. Comput. Sci. Rev. 2021, 39, 100366. [Google Scholar] [CrossRef]
- Gholipour, N.; Shoeibi, N.; Arianyan, E. An energy-aware dynamic resource management technique using deep q-learning algorithm and joint VM and container consolidation approach for green computing in cloud data centers. In Distributed Computing and Artificial Intelligence, Special Sessions, 17th International Conference; Springer International Publishing: Berlin/Heidelberg, Germany, 2021; pp. 227–233. [Google Scholar]
- Tran, C.H.; Bui, T.K.; Pham, T.V. Virtual machine migration policy for multi-tier application in cloud computing based on Q-learning algorithm. Computing 2022, 104, 1285–1306. [Google Scholar] [CrossRef]
- Qin, Y.; Wang, H.; Yi, S.; Li, X.; Zhai, L. Virtual machine placement based on multi-objective reinforcement learning. Appl. Intell. 2020, 50, 2370–2383. [Google Scholar] [CrossRef]
- Lin, W.; Yu, T.; Gao, C.; Liu, F.; Li, T.; Fong, S.; Wang, Y. A hardware-aware CPU power measurement based on the power-exponent function model for cloud servers. Inf. Sci. 2021, 547, 1045–1065. [Google Scholar] [CrossRef]
- Mongia, V. EMaC: Dynamic VM Consolidation Framework for Energy-Efficiency and Multi-metric SLA Compliance in Cloud Data Centers. SN Comput. Sci. 2024, 5, 643. [Google Scholar] [CrossRef]
- AzurePublicDataset. Available online: https://github.com/Azure/AzurePublicDataset (accessed on 15 March 2025).
- Amahrouch, A.; Bouhamidi, M.; Saadi, Y.; El Kafhali, S. An Efficient Model based on Machine Learning Algorithms for Virtual Machines Classification in Cloud Computing Environment. In Proceedings of the 2024 4th International Conference on Innovative Research in Applied Science, Engineering and Technology (IRASET), Fez, Morocco, 16–17 May 2024; IEEE: New York, NY, USA, 2024; pp. 1–6. [Google Scholar]
- Srivastava, A.; Kumar, N. An efficient firefly and honeybee based load balancing mechanism in cloud infrastructure. Clust. Comput. 2024, 27, 2805–2827. [Google Scholar] [CrossRef]
- Calheiros, R.N.; Ranjan, R.; Beloglazov, A.; De Rose, C.A.; Buyya, R. CloudSim: A toolkit for modeling and simulation of cloud computing environments and evaluation of resource provisioning algorithms. Softw. Pract. Exp. 2011, 41, 23–50. [Google Scholar] [CrossRef]
- Standard Performance Evaluation Corporation. Available online: https://www.spec.org/power_ssj2008/results/ (accessed on 15 March 2025).
- Amazon EC2 Instance Types. Available online: https://aws.amazon.com/ec2/instance-types (accessed on 15 March 2025).
- Beloglazov, A.; Buyya, R. Optimal online deterministic al-gorithms and adaptive heuristics for energy and performance efficient dynamic consolidation of virtual machines in cloud data centers. Concurr. Comput. Pract. Exp. 2012, 24, 1397–1420. [Google Scholar] [CrossRef]
- Wang, J.; Gu, H.; Yu, J.; Song, Y.; He, X.; Song, Y. Research on virtual machine consolidation strategy based on combined prediction and energy-aware in cloud computing platform. J. Cloud Comput. 2022, 11, 50. [Google Scholar] [CrossRef]


Disclaimer/Publisher’s Note: The statements, opinions and data contained in all publications are solely those of the individual author(s) and contributor(s) and not of MDPI and/or the editor(s). MDPI and/or the editor(s) disclaim responsibility for any injury to people or property resulting from any ideas, methods, instructions or products referred to in the content. |
© 2025 by the authors. Licensee MDPI, Basel, Switzerland. This article is an open access article distributed under the terms and conditions of the Creative Commons Attribution (CC BY) license (https://creativecommons.org/licenses/by/4.0/).