Article

Measurement and Analysis of RSS Using Bluetooth Mesh Network for Localization Applications

Department of Electrical Engineering, University of North Texas, 1155 Union Circle #310470, Denton, TX 76203, USA
*
Author to whom correspondence should be addressed.
Network 2021, 1(3), 315-334; https://doi.org/10.3390/network1030018
Submission received: 29 August 2021 / Revised: 17 November 2021 / Accepted: 30 November 2021 / Published: 2 December 2021

Abstract

:
Bluetooth low energy (BLE)-based location service technology has become one of the fastest growing applications for Bluetooth. Received signal strength (RSS) is often used in localization techniques for ranging or location fingerprinting. However, RSS-based localization solutions have poor performance in multipath environments. In this paper, we present a measurement system designed using multiple ESP32 BLE modules and the Bluetooth mesh networking technology, which is capable of exploiting the space, time, and frequency diversities in measurements. To enable channel-aware multi-device RSS measurements, we also designed a communication protocol to associate channel ID information to advertising messages. Based on channel measurement and analysis, we demonstrate that with a six-receiver configuration and space-time-frequency diversity combining, we can significantly reduce the residual linear regression fitting errors in path loss models. Such a reduction leads to more accurately correlating RSS measurements to the distance between the transmitter and receiver devices and thus to achieving improved performance with the RSS-based localization techniques. More importantly, the reduction in the fitting errors is achieved without differentiating the three advertising channels, making it possible to conveniently implement the proposed six-receiver configuration using commercially available BLE devices and the standard Bluetooth mesh networking protocol stack.

1. Introduction

Bluetooth low energy (BLE) was released as a part of the Bluetooth 4.0 standard in 2010. With its inherent power efficiency, BLE is ideally suited for applications requiring short bursts of wireless transmission over long term, low power, low data rate operations. As a result, BLE has become a premier short-range wireless connectivity technology for consumer mobile devices as well as for the emerging Internet of Things (IoT) developments for a wide range of applications [1,2,3,4]. In the past few years, the BLE-based location service technology has become one of the fastest growing applications for Bluetooth. Industry forecasts now predict that over 400 million products in the Bluetooth location services area will be shipping per year by 2022 [3].
The success of BLE for location services is due in part to several new features that are enabled by the standard, including low-power beacons and fast scanning of advertisement packets. The new features have effectively addressed technical limitations of the Bluetooth Classic and offer some advantages over the more prevalent Wi-Fi-based solutions [5]. In addition, BLE is intended to provide considerably reduced power consumption and cost than the Bluetooth Classic while maintaining a similar communication range. The standard permits devices to implement either or both BLE and Bluetooth Classic subsystems. Thus, it is convenient to have location service-specific systems designed using BLE and to adjust the deployment density and complexity to meet location service requirements. In contrast, when location services are designed as an add-on feature of an existing system such as Wi-Fi, system design and deployment will be constrained to meet the primary application requirements of the existing system. For example, BLE beacons are not constrained to provide uniform communication coverage, while Wi-Fi access points are deployed primarily for wireless communication with minimal coverage overlap [5].
In general, BLE localization solutions are designed based on the same principles as being used by the Wi-Fi-based systems. When two BLE devices are within the range of direct wireless communication, received signal strength (RSS) measurements at the physical layer can be used to estimate the distance or proximity between the two devices [6,7]. Such a capability can be used to develop location services involving only two BLE devices. For example, in item finding solutions, small, battery-powered BLE tags are attached to objects that may be easily misplaced such as keys and wallet, and then one can use a smartphone to listen for the beacon signals coming from the tags, measure RSS, estimate distance, and finally locate the item [3]. In some other applications, many BLE devices need to be deployed throughout the operating environment to provide a more sophisticated infrastructure support for location services. Current systems can typically provide meter-level accuracies (about 1 to 10 m), while the exact accuracy in a specific application scenario depends on the deployment density of the infrastructure devices and the characteristics of the operating environment [3,5].
Radio signals have an attenuation rate of 20 dB per decade of distance when propagating in free space [8], which makes it straightforward to estimate the distance from transmitter to receiver by measuring RSS. However, in multipath environments, instantaneous measurements of radio signal RSS suffer from random fluctuations due to the combined effects of path loss, shadowing, and small-scale fading. As a result, radio signal RSS-based localization solutions have poor performance in multipath environments. In addition, BLE signals are more susceptible to small-scale fading effects than Wi-Fi signals due to the narrower signal bandwidth of BLE. The BLE and Wi-Fi systems both operate in the unlicensed ISM band at 2.4 GHz, but with different channel bandwidth. BLE systems transmit signals over 2 MHz-wide channels, while the channel bandwidth of Wi-Fi is 20 MHz. Furthermore, BLE location service solutions depend on the RSS measurements on three widely spaced advertising channels that may be associated with different gains and multipath fading effects [5]. The RSS measurement data of BLE without channel information may statistically follow a multimodel distribution, making it hard to model the distance-power relation accurately. Thus, the research presented in this paper is formulated with two main objectives:
  • Experimentally study RSS measurements using BLE devices to better understand the key factors that may impact the performance of BLE localization systems, including small-scale fading effects with BLE signals and channel model differences among widely spaced advertising channels, and
  • Explore new design techniques by exploiting the unique features of BLE systems to improve the performance of the RSS-based BLE localization solutions, including time-frequency diversity offered by three widely spaced advertising channels and the Bluetooth mesh networking technology.
To accomplish these objectives, in this research, we designed a RSS measurement system using multiple ESP32 BLE modules and the Bluetooth mesh networking technology, which is capable of exploiting the space, time, and frequency diversities in measurements. We have also designed a communication protocol to associate channel ID information to advertising messages to enable channel-aware multi-device RSS measurements. Such a custom designed communication protocol is necessary in this research since standard BLE devices do not report which advertising channel is used for publishing a specific message. In this paper, based on channel measurement and analysis, we demonstrate that small-scale fading effects introduce large random variations in RSS measurements, making RSS unreliable for localization purposes. Therefore, we proposed a six-receiver configuration and space-time-frequency diversity combining scheme, which can be used to more accurately correlate RSS measurements to the distance between transmitter and receiver, and thus to achieve improved performance with the RSS-based localization techniques.
Performance improvements of the six-receiver configuration and diversity combining scheme, as compared to the conventional single receiver system, are studied by comparing the empirical path loss models derived from measurement data. More importantly, we show with the measurement and modeling results that the reduction in the fitting errors is achieved without differentiating the three advertising channels. Thus, it is possible to conveniently implement the proposed six-receiver configuration using commercially available BLE devices and the standard Bluetooth mesh networking protocol stack without the need to decode the channel ID information from received messages. Additionally, such a system can be easily converted to a Bluetooth mesh network-based localization system. Due to the multi-hop wireless mesh networking nature of the system, it is especially convenient to cover a large space with different topologies. In summary, the major contributions of this paper are listed below:
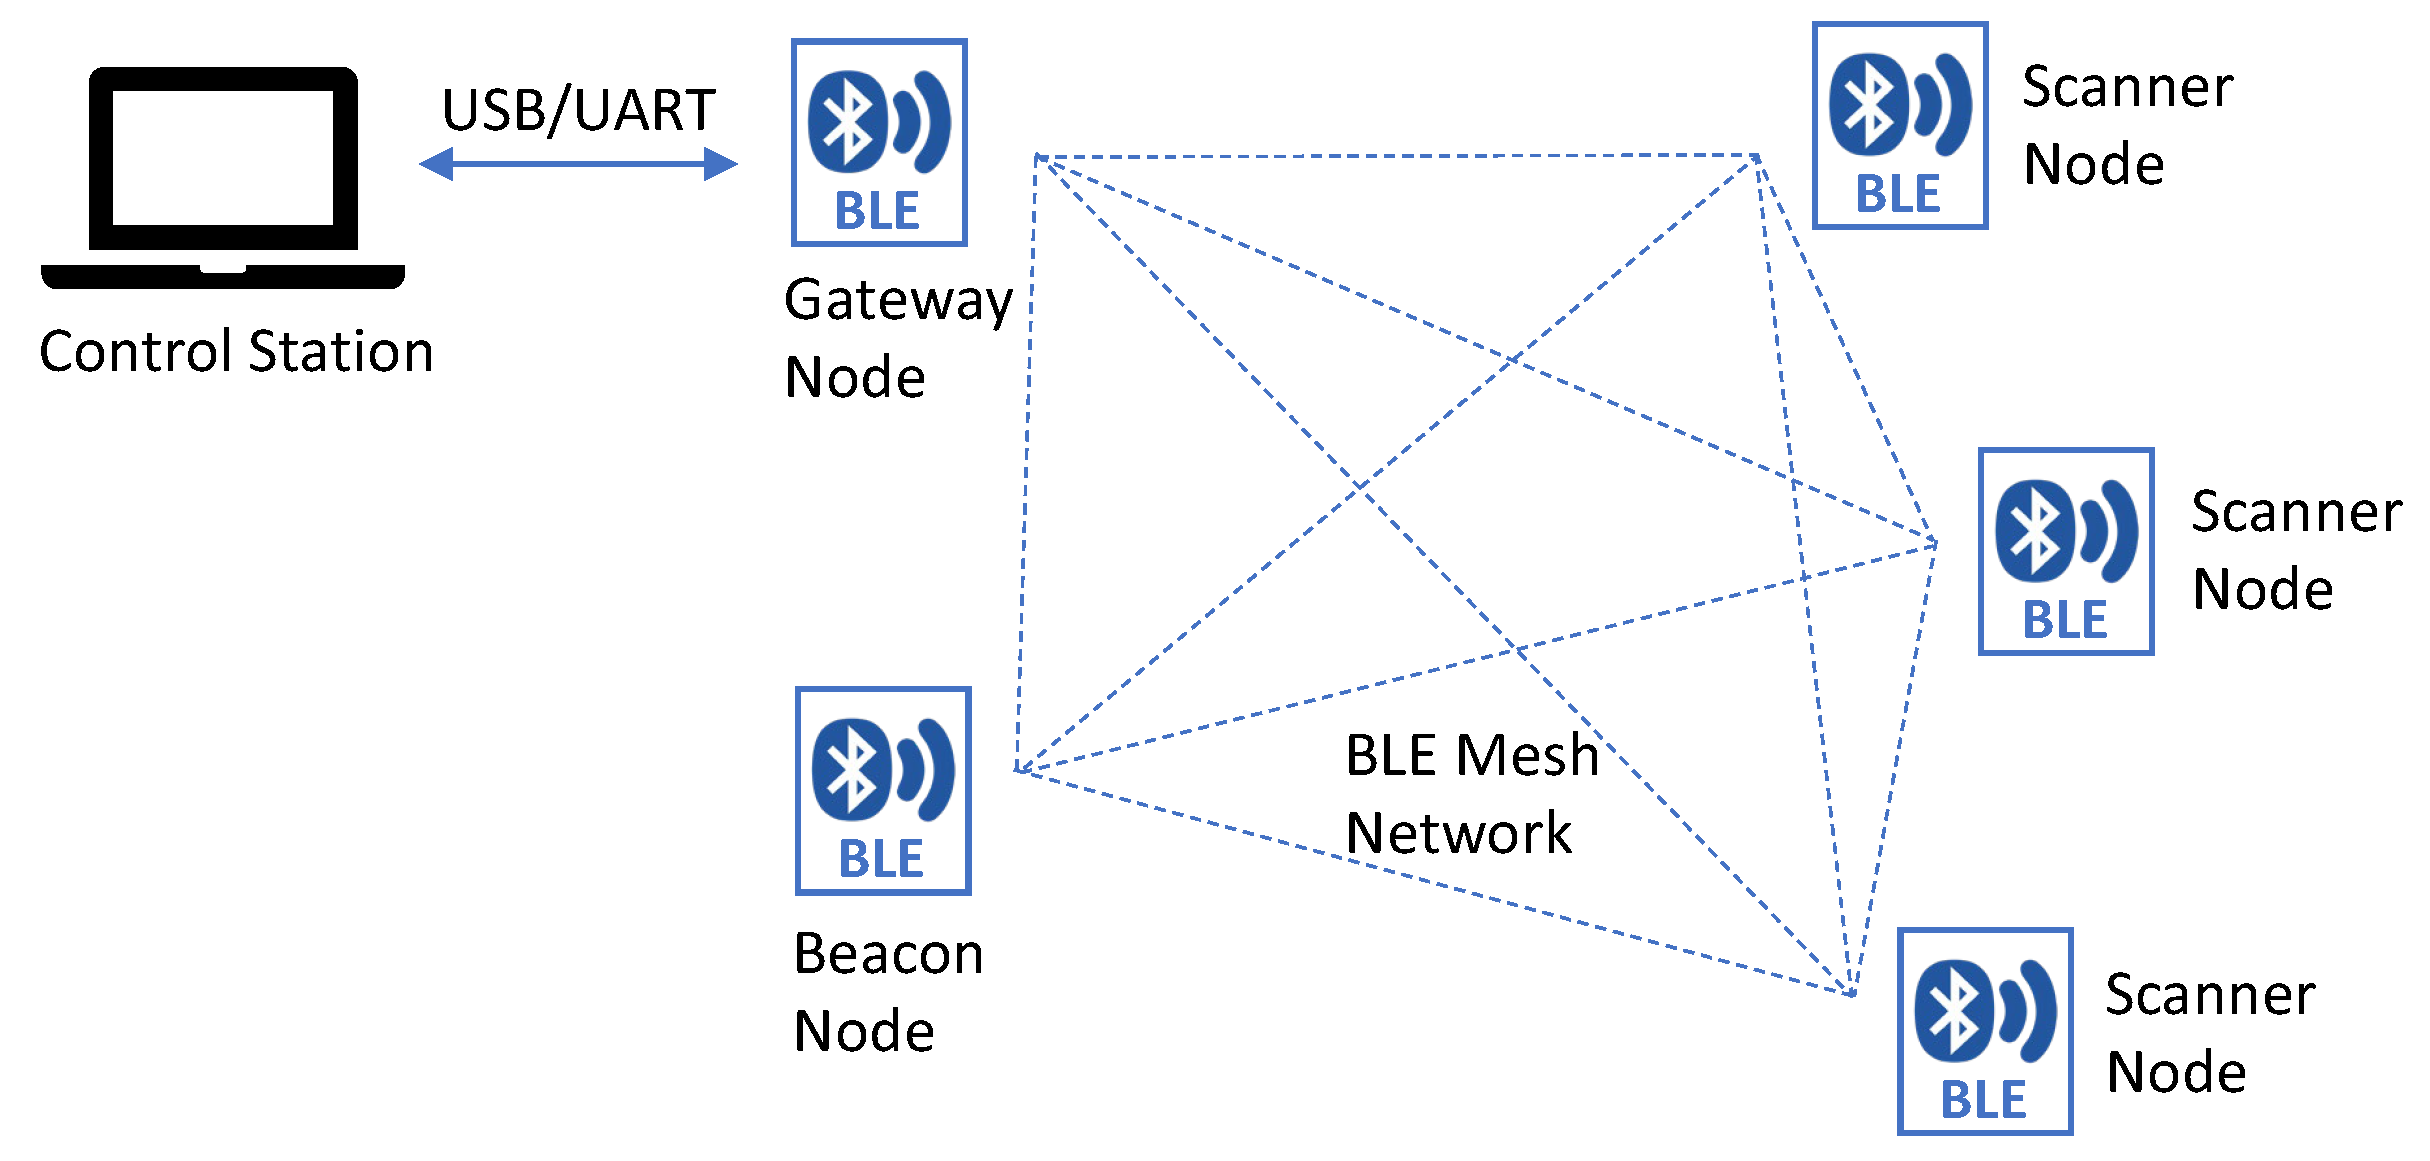
  • We have presented a general framework for experimentally characterizing RSS measurements using the Bluetooth mesh network-based measurement system. We have presented design details of the proposed measurement system in terms of system architecture, hardware design, and communication protocols.
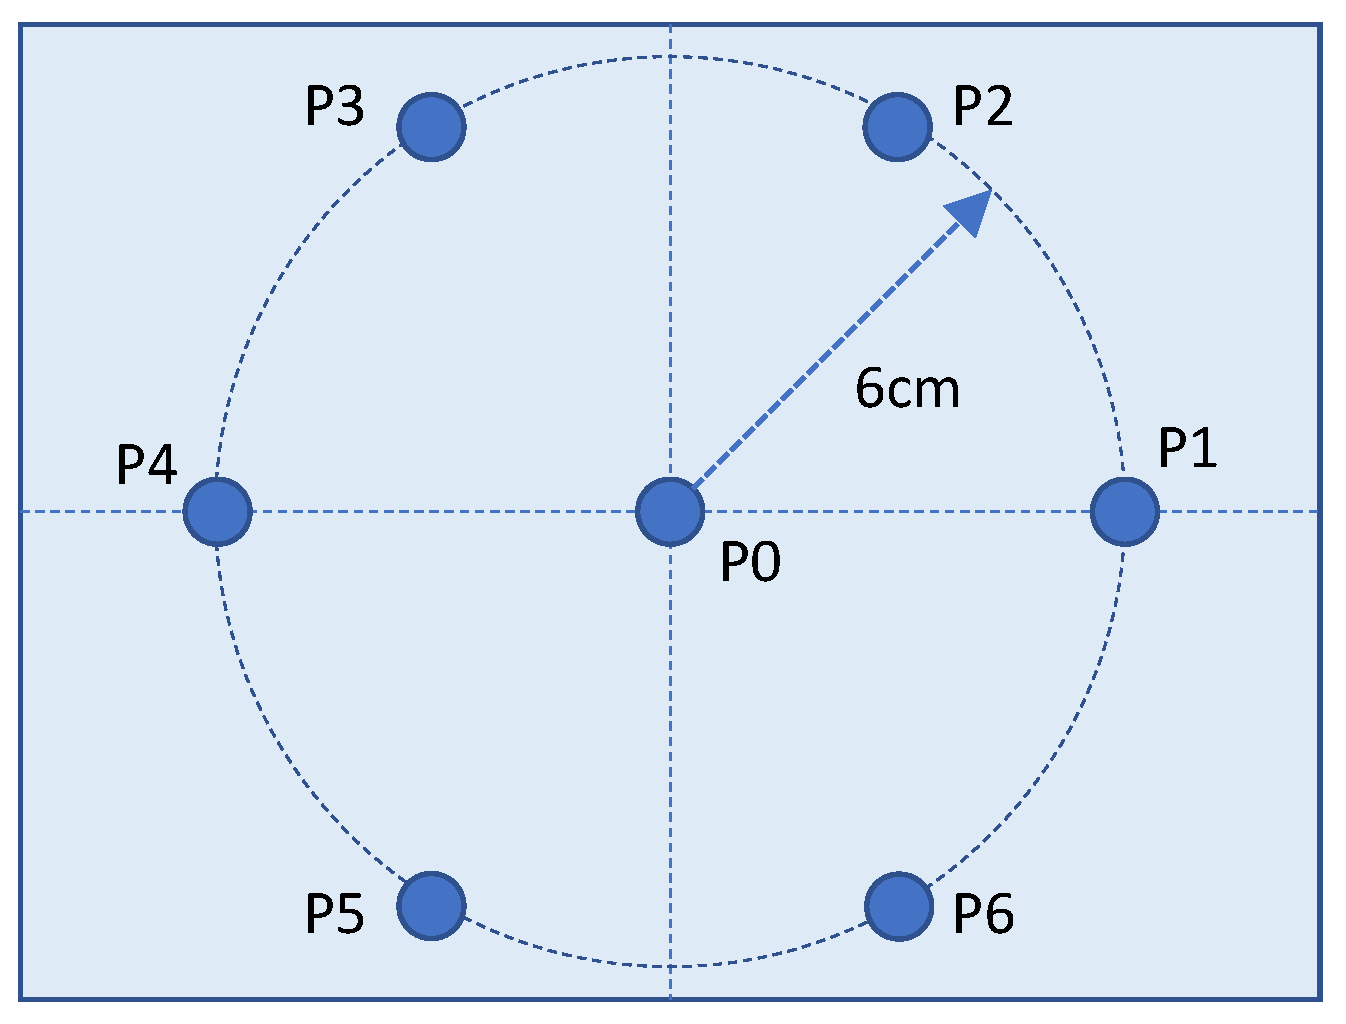
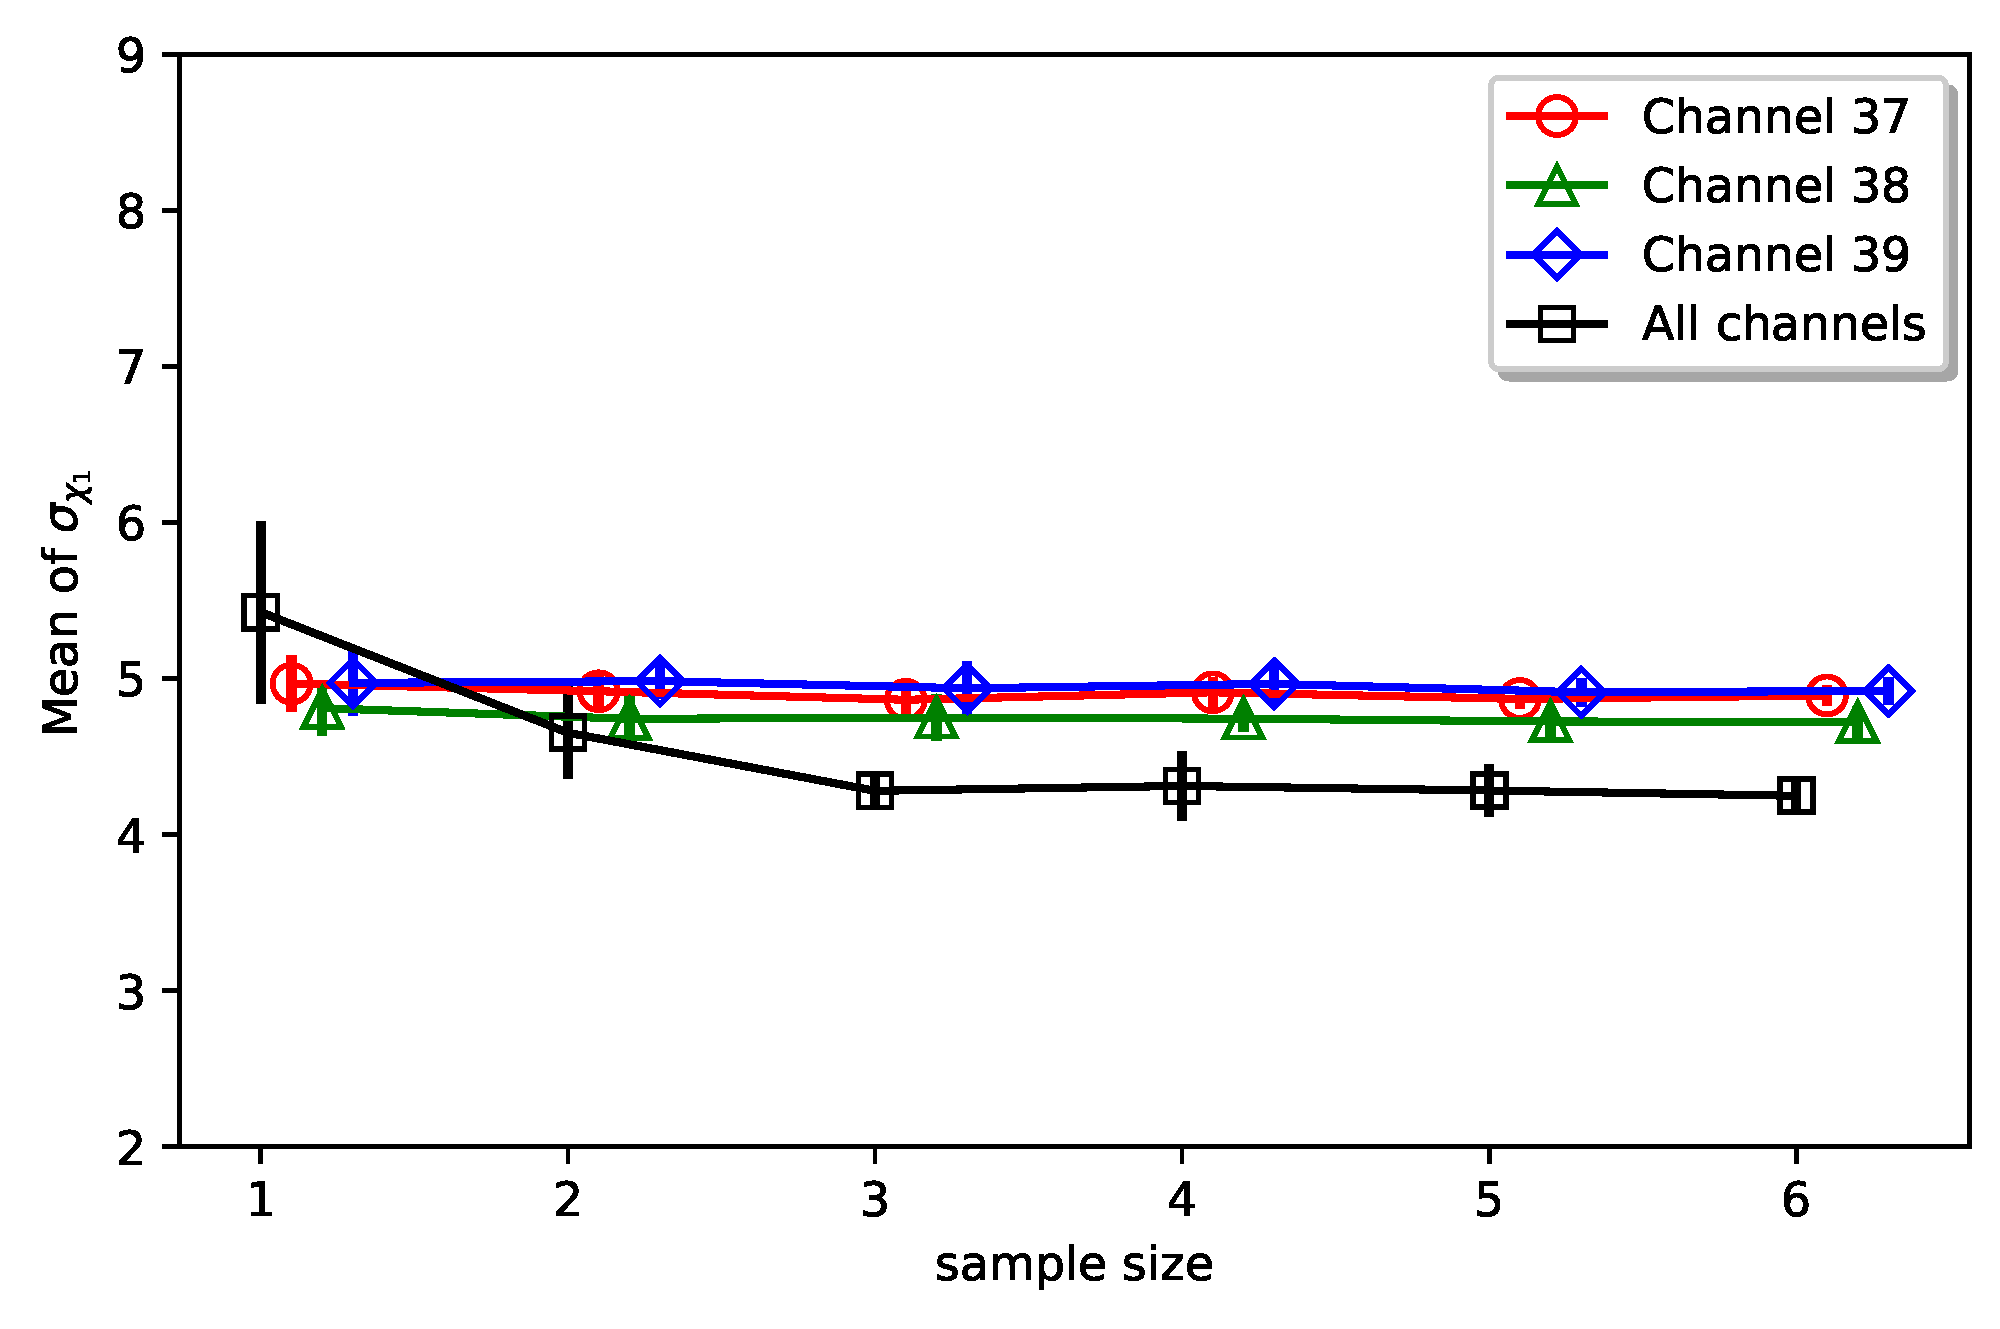
  • We have proposed a six-receiver configuration and a space-time-frequency diversity combining scheme to reduce the residual linear regression fitting errors in path loss models. Such a reduction can lead to more accurate range or location estimation based on RSS measurements, which is fundamentally important for localization.
The rest of the paper is organized as follows. In Section 2, we present a brief review of several related papers in the literature. Impacts of radio propagation channel characteristics on RSS measurements are discussed in Section 3. Then, we present the measurement system that we developed for this research in Section 4, followed by the results and analysis in Section 5. Finally, the paper is closed with a summary and conclusions in Section 6.

2. Related Works

In the past two decades, there have been tremendous efforts in research and development of wireless localization solutions due to proliferation of various mobile computing devices and ever-increasing demand for location-based services in indoor and urban environments where GPS could not provide sufficient coverage and accuracy. Many existing solutions depend on measurement of radio signal RSS, which is mainly due to the fact that RSS measurements are readily available on most of the commercial off-the-shelf wireless devices. Comprehensive surveys of localization techniques are available in many references such as [9,10,11,12,13]. Several closely related papers are reviewed briefly in the following.
The paper [5] presented a study of location fingerprinting method using BLE beacons. Location fingerprinting does not depend on the modeling of radio propagation channels, but it requires extensive site surveys to construct the database of location signatures in the form of the RSS of available BLE beacon signals. The authors demonstrated through measurement and analysis that the use of three widely spaced but narrowband advertising channels leads to severe RSS variations if the channel number is not available. To mitigate multipath fading effects, the authors applied frame-based processing on a sequence of RSS measurements that are collected over a window of time. The authors studied the effects of beacon density, transmit power, and transmit frequency on the performance of location fingerprinting methods. The authors also presented a detailed analysis of the advantages and disadvantages of BLE and Wi-Fi for localization applications.
The paper [14] presents RSS measurement results and path loss models in four different environments. Three BLE advertisement channels are modelled separately and the interfering effects are explained using channel spectrum masks of the Wi-Fi and BLE systems. It is concluded that the BLE channel 39 has the least possible amount of interference from Wi-Fi because it has the least amount of overlap with Wi-Fi channels. The paper [15] presents a BLE-based indoor positioning system that takes advantage of frequency diversity offered by three BLE advertisement channels. Given three RSS measurement data received in a quick succession from three advertisement channels, three diversity combining schemes are used in the paper, including max, mean, and maximum ratio combining (MRC). Effects of the combining schemes are compared using measurement data. Paper [16] presents an indoor positioning method that depends on deriving a path loss model for each of the three advertisement channels. It is shown that linear regression over one single channels results in smaller residue variance, which in turn can effectively improve positioning performance.
The paper [17] demonstrates that averaging RSS measurements over multiple RF channels can significantly reduce random variations in the data, which can improve the RSS-based ranging accuracy. Such a multichannel averaging approach effectively exploits frequency diversity in the data to counter the effects of small-scale multipath fading. IEEE 802.15.4 transceivers are used to experimentally validate the performance. It is also shown that averaging over 6 channels has comparable performance as with 16 channels. The paper [18] presents measurement and modeling results of Wi-Fi signal path loss models in several office environments. The chi-square goodness-of-fit test is used to validate the normality assumption of the path loss and shadowing models. Empirical results are also compared with a deterministic two-ray model. It is concluded that the log-distance path loss and log-normal shadowing models fit well with the measurement data.

3. Radio Channel Characteristics and Models

RSS measurements are mainly used in two different approaches for localization, including ranging and location fingerprinting [6,10,12,13,17]. With the ranging approach, RSS measurements are used to estimate the distance between radio transceivers based on a pre-determined radio signal path loss model. Then, the distance estimation is used to estimate location through the trilateration method. In contrast, with the location fingerprinting approach, RSS measurements are collected as location fingerprints at specific locations of interest in the offline phase. The location fingerprints are used to train a classification model, which is then used in the online phase to estimate location based on instantaneous RSS measurements. Radio channel characteristics place fundamental limits on the performance of RSS-based localization techniques. In this section, we present a brief review of radio propagation channel characteristics and discuss their impacts on the RSS measurement data.

3.1. Multipath Small-Scale Fading

It is well known that indoor radio channel characteristics are strongly influenced by the specific features of the environment such as building layout, construction materials, building types, furniture arrangements, movements of occupants, etc. [8,10,19,20]. Major propagation mechanisms of radio signals (i.e., electromagnetic waves) include reflection, diffraction, and scattering. In indoor environments, the radio signal generated by a transmitter may result in many plane waves arriving at a receiver with different time delays and signal attenuation because the received plane waves have traveled along different paths and undergone different combinations of reflection, diffraction, and scattering effects [8,19]. Such a phenomenon is known as multipath propagation and the plane waves arriving at the receiver along different paths are known as multipath signals.
Multipath signals arriving at a receiver are combined at the receiver antenna, i.e., the signal acquired by the receiver is a vector sum of the multipath signals, each of which has random amplitude and phase as well as randomly shifted frequency if the Doppler effect needs to be considered [8]. Thus, signal strength of the received signal is random in nature, depending on the distribution of the random amplitudes and phases of multipath signals. As a result, when receiver moves over a small distance, the multipath signals arriving at the new location may be dramatically different from that at the original location, making the instantaneous RSS measurements fluctuate significantly over space. In addition, even when the receiver remains stationary, movements of the objects in the surrounding environment can cause random changes in the multipath signals arriving at the receiver and thus can cause random fluctuations in RSS measurements over time.
The rapid fluctuation of RSS measurements over short travel distance (on the order of signal wavelength) or short time duration (on the order of seconds) is known as multipath small-scale fading [8,19]. RSS measurements may vary as much as 30 to 40 dB due to the small-scale fading effects when the receiver is moved by only a fraction of a wavelength [8]. Multipath small-scale fading introduces random fluctuations to RSS measurements so that it has detrimental effects on both of the ranging and location fingerprinting approaches for localization applications. Multipath small-scale fading effects are typically removed by averaging multiple measurements collected over a small span in the time and/or space domains [8,19]. In practice, radio transceiver systems can implement various diversity combining techniques to reduce or remove the multipath small-scale fading effects. In essence, diversity techniques exploit the random nature of radio propagation channels by combining measurements from independent or at least uncorrelated signal paths [8,20].

3.2. Path Loss and Shadowing

According to the electromagnetic wave propagation theory, radio signals attenuate at a rate of 20 dB per decade of distance when propagating in free space, where the line-of-sight path exists between the transmitter and receiver devices and there are no clutters in the environment to induce multipath propagation effects [8]. However, in multipath environments, RSS measurements exhibit rapid fluctuations due to the small-scale fading effects. In contrast, the path loss of radio signals is defined as the difference between the transmitted signal power and the local average power of the received signal while the local average power is determined by averaging multiple RSS measurements over a short time duration and small movements in space to remove the small-scale fading effects [8,19]. As the receiver moves away from the transmitter, in general, path loss of the received signal increases over distance.
Path loss models are used to characterize the correlation between the local average RSS and the distance between the transmitter and receiver devices. Indoor path loss models are typically derived based on measurements [8,18,19]. One of the classical radio propagation channel models that has been widely used in practice is the log-normal shadowing path loss model given in the following [8,19],
L ( d ) = L 0 + 10 α log 10 ( d d 0 ) + χ , χ N ( 0 , σ χ 2 ) ,
where the path loss L ( d ) = P t [ dBm ] P ¯ r ( d ) [ dBm ] is the difference between the transmitted signal power P t and the average received signal power P ¯ r ( d ) , both in dBm unit, for a pair of radio transceivers that are d meters apart. L 0 is the path loss at the reference distance d 0 , and it is typically determined in the initial system characterization stage. For indoor environments, d 0 is normally set to be 1 m. The distance-power gradient (a.k.a. path loss exponent) α is used to model the average rate at which the path loss increases with distance. The parameter χ is a zero-mean Gaussian random variable with standard deviation σ χ , and it is used to model random shadowing effects over many measurement locations which have the same separation distance between the transmitter and receiver but different levels of clutters on the propagation path.
The model parameters α and σ χ can be determined by applying linear regression to measurement data [8,19]. The values of α and σ χ depend on signal frequency and building characteristics in the surrounding environment. Typical values of α and σ χ can be found in references such as [8,19]. For example, in indoor environments, the value of α is typically between 1.6 and 1.8 in line-of-sight scenarios, while it is typically between 4 and 6 in no-line-of-sight scenarios [8].
For complex indoor environments, it is also possible to use partitioned path loss models to characterize different coverage regions more accurately with different values of α and σ χ . In particular, a two-segment partitioned path loss model can be defined as [19],
L ( d ) = L 0 + 10 α 0 log 10 ( d d 0 ) + χ 0 , χ 0 N ( 0 , σ χ 0 2 ) ,
for d 0 d d 1 , and
L ( d ) = L ¯ ( d 1 ) + 10 α 1 log 10 ( d d 1 ) + χ 1 , χ 1 N ( 0 , σ χ 1 2 ) ,
for d > d 1 , where L ¯ ( d ) = E { L ( d ) } is the average path loss at the distance d without shadowing effects.
Extensive measurement and modeling efforts are needed to develop accurate path loss and shadowing models while one of the main challenges is that different environments may require dramatically different models, especially in complex indoor environments [19]. The RSS-based ranging approach directly depends on path loss and shadowing models to estimate distance. In contrast, the location fingerprinting approach does not require path loss models, and it is also not affected by the shadowing effects; instead, RSS-based location fingerprinting approach depends on the correlation between RSS measurements and location coordinates. In this research, we employ Bluetooth mesh network to experimentally study the characteristics of RSS measurements in the context of channel modeling for localization applications.

4. Bluetooth Mesh Network for Experimental Studies of RSS Measurements

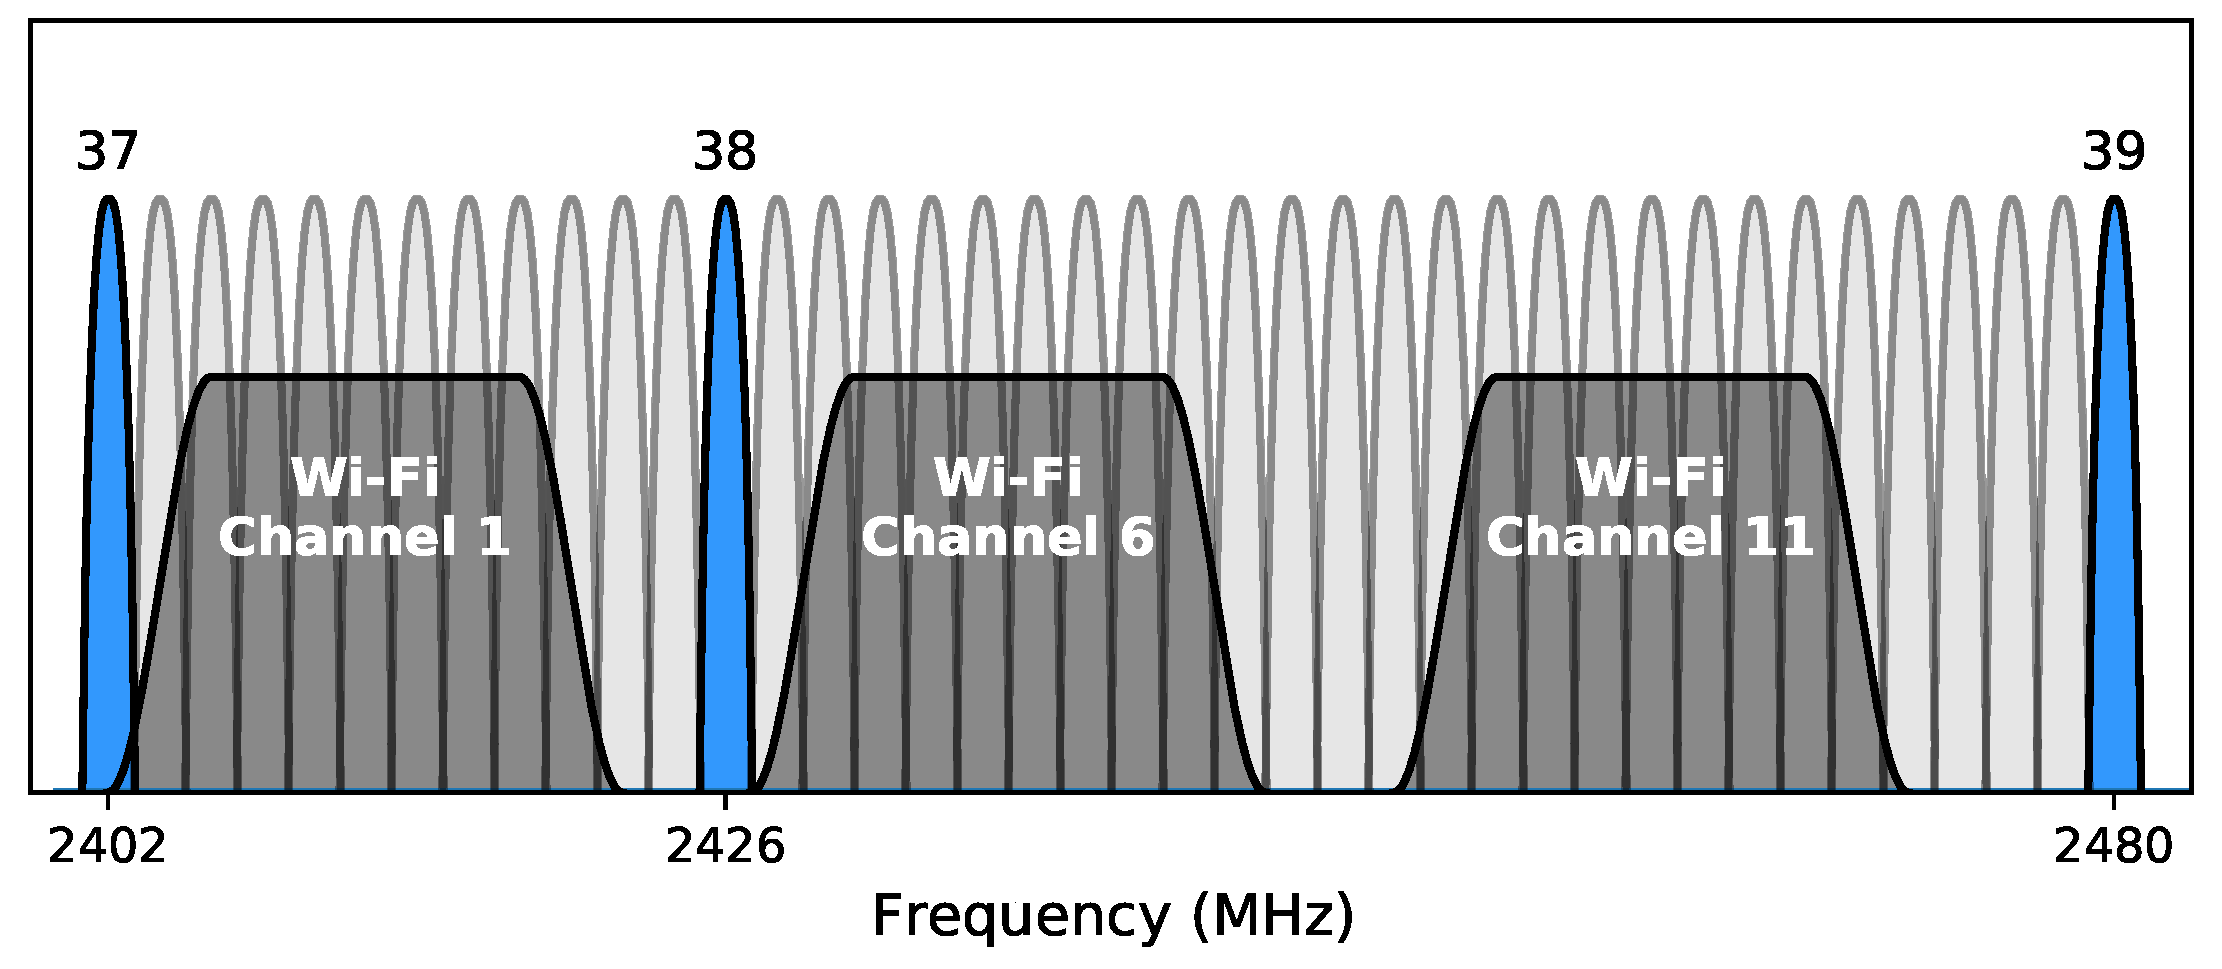
4.1. Specifications of BLE Signals

Bluetooth was originally designed as a wireless technology for short-range cable replacement, and it was used mainly for streaming applications such as audio streaming and file transfers. BLE was introduced as a subsystem of Bluetooth for applications that require low power consumption and low cost to exchange small amounts of data periodically [21]. To differentiate, the original Bluetooth is now known as Bluetooth Classic. BLE provides similar communication range to that of Bluetooth Classic with a maximum transmission power of 10 dBm in Bluetooth 4 and 20 dBm in Bluetooth 5. BLE achieves reduced power consumption by keeping the radio off as much of time as possible and sending small amounts of data at low data rates. The low cost and low power consumption nature of BLE makes it possible for many devices to be deployed throughout a service area for long-term operations, and also makes it suitable for integration in other devices. Consequently, BLE has become extremely popular in power-constrained IoT and machine-to-machine communication applications [2,4,22].
BLE operates over 40 channels that span the 2.4 GHz ISM band with a spacing of 2 MHz between adjacent channels as shown in Figure 1 [5,21]. Three of these channels are designated as primary advertising channels or simply advertising channels, including channel 37, 38, and 39, while the remaining 37 channels are data channels that are used for secondary advertisements and data packet transmission during connection. Three advertising channels are located at 2402, 2426, and 2480 MHz, respectively, which are selected to minimize the interference from the Wi-Fi systems that operate in the same 2.4 GHz ISM band. There are 11 overlapping channels defined for Wi-Fi at the 2.4 GHz band in the North America region, among which three non-overlapping channels, i.e., channel 1, 6 and 11 shown in Figure 1, are most widely used to avoid cross-channel interference.
The BLE advertising channels are used to broadcast short packets for device discovery, connection establishment, and beacon service [21]. Data channels are used for bidirectional communication between connected devices. Advertisements always start with sending an advertising packet on all three or a subset of advertising channels, which allows fast discovery and connection. In comparison, Bluetooth Classic needs to scan 32 channels for discovery. Advertising packets are sent at advertising events that occur periodically with an advertising interval. Advertising interval can be set to any value between 20 ms and 10.24 s with a step size of 0.625 ms. To prevent advertising events of multiple devices from overlapping, an additional small random time between 0 and 10 ms is added between advertising events.
BLE localization solutions mostly employ RSS measurements over the BLE advertising channels to implement ranging or location fingerprinting approaches [1,3,4,5,15,16,23]. The use of three advertising channels that are widely spaced in frequency brings challenging issues as discussed in [5,14,15], but it may also be possible to exploit frequency diversity offered by three channels. The repeated transmission of short bursts of advertising packet makes it possible to exploit time diversity in RSS measurements as the scanning device will be able to receive multiple copies of advertising packet over a period of time. When either or both of the devices are in motion, measurements over time also provide opportunities to exploit space diversity. In this paper, we present a RSS measurement system designed based on the Bluetooth mesh networking technology to exploit both space and time diversities in measurement, which can be used in channel measurement and modeling as well as in the RSS-based localization applications.

4.2. RSS Measurement System Using Bluetooth Mesh Network

To conduct experimental study of the BLE channel characteristics, in this research, we developed a measurement system based on the 2.4 GHz wireless development board ESP32-DevKitC-32U [24,25], which features a system-on-chip ESP32 microcontroller module with a U.FL connector for external antenna as shown in Figure 2a. A different ESP32 development board with the onboard PCB antenna, as shown in Figure 2b, is also used for comparison. The ESP32 series employ a Tensilica Xtensa LX6 microprocessor and have the built-in RF front-end modules. The ESP32 module can be programmed as a Wi-Fi, Bluetooth, or BLE device, and it is designed for a wide variety of applications related to sensor networks, IoT, and wearable devices among many others.
To enable simultaneous measurements with multiple antennas and multiple devices, we programmed the application layer of the measurement system based on the ESP Bluetooth mesh networking framework [25], which is built on top of the Zephyr Bluetooth mesh stack [26]. Bluetooth mesh network was introduced as an addition to the Bluetooth standard in 2017 [22,26]. Bluetooth mesh builds on top of BLE, and it supports the many-to-many multi-hop mesh networking topology, where BLE devices can send messages to each other even when the devices are not in direct radio communication range [25]. BLE devices operate in two states, including the advertising/scanning and connection states. Bluetooth mesh uses only the advertising/scanning state of BLE devices. Devices in Bluetooth mesh network do not connect to each other as what the traditional BLE devices do. Instead, devices relay information to each other using advertising packets.
As shown in Figure 3, our RSS measurement mesh network system contains three types of nodes, including beacon node, scanner node, and gateway node. Beacon nodes broadcast beacon packets at advertising events that occur periodically. Scanner nodes scan the three advertising channels and collect RSS measurements from the received advertising packets. Gateway node serves as an interface between mesh network and control station. Control station is used to broadcast or unicast commands to mesh network. For example, control station initiates data collection by broadcasting a command to scanner nodes. Control station is also used to dynamically configure the advertising interval of beacon nodes. Due to the multi-hop wireless mesh networking nature of our measurement system, it is especially convenient to set up a measurement scenario with multiple beacon nodes and multiple scanner nodes to cover a large space with different topologies. In addition, such a system can be easily converted to a Bluetooth mesh network-based localization system, where beacon nodes are configured as reference nodes and scanner nodes are the ones that need to be located or tracked. Architectures and other technical details of wireless localization and tracking systems can be found in the references [6,7,9,10,27].

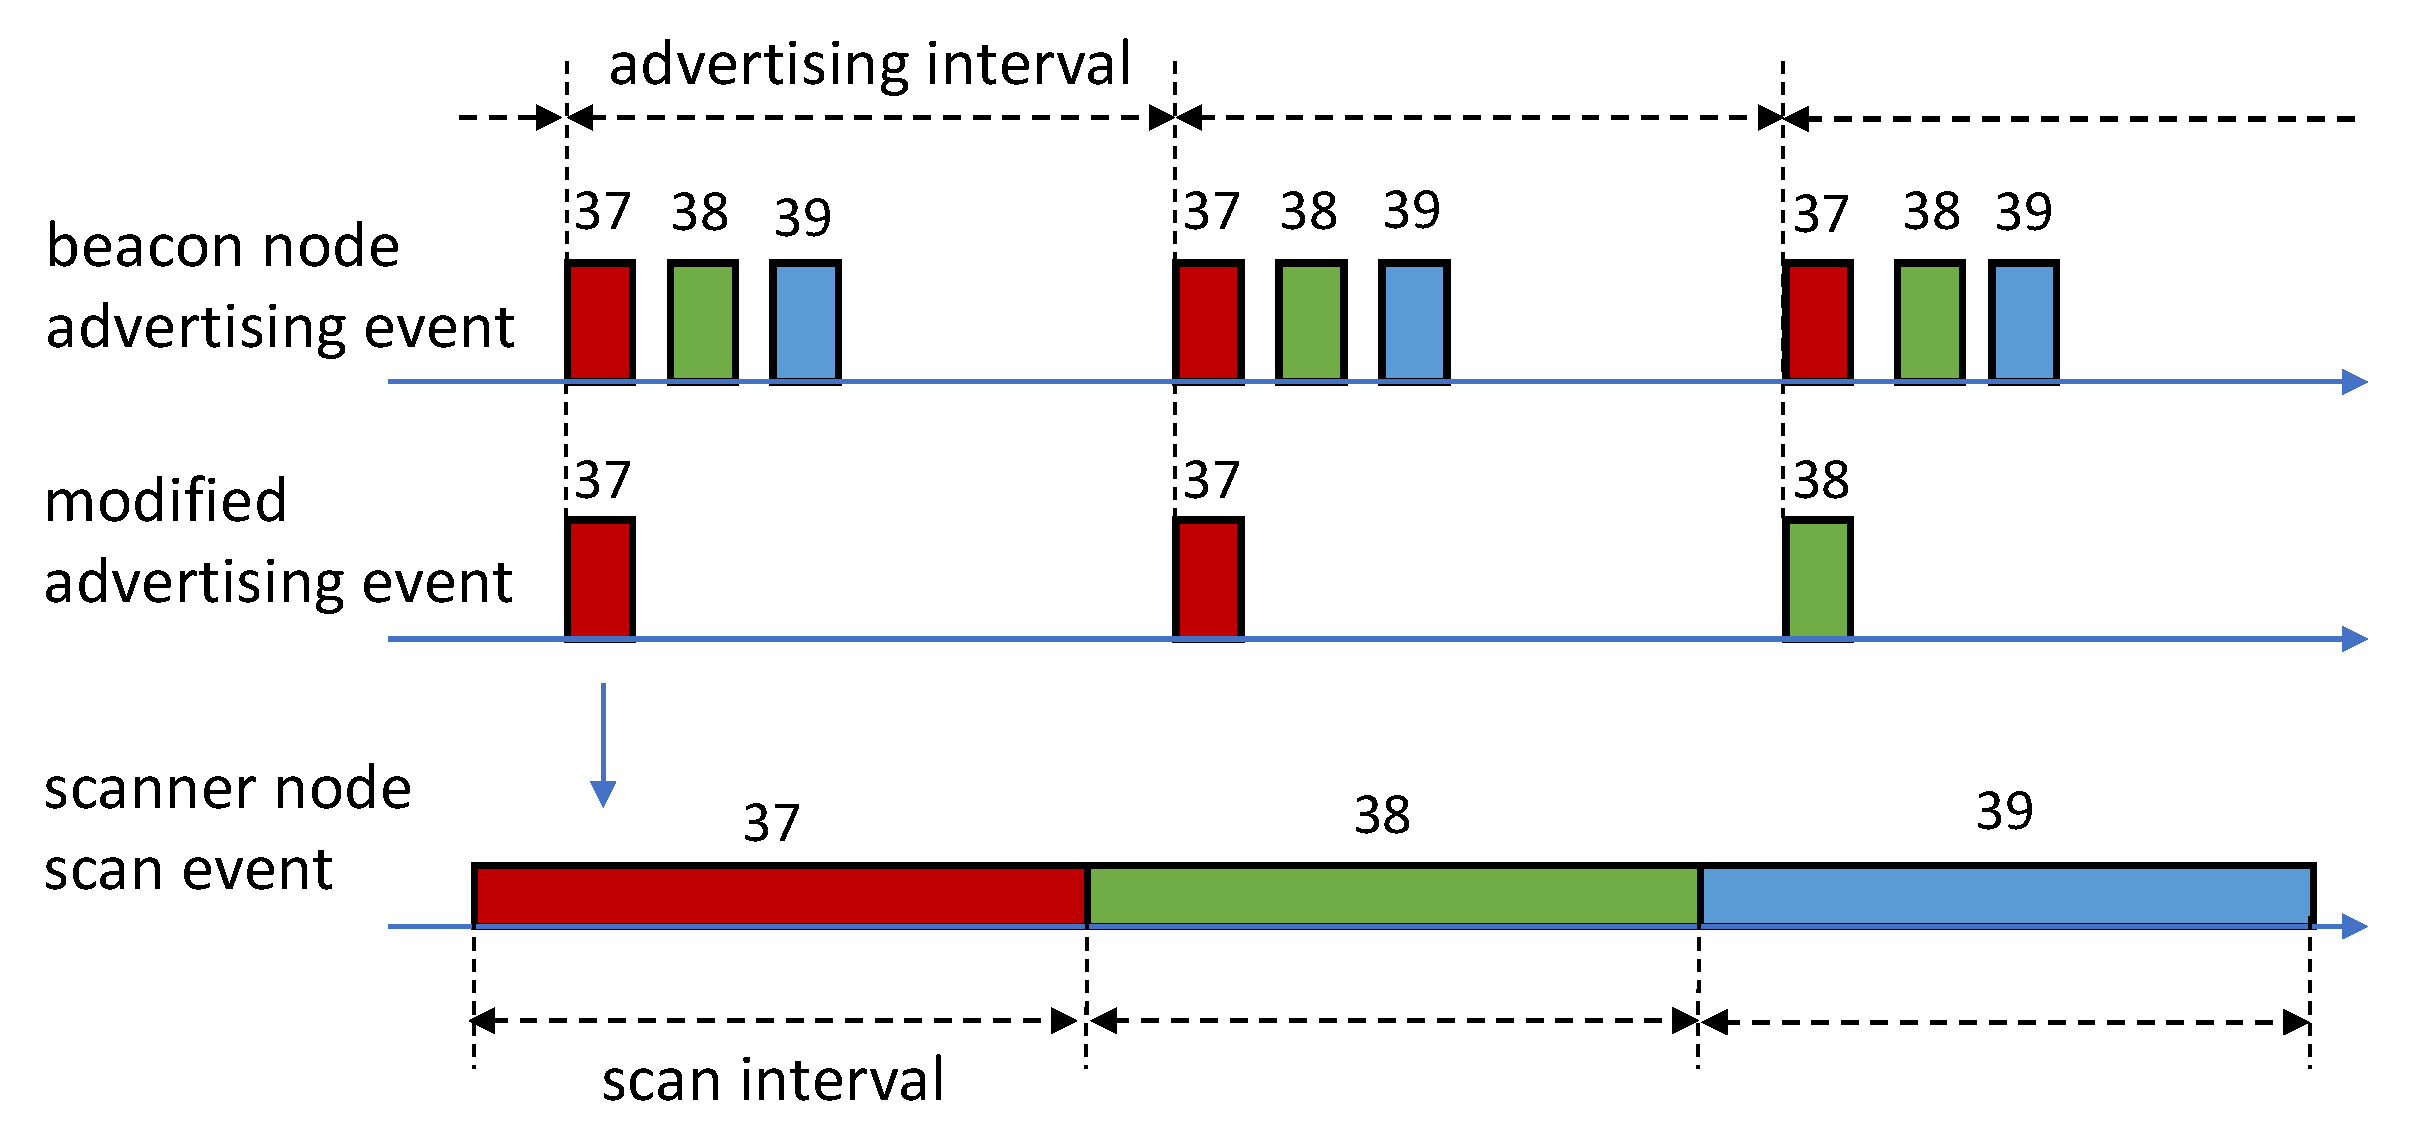
4.3. Design of Communication Protocols for Channel-Aware Multi-Device RSS Measurements

Bluetooth mesh network implements the internode communication using a publish/subscribe messaging system [22,25]. With such a system, messages may be published to a unicast address, group address, or virtual address. When a node publishes a message to a particular address, all the nodes that have subscribed to that address will receive a copy of the message. In this research, we designed several communication protocols over the standard mesh network messaging system to control the data collection process as illustrated in Figure 4. The communication protocols are implemented using the vendor client/server model that is defined in the ESP Bluetooth mesh networking framework [25].
In our design of communication protocols, beacon nodes publish advertising messages periodically at the advertising interval. The time-to-live (TTL) parameter of advertising messages is set to 0 to limit the receiving nodes to those within direct radio communication range. Gateway node can multicast a message to beacon nodes to change advertising interval during the runtime. It also multicasts to scanner nodes to start the data collection process. After scanner nodes have collected a specified number of data, they use unicast to send data to gateway node, which then forwards the data to control station for storage and postprocessing. To reduce collisions among scanner nodes when sending data to gateway node, a random delay is added by each scanner node at the end of data collection process before sending data to gateway node. The payload of each adverting message is limited to 29 bytes as specified by the Bluetooth mesh network standard [26]. The payload of the data message published by scanner node to gateway node is limited to 377 bytes, which is then segmented into smaller packets at the transport layer for transmission over BLE [26].
When beacon nodes publish an advertising message, the message is broadcasted by the underlying BLE layer in advertising events using three advertising channels one after another in quick succession as shown in Figure 5. Scanner nodes adopt a scan cycle that cycles over the three advertising channels in sequence, trying to capture advertising packets. Scanner nodes measure RSS using the advertising packet received from beacon nodes. The BLE specification for advertisement reception does not require BLE device to report from which advertising channel it has received each of the advertising packets [5]. Therefore, in order to study and compare the characteristics of the three advertising channels, we designed a communication protocol to associate channel ID information to each of the advertising packets.
Specifically, as shown in Figure 5, we configured the BLE layer to use only one advertising channel to transmit in each advertising event, instead of using all three channels as in the standard advertising events. The same advertising channel will be used in multiple advertising events in sequence before cycling to the next channel to achieve reliable reception by scanner nodes. In addition, the payload of advertising messages is designed to include the ID number of the channel used for the current advertising event. As a result, after a scanner node receives an advertising message, it can parse the message to find out from which advertising channel it has received the message. The advertising message also contains a message sequence ID number in the payload, which is used in postprocessing to match the RSS measurements collected from multiple scanner nodes. It is also used to detect packet losses, which is necessary when tuning network parameters to achieve reliable networking performance.

5. Analysis of RSS Measurements Using Bluetooth Mesh Network

To conveniently conduct channel measurements using multiple ESP32 transmitter and receiver devices, in this research, we custom designed and 3D-printed a panning measurement platform with 360° scale for horizontal rotation. The measurement platform is installed on top of a non-reflective EMC antenna tripod as shown in Figure 6. Multiple ESP32 BLE devices with external antennas and battery packs can be easily mounted on the platform. The external antenna installation positions on the platform are shown in Figure 7. The position P0 is also the platform’s center of rotation. In this section, we first present antenna radiation pattern measurement data obtained using our measurement system, which is used to characterize RSS measurements with individual BLE devices. Then, measurement data are presented to study the small-scale multipath fading effects on RSS measurements. At last, we present the path loss models derived with various system configurations, including single receiver, multiple receivers, single advertising channel, and multiple advertising channels. The path loss models are used to analyze the effects of the space-time-frequency diversity combining schemes on the modeling accuracy of the RSS-distance correlation in indoor multipath environments, which is fundamentally important for the RSS-based localization techniques.

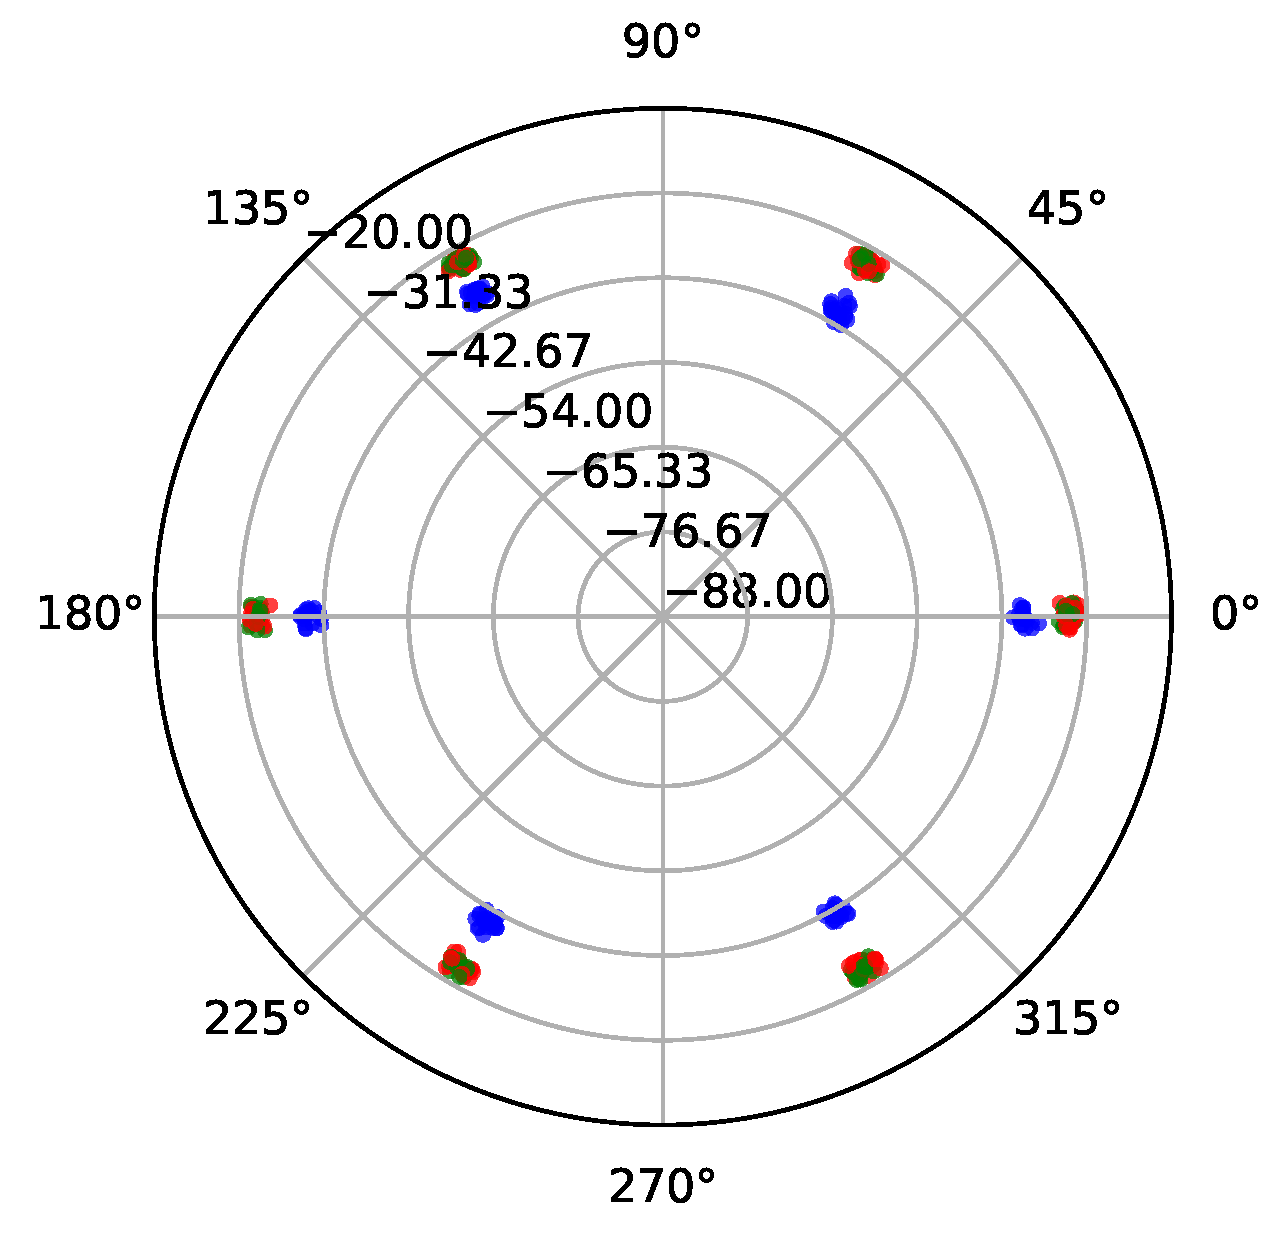
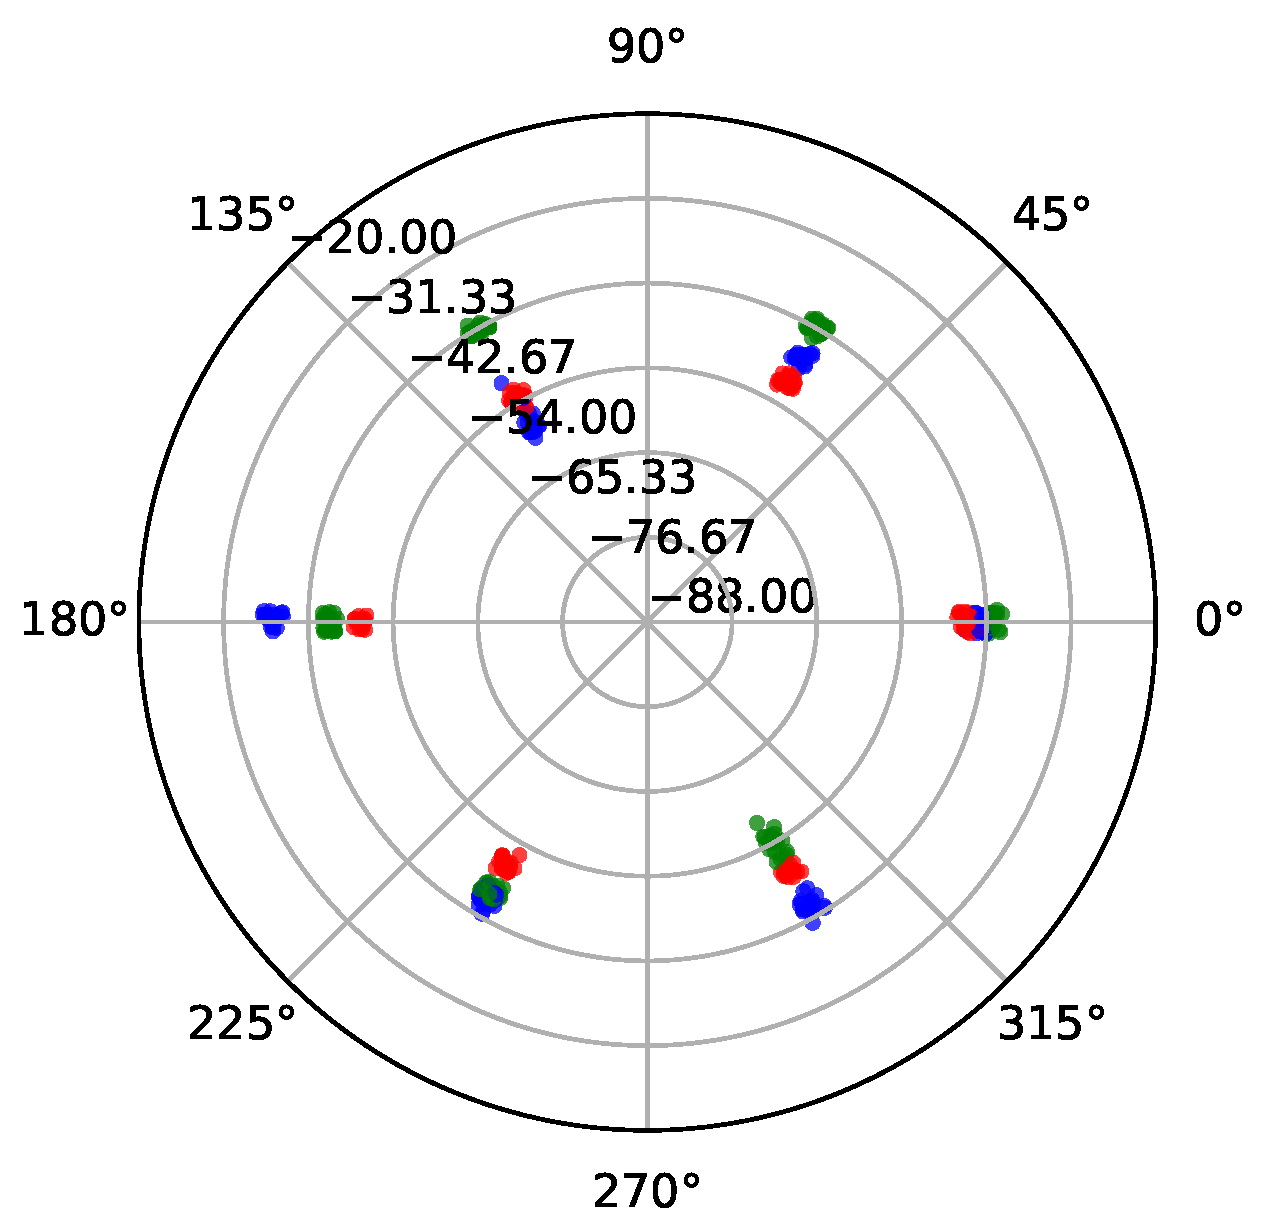
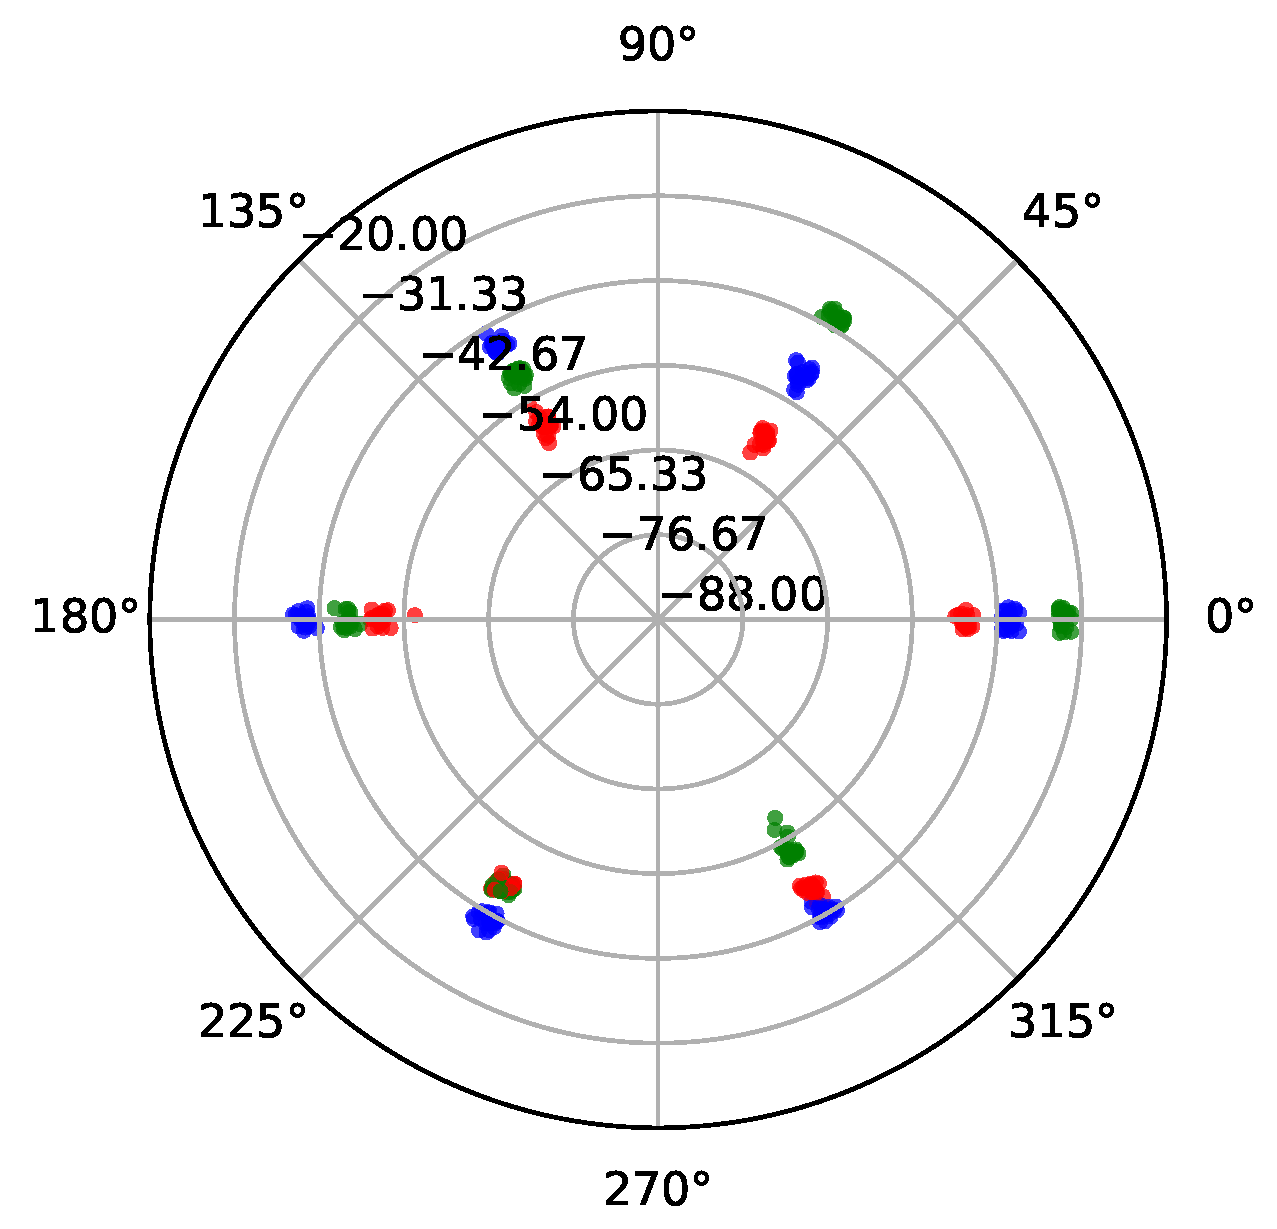
5.1. Antenna Radiation Patterns

The first measurement configuration is designed to observe antenna radiation patterns. In this configuration, two pairs of ESP32 modules are used to take RSS measurements. One pair is equipped with the onboard PCB antennas and the other pair is equipped with the external omnidirectional antennas as shown in Figure 2. In the measurement setup, the transmitter (i.e., beacon node) and receiver (i.e., scanner node) devices are mounted on two separate tripods that are 1 m apart. The transmitter remains stationary throughout measurement. The receiver antenna is installed at position P0 on the panning measurement platform and the platform is rotated to six different angular positions with an angular step of 60°. At each angular position, 20 measurements are collected for each of the three advertising channels. The RSS measurement results are shown in Figure 8 and Figure 9. From the results, we can observe that the onboard PCB antenna demonstrates clear directionality while the external antenna has a good omnidirectional radiation pattern. The strong directionality of the onboard PCB antenna will introduce large errors and uncertainty in RSS measurements so that the external omnidirectional antenna should be used in channel measurements for path loss modeling. Another observation is that the differences in the RSS measurement data among the three advertising channels (i.e., channels 37, 38, and 39) are clearly observable even at 1 m distance, which is partly due to the unequal gains across the frequency spectrum in the device signal chain. The external 6 dBi omnidirectional antenna also provides extra gain as compared to the onboard PCB antenna, which effectively increases the coverage of the BLE transceivers during measurement. If not stated otherwise, the measurement data presented in the rest of this paper are all collected using the external 6 dBi omnidirectional antenna.

5.2. Small-Scale Multipath Fading

To examine the small-scale multipath fading effects in indoor environments, we placed the transmitter (i.e., beacon node) and receiver (i.e., scanner node) devices (both with the external 6 dBi omnidirectional antenna) by 4 m apart and conducted two experiments. In the first experiment, receiver antenna is installed at the position P1 of the measurement platform shown in Figure 7. The platform is rotated to six different angular positions with an angular step of 60° while the rotation center of the measurement platform is at the point P0. Such a measurement process is equivalent to moving the receiver antenna to each of the positions from P1 to P6 without rotating the measurement platform. At each angular position, 20 measurements are collected from each of the three advertising channels and the RSS measurement results are shown in Figure 10. From the results, we can observe that the RSS measurement data collected from different advertising channels undergo different attenuation and fading effects. In addition, small positional shifts caused by rotating the antenna around P0 result in variations as large as 15 to 20 dB in RSS measurements. If not compensated properly, such small-scale fading will introduce large fitting errors and uncertainty in path loss models. Typically, in path loss modeling, the small-scale fading is averaged out with multiple measurements in close vicinity of each measurement location with small random positional shifts. Multiple measurements can also be collected at each location in a more systematic way similar to our measurement setup with a rotating platform.
However, taking multiple measurements using one receiver device in local vicinity of every location is rather cumbersome in practice. To address this issue, in this research, we installed six receivers on the measurement platform with their antennas positioned at P1–P6 shown in Figure 7. During measurement, for each packet transmitted by the transmitter device, six receivers will receive and measure the RSS simultaneously and the measurement data are forwarded to the sink node using the Bluetooth mesh networking protocol. As described in Section 4.3, the advertising message contains a message sequence ID number in the payload, which is used in postprocessing to match the RSS measurements collected simultaneously from multiple receiver nodes. A sample measurement result is shown in Figure 11, where variations (i.e., small-scale fading effects) among six receivers are clearly visible. In postprocessing for path loss modeling, the data collected from six receivers are averaged (or, more accurately, combined as discussed in the next section) to eliminate the random variations caused by small-scale fading effects.

5.3. Path Loss Models

We have conducted extensive measurements in the ESPS Lab (B216) and a few other labs in the surrounding areas at the EE Department, UNT, as shown in Figure 12. Transmitter (i.e., beacon node) device is installed on a tripod and receiver (i.e., scanner node) devices are installed on the panning measurement platform shown in Figure 6. During measurement, transmitter is placed at the positions A, B, and C in the lab B216. For each transmitter position, receiver units are moved around the area and the RSS measurements are collected at each of the receiver positions. Some actual receiver positions are marked with “x” in the diagram shown in Figure 12, although there are many more receiver positions in the corridor and Lab B207 and Lab B217 that are located beyond the area that is shown in the diagram.
During measurement, all six receivers were turned on to receive signals from the transmitter and measure RSS of the received signals. At each of the receiver positions, 60 RSS measurement data are collected by each of the six receivers, including 20 measurements for each of the three advertising channels. All measurement data collected from one of the six receivers are shown in Figure 13. From the scatter plot shown in Figure 13, we can observe slightly different trends for the data measured at the distances below 10 m and above 10 m, which indicates that a two-segment partitioned path loss model defined in (3) might be more appropriate than the non-partitioned model in (1). In addition, we can also observe a few outliers in the measurement data, which may significantly affect the path loss models derived using linear regression methods. Therefore, in the following, we used median, instead of average, when combining multiple measurements at each receiver position to reduce small-scale fading effects. It is well known that median is more robust to outliers statistically than average.
As mentioned earlier, at each of the receiver positions, 60 RSS measurements are collected by each of the six receivers, including 20 measurements from each of the three advertising channels. Figure 14 presents the path loss models derived using one random data sample from only one receiver and the model parameter values are summarized in Table 1. From the results shown in Figure 14 and Table 1, we can observe that the RSS measurement data collected from different advertising channels conform to different path loss models. In generating the path loss model plots in Figure 14, we plotted RSS versus distance since the measured RSS value is the received signal power in dBm unit. The RSS P ¯ r ( d ) is defined in (1) with reference to the path loss L ( d ) . Because the path loss L ( d ) = P t [ dBm ] P ¯ r ( d ) [ dBm ] when both P t and P ¯ r ( d ) are in dBm unit, we can easily transform the path loss model formula in (1) to the following,
P ¯ r ( d ) [ dBm ] = P ¯ r ( d 0 ) [ dBm ] 10 α log 10 ( d d 0 ) χ .
The two-segment path loss model defined in (3) can also be transformed similarly. The RSS at the reference distance d 0 = 1 m, i.e., P ¯ r ( 1 ) , is first determined through measurements. Then, measurement data are collected by moving receivers to different locations as described earlier. Each measurement data consists of the RSS measurement, receiver ID, and the message sequence ID, which are used in postprocessing to identify and group the measurements collected from multiple receivers simultaneously. The distances between the transmitter and each of the receiver locations are determined either by direct tape measurement wherever possible or through building layout map-based calculations. Measurement data are then used to determine the model parameters α and σ χ using the linear regression method [8,19]. When performing linear regression based on the model in (4), the measurement data collected from N locations are organized into the 2-D vectors on the x-y plane,
( x [ n ] , y [ n ] ) = ( 10 log 10 ( d [ n ] d 0 ) , P ¯ r ( d [ n ] ) [ dBm ] ) ,
for n = 1 , 2 , . . . , N . The slope α is determined through linear regression line fitting with the measurement dataset. However, the intercept P ¯ r ( d 0 ) [ dBm ] is determined through separate measurements, and it is not fitted through linear regression. As discussed in Section 3, in path loss modeling, P ¯ r ( d [ n ] ) [ dBm ] is the local average RSS measurement at the nth location. The local average is determined by combining multiple RSS measurements through diversity combining techniques over time, frequency, or space to remove small-scale fading effects [8,19]. Since the results shown in Figure 14 are derived using one random data sample from only one receiver, these results represent the case where no local averaging or diversity combining is employed. In the rest of this section, we present several path loss modeling results derived using different local diversity combining schemes. By comparing these results, we intend to identify the one that performs the best in reducing the residue linear regression fitting errors.
Figure 15 presents the path loss models derived using median of 6 random data samples from one receiver, which represents time diversity combining since 6 data samples are collected over time by the same receiver at the same location. The model parameters are summarized in Table 2. Comparing the results in Figure 14 and Figure 15, we can see that time diversity combining is ineffective in reducing variations in the RSS measurement data. Such an observation is reasonable intuitively since there were no visible movements around the measurement locations and thus the channel was generally static without noticeable time-dependent variations.
In comparison, Figure 16 presents the path loss models derived using the median of one random data sample from each of the six receivers and the model parameter values are summarized in Table 3. Figure 17 presents the path loss models derived using the median of six random data samples from each of the six receivers and the model parameter values are summarized in Table 4. Since six receivers are dispersed in space as they are installed on the panning measurement platform as shown in Figure 6, combining data from six receivers by calculating median of the data is equivalent to space diversity combining. Space diversity combining is typically used to remove small-scale fading effects in the received signals. Comparing the results in Figure 16 and Figure 17 to that in Figure 14 and Figure 15, we can clearly observe that space diversity combining can effectively reduce small-scale fading effects and thus the resulting path loss models have much smaller residual linear regression fitting errors.
As we mentioned earlier, combining multiple data from one receiver at each location (i.e., time diversity combining) has less impact in reducing variations in data due to the static condition of the channel during our measurement. To make a better observation of this effect, in Figure 18 and Figure 19, we present the standard deviation values of linear regression fitting errors (i.e., σ χ 0 for the path loss models from 1 to 10 m and σ χ 1 for the path loss models above 10 m) with respect to the sample size, where the sample size is defined as the number of data samples from each of the six receivers. At each of the receiver positions, 60 RSS measurements are collected by each of the six receivers, including 20 measurements for each of the three advertising channels. Therefore, to generate the results in Figure 18 and Figure 19, for each sample size N s , we repeated the path loss modeling process 10 times by randomly drawing N s number of data from the available dataset. Then, the mean of σ χ 0 and σ χ 1 are plotted versus sample size in Figure 18 and Figure 19, respectively. The vertical lines on each result data point in the figures represent the plus/minus standard deviation of σ χ 0 and σ χ 1 over several repeated modeling processes using randomly selected data samples.
From the results shown in Figure 18 and Figure 19, we can observe that when the data from each individual advertising channel are used in modeling, the sample size almost has no impact on the standard deviation of the linear regression residual fitting errors (i.e., σ χ 0 and σ χ 1 ). In addition, when the sample size is one, the results of all channels (i.e., without differentiating three advertising channels) are not as good as the ones obtained using individual advertising channels, which confirms some findings in the literature (see for example [5,15]). However, when RSS data are collected without differentiating three advertising channels, it is possible to decrease σ χ 0 and σ χ 1 by increasing the sample size, which can be observed from the results marked as all channels in Figure 18 and Figure 19.
From the results, we can also conclude that a sample size of 3 is a reasonable choice to consider in practice. When sample size is larger than 3, receivers will need to take more time to collect data and there is almost no visible decreases in the values of σ χ 0 and σ χ 1 as shown in the figures. Such an observation is critical and immensely valuable in practice because it indicates that using six-receiver configuration (as shown in Figure 6) and a sample size of three or more, it is better to randomize three advertising channels without differentiating the channels. Such an approach is inherently space-time-frequency diversity combining since at each location measurement data are combined by determining median of the data over space (using six receivers), time (multiple measurements by each receiver), and frequency (using three widely spaced advertising channels). Furthermore, almost all the BLE devices that are available in the market do not provide an easy way to differentiate advertising packets received from different channels, which is why in this research we programmed ESP32 BLE development boards with our own custom designed communication protocols to make it possible to parse channel information from received packets. Therefore, randomizing three advertising channels without the need to parse channel information from received packets represents a major advantage in practical implementations.
Reducing the path loss model residual fitting errors (i.e., σ χ 0 and σ χ 1 ) leads to more accurately correlating RSS measurements to distance. Such an improvement is fundamentally important in achieving reliable performance when using localization techniques that are based on RSS measurements and path loss models. Therefore, the six-receiver configuration and the space-time-frequency diversity combining scheme that are presented in this paper can be especially useful in practice to achieve improved performance with the RSS-based localization techniques. Technical details and performance studies of the RSS-based ranging and location fingerprinting methods can be found in [4,5,6,7,9,10,17,27] and the references therein.

6. Summary and Conclusions

In this paper, we presented a systematic study of indoor multipath radio channel characteristics using a RSS measurement system designed with BLE devices and Bluetooth mesh networking technology. The main advantage of the measurement system is that it can be conveniently configured to support simultaneous measurements with multiple transmitter and receiver devices in flexible topologies. We have also designed a communication protocol to associate channel ID information to advertising messages, which is necessary to enable channel-aware multi-device RSS measurements given the fact that standard BLE devices do not report which advertising channel is used for publishing a specific message. Based on channel measurement and analysis, we demonstrated that small-scale fading effects introduce large random variations in RSS measurements, making RSS unreliable for localization purposes. Our results have also confirmed that three advertising channels undergo different fading effects, conforming to different path loss models. Thus, mixing RSS measurements from three advertising channels results in larger linear regression residual fitting errors. However, we showed that with a new six-receiver configuration, it is possible to reduce the residual fitting errors in path loss models through a space-time-frequency diversity combining scheme, which leads to more accurately correlating RSS measurements to distance and thus to effectively improving the performance of the RSS-based localization techniques. With the proposed method, three advertising channels are randomized and there is no need to parse channel information from received packets. Such a finding is especially valuable because it indicates that it is possible to implement the proposed multi-receiver configuration and the diversity combining scheme for RSS-based localization applications using commercial off-the-shelf standard BLE devices.

Author Contributions

Conceptualization, Y.C. and X.L.; methodology, Y.C. and X.L.; software, Y.C. and X.L.; validation, Y.C., H.K. and X.L.; formal analysis, Y.C., H.K. and X.L.; resources, X.L.; writing—original draft preparation, Y.C. and X.L.; writing—review and editing, Y.C., H.K. and X.L.; visualization, Y.C. and X.L.; supervision, X.L.; project administration, X.L. All authors have read and agreed to the published version of the manuscript.

Funding

This work was supported in part by the Center for Integrated Intelligent Mobility Systems (CIIMS) at University of North Texas (UNT), Denton, TX, USA.

Conflicts of Interest

The authors declare no conflict of interest.

References

  1. Alletto, S.; Cucchiara, R.; del Fiore, G.; Mainetti, L.; Mighali, V.; Patrono, L.; Serra, G. An indoor location-aware system for an IoT-based smart museum. IEEE Internet Things J. 2016, 3, 244–253. [Google Scholar] [CrossRef]
  2. Jeon, K.E.; She, J.; Soonaswad, P.; Ng, P.C. BLE beacons for Internet of Things applications: Survey, challenges, and opportunities. IEEE Internet Things J. 2018, 5, 811–828. [Google Scholar] [CrossRef]
  3. Bluetooth SIG. Enhancing Bluetooth Location Services with Direction Finding. Bluetooth Resources. 2019. Available online: https://www.bluetooth.com (accessed on 1 November 2020).
  4. Spachos, P.; Plataniotis, K.N. BLE beacons for indoor positioning at an interactive IoT-Based smart museum. IEEE Syst. J. 2020, 14, 3483–3493. [Google Scholar] [CrossRef] [Green Version]
  5. Faragher, R.; Harle, R. Location fingerprinting with Bluetooth Low Energy beacons. IEEE J. Sel. Areas Commun. 2015, 33, 2418–2428. [Google Scholar] [CrossRef]
  6. Li, X. RSS-based location estimation with unknown pathloss model. IEEE Trans. Wirel. Commun. 2006, 5, 3626–3633. [Google Scholar] [CrossRef]
  7. Li, X. Collaborative localization with received signal strength in wireless sensor networks. IEEE Trans. Veh. Technol. 2007, 56, 3807–3817. [Google Scholar]
  8. Rappaport, T.S. Wireless Communications: Principles and Practice, 2nd ed.; Prentice Hall PTR: Upper Saddle River, NJ, USA, 2002. [Google Scholar]
  9. Pahlavan, K.; Li, X.; Ylianttila, M.; Chana, R.; Latva-aho, M. An overview of wireless indoor geolocation techniques and systems. In IFIP International Conference on Mobile and Wireless Communication Networks; Springer: Berlin/Heidelberg, Germany, 2000. [Google Scholar]
  10. Pahlavan, K.; Li, X.; Makela, J.-P. Indoor geolocation science and technology. IEEE Commun. Mag. 2002, 40, 112–118. [Google Scholar] [CrossRef]
  11. Al Nuaimi, K.; Kamel, H. A survey of indoor positioning systems and algorithms. In Proceedings of the International Conference on Innovations in Information Technology, Abu Dhabi, United Arab Emirates, 25–27 April 2011. [Google Scholar]
  12. Yang, C.; Shao, H.-R. WiFi-based indoor positioning. IEEE Commun. Mag. 2015, 53, 150–157. [Google Scholar] [CrossRef]
  13. Liu, F.; Liu, J.; Yin, Y.; Wang, W.; Hu, D.; Chen, P.; Niu, Q. Survey on WiFi-based indoor positioning techniques. IET Commun. 2020, 14, 1372–1383. [Google Scholar] [CrossRef]
  14. Nikoukar, A.; Abboud, M.; Samadi, B.; Güneş, M.; Dezfouli, B. Empirical analysis and modeling of Bluetooth low-energy (BLE) advertisement channels. In Proceedings of the 2018 17th Annual Mediterranean Ad Hoc Networking Workshop (Med-Hoc-Net), Capri, Italy, 20–22 June 2018. [Google Scholar]
  15. Paterna, V.C.; Auge, A.C.; Aspas, J.P.; Bullones, M.A.P. A Bluetooth Low Energy indoor positioning system with channel diversity, weighted trilateration and Kalman filtering. Sensors 2017, 17, 2927. [Google Scholar] [CrossRef] [PubMed] [Green Version]
  16. Huang, B.; Liu, J.; Sun, W.; Yang, F. A robust indoor positioning method based on Bluetooth Low Energy with separate channel information. Sensors 2019, 19, 3487. [Google Scholar] [CrossRef] [PubMed] [Green Version]
  17. Zanella, A.; Bardella, A. RSS-based ranging by multichannel RSS averaging. IEEE Wirel. Commun. Lett. 2014, 3, 10–13. [Google Scholar] [CrossRef]
  18. Akl, R.; Tummala, D.; Li, X. Indoor propagation modeling at 2.4 GHz for IEEE 802.11 networks . In Proceedings of the International Multi-Conference on Wireless and Optical Communications, Banff, AB, Canada, 3–5 July 2006. [Google Scholar]
  19. Pahlavan, K.; Levesque, A.H. Wireless Information Networks; John Wiley & Sons: Hoboken, NJ, USA, 1995. [Google Scholar]
  20. Li, X.; Pahlavan, K. Super-resolution TOA estimation with diversity for indoor geolocation. IEEE Trans. Wirel. Commun. 2004, 3, 224–234. [Google Scholar] [CrossRef]
  21. Torvmark, K. Three flavors of Bluetooth: Which one to choose? In Texas Instruments White Paper; Texas Instruments: Dallas, TX, USA, 2014. [Google Scholar]
  22. Hernandez-Solana, A.; Perez-Diaz-de-Cerio, D.; Garcia-Lozano, M.; Bardaji, A.V.; Valenzuela, J.-L. Bluetooth Mesh Analysis, Issues, and Challenges. IEEE Access 2020, 8, 53784–53800. [Google Scholar] [CrossRef]
  23. Mackey, A.; Spachos, P. Performance evaluation of beacons for indoor localization in smart buildings. In Proceedings of the IEEE Global Conference on Signal and Information Processing (GlobalSIP), Montreal, QC, Canada, 14–16 November 2017. [Google Scholar]
  24. Espressif, ESP32-DevKitC v4 Getting Started Guide. ESP-IDF Programming Guide. 2020. Available online: https://docs.espressif.com/projects/esp-idf/en/latest/esp32/hw-reference/esp32/get-started-devkitc.html (accessed on 1 November 2020).
  25. Espressif, ESP-BLE-MESH Architecture. ESP-IDF Programming Guide. 2020. Available online: https://docs.espressif.com/projects/esp-idf/en/latest/esp32/ (accessed on 1 November 2020).
  26. Bluetooth SIG. Mesh Profile, Revision v1.0.1, Bluetooth Specification 2019. Available online: https://www.bluetooth.com/specifications/specs/mesh-profile-1-0-1/ (accessed on 1 November 2020).
  27. Li, X. Collaborative multi-sensor tracking in mobile wireless sensor networks. Int. J. Sens. Netw. 2010, 8, 233–246. [Google Scholar] [CrossRef]
Figure 1. BLE and Wi-Fi channels at the unlicensed 2.4 GHz ISM band.
Network 01 00018 g001
Figure 2. (a) ESP32-WROOM-32U and the 2.4 GHz 6 dBi omnidirectional antenna, and (b) ESP32-WROOM-32D development board with the onboard PCB antenna.
Network 01 00018 g002
Figure 3. System architecture of the measurement mesh network.
Network 01 00018 g003
Figure 4. Communication protocol in the mesh network for data collection.
Network 01 00018 g004
Figure 5. Modified adverting event for channel-aware advertising and scanning of the beacon advertising messages.
Network 01 00018 g005
Figure 6. A custom designed 3D-printed panning measurement platform with 360° scale for horizontal rotation.
Network 01 00018 g006
Figure 7. Antenna positions on the measurement platform.
Network 01 00018 g007
Figure 8. Directionality of ESP32 with the onboard PCB antenna. RSS measurements in dBm unit collected at different angular positions are plotted in different colors with red for channel 37, green for channel 38, and blue for channel 39. Transmitter and receiver devices are 1 m apart in distance.
Network 01 00018 g008
Figure 9. Directionality of ESP32 with the external 6 dBi omnidirectional antenna. RSS measurements in dBm unit collected at different angular positions are plotted in different colors with red for channel 37, green for channel 38, and blue for channel 39. Transmitter and receiver devices are 1 m apart in distance.
Network 01 00018 g009
Figure 10. RSS measurements in dBm unit using one receiver antenna at the positions from P1 to P6 on the measurement platform. Transmitter and receiver devices are 4 m apart in distance and both devices use the external 6 dBi omnidirectional antenna.
Network 01 00018 g010
Figure 11. RSS measurements in dBm unit using six receiver antennas installed at the positions P1 to P6 on the measurement platform. Transmitter and receiver devices are 4 m apart in distance and all devices use the external 6 dBi omnidirectional antenna.
Network 01 00018 g011
Figure 12. Measurement positions in ESPS Lab (B216) and surrounding areas.
Network 01 00018 g012
Figure 13. Scatter plot of all RSS measurement data that are collected from one of the six receivers.
Network 01 00018 g013
Figure 14. Two-segment path loss models derived using one random data sample from only one receiver.
Network 01 00018 g014
Figure 15. Two-segment path loss models derived using median of six random data samples from only one receiver.
Network 01 00018 g015
Figure 16. Two-segment path loss models derived using the median of one random data sample from each of the six receivers.
Network 01 00018 g016
Figure 17. Two-segment path loss models derived using the median of six random data samples from each of the six receivers.
Network 01 00018 g017
Figure 18. Mean of σ χ 0 in the two-segment path loss models derived using the median of data samples from six receivers. The vertical lines on each result data point in the figure represent the plus/minus standard deviation of σ χ 0 over several repeated modeling processes using randomly selected data samples.
Network 01 00018 g018
Figure 19. Mean of σ χ 1 in the two-segment path loss models derived using the median of data samples from six receivers. The vertical lines on each result data point in the figure represent the plus/minus standard deviation of σ χ 1 over several repeated modeling processes using randomly selected data samples.
Network 01 00018 g019
Table 1. Two-segment path loss model parameter values derived using one random data sample from only one receiver.
P ¯ r ( 1 ) [ dBm ] α 0 σ χ 0 α 1 σ χ 1
Channel 37−372.135.956.557.40
Channel 38−352.256.506.495.63
Channel 39−292.377.216.245.86
All channels−351.916.977.797.18
Table 2. Two-segment path loss model parameter values derived using median of six random data samples from only one receiver.
P ¯ r ( 1 ) [ dBm ] α 0 σ χ 0 α 1 σ χ 1
Channel 37−372.145.906.987.17
Channel 38−352.286.486.595.39
Channel 39−292.427.405.985.68
All channels−352.186.106.144.06
Table 3. Two-segment path loss model parameter values derived using the median of one random data sample from each of the six receivers.
P ¯ r ( 1 ) [ dBm ] α 0 σ χ 0 α 1 σ χ 1
Channel 37−362.133.027.034.67
Channel 38−352.083.666.674.41
Channel 39−292.304.036.354.86
All channels−352.024.877.265.24
Table 4. Two-segment path loss model parameter values derived using the median of six random data samples from each of the six receivers.
P ¯ r ( 1 ) [ dBm ] α 0 σ χ 0 α 1 σ χ 1
Channel 37−362.133.327.215.00
Channel 38−352.113.546.474.71
Channel 39−292.303.936.555.06
All channels−351.922.756.784.35
Publisher’s Note: MDPI stays neutral with regard to jurisdictional claims in published maps and institutional affiliations.

