1. Introduction
The simultaneous occurrence of geometric frustration, competing interactions, and external magnetic fields can result in the appearance of a rich variety of magnetic states with different spin configurations [
1,
2,
3]. A very well-known geometrical frustrated system is the Shastry–Sutherland lattice, which can be realized in a group of layered compounds [
3]. The Shastry–Sutherland model has also been realized in systems displaying magnetization plateaus in the presence of a magnetic field [
3,
4,
5].
Rare-earth tetraborides with the general composition
RB
4 (
R = La-Lu, Pm and Eu excepted) are isostructural, and their crystal structures are tetragonal (space group
P4/
mbm) [
6,
7,
8]. Most
RB
4 have an AF ground state [
9], and they may be considered as an experimental realization of the Shastry–Sutherland frustrated system model [
10,
11]. The geometrical frustration in them is due to the presence of two antiferromagnetic exchange interactions:
J1 between the nearest neighboring (NN)
R atoms and
J2 between the next-nearest neighbor (NNN) [
11,
12]. Although many frustrated compounds are insulating, rare-earth tetraborides are known to be good metals, and their magnetic behavior is determined by Ruderman–Kittel–Kasuya–Yosida (RKKY) interactions [
13].
The AF ordering temperature (
TN) in the
RB
4 series ranges from
TN∼7 K for
R = Ho to 44 K for
R = Tb [
8]. Some compounds have extra transitions; e.g.,
R = Nd, Sm, Tb, Dy, Ho, and Tm, and in some cases, these extra transitions are associated with quadrupolar orbital fluctuation [
14,
15]. ErB
4 undergoes an AF transition at
TN∼15.4 K, and it has a strong Ising-like anisotropy with the easy axis along the [001] direction. GdB
4 displays an AF transition at
TN∼42 K, the easy axis is located on the
ab-plane, and the system is of Heisenberg-type. Therefore, the magnetic structure in Gd
1−xEr
xB
4 mixed compounds should be informed by the competing anisotropies. For magnetic fields parallel or perpendicular to the [001] direction of ErB
4 below
TN, the
M ×
H curves exhibit a plateau for
M =
MS/2, where
MS is the saturation magnetization [
11,
16]. On the other hand, the
M ×
H curves for GdB
4 below
TN do not show plateaus, perhaps due to the small magnetic anisotropy when compared to the other compounds of the
RB
4 family [
17].
The origin of the magnetization plateaus is still not fully understood, though they are thought to result from the interplay between anisotropy, Zeeman energy, and frustration, just as other complex magnetic behaviors. For example, in the case of TmB
4, the applied magnetic field induces an ordered phase with stripes reminiscent of domain boundaries [
18]. The origin of the “plateau phase” in ErB
4 is attributed to the competition between the Zeeman energy and the strong anisotropy [
11]. Therefore, the change in the delicate balance of these energies can lead to the appearance of new phases, making the magnetic phase diagram of these compounds rich and complex. Given the sensitivity of the overall magnetic behavior to the competing interactions, a study of Gd
1−xEr
xB
4 solid solutions is in order, since it could help to identify the energetics involved in the various magnetic interactions.
In the case of the Gd
1−xEr
xB
4 compounds, in addition to the competing anisotropies, which can induce non-conventional spin alignments, the presence of frustration adds a new complication which can result in a complex phase diagram. Systems with competing anisotropies are a matter of intense research [
19,
20,
21]. It has been shown that solid solutions of isostructural materials with orthogonal anisotropies, subjected to a small concentration of one species, can have spins aligned parallel or perpendicular to the magnetic field, depending on the dominant ion and orientation of the magnetic field. On the other hand, in the intermediate range of concentrations, a new mixed phase with spins pointing neither parallel nor perpendicular to the original easy axis can be induced [
22].
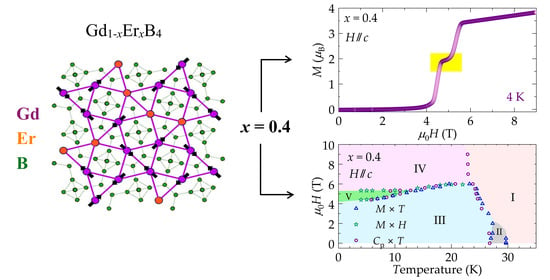
The goal of this study was to map out the magnetic phases of Gd1−xErxB4 single crystals resulting from the convolution of magnetic frustration and competing anisotropies. High-quality single crystals of Gd1−xErxB4 were grown using the flux method and characterized for single-phase composition, crystal quality, and orientation through Laue X-ray and X-ray powder diffraction methods. These single-crystal samples were studied by means of measurements of DC magnetization (M) and specific heat (Cp) as a function of temperature (T) and magnetic field (H). These experiments were performed using a commercial Physical Property Measurement System (PPMS) from Quantum Design. The phase boundary lines were identified in the H × T phase diagram, and different spin configurations are proposed.
3. Experimental Results
Figure 1 shows the specific heat
Cp(
T,
H) for the Gd
1−xEr
xB
4 (
x = 0.2 and 0.4) compositions. For
H = 0 and under the partial substitution of Er
3+ for Gd
3+, the Néel temperature (
TN) decreases from 41.7 K (GdB
4) to ~32 K (
x = 0.2) and to ~27 K (
x = 0.4). For magnetic fields up to 9.0 T, applied perpendicular to the c-axis,
TN shifts slightly to lower temperatures for the
x = 0.2 and 0.4 compositions, while the overall behavior of
Cp(
T,
H) remains the same, as shown in the lower panels of
Figure 1a,b. However, a second shallow maximum centered near 12 K (
Tm) develops below
TN in the
Cp data for
, in the 2.9–4.5 T field range for
x = 0.2, and in the 4.4–6.0 T range
x = 0.4, as shown in
Figure 1a and
Figure 1b, respectively. Small bumps in the
Cp data also developed near
Tm for the
ab-plane. In the pristine GdB
4 compound, this characteristic was attributed to the Schottky anomaly [
27], which is independent of the applied magnetic field [
28], and to a hidden transition below which an unusually large magnetoresistance is observed [
28]. In the case of Gd
1−xEr
xB
4, this feature exhibits a slight dependence on the magnetic field for both compositions; as this feature is more responsive to the magnetic field in the
x = 0.4 samples, it is possible that it arises from competing anisotropies.
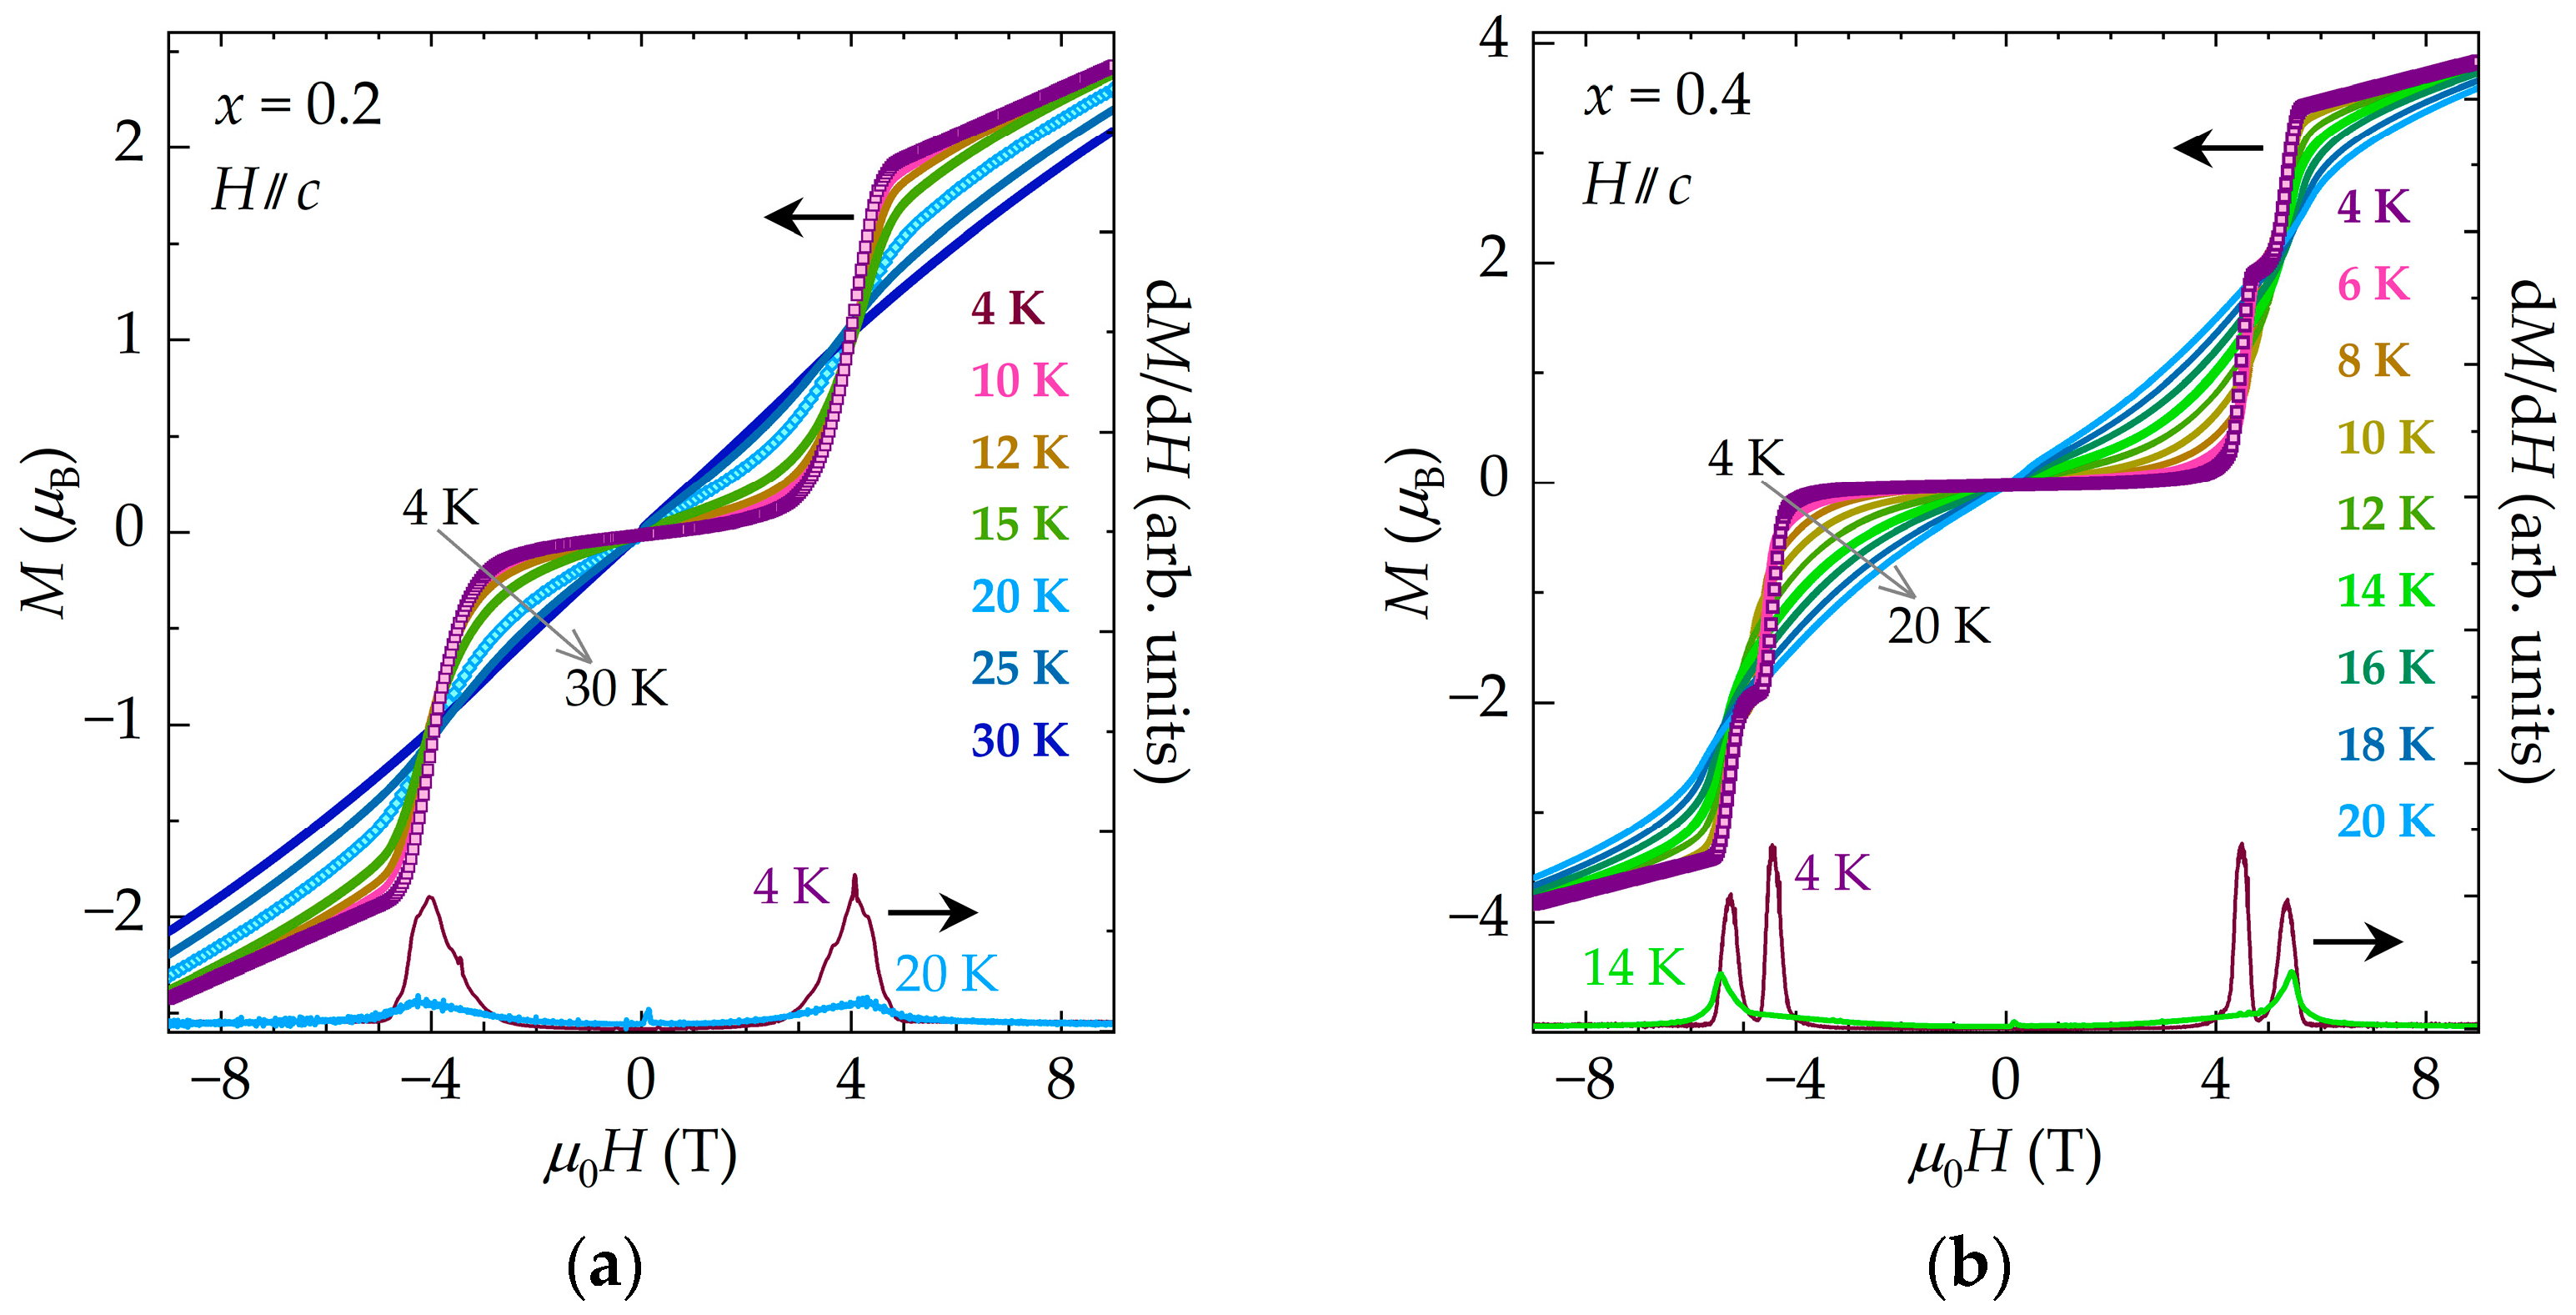
Isothermal magnetization curves
M vs.
H below
TN for
for the
x = 0.2 and
x = 0.4 samples are shown in
Figure 2 and
Figure S1 in the Supplementary Materials. Unlike ErB
4, for which the
M(
H) curves exhibit a magnetization plateau near
MS/2 at temperatures as low as 1.5 K [
11], this plateau could not be identified in the Gd
0.8Er
0.2B
4 at temperatures as low as 2 K (
Figure S1a); only a spin realignment field-induced paramagnetic (FIP) transition could be identified near
HFIP ~4 T, where the Gd
3+ moments flip away from the ab-plane. The derivative d
M/d
H (
Figure 2) can be used to monitor the FIP transition and to confirm that a plateau phase is not present. The magnetic phase in fields exceeding
HFIP probably corresponds to a fully saturated moment
J = 15/2 for Er
3+. Increasing temperatures softened the FIP transitions, meaning that the corresponding features in the d
M/d
H curves could no longer be observed for
T ≥ 30 K.
On the other hand, the emergence of the plateau phase (PP) can be clearly seen in the
x = 0.4 samples for
between ~4.4 and ~5.5 T and
T = 4 K, as shown in
Figure S1b. Two features in d
M/d
H are consistent with the onset and outset of the PP phase, respectively. The transition at ~5.5 T is nearly independent of temperature, and the corresponding feature in d
M/d
H can be identified up to ~12 K. Higher temperatures result in a less robust PP transition, meaning that above ≈ 14 K, only the FIP transition can be identified. The maxima in the d
M/d
H curves characterizing the FIP transitions are clearly identifiable in the isotherms for
T ≤ 24 K. The minor features observed in the d
M/d
H curves, close to
H = 0 in both samples, are attributed to changes in slope arising from the presence of remanent magnetization and the coercive field within the magnetic hysteresis loops (
Figure S2).
Along the c-axis, the magnetization above HFIP increases linearly with the magnetic field for the x = 0.4 samples, and no indication of saturation could be found up to 9 T, the highest field of this experiment. Considering that the Er3+ saturation moment () is 9 and that only 40% of the total magnetization is due to the Er3+, it is expected that Er3+ contributes ≈ 3.6 to the total magnetization. Therefore, the jump observed in magnetization as it transitions to the PP region corresponds to approximately half of the Er3+ ions changing orientation and aligning with the external magnetic field.
The magnetization curves obtained for
[
25] exhibited just a monotonic increase in magnetization with the applied field for the both
x = 0.2 and 0.4 samples (
Figure S1). This behavior is consistent with the specific heat measurements shown in
Figure 1 (lower panels a and b), for which no field-induced phase transition was observed. The reorientation of the spins in GdB
4 [
17] and the onset of metamagnetic transitions in ErB
4 [
11] take place under applied magnetic fields perpendicular to the
c-axis, typically exceeding 12 T. Given that the highest field in our experiment was 9 T, if a similar behavior took place in the Gd
1−xEr
xB
4 compounds, we would not have been able to observe it.
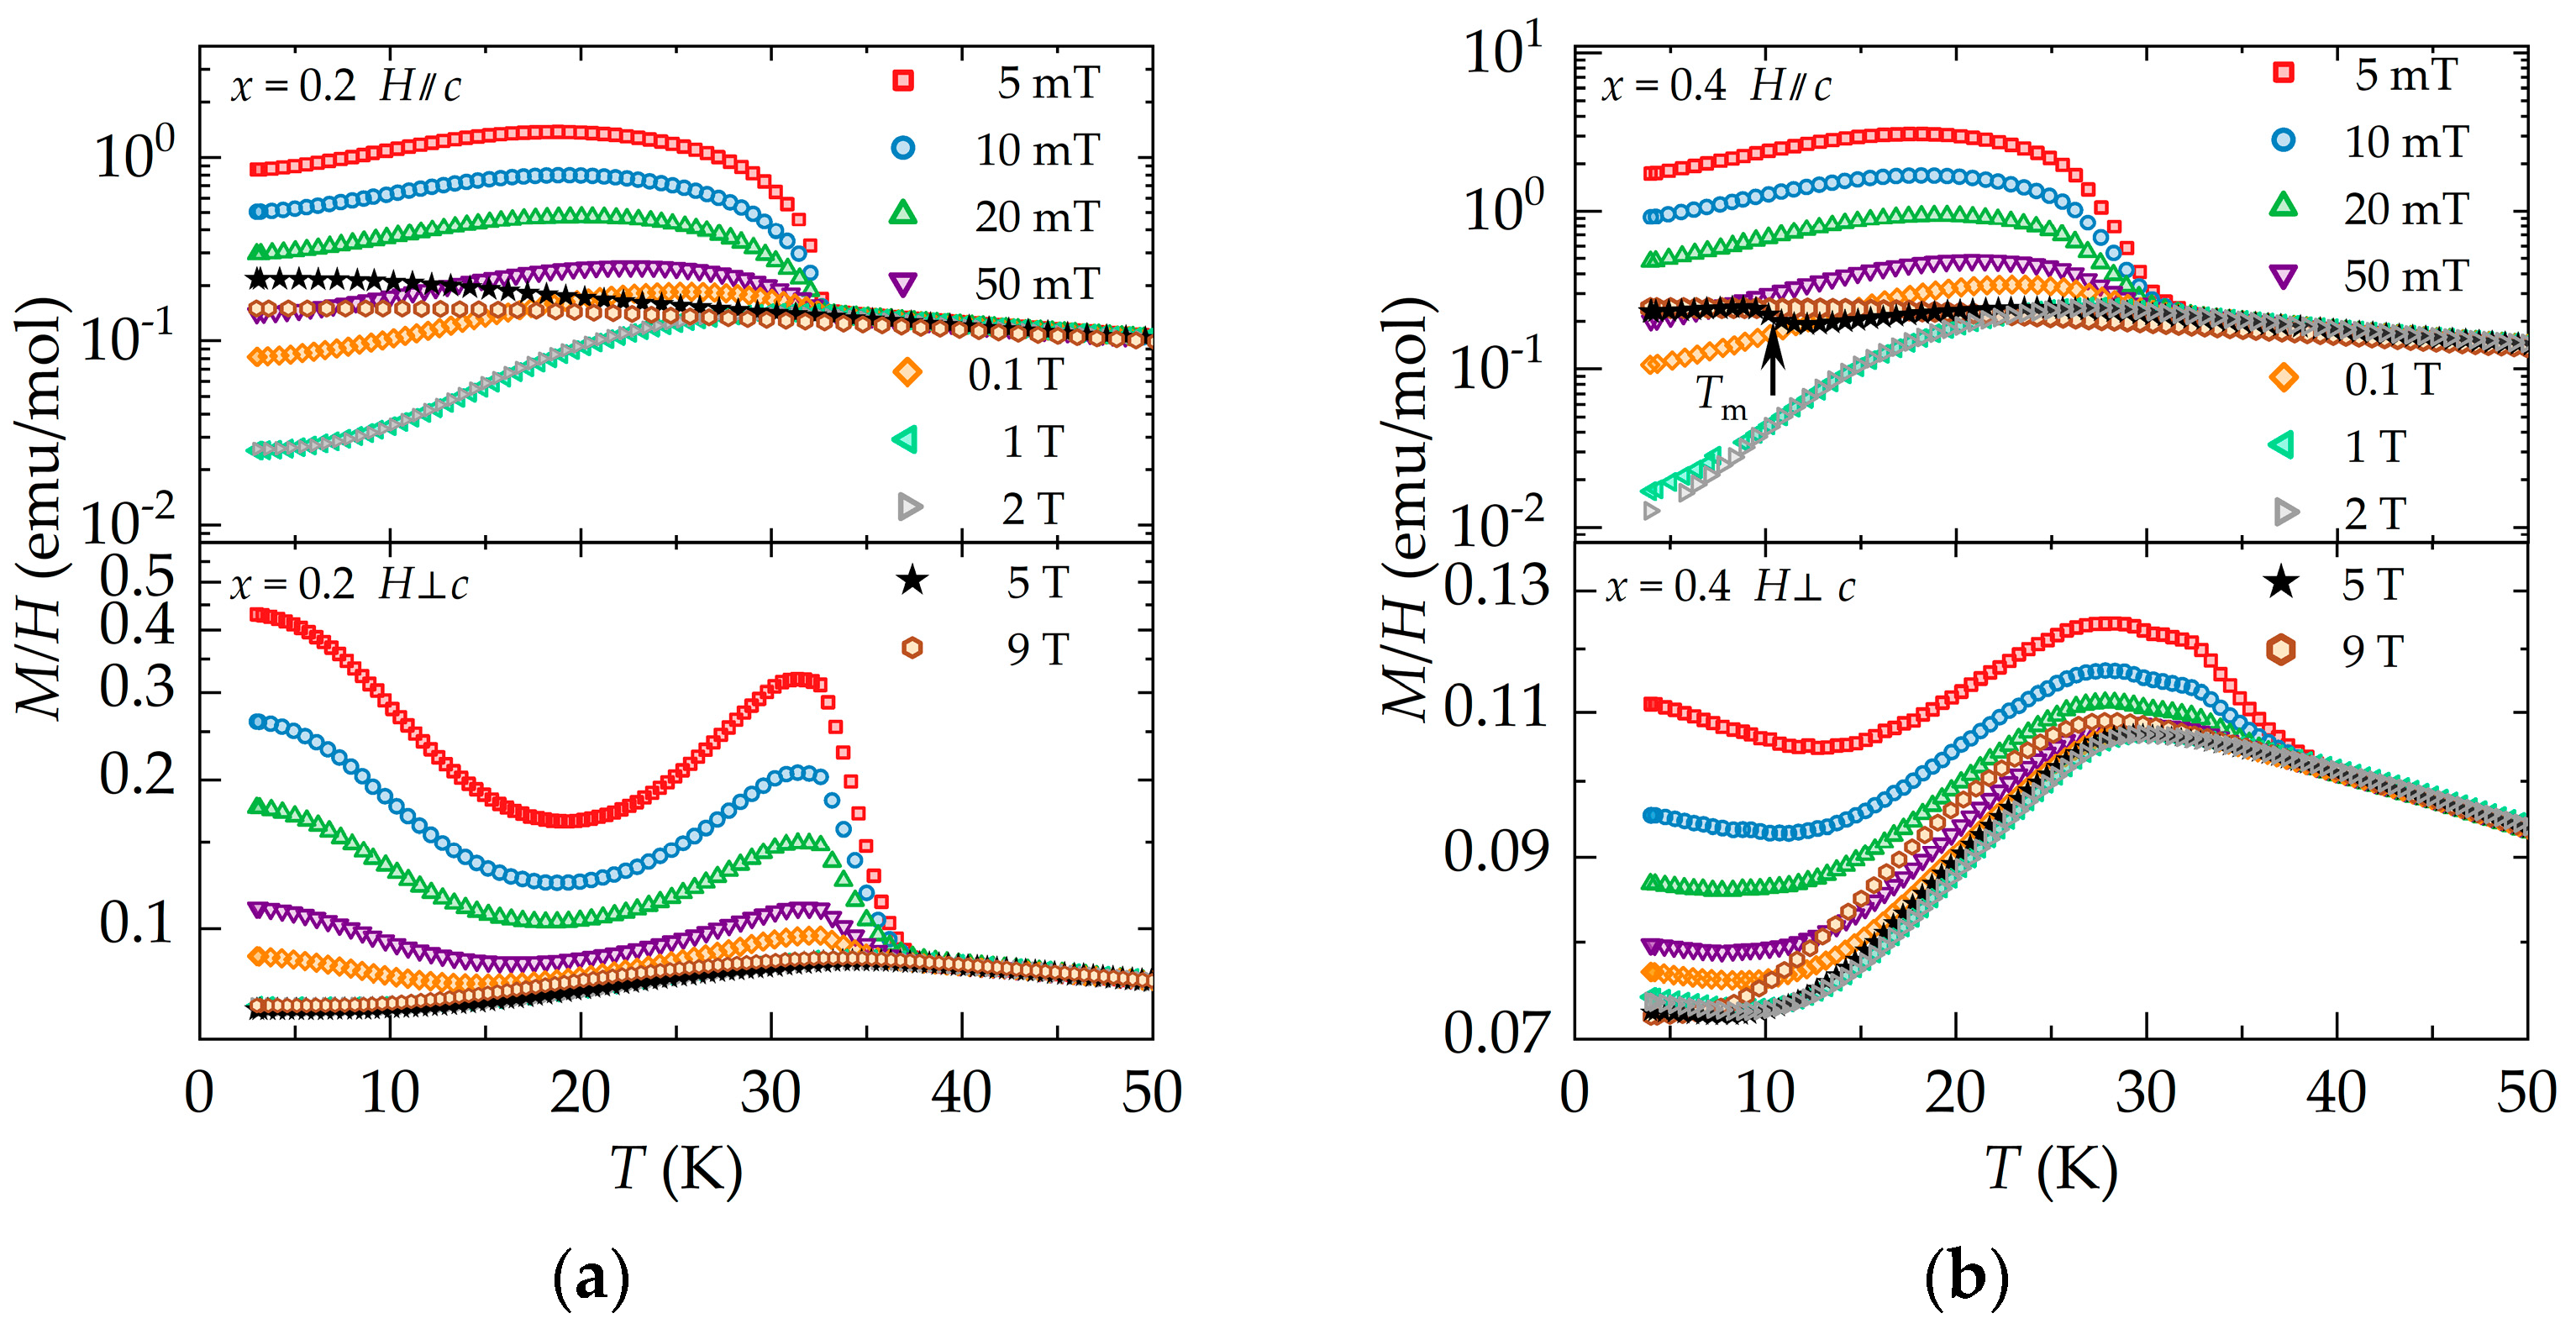
The behavior of
M/H ×
T for the Gd
0.8Er
0.2B
4 and Gd
0.6Er
0.4B
4 single crystals obtained under FC conditions is shown in
Figure 3. For low field with
-plane and
, we observed the development of a weak ferromagnetic (wFM) phase, which persisted up to 200 mT. This weak ferromagnetism is quite anisotropic, a behavior reminiscent of
RB
4 (
R = Sm, Gd and Er) when diluted with a nonmagnetic ion [
15,
24]. The
M/H ×
T data collected under FC and ZFC conditions show significant irreversibility up to ~ 100 mT (
Figure S3).
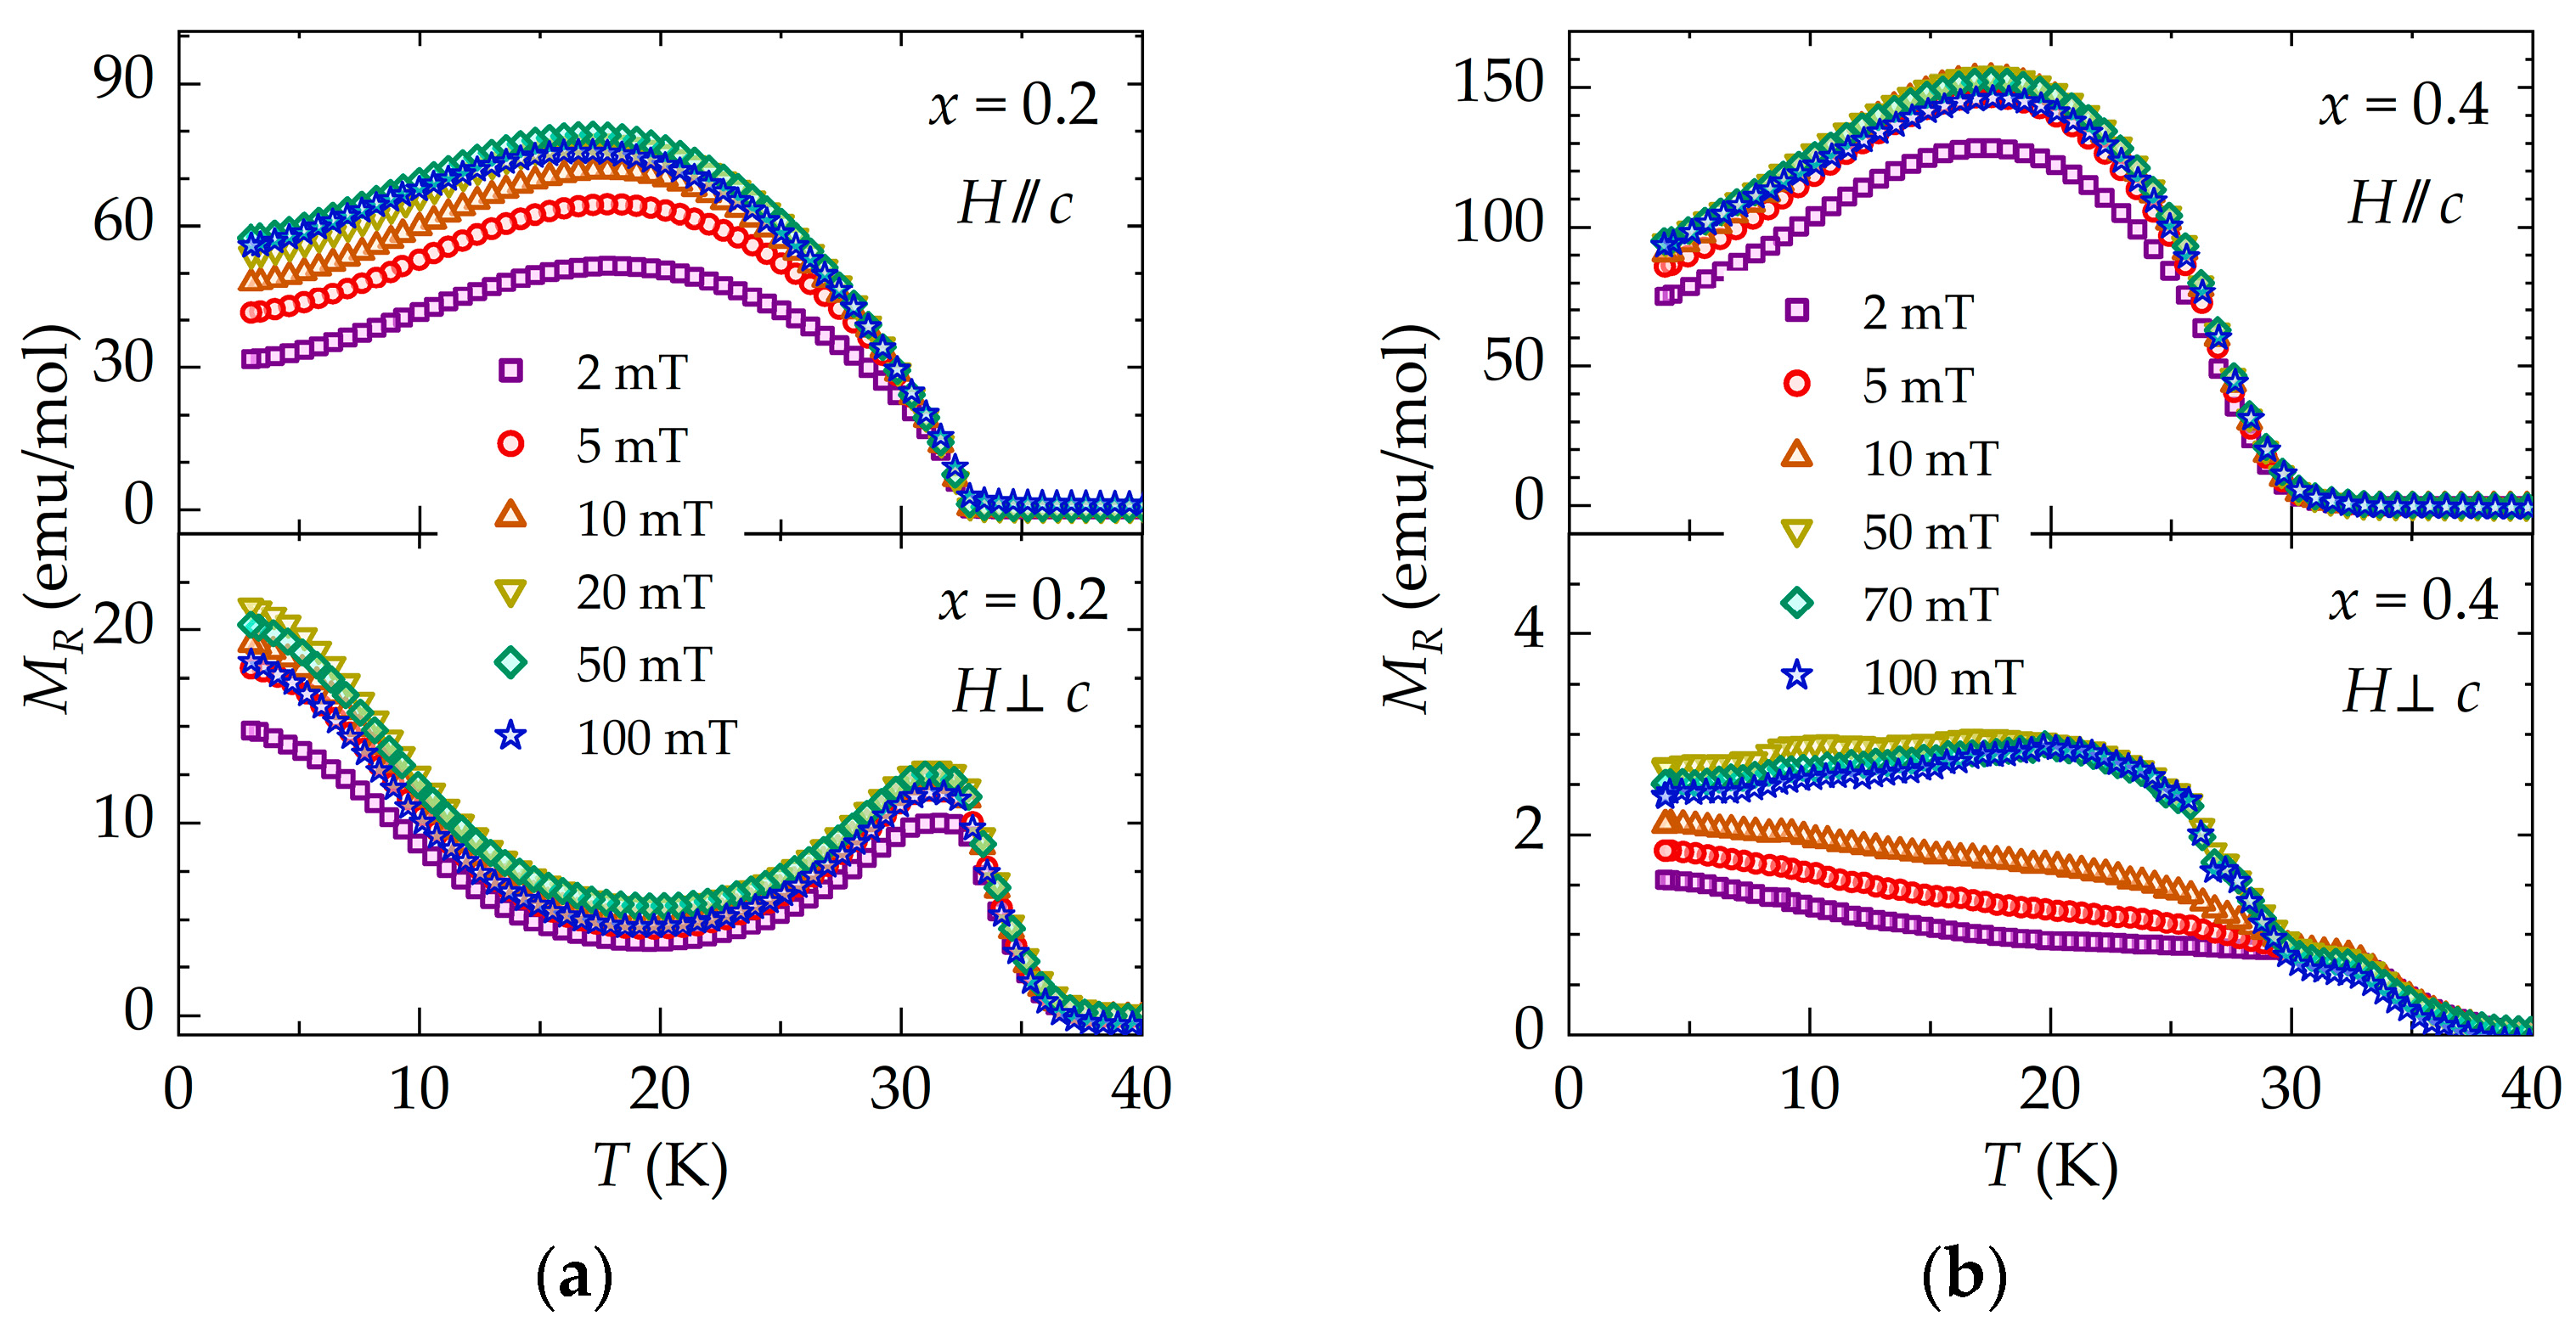
The deconvolution of the components of the wFM can be accomplished by considering that to a first approximation, the magnetization at low fields can be described as follows [
24]:
where
is the magnetic susceptibility of the AF sublattice, and
is the remnant magnetization corresponding to the wFM phase.
was selected from the curves obtained within the 2–3 T range, assuming a negligible contribution from the other phases. The
M/H ×
T curves collapse across the entire temperature range, suggesting the presence of a stable magnetic state. The
curves we obtained are shown in
Figure 4.
The
data for both samples (
Figure 4) show much higher values along the
c-axis, which corresponds to the easy axis in ErB
4. The maximum
values along the
c-axis amount to 0.19% and 0.35% of the saturated moments (
) for the
x = 0.2 and 0.4 samples, respectively. In contrast, for the
-plane, these values were reduced to 0.05% and 0.007% of
for the
x = 0.2 and 0.4 samples, respectively. These values are consistent with the findings for the wFM induced by Y substitution in
RB
4 compounds [
15]. In the case of
RB
4 (
R = Sm, Gd, Tb, Dy, and Er) compounds, the highest values of
were found for ≈ 30% of Y partial substitution in
RxY
xB
4 [
15]. For Gd
3+ and Er
3+, the
values correspond to 0.42% and 0.21% of the saturated moments, respectively.
The onset of the wFM for
is defined by the inflexion points taking place at ~32 K and ~27 K for
x = 0.2 and 0.4, respectively, both below
TN, as shown in the upper panels of
Figure 4. This phase emerges at the slightly higher temperatures of ~39 K (
x = 0.2) and ~40 K (
x = 0.4) for the
-plane, values just slightly below
TN~42 K for GdB
4. The data for
-plane suggest that the transitions to the wFM phase take place in two steps, as shown in the bottom panels of
Figure 4.
The
M ×
H data for
in the Gd
1−xEr
xB
4 (
x = 0.2 and 0.4) compounds reveal remanence and coercivity, as shown in the insets of
Figure S1. The magnetic hysteresis for Gd
0.8Er
0.2B
4 persists up to 32 K and 35 K for the
and
-plane, respectively. For Gd
0.6Er
0.4B
4, the magnetic hysteresis can be observed up to 30 K for
; however,
and
are negligibly small for the
-plane.
The Gd
0.8Er
0.2B
4 sample for the field range from 0.5 to 3.0 T (
) as well as Gd
0.6Er
0.4B
4 in the 0.5–4.3 T field range both exhibit
M/H ×
T curves reminiscent of AF systems, displaying a peak near
TN. Examples of such AF-like curves are shown in the upper panels of
Figure 3 and
Figure S4 for both samples. Conversely, when a magnetic field higher than 0.5 T was applied perpendicular to the
c-axis, these characteristics of AF systems were observed in both samples, as shown in the lower panels of
Figure 3 and
Figure S4.
The metamagnetic transitions observed in the
M ×
H curves (
Figure 2) can also be identified in the
M/H ×
T curves for
(upper panels of
Figure 3 and
Figure S4) within the 3.5–4.5 T range (
x = 0.20) and 4.3–6.0 T range (
x = 0.4). An increase in magnetization with decreasing temperature can be observed below
TN, with the inflection point being identified as the transition temperature. For the
x = 0.2 samples, this increase cannot be clearly seen given the logarithmic scale of the graph; however, it is indicated in
Figure S4a. In the case of the
x = 0.4 samples, the inflection points at
Tm, as depicted in the upper panels of
Figure 3b and
Figure S4b, correspond to the second peak observed in the
Cp ×
T curves, as shown in the upper panel of
Figure 1b.
Upon further increasing
, the
M/H ×
T curves exhibit near saturation at low
T, suggesting the complete polarization of Er
3+ moments for
T and 6 T for
x = 0.2 and 0.4, respectively, as depicted in the upper panels of
Figure 3 and
Figure S4. This finding is consistent with the trend observed in the
M ×
H curves shown in
Figure 2, where d
M/d
H displays a peak just below 5 T and 6 T for
x = 0.2 and 0.4, respectively.
For
exceeding 5 T (
x = 0.2) and 6 T (
x = 0.4), the magnetization
M(
H) exhibits linear increases at rates of 0.120 and 0.121
, respectively. Remarkably, these values correspond closely to the 0.121
slope for the GdB
4 measured in Ref. [
17]. If this linear trend is maintained, saturation is expected to occur at approximately 50 T and 42 T for
x = 0.2 and 0.4, respectively. These values are slightly below the saturation field of 54 T observed in the GdB
4 compound, suggesting that the presence of Er
3+ in the GdB
4 lattice affects the saturation field. It is conceivable that the aligned Er spins might provide an offset field, therefore reducing the applied field necessary to fully saturate the Gd sublattice.
Considering the results described above, the effects of the partial substitution of Er for Gd in Gd
1−xEr
xB
4 solid solutions can be summarized as follows: (i) an increase in the magnitude of magnetization, as shown in
Figure S4, and in the experimentally determined
µeff in the PM state (see, for instance, Reference [
25]); (ii) a slight decrease in
TN for the stabilization of the AF state; (iii) an appreciable anisotropy of the wFM phase along the
c-axis; and (iv) the stabilization of the plateau state at ½
MS for the
x = 0.4 crystals. However, the transition to the FIP state, certainly related to the presence of Er
3+ ions, occurs at lower applied magnetic fields (
HFIP~4 T) for crystals with
x = 0.2, whereas it is
HFIP~5.5 T for
x = 0.4, following the emergence of the plateau state at 4.4 T.
We also emphasize that increasing Er concentration in Gd
1−xEr
xB
4 solid solutions is accompanied by a systematic decrease in the lattice parameters due to the smaller ionic radius of Er [
25]. As far as this point is concerned, we might recall that the frustration in the Shastry–Sutherland lattice model is closely related to the competition between the Zeeman effect and interactions
J1 and
J2. An ordered antiferromagnetic ground state has been found for
J1/
J2 < 1.43 [
11]. In our solid solutions, due to the partial substitution of smaller Er ions, such a
J1/
J2 ratio is altered and maybe a source of the appearance of the ½
MS plateau in the
M ×
H curves.
We also point out that the pristine ErB
4 compound exhibits a strong Ising-type single-ion anisotropy with an easy magnetization axis along the
c-axis [
4]. On the other hand, the single-ion anisotropy of Gd is considered small, and GdB
4 can be described as a noncollinear Heisenberg antiferromagnet with the easy axis along the (110) direction [
29]. Therefore, the partial substitution of Er by Gd has an impact on the magnetic anisotropy of the Gd
1−xEr
xB
4 solid solution. Such a little but important variation in ionic radii, along with the difference in the magnetic moments between Gd and Er, may, in turn, influence the geometrically frustrated exchange interaction and the exchange couplings, with these effects playing fundamental roles in stabilizing distinct magnetic states [
4]. This point is currently under investigation.
4. Discussion
Informed by the detailed magnetization data on the Gd
0.8Er
0.2B
4 and Gd
0.6Er
0.4B
4 single crystals, we were able to assemble field-temperature (
H ×
T) phase diagrams for
, as shown in
Figure 5. The value of
TN decreases slightly for magnetic field
-plane. Given that 9 T is the highest field of this set of data, the phase diagram misses the possible field-induced phase transition at higher fields. Consequently, the
H ×
T phase diagram for both samples in the
ab-plane only includes vertical boundaries delineating paramagnetic (PM), wFM, and AF regions.
Regions I and II of the phase diagrams in
Figure 5 correspond to the paramagnetic PM and wFM phases for Gd
0.8Er
0.2B
4 and Gd
0.6Er
0.4B
4. However, region II for
x = 0.2 and 0.4 are clearly different. For the
x = 0.2 samples, a minor anomaly in the
Cp ×
T data up to
= 9 T is observed just above
TN. This anomaly coincides with the onset of the wFM phase, as indicated by the vertical borderline at ~ 34 K. On the other hand, for the
x = 0.4 samples, there is no corresponding anomaly in the
Cp(
H,
T) data associated with the wFM onset. Our
Cp(
H,
T) and
M(
H,
T) data lack the resolution required to definitively identify the origin of the observed differences in region II for the two Er compositions.
The AF phase was observed to occur within regions III and IV of the phase diagrams for both x = 0.2 and 0.4 compositions. The phase boundary between regions I/II and III/IV are clearly correlated with anomalies in the Cp × T data in applied magnetic fields up to 9 T. In contrast, the ordering temperature is suppressed with increasing magnetic field, as shown in the M/H × T data, in which saturation in M was observed at low temperatures. Specifically, TN could be reliably, unambiguously determined from the M/H × T curves in magnetic fields up to ~4.5 T and ~6.0 T for the x = 0.2 and 0.4 compositions, respectively. Region III represents the AF phase of the Gd1−xErxB4 system, whereas region IV denotes the coexistence of the AF phase, associated with the Gd3+ sublattice and the FIP phase of the Er3+ ions.
The phase boundary between regions III and IV was well defined by the observation of well-defined magnetization jumps observed in the M × H isotherms for . Measurements of Cp × T and M/H × T provide limited insight into this boundary due to the small variations in this boundary with H. Phase V (PP), resulting from the plateau at ½ MS of the Er+3 ions, was clearly observed only for the x = 0.4 composition. The transitions between phase III and V, as well as between phase V and IV, are characterized by the magnetization discontinuities observed in the M × H isotherms. The boundary between phases III and V was also clearly delineated through Cp × T characterization.
Establishing whether the presence of phase V for the x = 0.2 composition results from the possible realignment of some the Er3+ spins is quite difficult. In this sample, it is anticipated that the Er sublattice contributes 1.8 to the overall magnetization of the system. This magnitude is consistent with the observed jump in the M × H curves, a feature which is very pronounced at T = 4 K. As a result, the system appears to transition directly from the AF phase to the mixed phase IV without an intermediate phase V (PP). The temperature of the triple point, in this case, which delineates the boundary lines of phases II, III, and IV, appears to be near 32 K and 3 T.
The phase diagram highlights the role of the partial Er substitution in the GdB
4 lattice and its impact on the boundary lines within the system. For instance, a partial substitution of only 40% of Er for Gd reveals a striking resemblance between the resulting phase diagram (
Figure 5b) and that of the ErB
4 compound [
11]. Analogous to ErB
4, the
x = 0.4 composition displays the presence of two discernible metamagnetic phase transitions, albeit at higher fields. In the ErB
4 phase diagram, derived from neutron diffraction data, three distinct regions identified as being antiferromagnetic, ferrimagnetic, and ferromagnetic merge to a triple point at 11.7 K and 2.1 T [
30]. In the Gd
0.6Er
0.4B
4 composition, this triple point is located at ~12.8 K, nearly the same temperature as that of ErB
4, but at a higher magnetic field of ~5.4 T, where the phases in region III, IV, and V coalesce, as shown in
Figure 5b. Additionally, another triple point can be defined at ~24 K and ~6 T, where phases I, II, and IV converge.
Remarkably, a partial substitution of just 20% of Er is sufficient for a metamagnetic transition from AF to FIP, as shown in
Figure 5a. However, the FIP phase corresponds solely to the orientation of the Er
3+ ions, as the magnetization corresponds to only 26% and 44% of the theoretical magnetization of
7.4 and 7.8
expected for the
x = 0.2 and 0.4 compositions, respectively. The complete saturation of the Gd
1−xEr
xB
4 compounds can be achieved only at saturation fields close to the values found for GdB
4 (i.e., 50 T and 42 T, respectively). In the case of GdB
4, this metamagnetic transition occurs only at the very high fields of ~52 T and ~54 T, applied along the
a and
c axes, respectively [
17]. It is important to emphasize that both the Gd
0.8Er
0.2B
4 and Gd
0.6Er
0.4B
4 compositions exhibit pronounced anisotropies, while the preferred orientation for ErB
4 is the
c-axis.
Our combined analysis of the magnetization and specific heat data suggest that the Er and Gd sublattices keep their original easy directions (i.e., the ab-plane for Gd and the c-axis for Er). The possibility of a small canting angle for both easy directions, which would also explain the appearance of the wFM, cannot be completely ruled out.


 ,
, 