5.1. Material Characterization and Interaction Parameters
The physical properties of the ABS spheres used in the experiments are presented in
Table 3. The low standard deviations obtained for particle density, bulk density, and bed voidage indicate a high degree of material uniformity and good reproducibility of the experimental procedures. Such homogeneity is particularly important for CFD-DEM simulations, as it minimizes the influence of particle-to-particle variations on the hydrodynamic behavior of the system.
The interaction parameters experimentally determined for particle–particle (pp) and particle–wall (pw) contacts are presented in
Table 4. Each reported mean value was calculated from 50 independent measurements, which exhibited approximately normal distributions.
A larger dispersion was observed for the static friction coefficients, which can be attributed to the sensitivity of the inclined-plane method to small variations in the inclination procedure. Similarly, the particle–wall restitution coefficient exhibited a higher standard deviation than the particle–particle restitution coefficient, possibly due to slight variations in rebound trajectories during the free-fall tests.
Table 4 also compares the interaction parameters obtained in the present work with those reported by Xiao et al. [
34]. Although both studies employed ABS particles and acrylic surfaces, significant differences could be observed, particularly for the static and rolling friction coefficients. Xiao et al. [
34] used ABS spheres with a diameter of 4.0 mm and a density of 1100 kg m
−3, whereas the particles employed in the present work had a diameter of 2.93 mm and a density of 1053 kg m
−3. Differences in particle size, surface roughness, manufacturing process, and material properties may contribute to the differences observed between the measurements.
The results demonstrate that interaction parameters reported in the literature are not necessarily transferable to different systems, even when similar materials are employed. This finding reinforces the importance of determining material-specific interaction parameters prior to performing CFD-DEM simulations.
5.3. Characteristic Curves
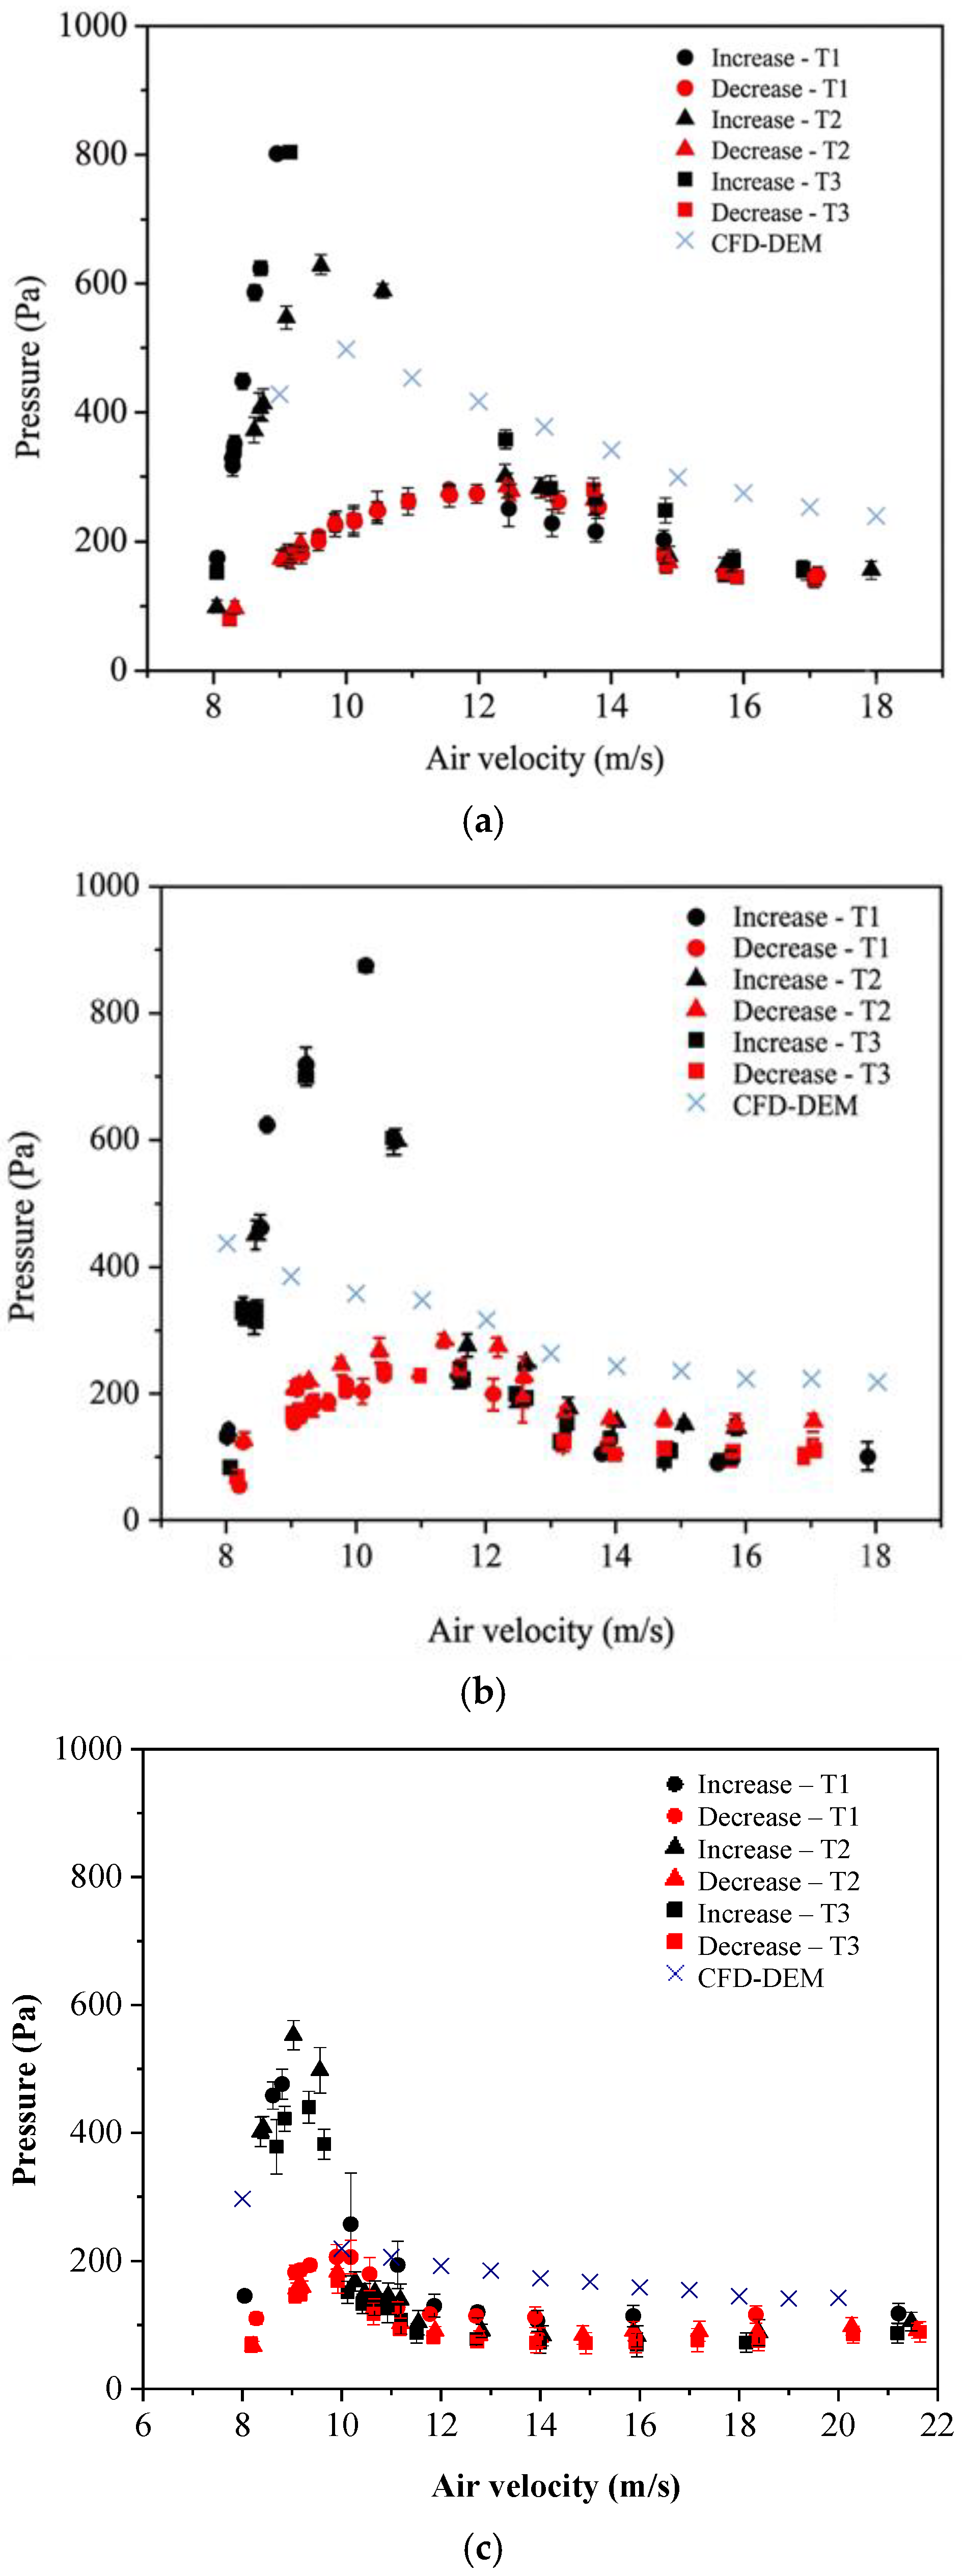
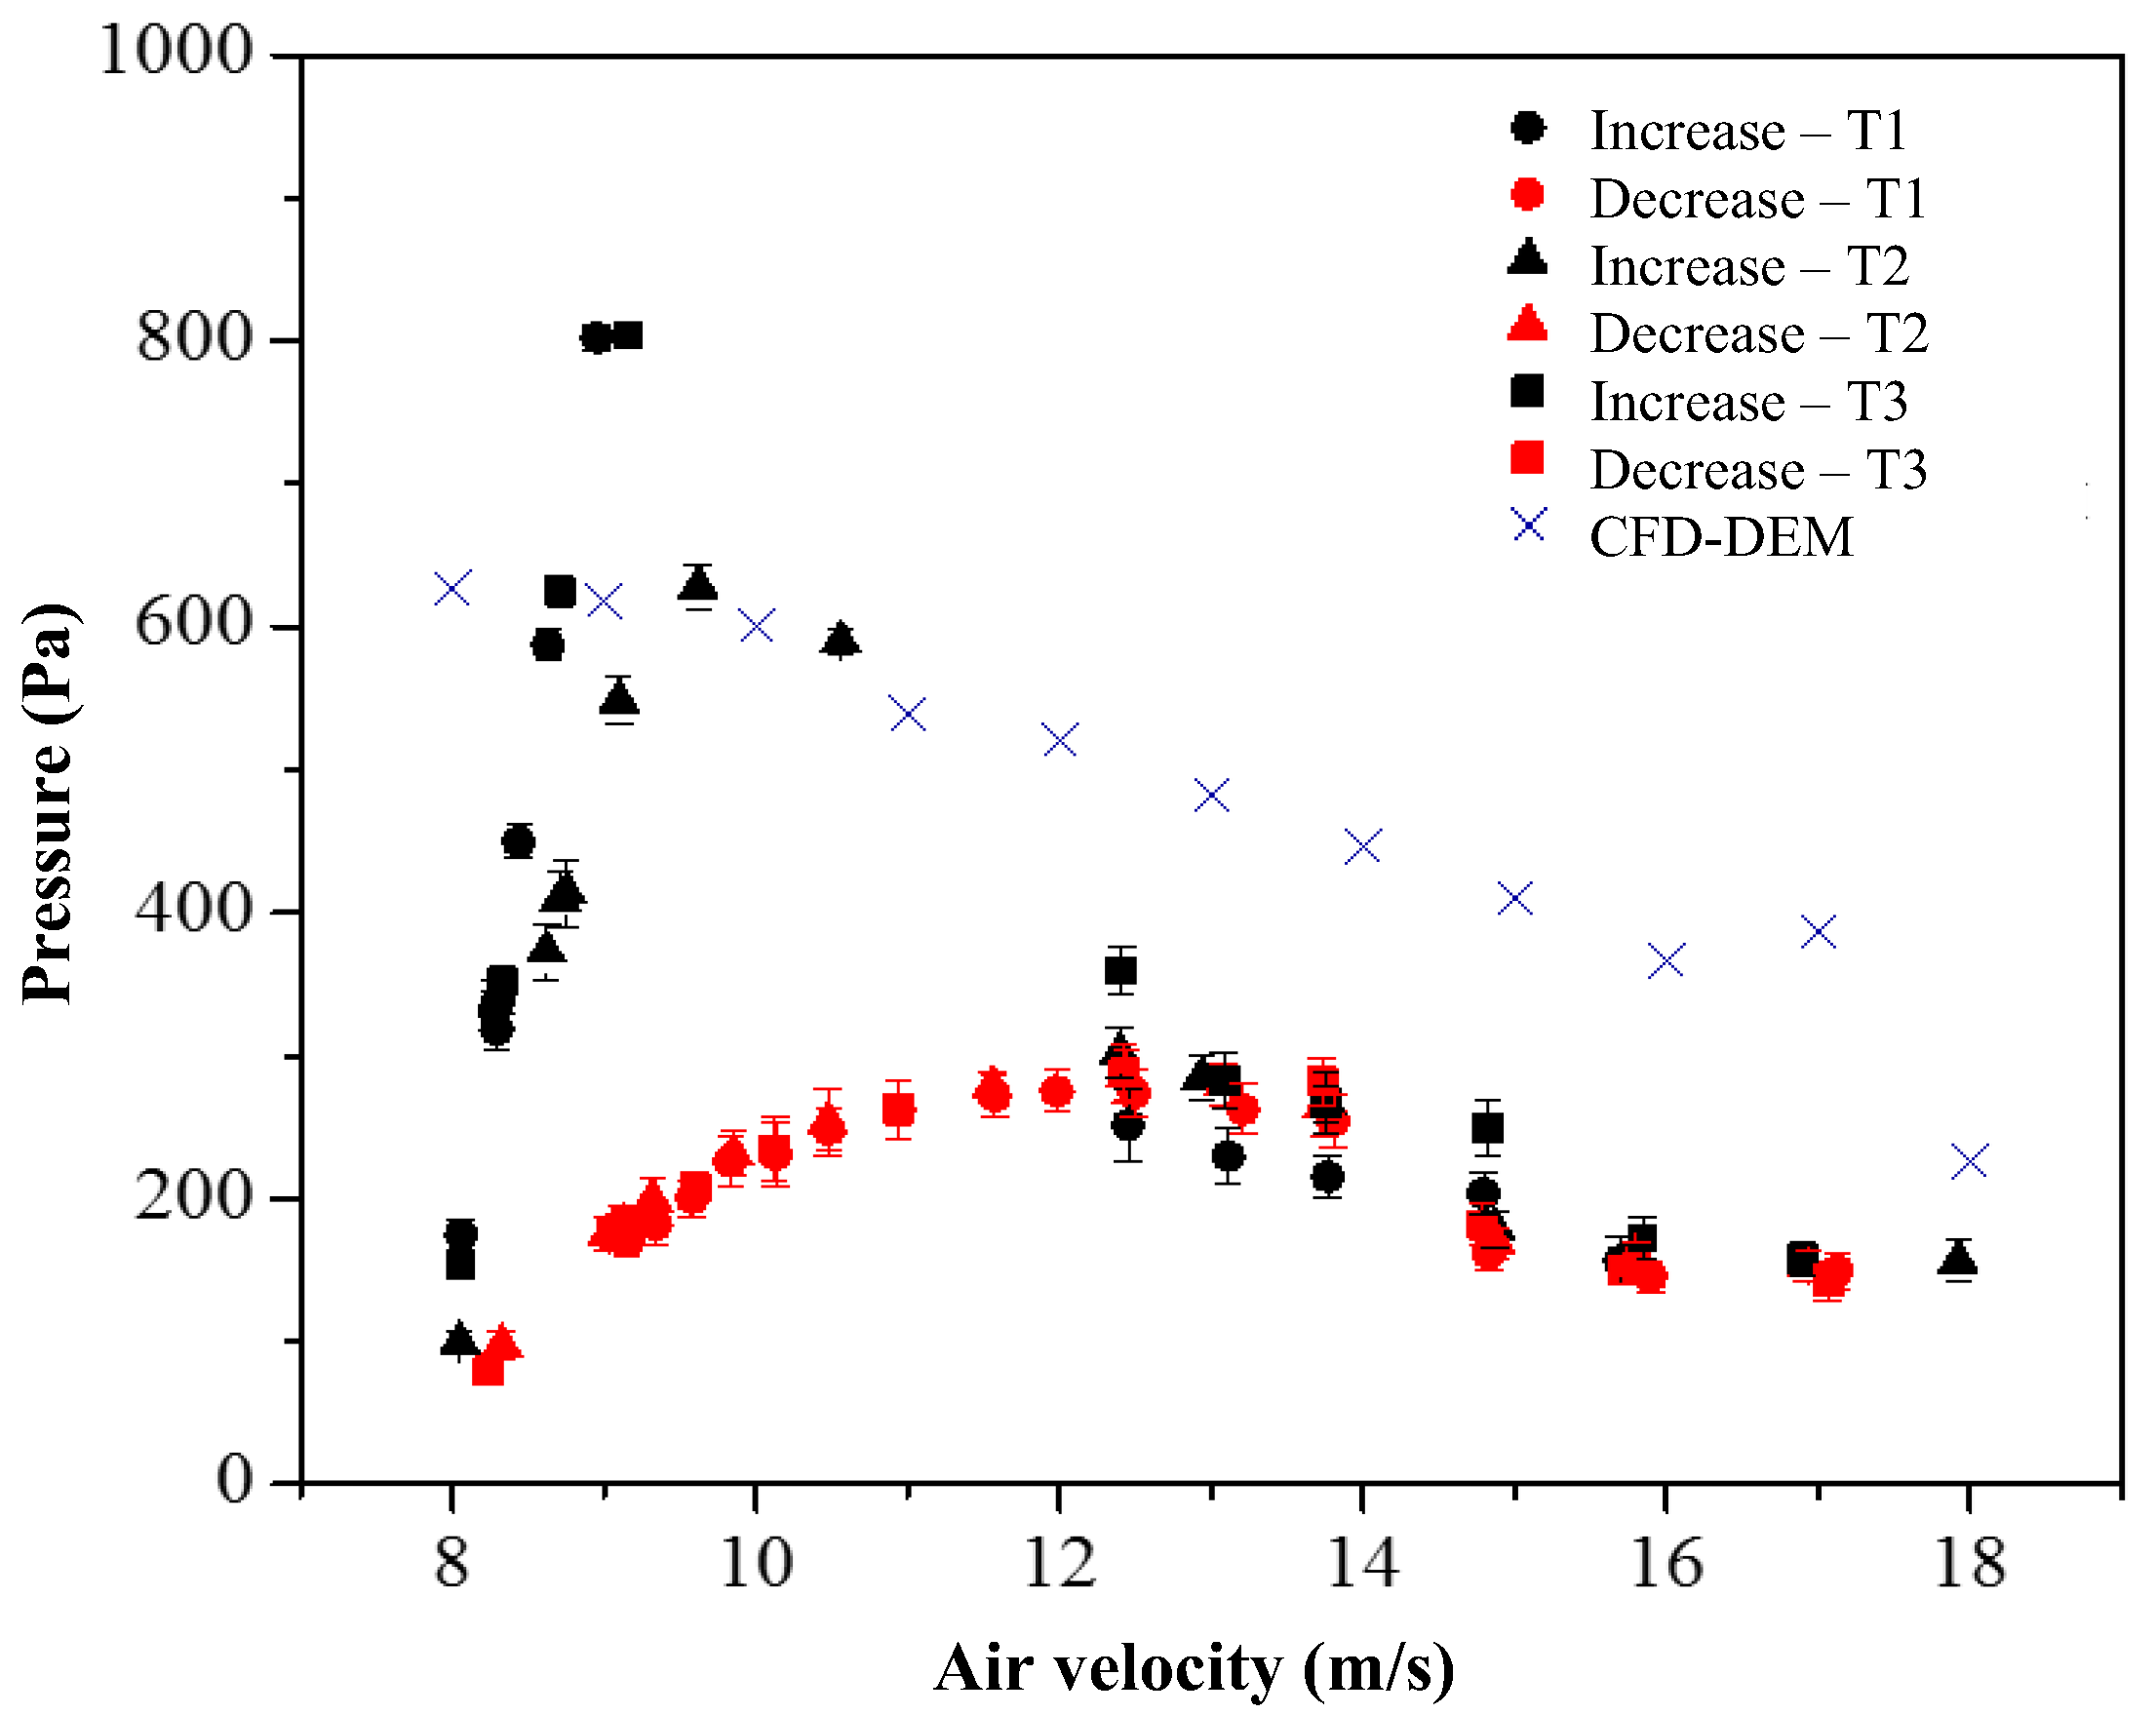
Figure 6 presents the spouted bed characteristic curves obtained experimentally and numerically for solid loads of 400 g (a), 300 g (b), and 200 g (c). The labels T1, T2, and T3 correspond to the three experimental replicates performed for each operating condition. The experimental curves obtained for the 400 g solids load showed excellent reproducibility, whereas some deviations were observed among the curves corresponding to the lower solid loads, which may be attributed to spout instabilities [
46]. Each point on the experimental curves represents an average of approximately 50 pressure measurements, while the error bars indicate the corresponding standard deviations. During the experiments, the average air temperature ranged from 30 °C to 33 °C.
The comparison between the experimental and simulated curves allows for the evaluation of the CFD-DEM model’s ability to reproduce the hydrodynamic behavior of the spouted bed under different solid loads. Attention was given to the prediction of the pressure-drop profile and the minimum spouting velocity, which are key parameters for model validation.
For all solid loads investigated, the experimental curves exhibited the characteristic behavior of spouted beds, including the pressure-drop peak associated with spout initiation, a nearly constant pressure drop under stable spouting conditions, and hysteresis between the loading and unloading branches. The simulated curves obtained for the 400 g and 300 g solids loads tended to overpredict the experimental pressure-drop values, with the largest deviations occurring at the lowest and highest gas velocities.
For the 200 g solid load, the CFD-DEM simulation reproduced the overall shape of the experimental characteristic curve with good agreement, indicating that the model was able to capture the main pressure-drop trends across the investigated operating range. However, despite this satisfactory global agreement, the prediction of the minimum spouting velocity for this condition presented the largest deviation among the cases evaluated. This result suggests that reproducing the overall pressure-drop profile does not necessarily imply an accurate prediction of the transition between fixed-bed and spouting regimes, particularly under low solid-load conditions, where the system becomes more sensitive to fluctuations and instabilities.
The experimental minimum spouting velocities were determined by visual inspection of the bed behavior. During the decreasing air velocity stage, the minimum spouting condition was defined as the gas velocity at which the fountain disappeared. The maximum pressure drops corresponded to the highest values measured during the increasing air velocity stage, whereas the stable spouting pressure drops were obtained at the highest operating velocities under fully developed spouting conditions.
Table 6 summarizes the static bed heights, maximum pressure drops, stable spouting pressure drops, and minimum spouting velocities obtained for each solid load. The reported values correspond to the average of the three experimental replicates.
An increase in maximum pressure drop, stable spouting pressure drop, and minimum spouting velocity was observed with increasing solid load, in agreement with previous studies [
47,
48]. This behavior is attributed to the higher resistance imposed by the particle bed to the gas flow. As the solid load increases, a greater amount of energy is required to overcome the inertia and frictional resistance of the particle assembly, resulting in higher pressure drops and greater minimum spouting velocities. The decreasing airflow stage of the characteristic curve is highly reproducible, whereas the increasing airflow exhibits greater variability due to its dependence on bed compaction. Consequently, the minimum spouting velocity, determined during the decreasing airflow stage, is more reproducible than the maximum pressure drop, which is measured during the increasing airflow stage. This explains the larger deviations observed for the maximum pressure drop values reported in
Table 6.
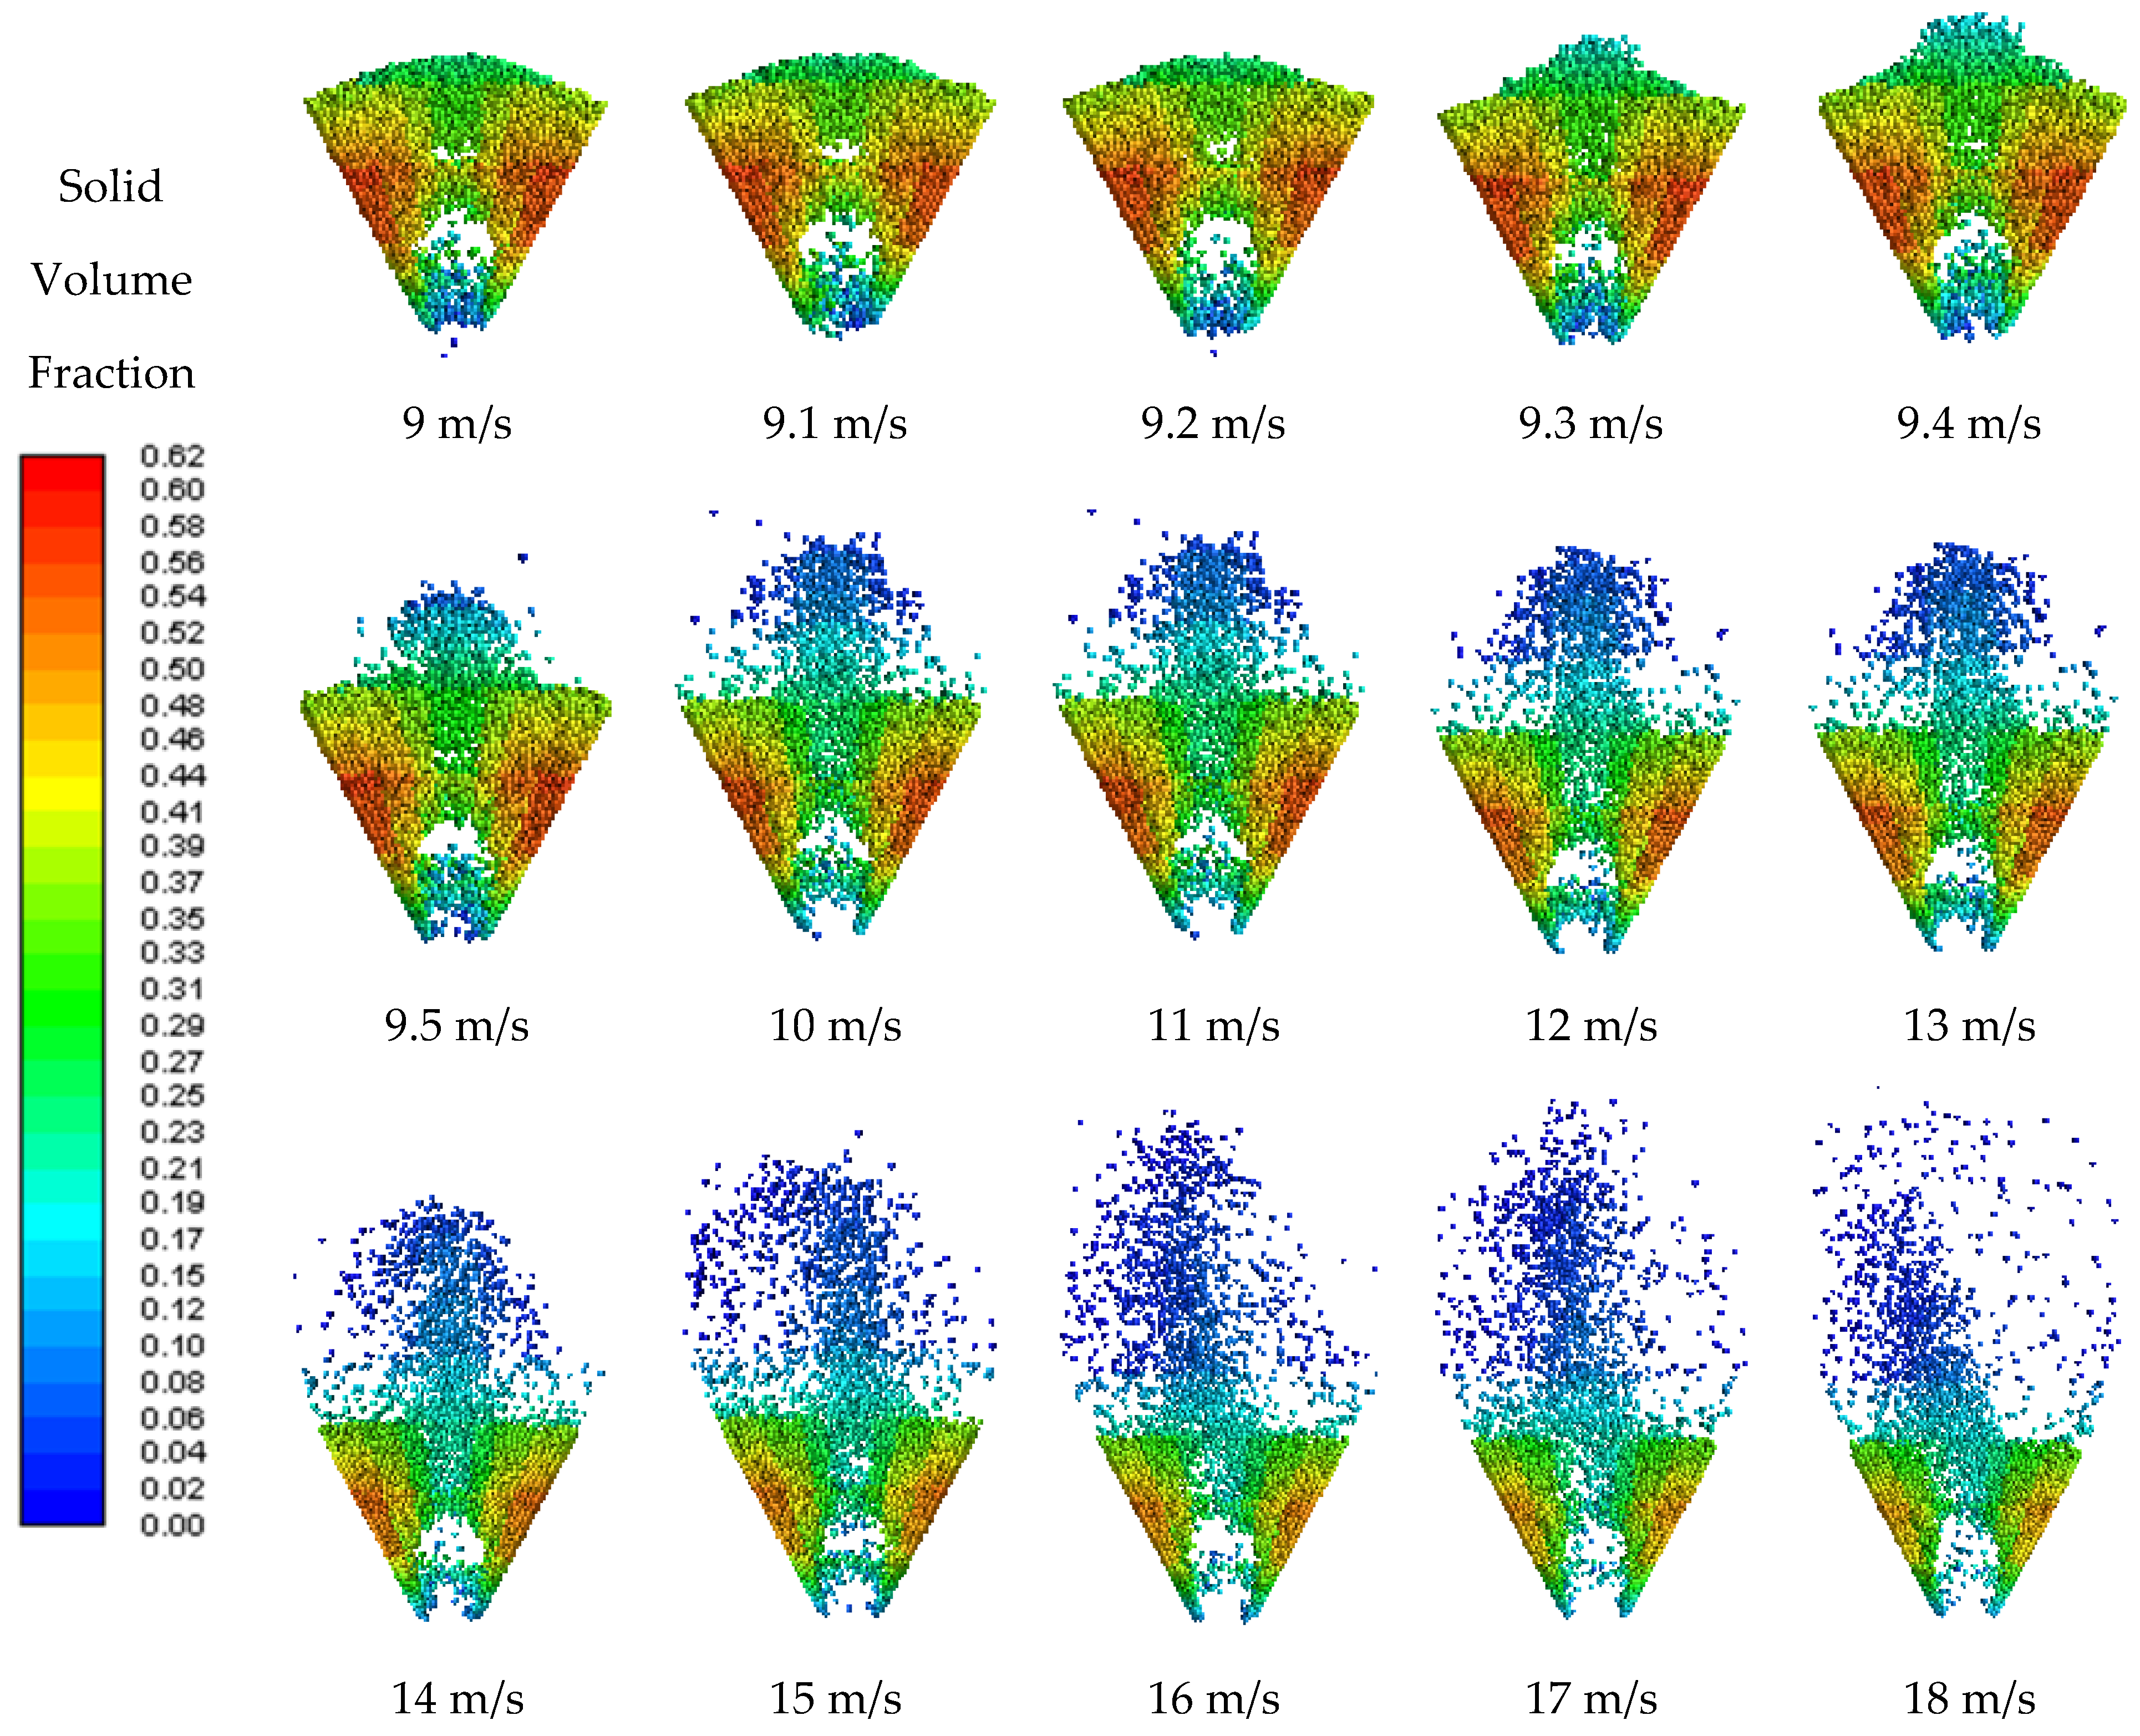
Because the minimum spouting velocity could not be accurately determined solely from the simulated pressure-drop curves, an additional analysis based on solid volume fraction contours was performed. Contour plots were evaluated on the central vertical plane of the spouted bed geometry for time-averaged results obtained over the final 2 s of each simulation.
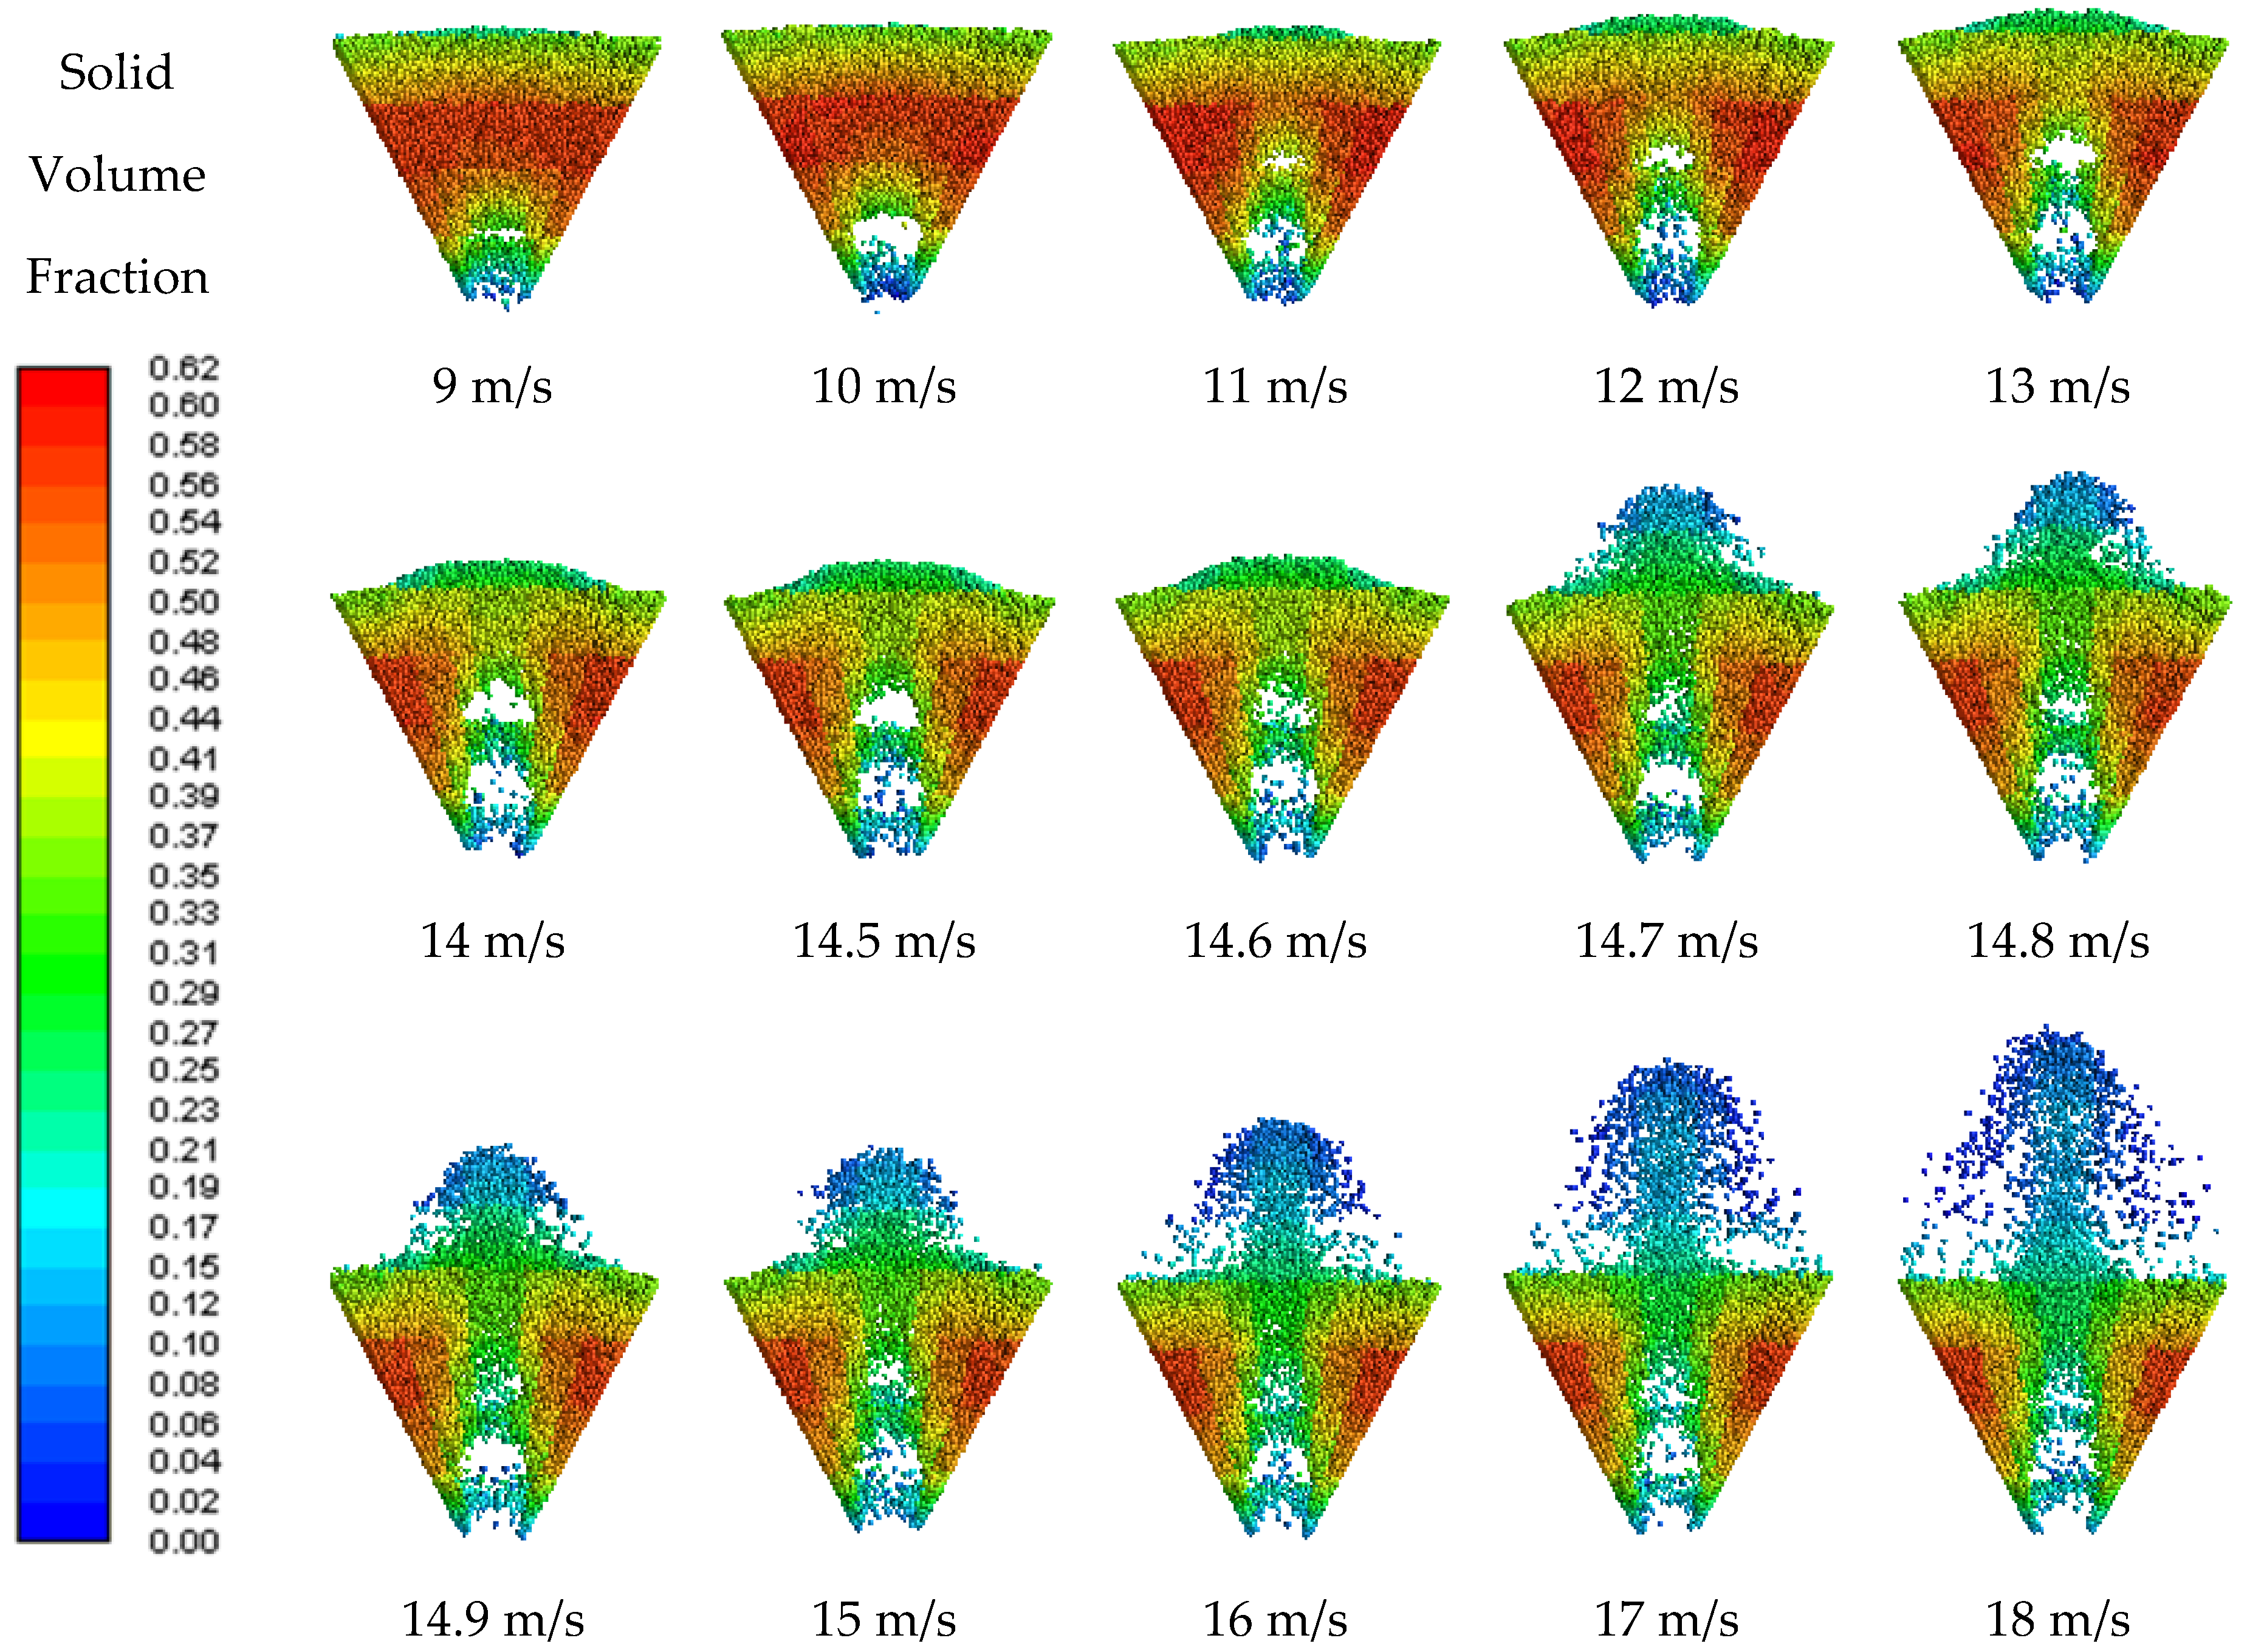
Figure 7 presents the solid volume fraction contours obtained for the 400 g solid load. The results clearly illustrate the transition from the fixed-bed regime to stable spouting conditions as the gas velocity increases. The progressive formation and expansion of the spout channel can be observed, accompanied by a reduction in solid concentration in the central region and an increase in particle circulation through the annular zone.
At an inlet gas velocity of 9 m·s−1, a small cavity can be observed near the distributor region, indicating the onset of particle entrainment at the base of the bed. As the gas velocity increases, the size of the low solid concentration region progressively expands until the particle bed is penetrated and a stable spout channel is formed at approximately 14.7 m·s−1. For gas velocities between 15 and 18 m·s−1, an increase in fountain height is observed with increasing gas velocity. At these conditions, the characteristic regions of a spouted bed—the annulus, spout channel, and fountain—are clearly identified.
Based on the solid volume fraction contours, the minimum spouting velocity predicted by the CFD-DEM model was determined as 14.7 m·s−1. This value differs by approximately 0.7% from the experimental result of 14.8 m·s−1, indicating excellent agreement between the numerical and experimental analyses.
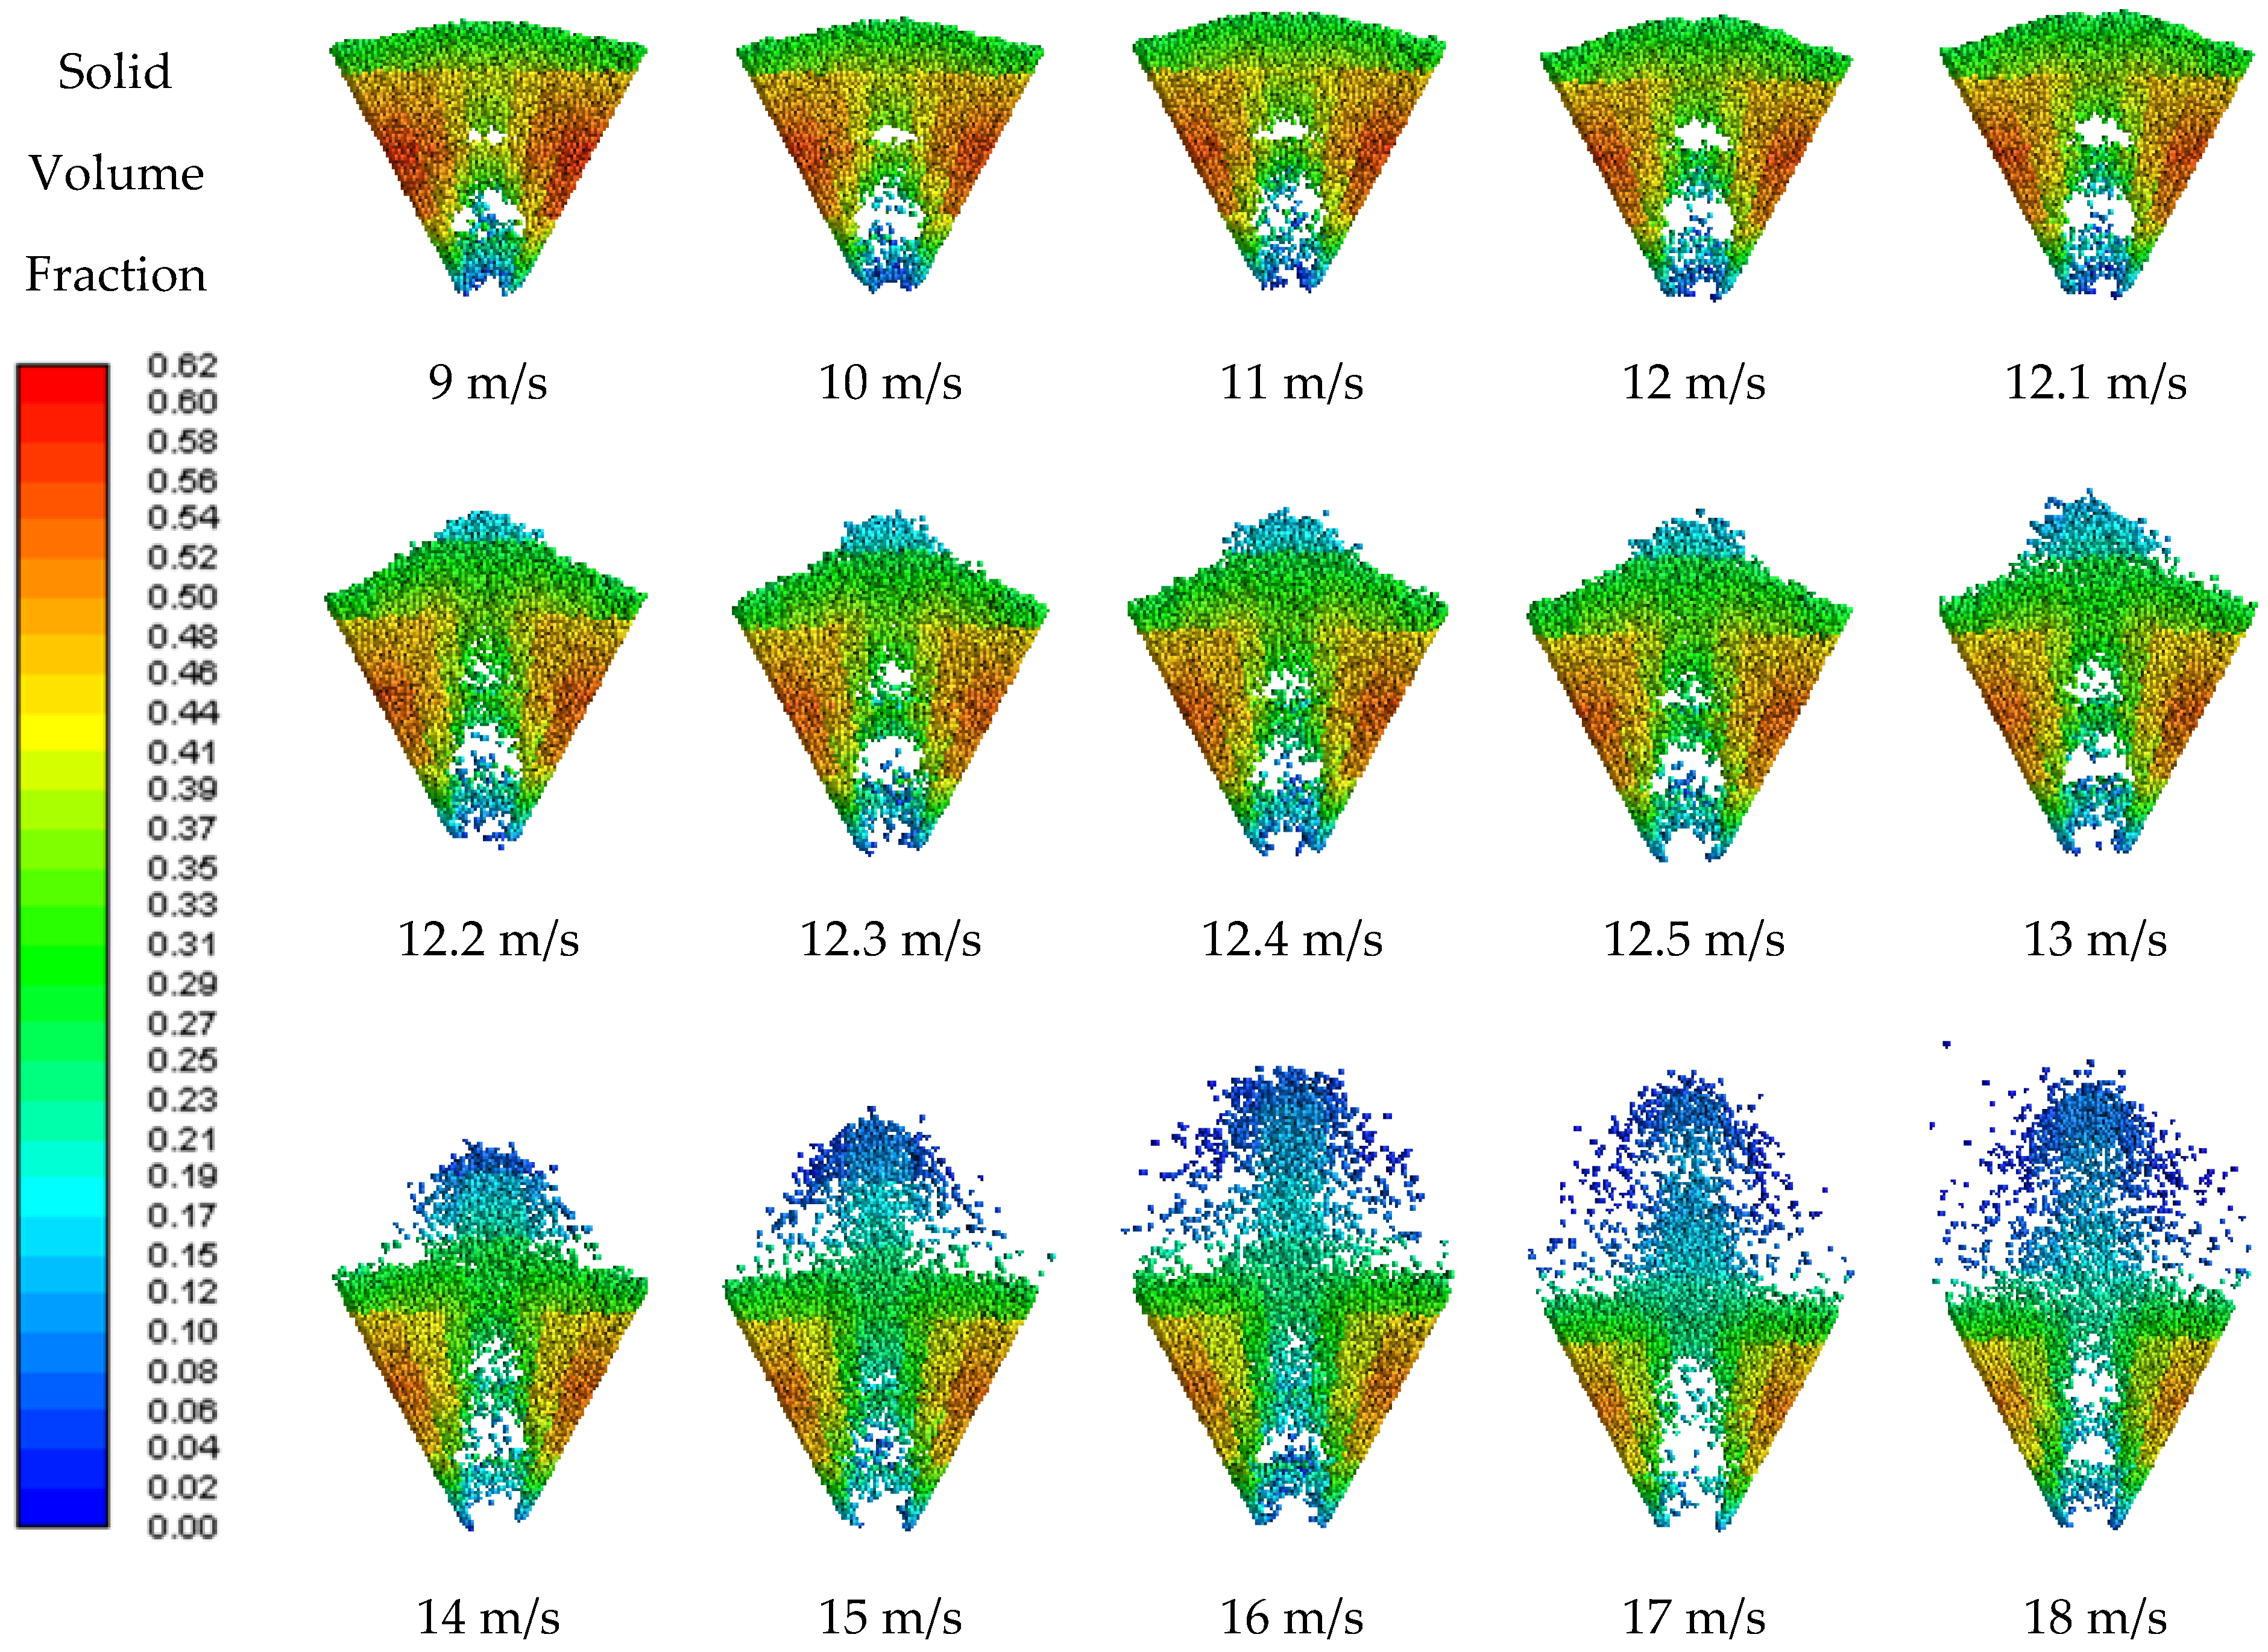
The contours obtained for the 300 g solid load also show the transition from the fixed-bed regime to stable spouting conditions as the gas velocity increases (
Figure 8). The formation of a continuous spout channel was observed at approximately 12.3 m·s
−1, which was therefore identified as the minimum spouting velocity predicted by the numerical model.
Compared with the experimental value of 13.21 m·s−1, the simulated minimum spouting velocity presented a deviation of approximately 6.9%. Despite this difference, the model was able to reproduce the main hydrodynamic features of the system. After the establishment of stable spouting conditions, further increases in gas velocity promoted a progressive increase in fountain height and a reduction in solid concentration within the annular region, indicating enhanced particle circulation and bed expansion.
Figure 9 presents the solid volume fraction contours obtained for the 200 g solid load. Similar to the previous cases, the transition from the fixed-bed regime to stable spouting conditions can be observed as the inlet gas velocity increases. Based on the formation of a continuous spout channel, the minimum spouting velocity predicted by the CFD-DEM model was determined as 9.4 m·s
−1. This value corresponds to a deviation of approximately 20.5% relative to the experimental minimum spouting velocity of 11.83 m·s
−1.
The contours also reveal a progressive increase in fountain height with increasing gas velocity up to approximately 15 m·s−1. Beyond this condition, the system gradually loses the characteristic flow structure of a spouted bed. This behavior can be attributed to the combination of a low solid load and high gas velocity, which promotes intense particle entrainment and increases the degree of bed expansion. Under these conditions, the gas flow becomes sufficient to suspend most of the particles throughout the bed volume, leading to a fluidization-like behavior rather than the well-defined spout channel and annular region typically observed in conventional spouted beds.
The larger deviation observed for the 200 g solid load suggests that the CFD-DEM model presents lower predictive accuracy under conditions close to the transition between spouting and fluidization regimes. In such cases, small differences in the interaction parameters or drag-force prediction may significantly affect the identification of the minimum spouting condition, resulting in larger deviations between the numerical and experimental results.
In
Figure 7,
Figure 8 and
Figure 9, regions containing solid particles within the spout channel can also be observed, indicating the occurrence of particle pulses. This phenomenon was also observed during the experimental tests, suggesting that the CFD-DEM model was able to adequately reproduce this characteristic feature of the spouted-bed hydrodynamics.
Table 7 summarizes the experimental and simulated minimum spouting velocities, together with their corresponding relative deviations. The results show the expected decrease in minimum spouting velocity with decreasing solid load, consistent with the experimental observations. The relative deviation between the experimental and simulated values increased as the solid load decreased. This behavior may be associated with the greater instability of the bed under low solid loads, which increases the uncertainty in both the experimental determination and numerical prediction of the minimum spouting condition.
Although deviations were observed between the experimental and simulated characteristic curves, the adopted CFD-DEM model could reproduce the main hydrodynamic features of the spouted bed. In particular, the model successfully captured the dependence of the minimum spouting velocity on solid load, the formation of the spout channel, the fountain development, and the characteristic particle circulation patterns. As previously discussed, the interaction parameters constitute fundamental inputs for DEM-based simulations; therefore, the direct measurement methodology employed in this work provided interaction parameters suitable for accurately representing the behavior of the investigated system.
5.4. Characteristic Curves Using Interaction Parameters from Xiao et al. [34]
To assess the sensitivity of the CFD-DEM model to the interaction parameters, additional simulations were carried out using the coefficients reported by Xiao et al. [
34]. Although the interaction parameters reported by Xiao et al. [
34] were also obtained for ABS spheres, the particle diameter used in their study was larger than that employed in this work, and different interaction parameters were obtained. All simulations were performed for a solid load of 400 g. The resulting characteristic hydrodynamic curve is presented in
Figure 10, while the corresponding curve obtained using the experimentally determined coefficients is shown in
Figure 6a.
As shown in
Figure 10, the characteristic curve predicted using the interaction parameters reported by Xiao et al. [
34] differed significantly from the experimental results, not only in terms of pressure-drop magnitude but also with respect to the overall shape of the curve. The simulation was unable to accurately reproduce the characteristic hydrodynamic behavior of the spouted bed, particularly the transition region between the fixed-bed and stable spouting regimes, the maximum pressure-drop peak, and the pressure-drop profile observed under stable spouting conditions. Consequently, the use of literature-based parameters resulted in a less representative description of the system behavior.
In contrast, the simulations performed with the interaction parameters determined experimentally in the present work reproduced the overall shape of the experimental characteristic hydrodynamic curve more satisfactorily (
Figure 6a). Although deviations were still observed at the lowest and highest gas velocities, the model was able to capture the characteristic pressure-drop evolution, the transition to stable spouting, and the pressure levels associated with the fully developed spouting regime. This improved agreement indicates that the experimentally determined parameters provide a more realistic representation of particle–particle and particle–wall interactions in the studied system.
Furthermore, the minimum spouting velocity predicted using the experimentally determined coefficients (14.7 m·s
−1) was closer to the experimental value (14.83 m·s
−1) than that obtained using the coefficients reported by Xiao et al. [
34] (15.3 m·s
−1). However, the most significant improvement was observed in the overall agreement between the simulated and experimental characteristic curves, demonstrating that the accurate characterization of interaction parameters is essential not only for predicting the minimum spouting velocity, but also for reproducing the global hydrodynamic behavior of spouted beds.