Review

Distribution of Salts in Milk and Cheese: Critical Methodological Aspects

by
Gaurav Kr Deshwal
1,2,3,
Liesbeth van der Meulen
2,4 and
Thom Huppertz
2,4,5,*
1
Department of Food Chemistry and Technology, Teagasc Food Research Centre, P61 C996 Fermoy, Ireland
2
Department of Agrotechnology and Food Sciences, Wageningen University, Bornse Weilanden 9, 6708 WG Wageningen, The Netherlands
3
Dairy Technology Division, ICAR-National Dairy Research Institute, 132001 Karnal, India
4
FrieslandCampina, Stationsplein 4, 3818 LE Amersfoort, The Netherlands
5
School of Food and Nutritional Sciences, University College Cork, T12 YN60 Cork, Ireland
*
Author to whom correspondence should be addressed.
Encyclopedia 2024, 4(4), 1629-1643; https://doi.org/10.3390/encyclopedia4040107
Submission received: 28 September 2024 / Revised: 24 October 2024 / Accepted: 28 October 2024 / Published: 30 October 2024
(This article belongs to the Section Chemistry)

Abstract

:
The salt fractions of milk consist of cations (e.g., Ca, Mg, and Na) and anions (e.g., phosphate, citrate, and chloride). These salts are present as free ions or in complexes with other ions or proteins, primarily the caseins. Furthermore, significant levels of Ca and phosphate are also found in insoluble form, inside the casein micelles. The distribution of salts between this micellar phase and the soluble phase is important for the stability and properties of milk and dairy products. Various processes, such as (ultra-)centrifugation, (ultra-)filtration, dialysis, and selective precipitation have been used to separate the micellar and soluble phases in milk and dairy products to allow for studying the salts’ distribution between these phases. These different methods can lead to different levels of soluble salts because the salts in the supernatant from centrifugation, the permeate from ultrafiltration, and the diffusate from dialysis can differ notably. Hence, understanding which components are fractionated with these techniques and how this affects the levels of the soluble salts determined is critical for milk and dairy products. Applying the aforementioned methods to cheese products is further challenging because these methods are primarily developed for fractionating the soluble and micellar phases of milk. Instead, methods that analyze salts in water-soluble extracts, or soluble phases expressed from cheese by pressing or centrifugation are typically used. This review focuses on the significance of salt distribution and variations in salt fractions obtained using different methodologies for both milk and cheese.

1. Introduction

The distribution of salts in different forms and states of solubility in milk and dairy products is referred to as the salt distribution in milk and dairy products. In this context, the term “salts” is preferred over either “minerals” or “inorganic constituents” because several constituent salts in milk are not inorganic and most of the inorganic constituents in milk are not natural components that can be mined. For example, citrate salts are neither inorganic nor a mineral but they play a key role in the milk salts system [1]. Salts in milk are present either as free ions or as ions complexed with other ions, proteins, and peptides; furthermore, they can also occur in undissolved form, within the casein micelles [2]. The undissolved salts consist primarily of calcium and phosphate as well as some magnesium and citrate and are referred to as micellar calcium phosphate (MCP) [3].
Micellar calcium in milk is the calcium that—together with inorganic (Pi) and organic (Po) phosphate—forms the MCP nanoclusters in the casein micelles as well as the Ca associated directly with casein molecules in complexes that do not contain Pi. Soluble Ca in milk and dairy products is present either as ionic Ca2+ or complexed with anions, such as citrate and phosphate [4]. Various forms of P can be found in milk as well. Pi occurs as orthophosphate and is found in soluble and insoluble forms. Soluble Pi is found as free ions and complexes with cations, whereas insoluble Pi is found as part of the aforementioned MCP nanoclusters. Most Po is found in the form of phosphorylated serine (SerP) residues in the caseins but is also found in phospholipids, nucleotides, and sugar phosphates [5]. Milk contains approximately 120 mg Ca per 100 g, of which ~31% is soluble Ca and ~69% is micellar Ca. Furthermore, 100 g of milk contains 102 mg P, of which 30% is soluble Pi, 33% is micellar Pi, 12% is soluble Po, and 25% is insoluble Po [2,6].
The concentrations of salts, such as Ca, K, Mg, P, Cu, Fe, and Mn, in milk and dairy products can be determined by digesting the sample and measuring the total amount of salt using atomic absorption spectroscopy (AAS) or inductively coupled plasma optical-emission spectroscopy (ICP-OES) [7]. Some other salts, such as Cl, citrate, and lactate, cannot be determined with by these techniques and require different methods.
In addition to knowing the total concentrations of the salts, it is often desirable to know the distribution of the salts between the micellar and soluble phases in milk and dairy products. This distribution strongly affects the stability of casein micelles and, in turn, often that of milk and dairy products [4,8]. This distribution of salts between the micellar and soluble phases is usually estimated from concentrations of salts in the whole sample and the soluble phase, determined using the analytical methods as described above. However, the separation of the micellar and soluble phases is a point of careful consideration because any separation method used should not alter the distribution of the salts between the micellar and soluble phases [9]. The soluble fraction should have the same composition as the aqueous phase of milk and, therefore, to obtain this, the equilibrium in milk should be maintained [10]. Preparation of soluble fractions that still contain notable amounts of insoluble components—due to an inappropriate choice of methodology for the specific product matrix—can lead to inaccurate conclusions, as described and exemplified in Section 3.2. Hence, appropriate separation methods for each product matrix type are crucial.
The first reported study for obtaining the soluble fraction of milk used a porous earthenware filter [11]. Since then there have been four main approaches to separate the soluble and micellar fractions, i.e., centrifugation, ultrafiltration (UF), dialysis, and by rennet-induced coagulation of casein micelles [10]. In these approaches, the centrifugal supernatant, UF permeate, dialysate, and the rennet whey, respectively, are considered to represent the soluble fraction of the product. However, some more recent studies, as outlined in Section 3.2, have shown that these methods are by no means interchangeable and can give vastly differing outcomes in some cases. Furthermore, these fractionation methods cannot be used for all the dairy matrices and may require matrix-specific adaptations in process parameters like centrifugal force, amount of sample, and degree of sample dilution [10]. Moreover, for cheese and processed cheese, methods like cheese juice extraction and water-soluble extract have also been utilized [12,13,14,15].
This paper reviews the distribution of salts in milk and milk products between the soluble and micellar phases, with emphasis on the methodological approaches to fractionate these phases in milk and cheese. It will provide guidance on which methods should be the most suitable for measuring the salts’ distribution in different dairy products.

2. Significance of the Distribution of Salts in Milk

Table 1 illustrates some examples of the distribution of several salts between the micellar and soluble phases of milk. As outlined previously, salts in milk are present partly as free or complexed ions in solution, partly as ions associated to proteins, peptides, and phospholipids, and partly in undissolved form in the MCP. At the typical milk pH of 6.6–6.7, the aqueous phase of milk is saturated with respect to calcium phosphate [1], and these ions exist in a dynamic equilibrium between the MCP and soluble forms. This equilibrium is notably affected by, e.g., pH, temperature, concentration, and the addition of calcium sequestering salts (CSS) [1]. Some Mg and citrate are also present in MCP, even though the concentrations of PO4 or Ca salts thereof, respectively, do not exceed solubility limits [2]. Sodium and potassium are mainly present as free ions, and small fractions are also associated with citrate, Pi, and chloride. The distribution of salts between the micellar and soluble phases has a strong influence on the heat stability, alcohol stability, age-thickening, coffee stability, and rennet coagulation of milk [16,17].
As outlined above, the distribution of salts between the micellar and soluble phases of milk is dependent on many factors, including temperature. On heating milk, levels of ionic Ca, soluble Ca, and the pH decrease [18], whereas soluble Ca and PO4 may associate, which can cause the formation of insoluble salts that are transferred to the micellar phase [19]. This transfer follows the general reaction: C a 2 + + H 2 P O 4 C a H P O 4 + H + [3]. During concentration of milk, e.g., as a result of evaporation, further soluble Ca and PO4 are transferred to the micellar phase. The deposits in heat exchangers and falling film evaporators used in the dairy industry are also often calcium phosphate salts and calcium citrate tetrahydrate [20]. These processing-induced changes in the salts’ distribution affect various stability properties like thickening, coagulation, sedimentation, and age gelation, which are often linked to the distribution of calcium and phosphate [19]. Similarly, the amount of MCP influences the properties of rennet and acid gels and texture and the structure of yogurt [6]. Thus, there are numerous examples of milk salts moving between the micellar and soluble phases and affecting the processing characteristics and functionality of dairy milk products.

3. Determining the Salt Distribution in Milk

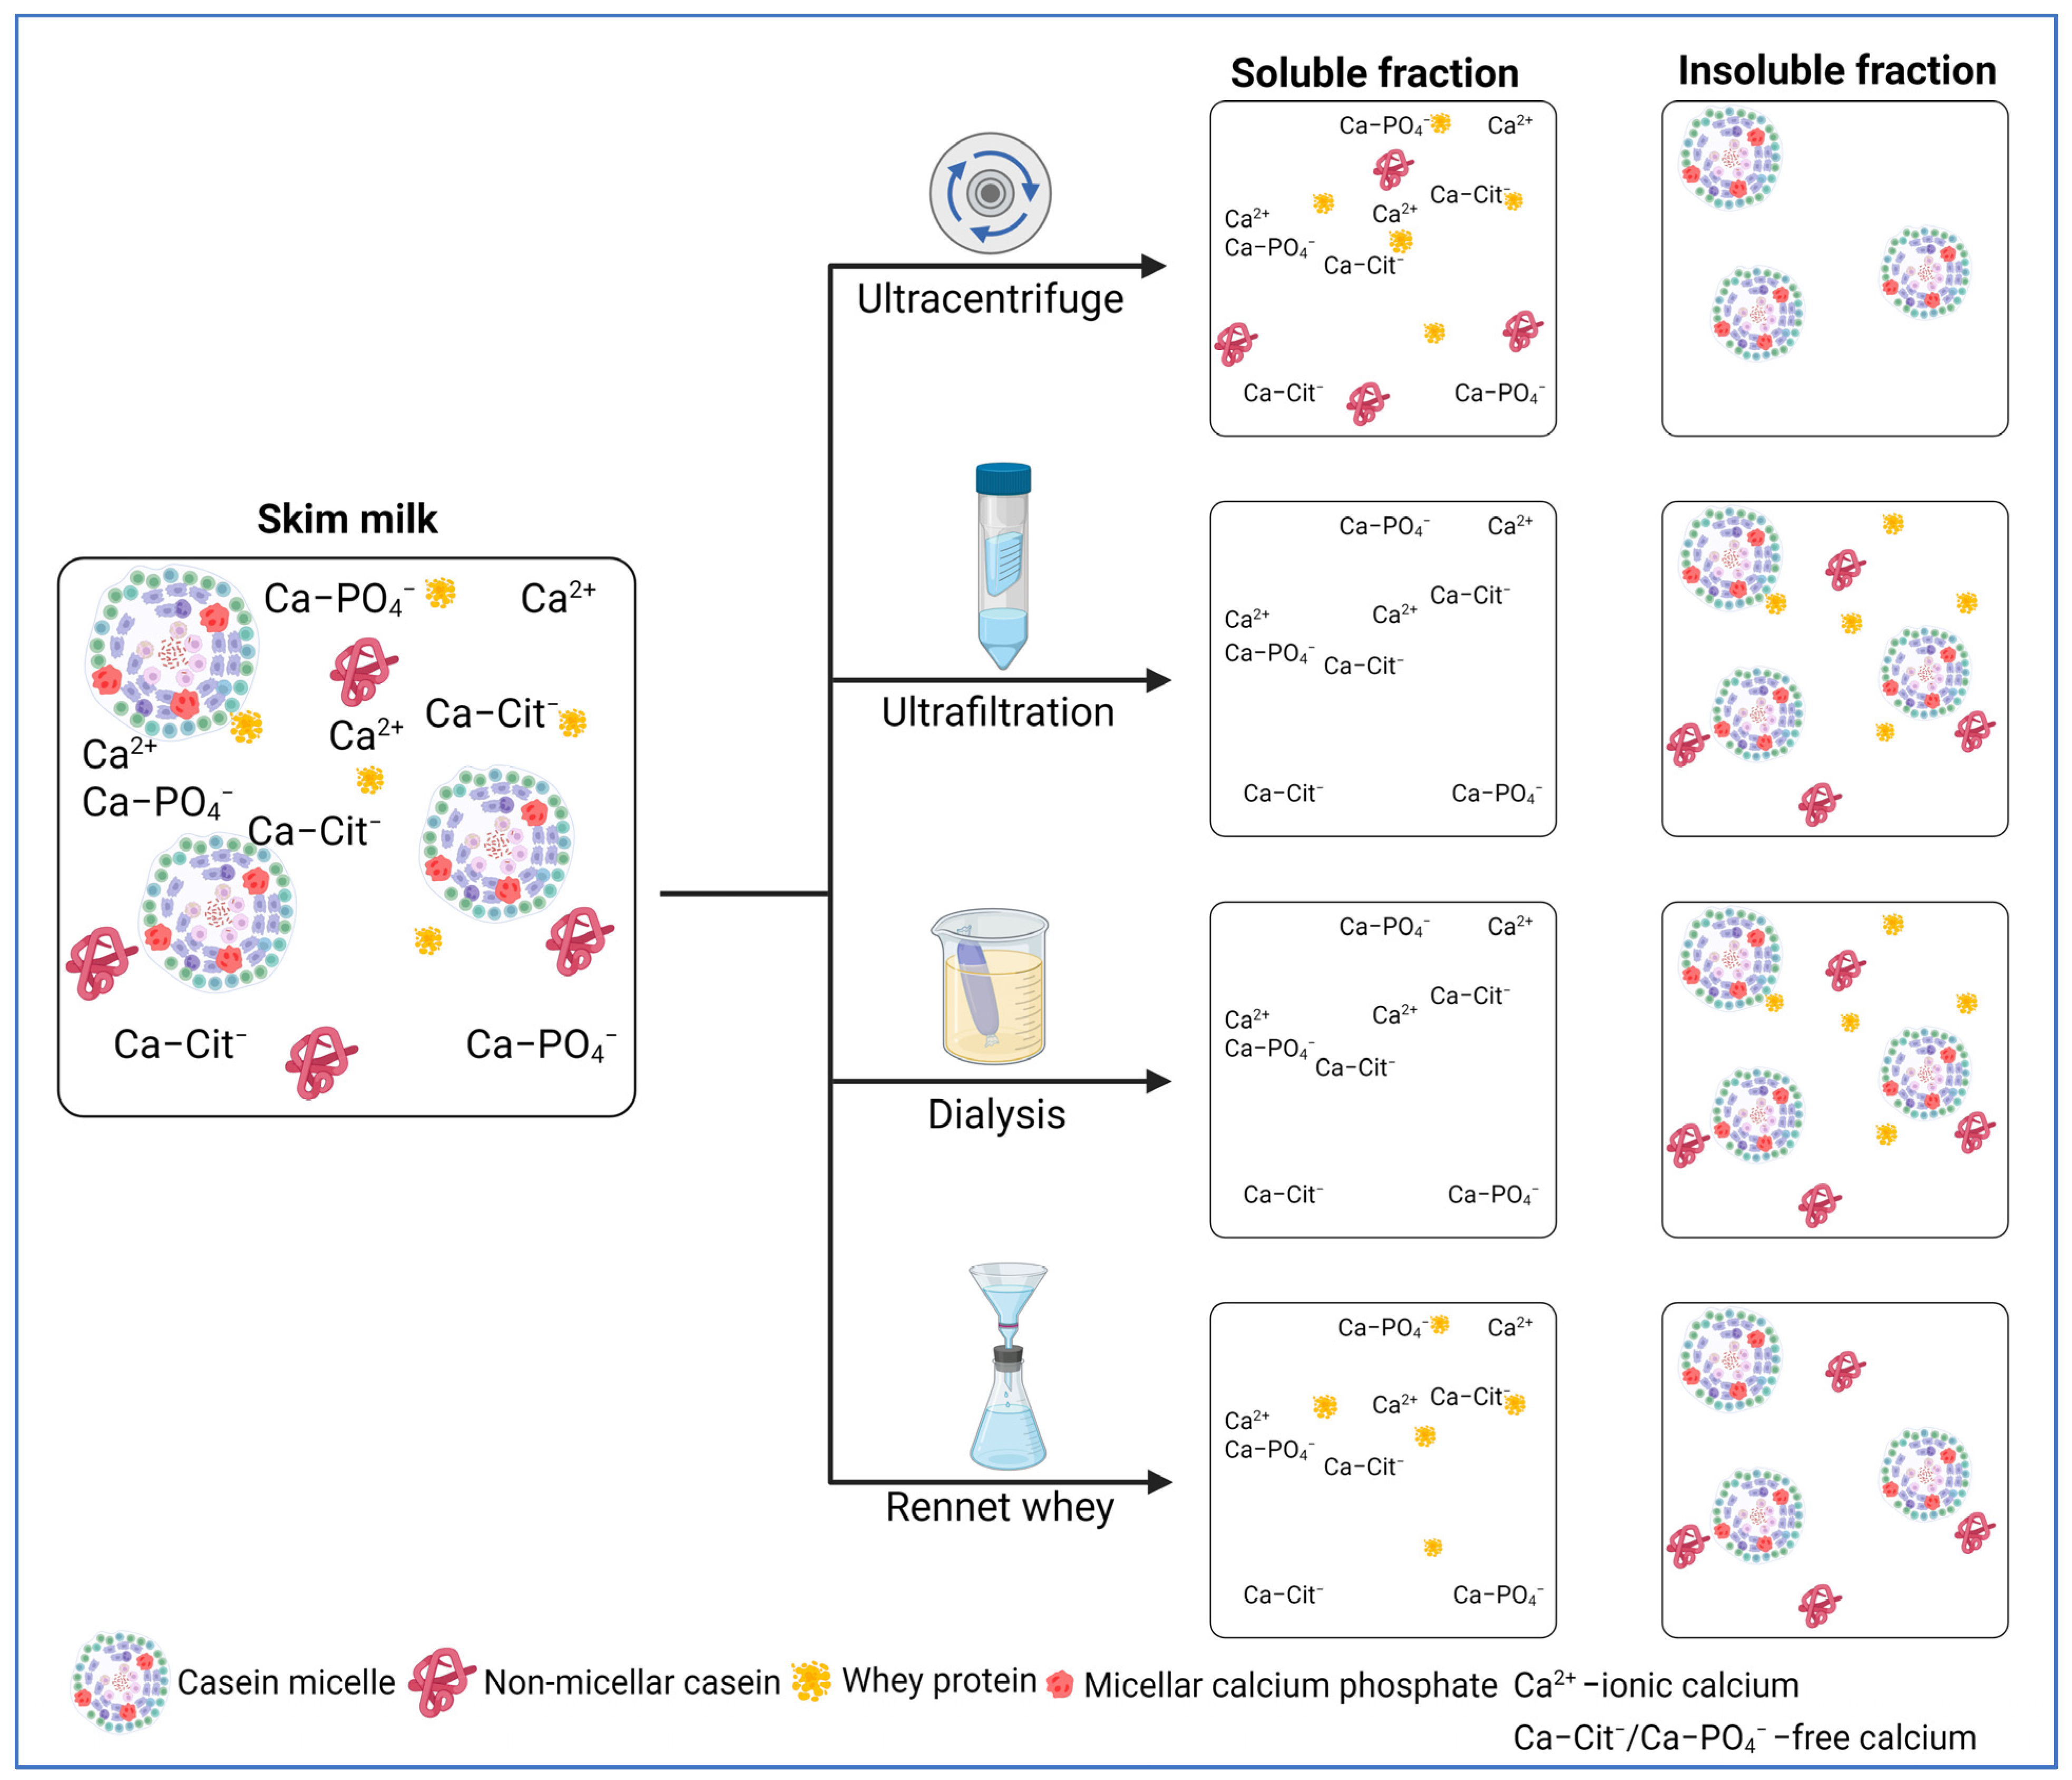
3.1. Methods for Fractionating Milk

As outlined in Section 2, studies focusing on determining the distribution of salts in milk often emphasize on separating the micellar phase from the soluble phase, followed by the determination of levels of salts in the different phases. The main methods that have been used to separate these phases have been centrifugation, UF, and dialysis as well as the precipitation of the micellar phase by rennet-induced coagulation. Furthermore, titration methods are also used. All these approaches will be covered in the subsections below. Then, in Section 3.2, we cover the differences in outcomes observed when these different methods are employed, which are notable.

3.1.1. (Ultra-)Centrifugation

The relative ease of its application has led to centrifugal separation being the most commonly used technique to separate the soluble (non-sedimentable) and micellar (sedimentable) fractions of milk. This technique has been used since the early 1890s [11]. Centrifugation is based on the basic principle of sedimentation, where suspended material settles out by gravity due to the differences in density between the particles and the aqueous phase [3]. In the context of centrifugal separation of the soluble and micellar phases of milk for studying the salt distribution, ultracentrifugation has often been used, whereas the non-sedimentable fraction, i.e., the supernatant, is typically considered the soluble phase. This supernatant may be obtained, e.g., by ultracentrifuging skim milk at 20,000 to 100,000× g for 1–3 h. After such ultracentrifugation of milk, the (insoluble) casein micelles and salts associated therewith are sedimented but non-micellar casein and whey proteins remain present in the supernatant (i.e., the soluble phase) along with the soluble salts and other soluble components [3]. The salts in the supernatant can include counterions for charged amino acid residues, ions that form specific complexes with proteins, e.g., the binding of a calcium ion by α-lactalbumin [1]. Because centrifugation only separates the casein micelles from the soluble phase, but not all protein, fractionation by centrifugation can provide insights into levels of salts associated with casein micelles but not levels of salts that are dissolved.

3.1.2. Ultrafiltration

Ultrafiltration (UF) is a pressure-driven membrane filtration process used to separate milk into a permeate and a retentate. The permeate contains compounds that are small enough to pass through the membrane, whereas larger compounds and particles are retained in the retentate. The permeate from UF of skimmed milk using a 5 or 10 kDa membrane contains water, lactose, ions, dissolved salts, and non-protein nitrogen compounds such as urea and free amino acids; the caseins and the whey proteins are retained in the retentate [16,21]. In one of the earliest studies for obtaining UF permeates from milk, Clark [22] used a UF apparatus consisting of rubber gaskets and cellophane sheets separated by sheets of rayon-based paper to prevent obstructing their filtering surface. Additionally, a hollow-fiber UF apparatus has been described for studying the milk salt balances with the provision for heating and holding milk at temperatures up to 90 °C. This system consisted of a polysulfone membrane with a 50 kDa molecular weight cut-off [23]. In addition to pressure-driven approaches, UF techniques driven by centrifugal force can also be used, whereby the sample is put on top of a UF membrane and centrifugal force is used to facilitate permeation. Because this type of UF is not cross-flow but dead-end filtration, it may be beneficial to apply this to ultracentrifugal supernatants rather than milk samples to prevent membrane fouling [24].
The determined concentrations of salts in the UF permeate are converted to concentration in milk by multiplying with the factor [g water per 100 g milk/g water per 100 g serum] [10,24]. Temperature, applied pressure, and porosity of the membranes affect the permeation of salts and lactose [10]. Ca content in the UF permeate of milk was similar for both 30 and 10 kDa permeates [25].
The key advantage of UF as a means of obtaining a soluble fraction is that by using membranes with an appropriate pore size (preferably 3–10 kDa), all proteins and salts associated therewith can be excluded from the soluble fraction, which is not the case in centrifugation-based techniques (see Section 3.1.1). As such, UF-based methods provide a soluble fraction that very closely approaches the amount of salts present that are dissolved. A combined approach of centrifugation and UF can provide additional insights in allowing distinction between micellar, dissolved, and protein-associated non-sedimentable salts [26].

3.1.3. Dialysis

Soluble fractions comparable to those obtained by UF can also be obtained by dialysis. Dialysis of milk utilizes a selectively permeable membrane with a molecular weight cut-off of, e.g., 3–20 kDa. If dialysis is used to obtain a representative soluble fraction from milk, a small volume of water is placed inside the dialysis tubing and the dialysis process is subsequently conducted by placing this tube in a large excess (e.g., 20–25 volumes) of milk for, e.g., 24–60 h at temperatures 4–20 °C [10,27]. The diffusate contains ionic and dissolved salts [2].
The milk-to-water ratio for performing dialysis can range from 1:12 to 1:50. Davies and White [10] reported that the diffusate obtained using milk-to-water ratios from 1:25 to 1:200 showed very little difference in the concentration of salts in the diffusate. The transfer rate of soluble Ca to dialysate was highest in the first 8 h of dialysis and decreased thereafter [28]. A minimum period of 48 h was reported to be required for the establishment of an equilibrium between the diffusate and the aqueous phase of the milk [10]. To convert levels of salts in the diffusate to levels of soluble salts in milk, the concentration of salt in the diffusate is multiplied by the correction factor (weight of water in 100 g of milk/weight of water in 100 g of diffusate) [10,27]. This enables correction for the levels of non-diffusing compounds in milk, e.g., proteins and fat.
Dialysis yields a soluble phase that provides a fairly accurate picture of the concentration of soluble salts since the transfer of salts is directly proportional to their concentration in milk [27]. Agitation of milk can reduce the effect of concentration polarization [16].
Dialysis offers similar benefits compared to those outlined earlier for UF (see Section 3.1.2) in that proteins cannot permeate through the membrane and a soluble fraction containing only the dissolved salts is obtained.

3.1.4. Rennet-Induced Casein Coagulation

In addition to the aforementioned methods, the rennet-induced coagulation of casein micelles—and their subsequent separation from whey by filtration or centrifugation—can also be used to obtain soluble fractions from milk. In this approach, milk is coagulated with rennet, the coagulum is cut, the curd and whey are separated, and the obtained whey is filtered. The salts found in the whey are considered to represent the soluble levels in milk [17] and can be converted to their corresponding content in milk by multiplying with the factor [100 − (%fat + %protein − 0.4)]/100 [29]. This method is simple, fast, and does not require specialist equipment; however, the method does suffer from some similar drawbacks as the centrifugation method (Section 3.1.1) in that the whey still contains whey proteins that bind to some salts [1]. In addition, the method may not be applicable to all milk types; for instance, heated milk coagulates poorly by rennet due to excessive whey protein denaturation and their complexation with casein micelles [30].

3.1.5. Titration Method

In addition to the aforementioned methods based on the separation of micellar and soluble fractions of milk, titration methods have also been used to provide insights into the salt distribution in milk. These methods typically rely on the buffering index, which varies with pH [31,32]. The buffering index, dB/dpH, can be calculated by the following formula:
dB dpH = m L   o f   a c i d   o r   b a s e   a d d e d × n o r m a l i t y   o f   a c i d   o r   b a s e v o l u m e   o f   s a m p l e × p H   c h a n g e   p r o d u c e d
where dB/dpH is unitless and expresses the relationship between the increments of strong base (B) added to a buffer solution and the subsequent increase in pH. Increments of strong acid are equivalent to a negative increment of base (-dB) [31].
During acidification of milk, a buffering maximum is observed at pH∼5.1, which corresponds to the solubilization of MCP; this results in the release of phosphate ions that cause buffering. On back-titrating the acidified milk with alkali, buffering was low at pH 5.1 as MCP was already solubilized; however, the buffering peak occurs at pH∼6.3 due to the release of H+ from (HPO4)2− and (H2PO4), which can combine with OH [32]. On titrating MCP-free milk with acid, a buffering peak was observed at pH 4.2 due to buffering by aspartate, glutamate, and citrate groups. On back-titrating, the maximum buffering peak occurred at pH 4.2 with a weak buffering peak at pH 6.2 attributed to histidine residues, phosphoric acid, and carbonates [32]. However, it is not straightforward to relate buffering capacity with specific changes in a single salt or another component.
While differences in the MCP peak in the buffering curves of milk are relatively easy to determine, they serve primarily as an indicator of shifts in some salt distributions. They allow limited insights into salts’ distribution because the buffering effects are derived only from a limited number of anions (e.g., phosphate and citrate) and proteins, whereas other anions, (e.g., chloride) and cations are not considered. Furthermore, these titration approaches allow only for a single value to be obtained and do not provide insights into individual salts.

3.2. Method-Dependent Effect on Salt Distribution in Milk

Table 2 summarizes the levels of soluble Ca in milk whereby the soluble phase was derived using different methods. From this, it is clear that there are method-dependent differences. Davies and White [10] directly compared the effect of UF, dialysis, ultracentrifugation, and rennet-induced coagulation for isolation of the soluble phase of milk. They reported that the concentrations of soluble salts obtained using UF and dialysis at 20 °C were virtually identical [10]. In comparison to UF permeate and dialysis, the ultracentrifugal supernatant and rennet whey contained higher levels of salts. This is presumably due to the presence of whey proteins and some non-sedimentable casein complexes binding salts in the centrifugal supernatant and whey proteins and some casein proteolysis products in rennet whey [9].
While aforementioned studies comparing dialysis, UF, ultracentrifugation, and rennet-induced casein coagulation on raw milk samples show relatively small differences between the techniques, much larger differences can be seen when technological treatments are applied to milk, particularly those that can cause dissociation of the casein micelles. One such technique is enzymatic deamidation, whereby protein-bound glutamine residues are converted to glutamic acid residues, leading to an increased net-negative charge on the caseins, and, as a result of which, dissociation of the casein micelles occurs [33]. Miwa, Yokoyama, Wakabayashi, and Nio [33] determined both the levels of non-sedimentable (100,000× g for 60 min) and 5-kilodalton-permeable Ca in samples subjected to enzymatic deamidations. The Ca concentration obtained in the non-sedimentable phase after ultracentrifugation of skim milk increased with increasing levels of deamidation. However, the Ca content in the 5-kilodalton-permeable fraction of the same samples remained largely unaffected. This difference between the two fractions indicates that enzymatic deamidation milk did not actually cause solubilization of calcium phosphate—which is in line with expectations—and that increases in non-sedimentable Ca may be attributed to micellar dissociation, leading to substantial increases in non-sedimentable casein and calcium associated therewith [33]. These findings thus suggest the critical importance of selecting appropriate methods for fractionation methods for determining salt distribution in milk. In this specific case, centrifugation results would lead to completely different conclusions compared to UF results.
A similar finding was reported on high-pressure (HP) treated milk by Regnault et al. [34], who compared levels of non-sedimentable (149,000× g for 55 min at 20 °C) and 10-kilodalton-permeable Ca and P in skim milk and phosphocasein suspensions subjected to HP treatment. Like for deamidation described above, HP treatment can also result in notable disruption of casein micelles, as seen from, e.g., reduced particle size and increased levels of non-sedimentable casein [33]. The comparison of non-sedimentable and non-permeable Ca and P by Regnault, Dumay, and Cheftel [34] showed that HP treatment increases levels of non-sedimentable Ca and P but does not increase levels of 10-kilodalton-permeable Ca and P. Again here, it would appear that the increased levels of non-sedimentable Ca and P are because of micellar disruption rather than increases in dissolved Ca and P [34].
Deshwal, Fenelon, Gómez-Mascaraque, and Huppertz [26] studied the solubilization of Ca and P from micellar calcium isolate (MCI) by calcium sequestering salts (CSS) by studying salt levels in both the ultracentrifugal supernatant and the 10-kilodalton-permeable fraction thereof. Both citrate and various polyphosphate salts caused an increase in non-sedimentable Ca but only citrate also caused an increase in 10-kilodalton-permeable Ca [26]. This again highlights the strong requirement for careful consideration of methodologies because again, very different conclusions would be drawn from the ultracentrifugation experiments than the UF experiments if considered in isolation.
From the above, it is clear that, particularly in samples where micellar disruption has occurred, method selection becomes critical in studying salt distribution. Only UF and dialysis can give indications of the dissolved salts. The supernatant from ultracentrifugation, however, contains both the dissolved salts and those associated with non-sedimentable proteins, which can represent a substantial fraction of Ca and P in samples where casein micelles have been dissociated. Application of a combination of methods, as performed in the aforementioned studies, can provide these insights, whereas single methods cannot and can even lead to misinterpretations.
Table 2. Levels of soluble Ca determined with different salt distribution methods.
MilkPropertiesTotal Ca (mg/100 g)% Soluble CaMethod UsedReference
BovineCasein = 2.46% 14342.6Centrifugation[12]
Bovine milkAcidity = 0.163% LA12625.1Rennet whey[35]
Milk (85 °C for 30 min)Acidity = 0.161% LA13421.2Rennet whey[35]
Skim milkAcidity = 0.15%LA-40Dialysis[27]
Skim milkAcidity = 0.20%LA-42Dialysis[27]
Skim milkAcidity = 0.30%LA-60Dialysis[27]
Raw milkFat = 1.01%; pH = 6.62111.340.5Ultrafiltration (30 kDa)[25]
Milk (63 °C for 30 min)Fat =1.01%; pH = 6.62108.730.9Ultrafiltration (30 kDa)[25]
Milk (72 °C for 15 s)Fat = 1.01%; pH = 6.62110.027.8Ultrafiltration (30 kDa)[25]
Milk (130 °C for 2 s)Fat = 1.01%; pH = 6.62108.634.6Ultrafiltration (30 kDa)[25]
Whole milk-110.816Dialysis for 16 h[28]
Whole milk -110.827Dialysis for 32 h[28]
Whole milk-110.842Dialysis for 48 h[28]
Figure 1 illustrates the distribution of milk components between the soluble and micellar phases after undergoing different fractionation techniques. Centrifugation separates into pellet and supernatant representing the sedimentable and non-sedimentable fractions, respectively [3]. The non-sedimentable fraction is by no means a serum and should not be referred to as serum. The non-sedimentable fraction obtained by (ultra-)centrifugation can include both soluble as well as protein-associated salts and considering all salts therein to be dissolved would lead to a notable overestimation of dissolved salt concentrations [26]. Detailed information can be attained by measuring the amounts of salts present in permeates or dialysates of samples where membranes allow permeation of salts and prevent proteins and associated salts [4]. Only the soluble salts are found in the UF permeate, and the MCP and any other protein-associated salts are concentrated in UF retentate. Even small changes in MCP can induce solubilization of individual caseins from within the micelles [21]. During concentration by UF, MCP remains intact in the absence of water addition or without diafiltration [21]. Taken from this point of view, the levels of salts in (ultra-)centrifuged supernatant represent the non-sedimentable fraction, while their levels in UF permeates or dialysates represent the dissolved fraction [26].

4. Salts’ Distribution in Cheese

4.1. Methods for Salt Distribution in Cheese

In addition to in milk, it is also important to understand the distribution of salts in cheese. The so-called insoluble Ca, which is the Ca associated with the components of the cheese matrix, modulates the textural and functional properties of cheese and processed cheese products [12]. As described in Section 3, the distribution of salts between the micellar and soluble phases of milk and other liquid products can be determined by fractionation and filtration methods [26]. In cheese, however, this fractionation is far more challenging because of the different types of matrix consisting of higher levels of casein protein and associated salts [36]. Hence, the common methods for liquid dairy products described in Section 3 cannot be applied to cheese. Different methods are described in the literature to determine the distribution of salts in cheese. An overview of soluble Ca determined with these methods is shown in Table 3 and some characteristics of the methods are shown in Table 4. In addition to the methods for milk (Section 3), the methods for cheese also need to be critically assessed.

4.1.1. Cheese Pressing

One of the methods used for obtaining a soluble phase from cheese is based on pressing cheese. This cheese-pressing method was originally developed to obtain a so-called cheese juice from cheese for the analysis of the nitrogen content and rennet activity in the juice [14]. This method was further optimized and adapted for obtaining cheese juice for the analysis of salts [12,40]. A schematic overview of this method for obtaining cheese juice is shown in Figure 2. In this method, comminuted cheese is mixed with acid-washed sand at a 1:2 ratio and pressed hydraulically for 60–90 min with stepwise increases in pressure from 1 to 6 tonnes. When the cheese-sand mixture is pressed, a liquid extract consisting of a fat phase and aqueous solution is obtained. The aqueous part of the extract is referred to as cheese juice and the level of salts in cheese juice represents the soluble salts in cheese [12,37]. The percentage of an insoluble salt (X) in cheese can be calculated as follows [12]:
%   I n s o l u b l e   s a l t   X i n   c h e e s e = ( C o n c .   o f   X   i n   c h e e s e M o i s t u r e   ( k g / k g   c h e e s e ) C o n c .   o f   X   i n   j u i c e M o i s t u r e   ( k g / k g   j u i c e ) ) × M o i s t u r e   i n   c h e e s e C o n c .   o f   X   i n   c h e e s e × 100
To enable the comparison of the composition of the juice and the cheese, the results are expressed in g per kg of water in juice, which is calculated as outlined below [47]:
X   g / k g   o f   w a t e r   i n   j u i c e = C o n c .   o f   X   i n   j u i c e ( 1000 t o t a l   s o l i d s   ( g / k g   j u i c e ) ) × 1000
Another approach for obtaining cheese juice for salts analysis is described by Monib [40], where freeze-dried cheese was resolubilized under different conditions, mixed with sand, followed by the pressing of these cheeses and measuring the influence of different parameters on both the soluble and insoluble fractions of the cheese.
The amount of juice from cheese depends on the cheese variety, maturity level, curd type (rennet- or acid-coagulated), and curd treatments, such as cooking and pressing [14,47]. Boutrou, Gaucheron, Piot, Michel, Maubois, and Léonil [47] reported a decrease in the amount of obtained juice from 740 to 186 g of juice per kg of water in cheese for ripening Camembert from 0 to 16 days. This method has been used to monitor the changes in the distribution of salts and other compounds during cheese ripening [37,38,40]. The pressing of cheese to obtain cheese juice can be used on a wide variety of cheeses but may be more suitable (semi-)hard cheese varieties than for soft cheese varieties. Difficulties in extracting juice for some processed cheese products have been reported. This is probably due to the smooth texture of processed cheese products, which leads to the sample material passing through the pores of the base plate in the hydraulic press [36]. The fouling of holes in the cheese press hoop and the bursting of the cheese cloth has been reported during the pressing of Camembert cheese [47].
One complication of the cheese juice method may be that cheese juice represents only the “free” water fraction and not the “bound” water fraction. In natural cheese, 1 g of protein binds ~0.125 g of water; however, in processed cheese, the creation of complexes between Ca and CSS with or without casein alters the state of water and salt equilibrium [12,36]. Therefore, the cheese-pressing method might not be a feasible method for processed cheese.

4.1.2. Expressible Serum by Centrifugation

Next to the extraction of cheese juice by pressing (see Section 4.1.1), centrifugation has also been used to express a soluble phase from cheese; this phase has been referred to as expressible serum. In this method, grated cheese was centrifuged at 12,500× g for 75 min at 20–25 °C, leading to an insoluble pellet, middle layer of expressed cheese serum. and fat layer on top [42]. This approach has been used mainly for fresh mozzarella cheese containing 45–50% moisture [42,43]. A potential drawback of this method is that serum cannot be expressed for all cheese types. For instance, serum expression for mozzarella was shown to be dependent on the method of acidification and cheese age [14]. For cheddar cheese, no expressible serum was obtained even after ultracentrifugation at 100,000× g for 2 d [12]. Hence, while the expressible serum method is certainly appealing and easier than the cheese-pressing method, it may not be applicable to all cheese types.

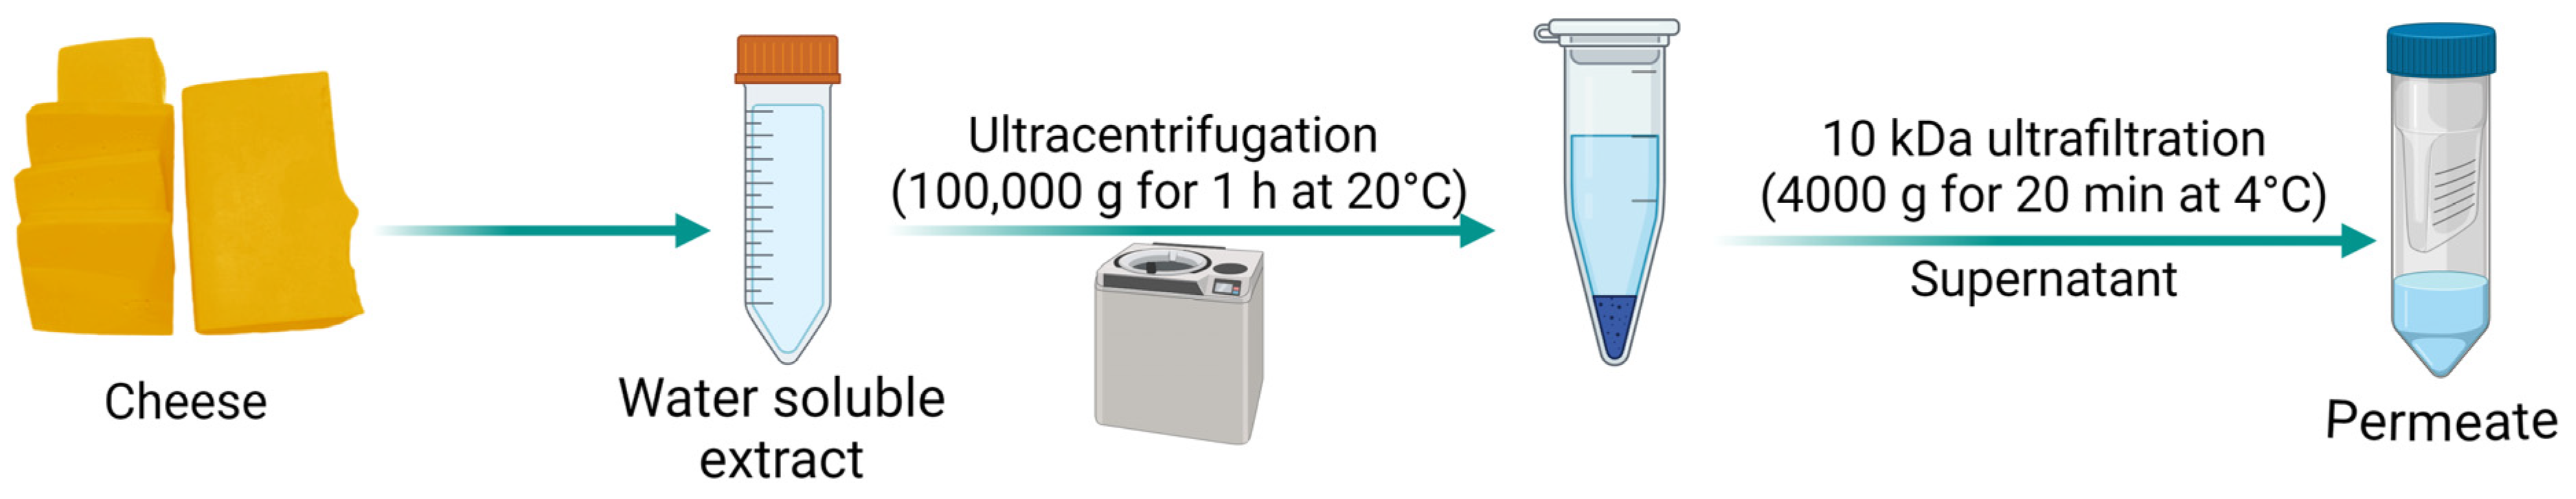
4.1.3. Water-Soluble Extract

Next to cheese juice (Section 4.1.1) and expressible serum from cheese (Section 4.1.2), the preparation of a water-soluble extract (WSE) from cheese has also been described as enabling the determination of the distribution of salts in cheese [15,45]. The methodology is illustrated in Figure 3. The WSE from cheese was obtained after mixing of cheese with water (40–45 °C) at a 1:1 to 1:10 ratio using a stomacher or ultra-turrax—which solubilizes the cheese in water—and centrifuging the cheese–water mixture at 3000× g for 30 min at 4 °C, followed by subsequent filtration of the supernatant through glass wool [36,45]. In addition to determining the concentrations of the different salts in the WSE, it is also important to understand the percentage of the salts in cheese that are considered soluble. To assess this, Na has been considered as a marker because it will not form specific complexes and 100% of sodium would be expected to be obtained in the WSE [36], an overview of the method used in the study is shown in Figure 3. Hence, the % of soluble levels for the other salts could be calculated as follows [36]:
%   s o l u b l e   s a l t s = O r i g i n a l   %   s a l t   i n   W S E A m o u n t   o f   W S E × C a l c u l a t e d   W S E   a m o u n t   f o r   100 %   N a   i n   W S E

4.1.4. Titration Method

In addition to the aforementioned methods where levels of salts are determined in cheese juice (Section 4.1.1), expressed cheese serum (Section 4.1.2), or in the WSE of cheese (Section 4.1.3), a titration method similar to the one described in Section 3.1.5 has also been used for studying the distribution of salts in cheese. The titration method is based on acid–base buffering curves obtained by plotting the buffering index as a function of pH. Cheese slurry is prepared by mixing 8 g of cheese with 40 mL of distilled water at 50 °C using an ultra-turrax for 3 min at 20,000 s−1; this is then titrated from its initial pH to pH 3 with 0.5 M HCl, and then to pH 9 with 0.5 M NaOH at 25 °C [12]. The difference in the peak areas of acid and base titration is used to calculate the amount of insoluble Ca [12,48].
The peak area of the curves is determined with the following equation [12]:
d B d p H = ( v o l u m e   o f   a c i d   o r   b a s e   a d d e d ) × ( n o r m a l i t y   o f   a c i d   o r   b a s e ) v o l u m e   o f   s a m p l e × ( p H   c h a n g e   p r o d u c e d )
The concentration of insoluble Ca is calculated as outlined below [14]:
I n s o l u b l e   C a ( m g 100   g ) = m g   i n s o l u b l e   C a   p e r   100   g   m i l k A m × A c × D
where Am and Ac represent the residual area when the back-titration is subtracted from the forward-titration for the milk (Am) and cheese (Ac), respectively, and D is the dilution factor for the cheese.
The buffering capacity of cheese is mainly contributed to by caseins and their degradation products as well as Pi and organic acids like acetate, butyrate, citrate, carbonate, lactate, and propionate [49]. With reference to the buffering capacity of cheese, it is important to note that different MCP forms contribute differently. For example, a Ca3(PO4)2 precipitate would have a higher buffering capacity than CaHPO4 at an equal level of phosphorus due to their different degrees of protonation [50].
The titration method, however, does not allow for differentiation between specific salts and/or other buffering compounds during acid–base titration [48]. Previously, 36 different compounds were identified as responsible for the buffering capacity of cheese and there was a noteworthy overlap of their contributions in different pH regions [50]. For example, MCP and glutamate were significant contributors to buffering between pH 4.5 and 5.5, whereas citrate was less responsible, owing to the low concentrations [44,50]. It has been reported that sample dilution during preparation of cheese slurry may solubilize some Ca, resulting in higher values of soluble Ca [12]. Moreover, pH increases due to dilution lead to lower values of soluble Ca as obtained by the titration method [12].

4.2. Method-Dependent Effects on Salt Distribution in Cheese

Compared to milk (Section 3.2), much fewer direct comparisons have been carried out between different fractionation methods for cheese. Hassan, Johnson, and Lucey [12] compared the use of the press as compared to the buffer method. Based on these results, similar insoluble values were found, especially at cheese older than 2 weeks. Up to this age, differences around 5% absolute (69.7 vs. 75.7 and 64.2 vs. 69.3) were found regarding the insoluble calcium percentage, which were not significantly different [12]. Hassan, Johnson, and Lucey [12] also compared their results to the expressible cheese method, although this proved to be difficult; several assumptions had to be made with the available data from the previously described expressible serum method, which only covered the cheese up to an age of 2 weeks, and these calculations gave an insoluble calcium amount varying between 75 and 80%. The juice method has been described as the ideal method to study mineral equilibrium in cheese as there is no dilution or solubilization of cheese components [12,39]. In addition, the expressible serum method does not have this drawback.

5. Conclusions and Future Perspectives

The distribution of salts is important for the control of many milk and dairy properties. However, studying the distribution of salts in these products is challenging because it can be difficult to isolate a representative soluble phase from milk or cheese. For milk, it is critical that the soluble phase is free of protein to avoid protein-associated salts erroneously becoming considered as soluble salts. This makes membrane-based fractionation methods such as UF and dialysis ideal because the proteins cannot permeate through the membrane if sufficiently small pore sizes are applied. Removal of the casein fraction by centrifugation of rennet-induced coagulation will not remove all salts associated with the protein fraction and can thus provide overestimations of levels of soluble salts. When such measurements are carried out on milk systems that have undergone treatments that dissociate casein micelles, such as, e.g., HP treatment or enzymatic deamidation, these overestimations can be very extreme and not only lead to quantitative deviations but also qualitative deviations, i.e., unfounded conclusions about the solubilization of MCP may be made. Hence, while filtration and dialysis methods are typically more time-consuming than centrifugation and rennet coagulation methods, they are critical to ensure achieving proper insights into salts’ distribution in milk and milk products. Estimations from titrimetrically determined buffering capacity curves may provide some insights but cannot provide detailed insights on individual salts because it does not allow for the distinction between specific salts. Furthermore, it should be considered that the acid–base buffering curves that form the basis of this approach only consider the buffering compounds, i.e., some of the anions as well as the proteins. Cations and some other anions, e.g., chloride, are not considered here.
For cheese, the semi-solid product matrix provides even further challenges because filtration and dialysis methods that can be used for milk and milk products cannot be used here. The most suitable methods separate a soluble fraction from cheese and use this to determine levels of salts in the soluble fraction—as well as those in the whole cheese—to calculate mineral distribution. The main challenge herein lies in the separation of the soluble fraction from the cheese. Pressing and centrifugation methods have been applied successfully on a range of cheese samples; however, there are also reported cases where the soluble phase could not be extracted, e.g., due to strong moisture-binding by the protein matrix or excessive deformation of the matrix during pressing or centrifugation. In those cases, the preparation of a WSE from cheese, and the determination of levels of the salts therein, is the most suitable alternative. Care should be taken that the dilution of cheese with water in the preparation of the WSE does not (partially) solubilize insoluble salts and/or affect the pH, which in turn affects mineral distribution. However, currently established methods for WSE preparation do appear to be a suitable alternative when pressing or centrifugation methods cannot be used. The regularly used acid–base titration method suffers from some downsides. Notably, the acid–base titration method considers only part of the constituents that influence the outcomes of the measurement and, in comparison to an original milk sample, appears to be a prerequisite for obtaining (semi-)quantitative outcomes. This limits the applicability of the method. Additionally, while it certainly has its uses as a (relatively) rapid indicator, it does not provide detailed information of salts’ specification.
From the above, it is clear that studying salts’ distribution in milk and dairy products is by no means an easy undertaking due to methodological constraints. However, the importance of understanding of salts’ distribution is beyond doubt, thus justifying significant efforts in this field. Obviously, non-destructive in situ measurements would be ideal but the ideal method does not appear to be readily available. NMR-based methods can provide insights from some salts, e.g., P or Ca but not for all other salts. Further developments in this are worthwhile exploring. Detailed analysis of X-ray fluorescence (XRF) spectra also provides interesting opportunities but require further research. In the absence of non-destructive methods, the fractionation method currently applied and described in Section 3 and Section 4 remains the state of the art. For the separation of a soluble phase from liquid products, UF and dialysis approaches appear suitable, and further study on the use of Donnan membranes to specifically separate ions is encouraged. For the separation of a soluble phase from cheese, current methods of expressing a soluble phase by pressing or centrifugation result in the most representative soluble phase but cannot be applied to every cheese type. Further research into more widely applicable methods is recommended.

Author Contributions

Conceptualization, G.K.D., L.v.d.M. and T.H.; Writing—original draft, G.K.D. and L.v.d.M.; Writing—review and editing, G.K.D., L.v.d.M. and T.H.; Funding acquisition, T.H.; Project administration, T.H. All authors have read and agreed to the published version of the manuscript.

Funding

Gaurav Kr Deshwal is a recipient of a Walsh Scholarship from Teagasc, the Irish Agricultural and Food Development Authority (Ref 2020213).

Institutional Review Board Statement

Not applicable.

Informed Consent Statement

Not applicable.

Data Availability Statement

Data are contained within the article.

Conflicts of Interest

L.v.d.M. and T.H. are employed by FrieslandCampina. The research was conducted without any relationships with the company that could be construed as potential conflicts of interest. The other authors declare that they have no conflicts of interest or personal relationships that could have appeared to influence the work reported in this paper. The funders had no role in the design of this study; in the collection, analyses, or interpretation of data; in the writing of the manuscript; or in the decision to publish the results.

References

  1. Gaucheron, F. Milk salts: Distribution and Analysis. In Encylopedia of Dairy Sciences; Academic Press: Cambridge, MA, USA, 2011; pp. 908–916. [Google Scholar]
  2. Lucey, J.; Horne, D. Milk salts: Technological significance. In Advanced Dairy Chemistry: Volume 3: Lactose, Water, Salts and Minor Constituents; Springer: Cham, Switzerland, 2009; pp. 351–389. [Google Scholar]
  3. Walstra, P.; Wouters, J.T.; Geurts, T.J. Dairy Science and Technology, 2nd ed.; CRC Press: Boca Raton, FL, USA, 2005. [Google Scholar]
  4. Li, Y.; Corredig, M. Calcium release from milk concentrated by ultrafiltration and diafiltration. J. Dairy Sci. 2014, 97, 5294–5302. [Google Scholar] [CrossRef] [PubMed]
  5. White, J.; Davies, D. 712. The relation between the chemical composition of milk and the stability of the caseinate complex: I. General introduction, description of samples, methods and chemical composition of samples. J. Dairy Res. 1958, 25, 236–255. [Google Scholar] [CrossRef]
  6. Koutina, G.; Knudsen, J.C.; Andersen, U.; Skibsted, L.H. Influence of colloidal calcium phosphate level on the microstructure and rheological properties of rennet-induced skim milk gels. LWT-Food Sci. Technol. 2015, 63, 654–659. [Google Scholar] [CrossRef]
  7. AOAC International. Official methods of analysis of the Association of Analytical Chemists International. In Official Methods; AOAC International: Gaithersburg, MD, USA, 2005. [Google Scholar]
  8. Eshpari, H.; Jimenez-Flores, R.; Tong, P.; Corredig, M. Thermal stability of reconstituted milk protein concentrates: Effect of partial calcium depletion during membrane filtration. Food Res. Int. 2017, 102, 409–418. [Google Scholar] [CrossRef]
  9. Smith, J. Reviews of the progress of dairy science. J. Dairy Res. 1961, 28, 87. [Google Scholar] [CrossRef]
  10. Davies, D.; White, J. The use of ultrafiltration and dialysis in isolating the aqueous phase of milk and in determining the partition of milk constituents between the aqueous and disperse phases. J. Dairy Res. 1960, 27, 171–190. [Google Scholar] [CrossRef]
  11. Van Slyke, L.L.; Bosworth, A.W. Condition of casein and salts in milk. J. Biol. Chem. 1915, 20, 135–152. [Google Scholar] [CrossRef]
  12. Hassan, A.; Johnson, M.; Lucey, J. Changes in the proportions of soluble and insoluble calcium during the ripening of Cheddar cheese. J. Dairy Sci. 2004, 87, 854–862. [Google Scholar] [CrossRef]
  13. Lucey, J.; Mishra, R.; Hassan, A.; Johnson, M. Rheological and calcium equilibrium changes during the ripening of Cheddar cheese. Int. Dairy J. 2005, 15, 645–653. [Google Scholar] [CrossRef]
  14. Barthel, C.; Sandberg, E.; Haglund, E. Research on rennin in cheese. Le Lait 1928, 8, 762–768. [Google Scholar] [CrossRef]
  15. Deshwal, G.; Fenelon, M.; Gómez-Mascaraque, L.; Huppertz, T. Influence of calcium sequestering salt type and concentration on the characteristics of processed cheese made from Gouda cheese of different ages. Food Res. Int. 2024, 114587. [Google Scholar]
  16. Lewis, M. Partitioning milk constituents. In Advanced Dairy Chemistry: Volume 3: Lactose, Water, Salts and Minor Constituents; Springer: Berlin/Heidelberg, Germany, 2022; pp. 339–416. [Google Scholar]
  17. Verma, I.; Sommer, H. Study of the naturally occurring salts in milk. J. Dairy Sci. 1957, 40, 331–335. [Google Scholar] [CrossRef]
  18. On-Nom, N.; Grandison, A.; Lewis, M. Measurement of ionic calcium, pH, and soluble divalent cations in milk at high temperature. J. Dairy Sci. 2010, 93, 515–523. [Google Scholar] [CrossRef]
  19. Anema, S.G. Effect of milk solids concentration on the pH, soluble calcium and soluble phosphate levels of milk during heating. Dairy Sci. Technol. 2009, 89, 501–510. [Google Scholar] [CrossRef]
  20. Tanguy, G.; Tuler-Perrone, I.; Dolivet, A.; Santellani, A.-C.; Leduc, A.; Jeantet, R.; Schuck, P.; Gaucheron, F. Calcium citrate insolubilization drives the fouling of falling film evaporators during the concentration of hydrochloric acid whey. Food Res. Int. 2019, 116, 175–183. [Google Scholar]
  21. Ferrer, M.A.; Alexander, M.; Corredig, M. Does ultrafiltration have a lasting effect on the physico-chemical properties of the casein micelles? Dairy Sci. Technol. 2011, 91, 151–170. [Google Scholar] [CrossRef]
  22. Clark, L., Jr. An easily constructed apparatus for preparing ultrafiltrates. J. Lab. Clin. Med. 1951, 37, 481–484. [Google Scholar]
  23. Pouliot, Y.; Boulet, M.; Paquin, P. An experimental technique for the study of milk salt balance. J. Dairy Sci. 1989, 72, 36–40. [Google Scholar]
  24. Wang, Q.; Holt, C.; Nylander, T.; Ma, Y. Salt partition, ion equilibria, and the structure, composition, and solubility of micellar calcium phosphate in bovine milk with added calcium salts. J. Dairy Sci. 2020, 103, 9893–9905. [Google Scholar]
  25. Yoo, S.-H.; Kang, S.-B.; Park, J.-H.; Lee, K.-S.; Kim, J.-M.; Yoon, S.-S. Effect of heat-treat methods on the soluble calcium levels in the commercial milk products. Food Sci. Anim. Resour. 2013, 33, 369–376. [Google Scholar] [CrossRef]
  26. Deshwal, G.; Fenelon, M.; Gómez-Mascaraque, L.; Huppertz, T. Influence of citrate-and phosphate-based calcium sequestering salts on the disruption of casein micelles. Food Hydrocoll. 2024, 153, 109970. [Google Scholar] [CrossRef]
  27. Lampitt, L.H.; Bushill, J.H.; Filmer, D.F. Dialysis of milk: Salt equilibrium with special reference to calcium, magnesium and phosphorus. Biochem. J. 1937, 31, 1861. [Google Scholar] [CrossRef] [PubMed]
  28. Magee, H.E.; Harvey, D. Studies on the Effect of Heat on Milk: Some Physico-Chemical Changes induced in Milk by Heat. Biochem. J. 1926, 20, 873. [Google Scholar] [CrossRef]
  29. Ling, E.R. 134. The Titration of Milk and Whey as a Means of estimating the Colloidal Calcium Phosphate of Milk. J. Dairy Res. 1936, 7, 145–155. [Google Scholar] [CrossRef]
  30. Britten, M.; Giroux, H.J. Rennet coagulation of heated milk: A review. Int. Dairy J. 2022, 124, 105179. [Google Scholar] [CrossRef]
  31. Van Slyke, D.D. On the measurement of buffer values and on the relationship of buffer value to the dissociation constant of the buffer and the concentration and reaction of the buffer solution. J. Biol. Chem. 1922, 52, 525–570. [Google Scholar] [CrossRef]
  32. Lucey, J.; Hauth, B.; Gorry, C.; Fox, P. The acid-base buffering properties of milk. Milchwissenschaft 1993, 48, 268–272. [Google Scholar]
  33. Miwa, N.; Yokoyama, K.; Wakabayashi, H.; Nio, N. Effect of deamidation by protein-glutaminase on physicochemical and functional properties of skim milk. Int. Dairy J. 2010, 20, 393–399. [Google Scholar] [CrossRef]
  34. Regnault, S.; Dumay, E.; Cheftel, J.C. Pressurisation of raw skim milk and of a dispersion of phosphocaseinate at 9 C or 20 C: Effects on the distribution of minerals and proteins between colloidal and soluble phases. J. Dairy Res. 2006, 73, 91–100. [Google Scholar] [CrossRef]
  35. Mattick, E.C.; Hallett, H.S. The effect of heat on milk:(A) On the coagulability by rennet.(B) On the nitrogen, phosphorus and calcium content. J. Agric. Sci. 1929, 19, 452–462. [Google Scholar] [CrossRef]
  36. Deshwal, G.; Gómez-Mascaraque, L.; Fenelon, M.; Huppertz, T. Soluble salts in processed cheese prepared with citrate- and phosphate-based calcium sequestering salts. Molecules 2024, 29, 3631. [Google Scholar] [CrossRef] [PubMed]
  37. Morris, H.A.; Holt, C.; Brooker, B.E.; Banks, J.M.; Manson, W. Inorganic constituents of cheese: Analysis of juice from a one-month-old Cheddar cheese and the use of light and electron microscopy to characterize the crystalline phases. J. Dairy Res. 1988, 55, 255–268. [Google Scholar] [CrossRef]
  38. Roy, D.; Pitre, M.; Blanchette, L.; Savoie, L.; Bélanger, G.; Ward, P.; Maubois, J. Monitoring proteolysis and cheese juice composition during ripening of Cheddar cheese made from microfiltered milk. Le Lait 1997, 77, 521–541. [Google Scholar] [CrossRef]
  39. Guinee, T.P.; Harrington, D.; Corcoran, M.O.; Mulholland, E.O.; Mujllins, C. The compositional and functional properties of commercial Mozzarella, Cheddar and analogue pizza cheeses. Int. J. Dairy Technol. 2000, 53, 51–56. [Google Scholar] [CrossRef]
  40. Monib, A.M.M.F. The Calcium-Paracaseinate-Phosphate-Complex Under Conditions Similar to Those in Cheese. Doctoral Dissertation, Landbouwhogeschool Wageningen, Veenman en Zonen N.V., Wageningen, The Netherlands, 1962. [Google Scholar]
  41. Lee, M.-R.; Johnson, M.; Govindasamy-Lucey, S.; Jaeggi, J.; Lucey, J. Insoluble calcium content and rheological properties of Colby cheese during ripening. J. Dairy Sci. 2010, 93, 1844–1853. [Google Scholar] [CrossRef]
  42. Guo, M.R.; Kindstedt, P.S. Age-related changes in the water phase of Mozzarella cheese. J. Dairy Sci. 1995, 78, 2099–2107. [Google Scholar] [CrossRef]
  43. Guo, M.R.; Gilmore, J.A.; Kindstedt, P.S. Effect of sodium chloride on the serum phase of Mozzarella cheese. J. Dairy Sci. 1997, 80, 3092–3098. [Google Scholar]
  44. Upreti, P.; Metzger, L. Influence of calcium and phosphorus, lactose, and salt-to-moisture ratio on Cheddar cheese quality: pH changes during ripening. J. Dairy Sci. 2007, 90, 1–12. [Google Scholar]
  45. Fathollahi, I.; Hesari, J.; Azadmard, S.; Oustan, S. Influence of proteolysis and soluble calcium levels on textural changes in the interior and exterior of Iranian UF white cheese during ripening. Int. J. Nutr. Food Eng. 2010, 4, 399–404. [Google Scholar]
  46. Guinee, T.; O’Kennedy, B.T. The effect of calcium content of Cheddar-style cheese on the biochemical and rheological properties of processed cheese. Dairy Sci. Technol. 2009, 89, 317–333. [Google Scholar]
  47. Boutrou, R.; Gaucheron, F.; Piot, M.; Michel, F.; Maubois, J.-L.; Léonil, J. Changes in the composition of juice expressed from Camembert cheese during ripening. Le lait 1999, 79, 503–513. [Google Scholar] [CrossRef]
  48. Lucey, J.; Gorry, C.; Fox, P. Changes in the acid-base buffering curves during the ripening of Emmental cheese. Milchwissenschaft 1993, 48, 183–186. [Google Scholar]
  49. Salaün, F.; Mietton, B.; Gaucheron, F. Buffering capacity of dairy products. Int. Dairy J. 2005, 15, 95–109. [Google Scholar] [CrossRef]
  50. Upreti, P.; Bühlmann, P.; Metzger, L. Influence of calcium and phosphorus, lactose, and salt-to-moisture ratio on Cheddar cheese quality: pH buffering properties of cheese. J. Dairy Sci. 2006, 89, 938–950. [Google Scholar] [CrossRef]
Figure 1. Illustrative representation of distribution of different milk components in soluble and insoluble portions after undergoing salt distribution approaches.
Encyclopedia 04 00107 g001
Figure 2. Cheese press methodology for juice extraction.
Encyclopedia 04 00107 g002
Figure 3. Water-soluble extract methodology for salt distribution in cheese.
Encyclopedia 04 00107 g003
Table 1. Approximate composition of milk and distribution of milk constituents between micellar and serum phases. Compiled from sources [2,5,10,11,16].
ConstituentsConcentration in Milk (g/kg)Micellar (% of Total)Soluble (% of Total)
Lactose49–51-100
Caseins28.5
αS1-casein11.693.96.1
αS2-casein3.196.83.2
β-casein10.387.412.6
κ-casein3.485.314.7
Cationic Salts
Ca1.04–1.286931
Mg0.10–0.154753
K1.21–1.68≤5≥95
Na0.35–0.60≤2≥98
Anionic Salts
Chloride0.78–1.20≤5≥95
Total P0.93–1.04654
Inorganic P (as PO4)0.655347
Citrate1.32–2.081486
Table 3. Some examples of soluble calcium levels in different cheese types determined using various methods.
Cheese% Moisture in CheeseTotal Ca (g/kg Cheese)% Soluble CaCheese Fraction AnalyzedReference
Cheddar35.76.8857.0Cheese juice[37]
Cheddar32.86.504.6 g/kg juiceCheese juice[38]
Cheddar37.27.1238.2%Cheese juice[39]
Gouda/Edam30–50 9–50Cheese juice[40]
Low-moisture mozzarella46.47.0922.7%Cheese juice[39]
Analog pizza cheese48.96.3247.0%Cheese juice[39]
Cheddar38.68.3330.0%Cheese juice[12]
Colby 38.76.8475.2%Cheese juice[41]
Colby36.65.6968.1%Cheese juice[41]
Cheddar38.68.3324.0%Titration[12]
Mozzarella45.67.583.0 g/kg juiceExpressible serum[42]
Mozzarella48.66.573.2 g/kg juiceExpressible serum[42]
Brine-salted mozzarella49.46.493.2 g/kg juiceExpressible serum[43]
Unsalted mozzarella50.96.683.6 g/kg juiceExpressible serum[43]
Cheddar32.16.9037.3%Water-soluble extract[44]
Iranian UF white cheese64.1-45.0%Water-soluble extract[45]
Processed cheese47.33.7520.2%Water-soluble extract[46]
Processed cheese46.96.1518.1%Water-soluble extract[46]
Table 4. Characteristics of different methods for the partitioning of serum phase in cheese samples for the measurement of salts.
AttributesCheese JuiceWater Soluble ExtractExpressible SerumTitration
Sample size>100 g10–20 g10–20 g<10 g
Time for one sample>1.5 h>1.5 h1.25 h1.5 h
Method variablesPressure, ratio of cheese and sandWater to cheese ratio, centrifugation speed and timeCentrifugation speed and timeAmount of cheese and water, speed of titration
Ease of useLabor intensiveLess labor intensive than cheese juice methodLess labor intensive than cheese juice methodCan be performed automatically by high-end titrator
RequirementsCheese press, sand, and muslin clothStomacher, centrifuge, and water bathCentrifugeTitrator with dosing units and pH electrodes
Disclaimer/Publisher’s Note: The statements, opinions and data contained in all publications are solely those of the individual author(s) and contributor(s) and not of MDPI and/or the editor(s). MDPI and/or the editor(s) disclaim responsibility for any injury to people or property resulting from any ideas, methods, instructions or products referred to in the content.

