Review

Iranian Household Electricity Use Compared to Selected Countries

1
ZEMCH EXD Lab, Faculty of Architecture, Building and Planning, The University of Melbourne, Parkville, VIC 3010, Australia
2
Smart Villages Lab, Faculty of Architecture, Building and Planning, The University of Melbourne, Parkville, VIC 3010, Australia
*
Author to whom correspondence should be addressed.
Encyclopedia 2022, 2(4), 1637-1665; https://doi.org/10.3390/encyclopedia2040112
Submission received: 12 July 2022 / Revised: 14 September 2022 / Accepted: 19 September 2022 / Published: 23 September 2022
(This article belongs to the Collection Encyclopedia of ZEMCH Research and Development)

Abstract

:
Buildings account for nearly 40% of energy use in global contexts and climatic conditions tend to contribute to consumption. Human activities are also influential in energy consumption and carbon dioxide (CO2) emissions that lead to global warming. Residential buildings are responsible for a considerable share. There are countries aggravating this situation by heavily relying on fossil fuels. Oil-rich countries are allocating an energy subsidy to the public, making energy cheaper for their consumers. This may result in negative consequences, including households’ inefficient energy use behaviours in countries such as Iran. Beyond the impact of energy subsidy allocation, this study aims to explore the climatic and non-climatic factors that affect the increase in domestic electricity use, particularly in Iran. For this purpose, this study begins with a comparative analysis between countries with and without the energy subsidy to examine the trends in domestic electricity use. Afterwards, the tendency of households’ electricity use in Iran will be analysed in consideration of climatic and non-climatic factors among several provinces in Iran. This study exploited published statistical data for the analysis. The results indicate the tendency of increased domestic electricity use due to the country’s generous subsidy offered to the public as well as climatic and non-climatic factors in Iran. These results may provide an opportunity for future studies regarding building occupants’ inefficient energy use behaviours for policy enactment in Iran and other oil-rich countries.

1. Introduction

The significant impact of human activities on climate change and global warming has been highlighted by the Intergovernmental Panel on Climate Change in various reports [1,2]. Although several resources are known to contribute to this issue through CO2 emissions, energy has a large share of 73% of the overall emissions [3]. The International Energy Agency (IEA) analysis showed that the most critical sectors responsible for CO2 from energy consumption are industry, transportation, and buildings, amongst which buildings account for 17.5% of total emissions. However, with 19% of contributions, residential buildings have a considerable share among other types of buildings [3,4] (Figure 1).
In the special report on global warming (SR15) [5], IPCC demonstrated that there is a possibility to achieve the Paris target of 1.5 °C if CO2 reductions reach 45% by 2030 and a net-zero emission by 2050. However, issues have made net-zero emissions harder to achieve in the future. One of these issues is the energy subsidy allocated to consumers in oil-rich countries to reduce their energy costs. This has negatively encouraged the overconsumption of fossil fuels [6,7,8] while reducing the incentives for further investments in renewable energies [9,10]. According to the IEA [11], some countries allocate an energy subsidy to reduce costs for energy consumers. However, unfortunately, such an energy subsidy is mainly given to fossil fuels [12,13], in which non-OECD countries form a large portion of the subsidy in the world [14].
As with other oil-rich countries negatively affected by the energy subsidy, Iran is struggling with challenges imposed by the subsidy; through heavily relying on fossil fuels to generate energy for buildings, Iran is facing critical issues in meeting sustainable development goals. Moreover, as a country with a low energy price, the tendency of households towards inefficient energy consumption in the domestic sector is considerably increasing [8]. Therefore, there is a need for oil-rich countries with low energy prices to manage and reduce domestic users’ energy demands and habits, which is mainly associated with the energy subsidy policy [15]. The increasing demand for electricity in oil-rich countries has raised concerns regarding blackouts mainly due to this energy subsidy [16].
Several previous studies have highlighted the negative consequences of the energy subsidy on sustainable development goals to be achieved by oil-rich countries. Moreover, these studies pointed out the issue of energy demand growth of occupants in different countries where the energy subsidy was in their energy policies. For instance, Al-Marri (2018) [15] investigated the current energy use of occupants in the domestic sector in Qatar to understand the challenges of consumer behaviour in terms of energy efficiency. They found that occupants were not inclined to alter their energy use behaviour due to the energy subsidy. Moreover, several researchers have pointed out the negative implication of the fossil-fuel subsidy for energy efficiency [17,18,19]. For instance, Sun (2015) and Dube (2003) [20,21] highlighted that higher-income households benefit more than low-income households from energy subsidies, which has further affected their energy use behaviour. Studies conducted by Ouyang and Lin (2014) and Adom and Adams [10,22] pointed out the excessive subsidy for fossil fuels in China, which has led to wasteful energy consumption. Fattouh and El-Katiri (2013) [23] highlighted the inefficiency of domestic energy consumption in the Middle East and North African regions due to a high energy subsidy. According to Oryani et al. (2022) [24], Iran has ranked as the largest consumer of energy among other Middle East and North African countries.
Although there are studies on the energy subsidy and the impact on energy consumption for different countries [25,26,27,28], little research has been conducted to fully understand the effect of a fossil fuel subsidy and prices on the energy consumption trend in the international compared to Iranian context. For instance, in the studies mentioned above, the energy consumption was investigated from the economic perspective rather than climatic or social aspects in the oil-rich countries. Moreover, the important aspect of energy consumption in countries with or without the energy subsidy and its significant effect on the way that occupants consume energy has not been studied comparatively, especially in residential buildings. It is worth mentioning that in the studies which have considered Iran as their case study, most of the researchers have solely highlighted the challenges of removing the energy subsidy and how low-income occupants can be negatively affected. Therefore, there is a need to reconsider the solutions to the subsidy by understanding important factors (climatic and non-climatic) influencing occupants’ energy consumption in Iran. Therefore, instead of proposing different solutions regarding the removal of subsidies, occupants’ behaviour change might have the potential to be an alternative solution to the removal of the subsidy. This necessitates understanding the effective factors in occupants’ energy consumption. Therefore, further investigations are needed to explore the negative consequences of fossil fuel subsidies on households’ energy consumption patterns in a global and local context.
Moreover, the tendency of oil-rich countries and the negative consequences of the energy subsidy on occupants’ energy use is not clearly understood or well defined in the domestic sector in oil-rich countries, especially Iran, compared to the global context. It is worth mentioning that removing the fossil fuel subsidy alone may not address the issues with which the oil-rich countries are struggling [8]. As indicated by Gangopadhyay et al. [29], energy subsidy reduction in developing countries necessitates further support through other policies to alleviate the adverse effects. However, since the energy subsidy acts as a barrier to not only efficient energy use behaviour but also additional investments in renewable energies [15], raising the awareness of the negative consequences of this issue can globally and locally encourage future studies regarding the consideration of human behaviour for policy enactment as well as possible solutions to be proposed for the reduction of fossil fuel consumption in generating electricity in the domestic sector in Iran and other oil-rich countries.
The research objective is first to investigate the driving factors affecting fossil fuel reliance of oil-rich countries compared to other developed countries without an energy subsidy. To achieve this objective, different countries were compared in terms of their reliance on fossil fuels and its impact on their increasing/decreasing trend in energy consumption to generate electricity. Afterwards, Iran, Australia, and Germany were compared and analysed in terms of electricity costs and demands per capita to understand further consequences of the energy subsidy on households’ behaviour in electricity use. The data for this purpose were collected from different statistical data centres worldwide. The data for the global context were obtained from the IEA [3,30,31,32,33], the World Bank [34,35], World Data [36], Our world in data [37,38], the World Economic Outlook Database [39], Global Carbon Project [40], Australian Bureau of Statistics [41], Australia Institute of Family Studies [42], Statistisches Bundesamt [43], and World Resources Institute [4]. In addition, the tendency of electricity use in the domestic sector was analysed in detail by comparing different provinces in Iran to have insights into the consumption behaviour of provinces known for their high amount of electricity use in Iran. For instance, to understand the significant share of the Tehran province in electricity use in Iran, this study gathered raw data from different resources. For the Iranian context, this research exploited data from the National Statistics Centre of Iran [44,45], the Plan and Budget Organisation [46], the Ministry of Energy, and the Tavanir Company [47].
This paper is divided into four parts. The first part focuses on comparing developed and oil-rich countries in terms of their status regarding the fossil fuel subsidy to explore the effect of energy price on households’ electricity demand in oil-rich countries compared to developed countries. Then, the crucial factors affecting the increasing or decreasing trend in domestic electricity demand were explored through a comparative analysis between countries with and without energy subsidies. The second part implements a local comparison of domestic electricity use between different provinces of Iran to further discuss and delve into the impacts of behavioural-related factors on the electricity use of Iranian households. The third part highlights the solutions proposed by previous studies to reduce energy use and emphasises the importance of behaviour as an effective solution to be included in the policy enactment process.
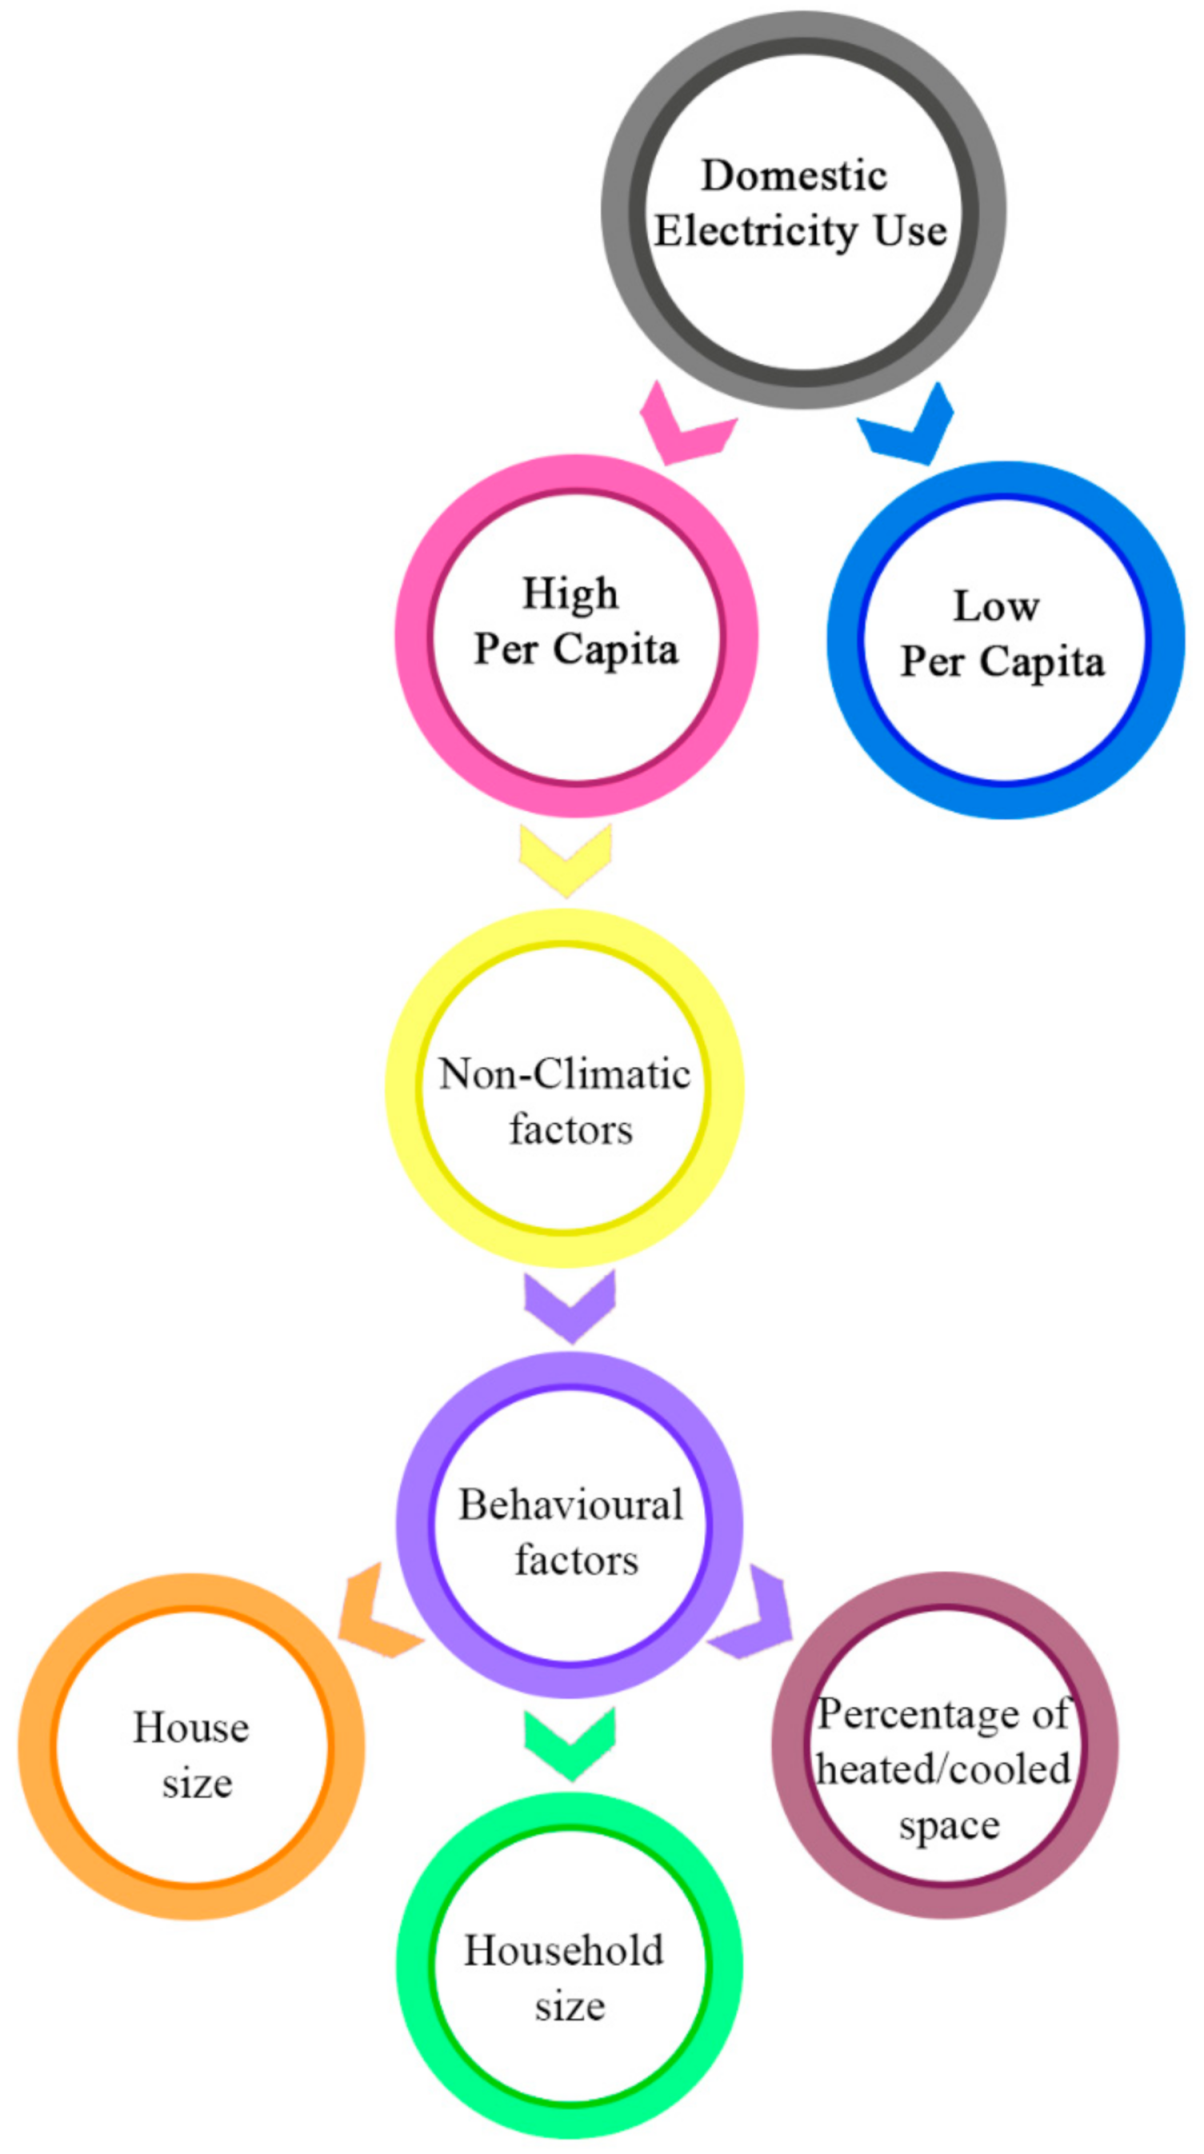
Moreover, the limitations of current energy policies in Iran were investigated for the domestic sector. The sequence of the study is illustrated in Figure 2 below. The conclusions are presented in the final section. One of the contributions of the study is to explore crucial factors affecting the behavioural aspect of domestic electricity demand in oil-rich countries by comparing them with developed countries. Another contribution is examining and comparing one of the highest electricity-consuming provinces, Tehran, with other cities to inform energy practitioners, designer, and policymakers about the critical issues related to behavioural aspects of domestic electricity use in Iran.

2. Comparison between Iran and Other Countries

2.1. Comparison of the Fossil Fuel Subsidy in Oil-Rich Countries and Iran

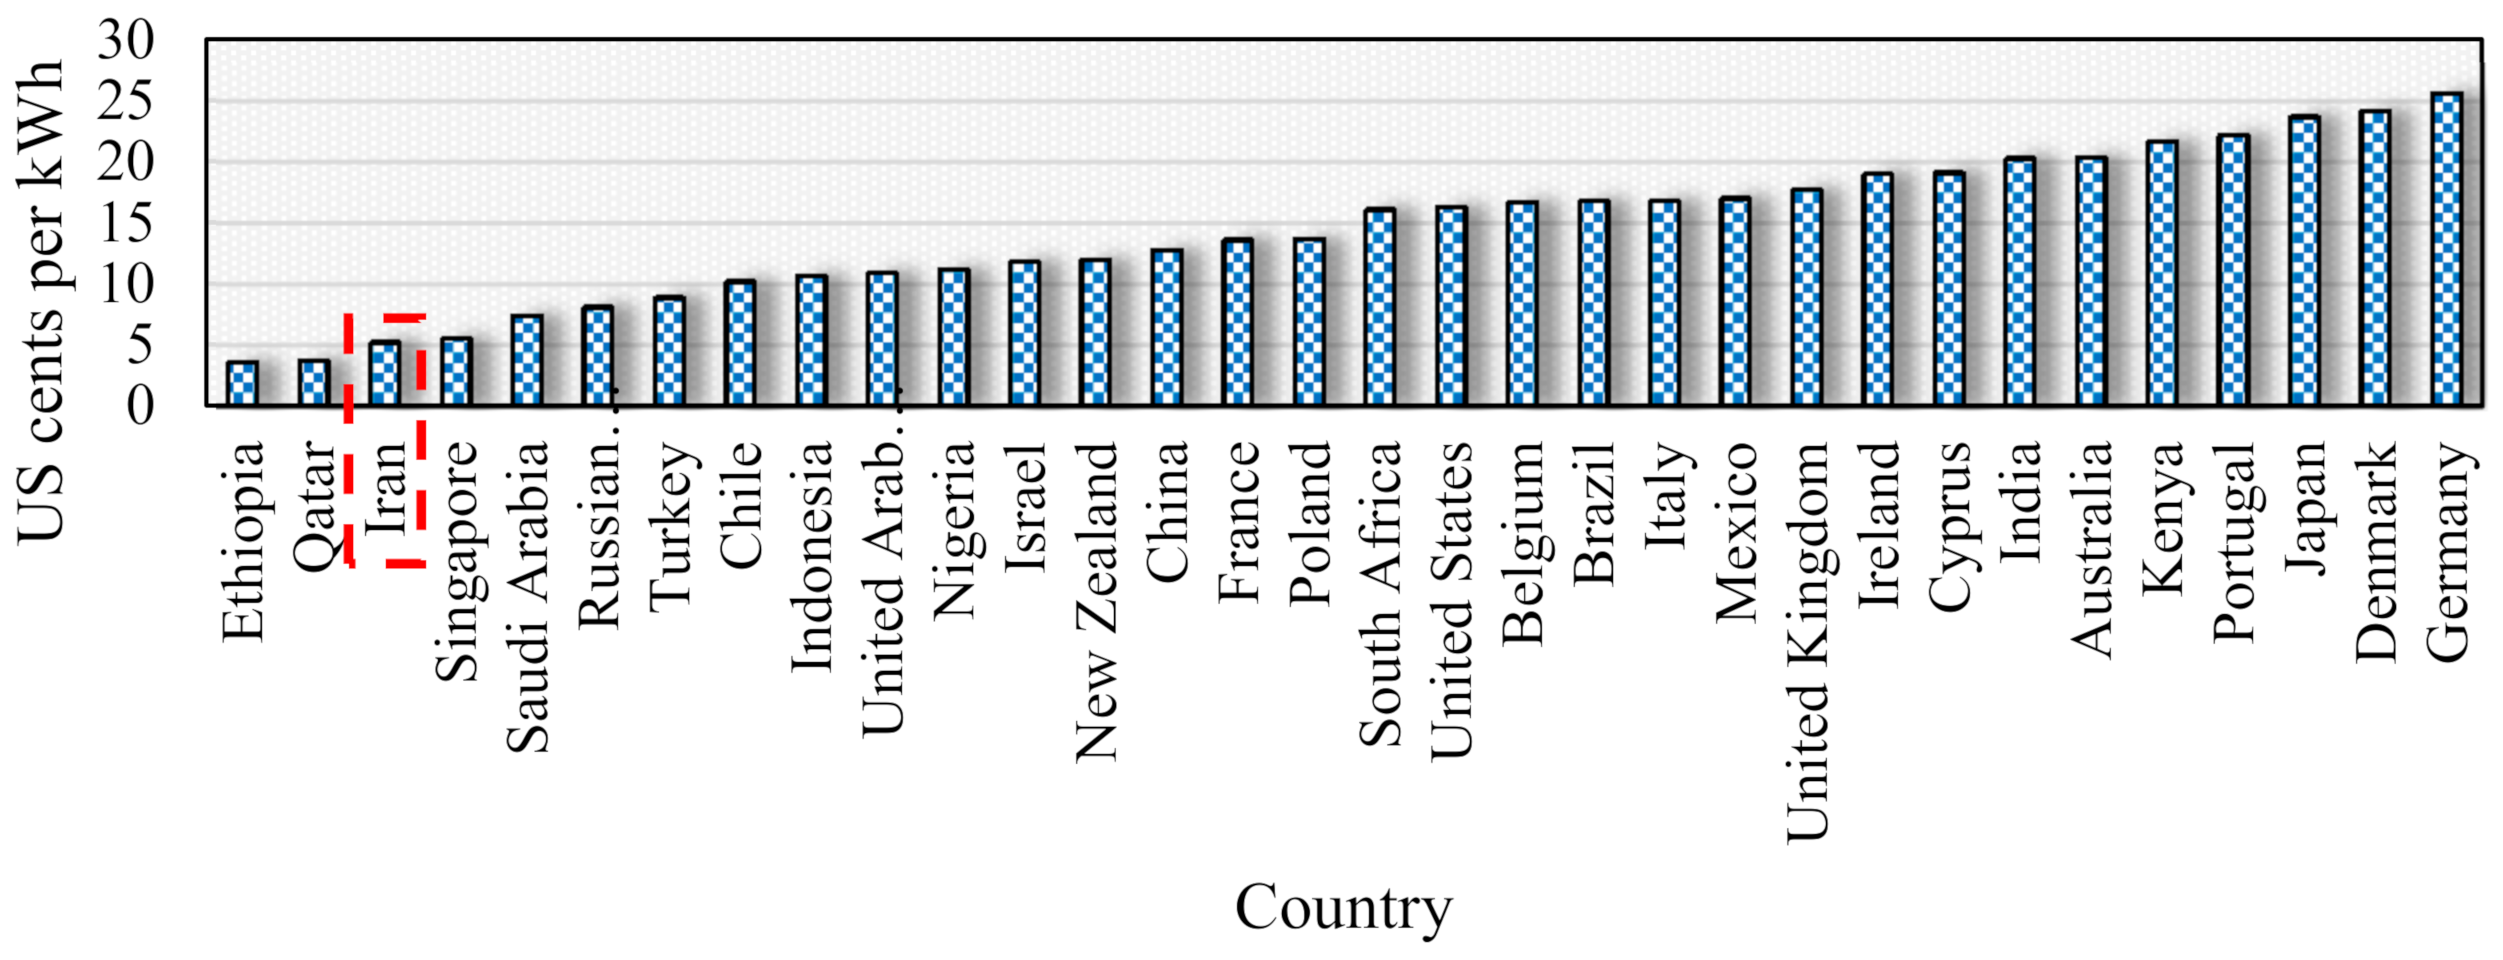
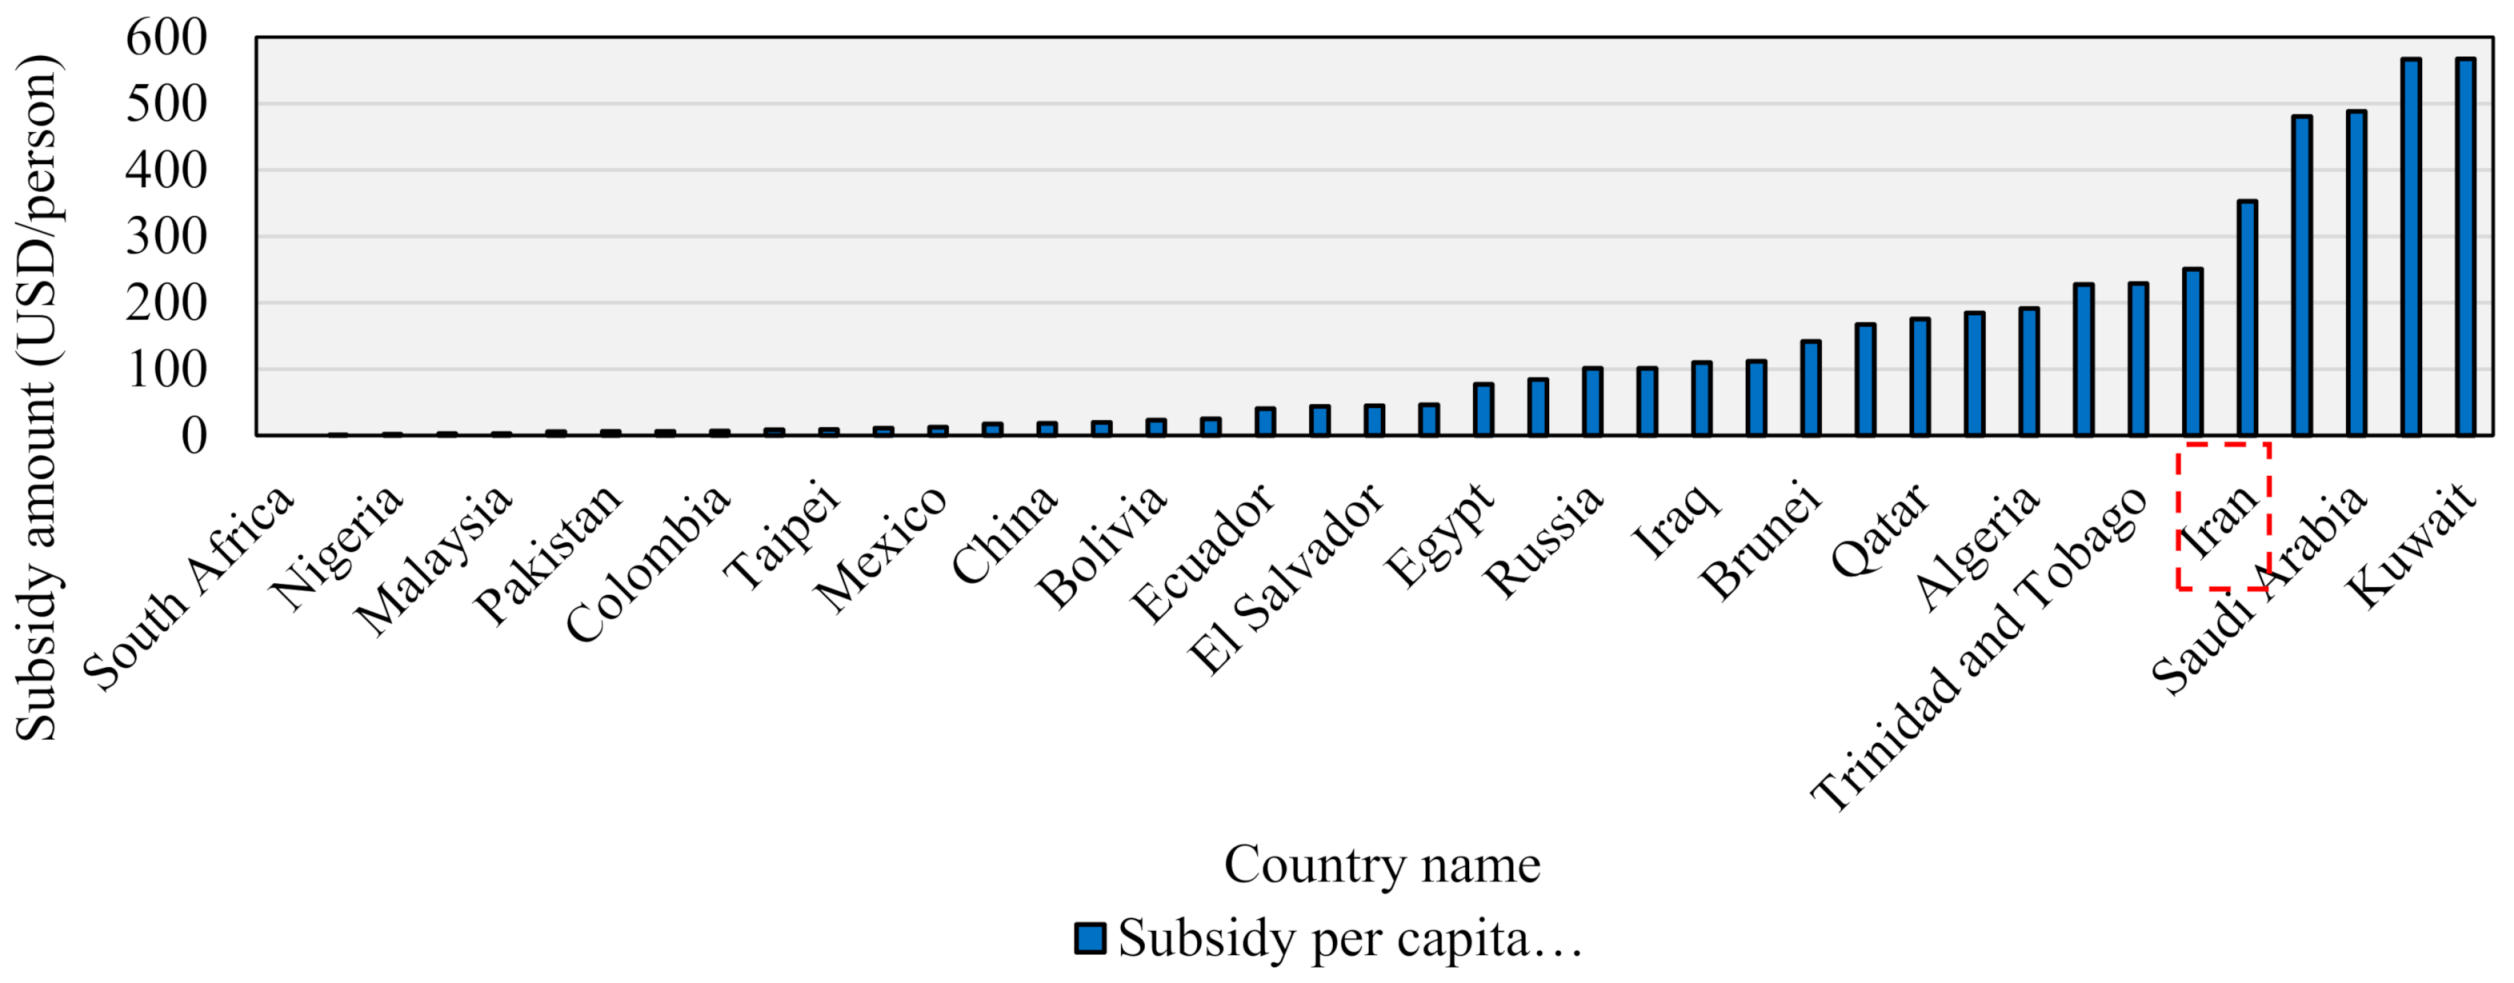
Oil-rich countries mostly consider the fossil fuel or energy subsidy to decrease energy costs while enhancing consumers’ living standards [48]. However, reducing energy costs has further caused the overuse of fossil fuels to generate energy and electricity for buildings. Different countries have different portions of the subsidy allocated to fossil fuels, such as oil, electricity, gas, and coal (Figure 3). Iran provides a significant amount of subsidy for electricity, making it one of the lowest prices among countries’ electricity (Figure 4). This has resulted in domestic electricity demand growth in Iran over the years [23]. According to Fattouh and El-Katiri [23], energy use in the Middle East and North African regions has more than quadrupled, while electricity use increased over six times over the past 30 years.
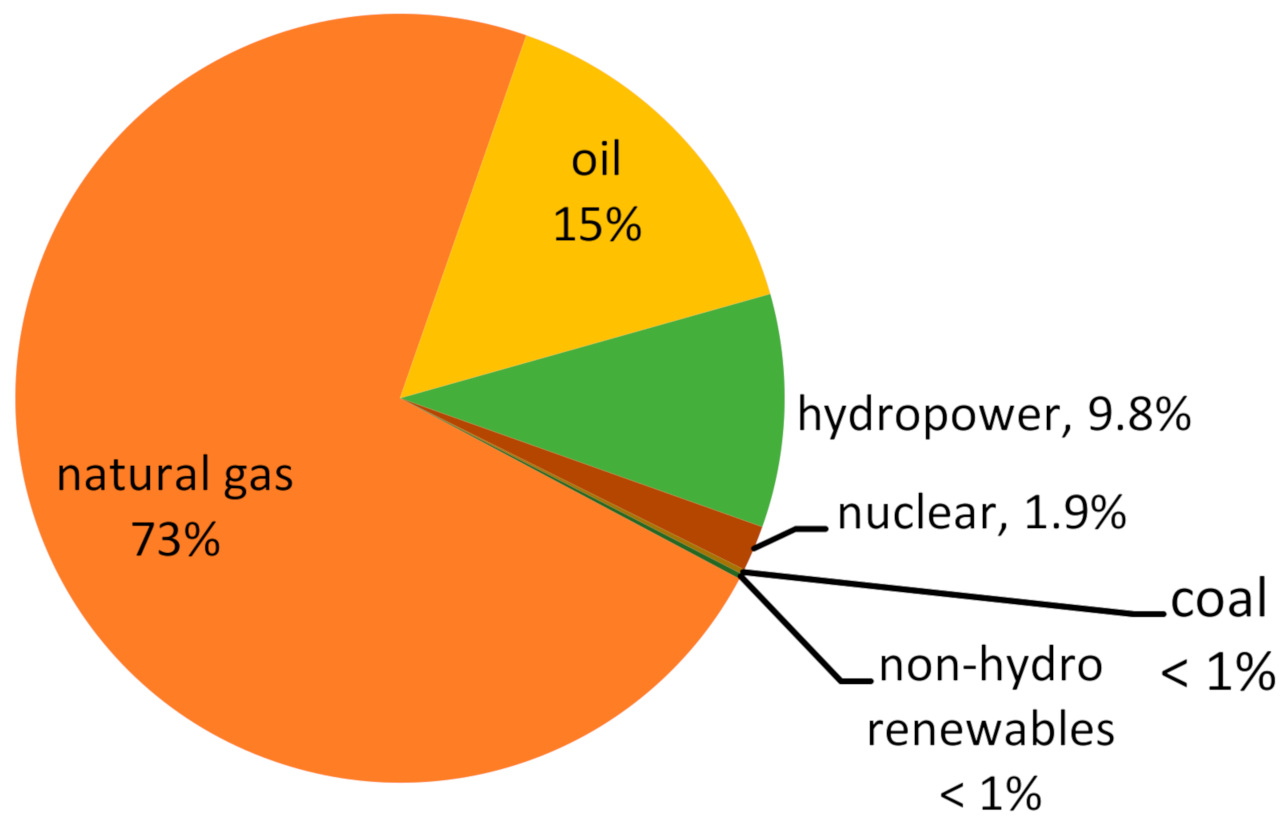
In general, Iran’s primary energy resources are crude oil, natural gas, coal, nuclear, and renewable resources [49]; however, as illustrated in Figure 2 and Figure 3, the most heavily subsidised resource in Iran is natural gas, which has also led to cheap electricity prices in this country. This has led to the growing trend in CO2 emissions from natural gas compared to other primary energies (Figure 5). This issue was an expected result in Iran since power plants’ leading resource for providing buildings energy for heating and cooking as well as electricity for lighting and cooling is natural gas (Figure 6). This demonstrates the significant contribution of electricity in buildings to energy consumption across the world and within Iran.

2.2. Reliance on Fossil Fuels in Countries with High and Low Electricity Prices

As indicated previously, the energy subsidy has reduced the electricity costs in oil-rich countries, which has caused a heavy reliance on fossil fuels for electricity generation (Figure 7). This study gathered data regarding different countries’ electricity generation from fossil fuels [37]. The lower the electricity price in a country, the more its dependence on fossil fuels. Therefore, with cheap electricity, Iran has continued its reliance on fossil fuels, resulting in a rapid rise in the tendency to use fossil fuels to generate electricity. It is worth mentioning that, as In Iran, most countries, especially those without energy subsidies, had previously relied on fossil fuels to generate electricity, especially before 2007. However, the most important point in those countries is their decreasing trend in relying on fossil fuels over the years.
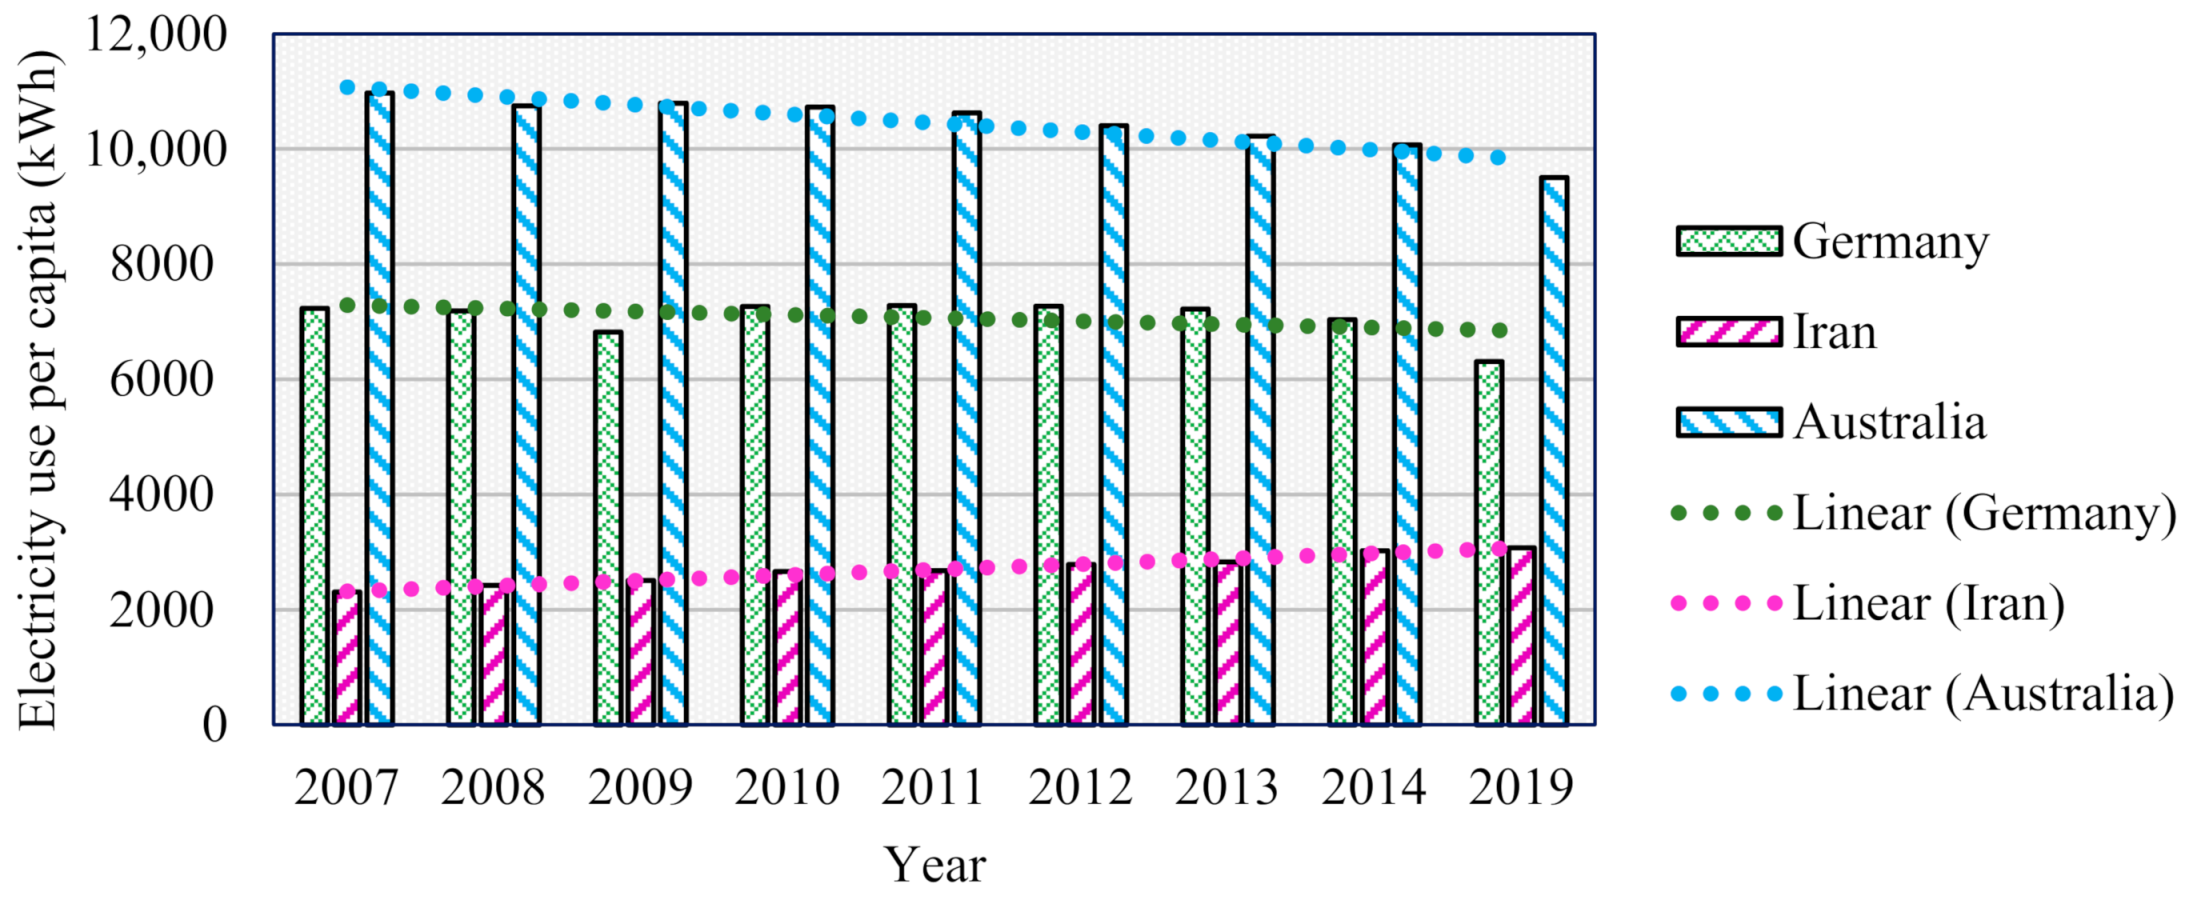
This study collected data from [41,43,44,49] to further explore some of the developed countries. After analysing the data, this study found that, like other oil-rich countries, Germany and Australia’s fossil fuel consumption was previously significant before 2015 but suddenly changed in recent years. Therefore, Australia and Germany were selected to compare with Iran, which has recently increased its energy consumption from fossil fuels. Regarding Germany, the high electricity use from fossil fuels can be explained due to the nearly similar population to Iran. However, Australia has a lower population than Iran, which may raise a question regarding Australia’s large portion of fossil fuel consumption compared to Iran before 2011. With about 22.03 million people in 2010, Australia used to generate more electricity from fossil fuels than Iran, with a population of 73.76 million [34]. However, the comparative analysis between Iran, Australia, and Germany revealed that the electricity use per capita for Australia and Germany was always larger than for Iran (Figure 8). This does not necessarily relate to inefficient use of electricity since the electricity use per capita can be different based on a variety of reasons, such as climate, housing types or other influencing factors. Moreover, it is worth mentioning that the electricity generated from fossil fuels illustrated in Figure 6 belongs to various sectors and is not specifically related to the domestic sector.
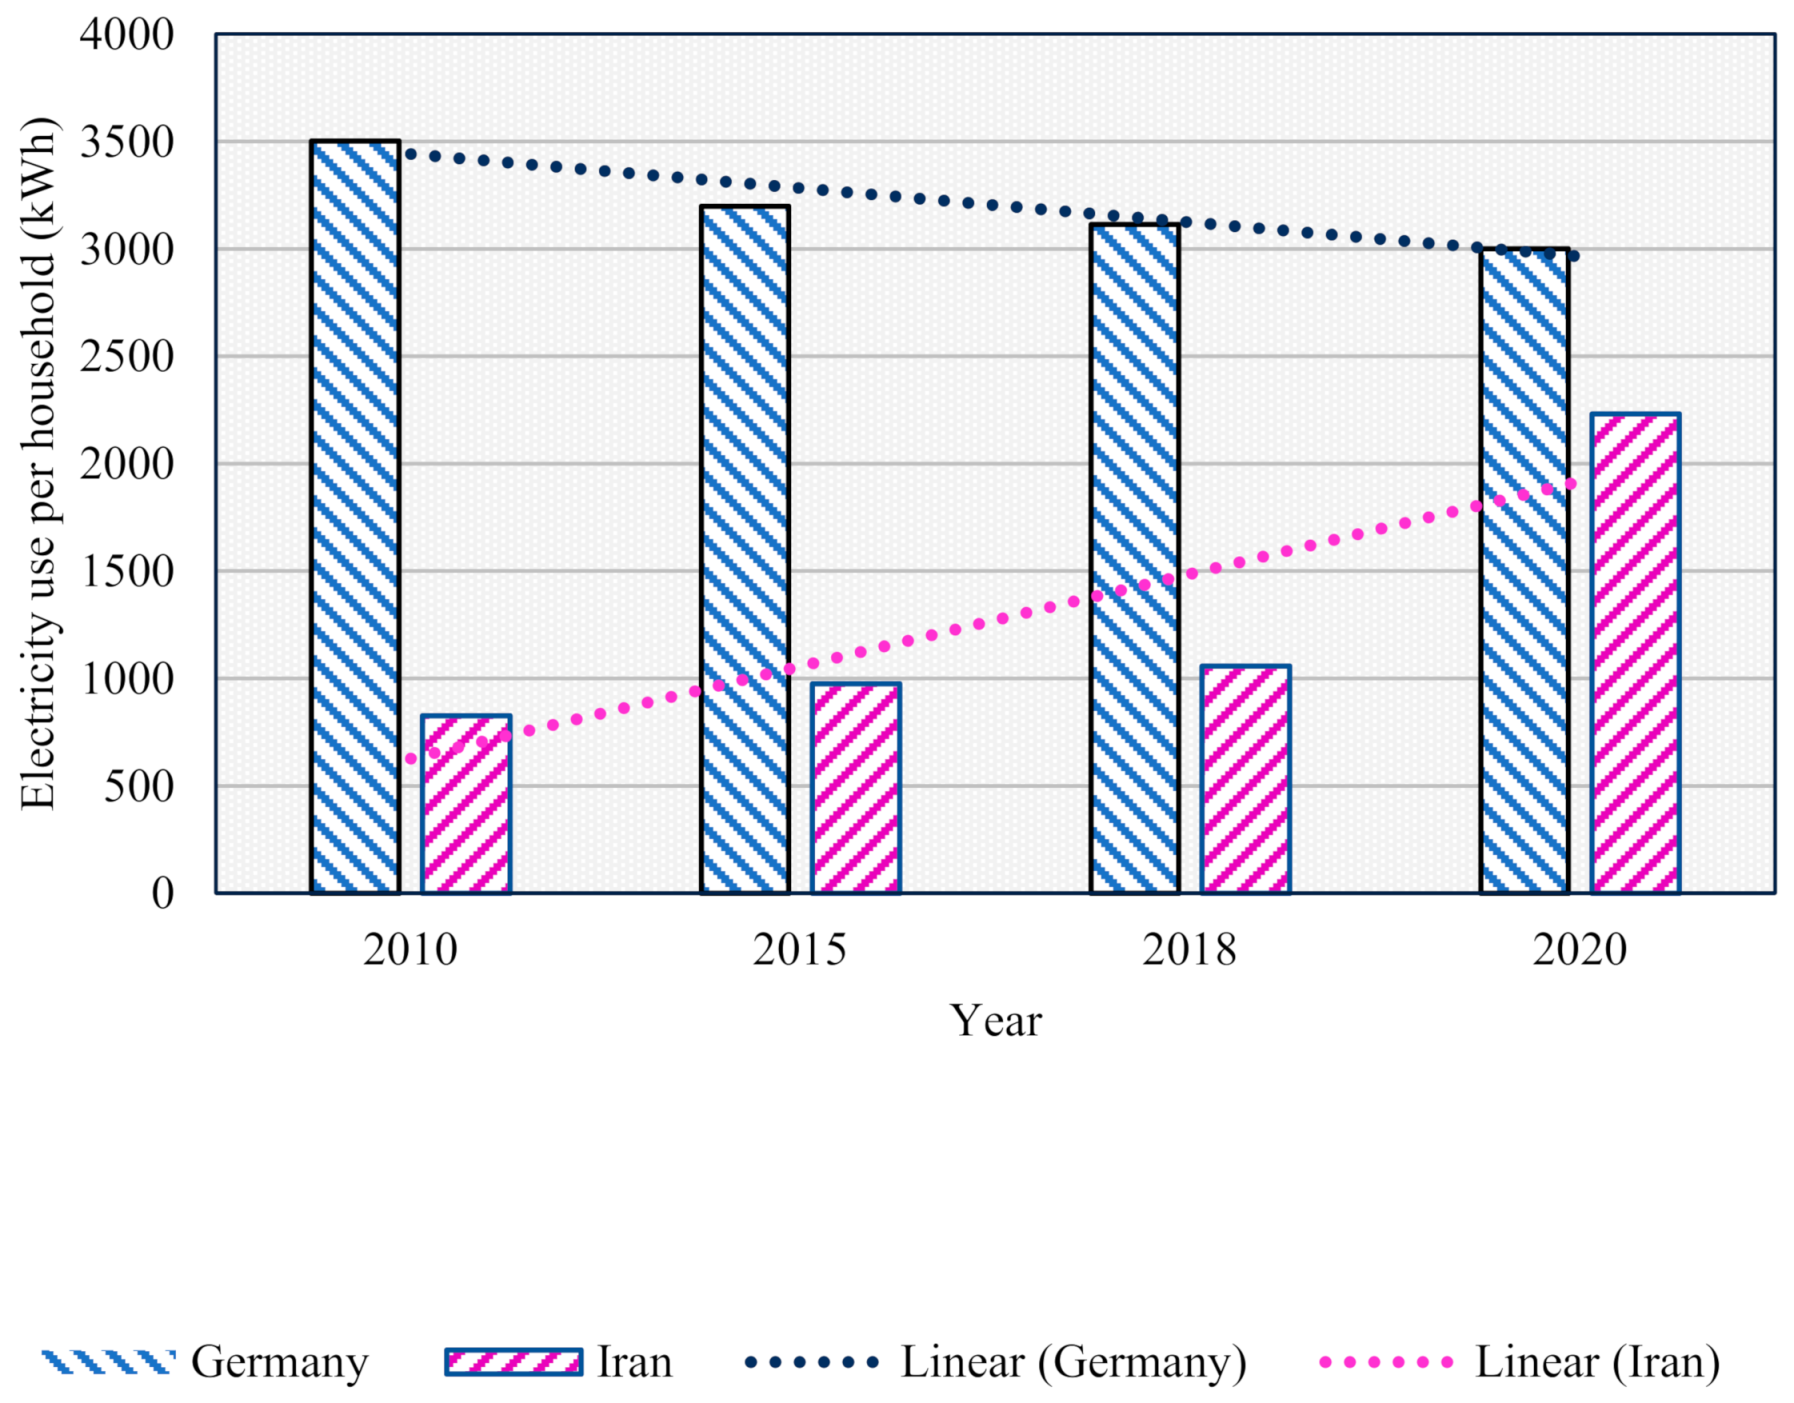
The most crucial point in the above figure is that despite the high electricity usage per capita in those countries, after 2011, there was a rapid decrease in fossil fuel usage, demonstrating both countries’ tendency towards consuming cleaner energy resources in recent years. Therefore, unlike Iran, Australia and Germany have gradually started decreasing the electricity usage per capita by increasing their reliance on renewable energy resources over time. Moreover, Australia and Germany’s per capita consumption has fallen in recent years due to higher electricity prices and lower reliance on fossil fuels due to significant investments in renewable energies (Figure 9). It is worth noting that although Germany still has nearly the same population as Iran, surprisingly, electricity use per household has been decreasing in recent years (Figure 10). The reason was revealed after comparing the electricity price per capita in most oil-rich countries and Iran (Figure 11), which was collected from [50]. Therefore, this study found that the lower cost of electricity in Iran has significantly affected the increase in electricity use per capita. In contrast, Germany’s electricity usage per household has a decreasing trend in recent years.
In the comparative analysis of other countries with higher electricity prices, such as Belgium and Denmark, this study observed the same results as Australia and Germany (Figure 12). The analysis revealed a decreasing trend of reliance on fossil fuels over the years, as the investments in nuclear and renewable energies increased. However, in other countries with lower electricity prices, such as Qatar and United Arab Emirates (UAE), the use of fossil fuels for electricity generation has increased over the years (Figure 13).
Comparing countries revealed that Iran has an increasing trend towards fossil fuel reliance with decreasing renewable energy use due to low energy prices, slow rate of increase in renewable energy share, and other limitations. This not only had a negative effect on the climate but significantly encouraged households’ behaviour to increase their electricity consumption. Therefore, the energy subsidy has dramatically affected their consumption behaviour.

The Effect of Fossil Fuel Reliance on the Rapid Rise of Domestic Electricity Use in Iran

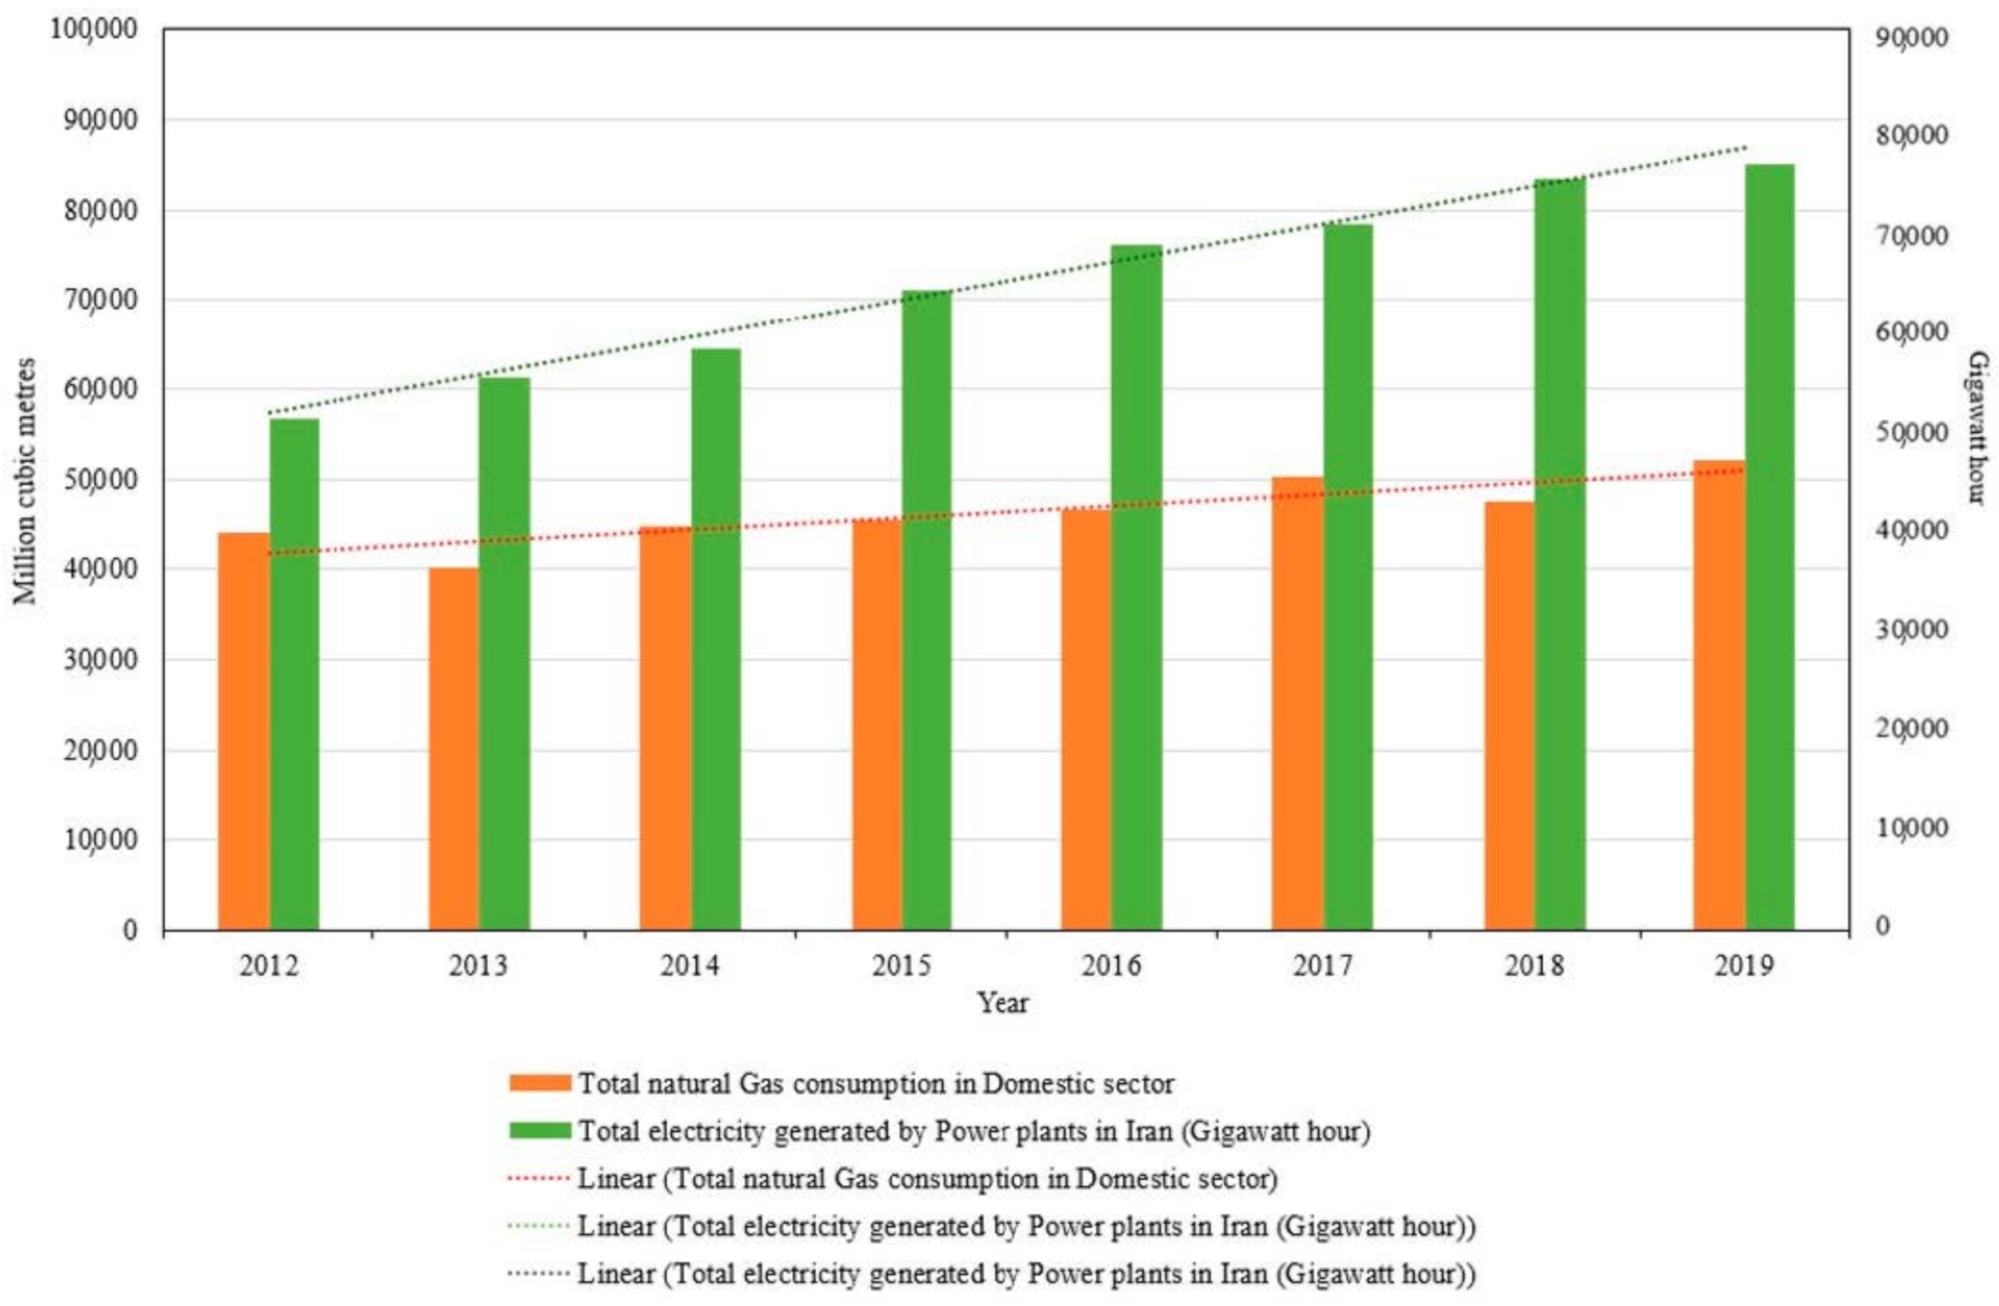
It is worth mentioning that the sector which is mostly contributing to CO2 emissions due to a large amount of natural gas consumption in Iran is the domestic sector, according to [45]. After comparing the amount of gas and electricity consumption in the residential sector for the past ten years [45], this study found that the increase in electricity use was significantly higher than the increase in natural gas consumption (Figure 14). Over the last ten years, there was a 55% increase in domestic electricity consumption but only an 18% rise in natural gas consumption, demonstrating the importance of electricity consumption in the residential sector of Iran.
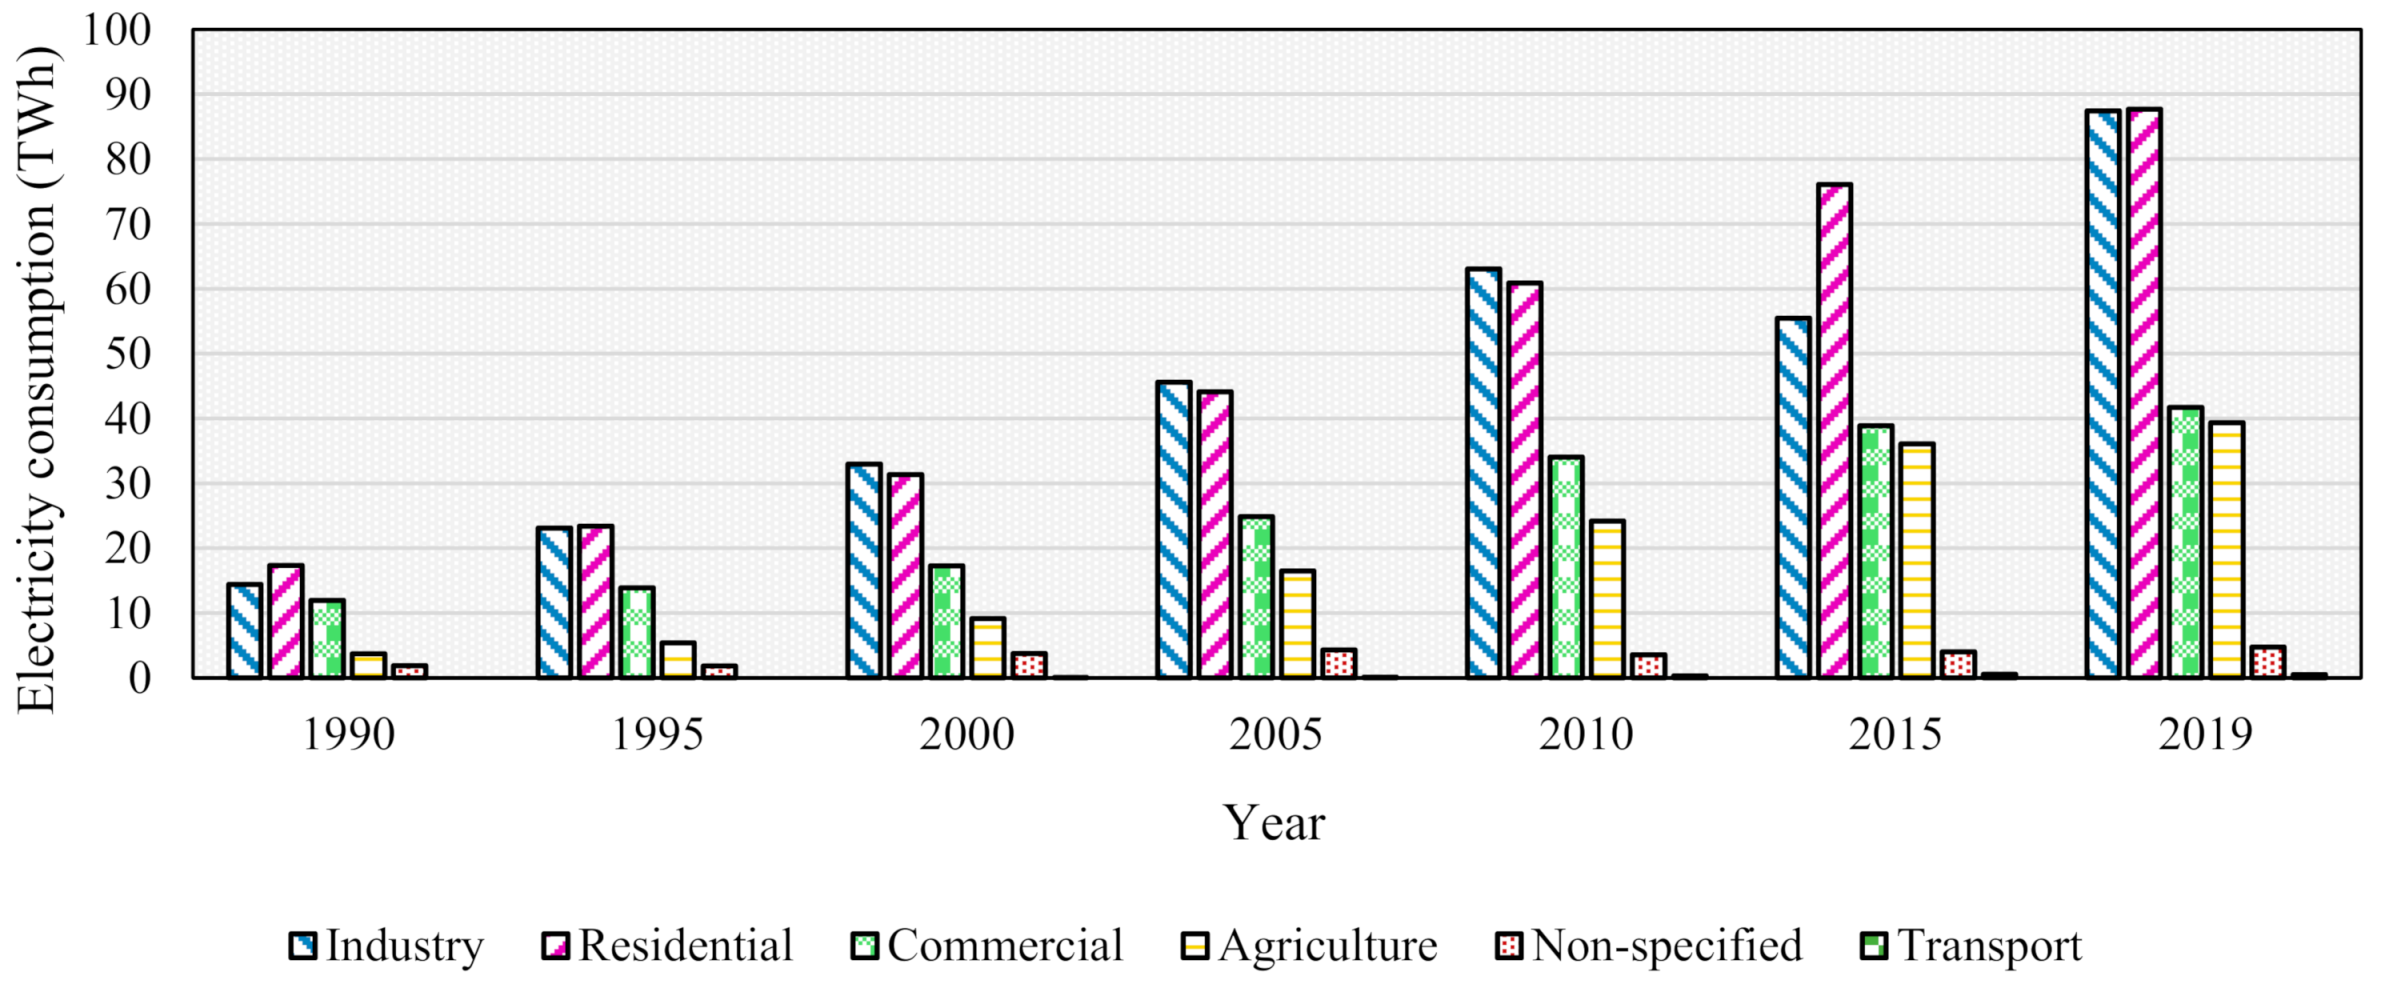
The same trend can be inferred from comparing the residential sector with other sectors after gathering data from [51]. For instance, when comparing the residential sector with the industry sector, the same amount of electricity consumption is mostly seen in both sectors over the years, except in 2015, when the residential sector surpassed the industry sector (Figure 15). In general, the electricity consumption in the residential sector is almost the same as the industry sector and sometimes even higher. The electricity consumption of the residential sector has always shown an increasing trend over the years, making it a crucial sector to investigate in terms of factors affecting domestic electricity use in Iran.
Overall, as previously explained (Figure 11), the reason for the high electricity demand in residential buildings in Iran can be explained by the subsidy considered not only for energy but for the electricity usage per capita. According to IEA [33], the subsidy allocation was about $US350 per person in Iran, making it a cheap resource for consumption. The inexpensive electricity of oil-rich countries such as Iran may raise a question regarding the effect of low and high electricity prices in countries on their consumption patterns in the domestic sector. Therefore, comparing Iran with other countries with higher electricity prices may provide essential insights into households’ tendency towards electricity consumption not only for Iran but for other compared countries.

2.3. The Effect of Electricity Price on the Electricity Demand in the Domestic Sector of Iran Compared to Other Countries

After comparing different countries with high/low electricity prices (Figure 4 and Figure 11), a general ascending trend was seen in electricity consumption for mostly oil-rich countries (i.e., Iran and UAE) and descending trend for countries with higher electricity prices (i.e., Germany and Australia) (Figure 16). The data were collected from the IEA [52] and compared in this study. According to the comparison in this study, it can be concluded that this not only applies to the whole domestic electricity consumption but also to the electricity consumption per capita. After collecting data from [53], this study found that Iran is above the world’s average domestic electricity consumption per capita (Figure 17). As a result, this dramatic increase in electricity consumption in Iran, as opposed to other countries, can be attributed to the high subsidy given to domestic electricity consumption per capita.
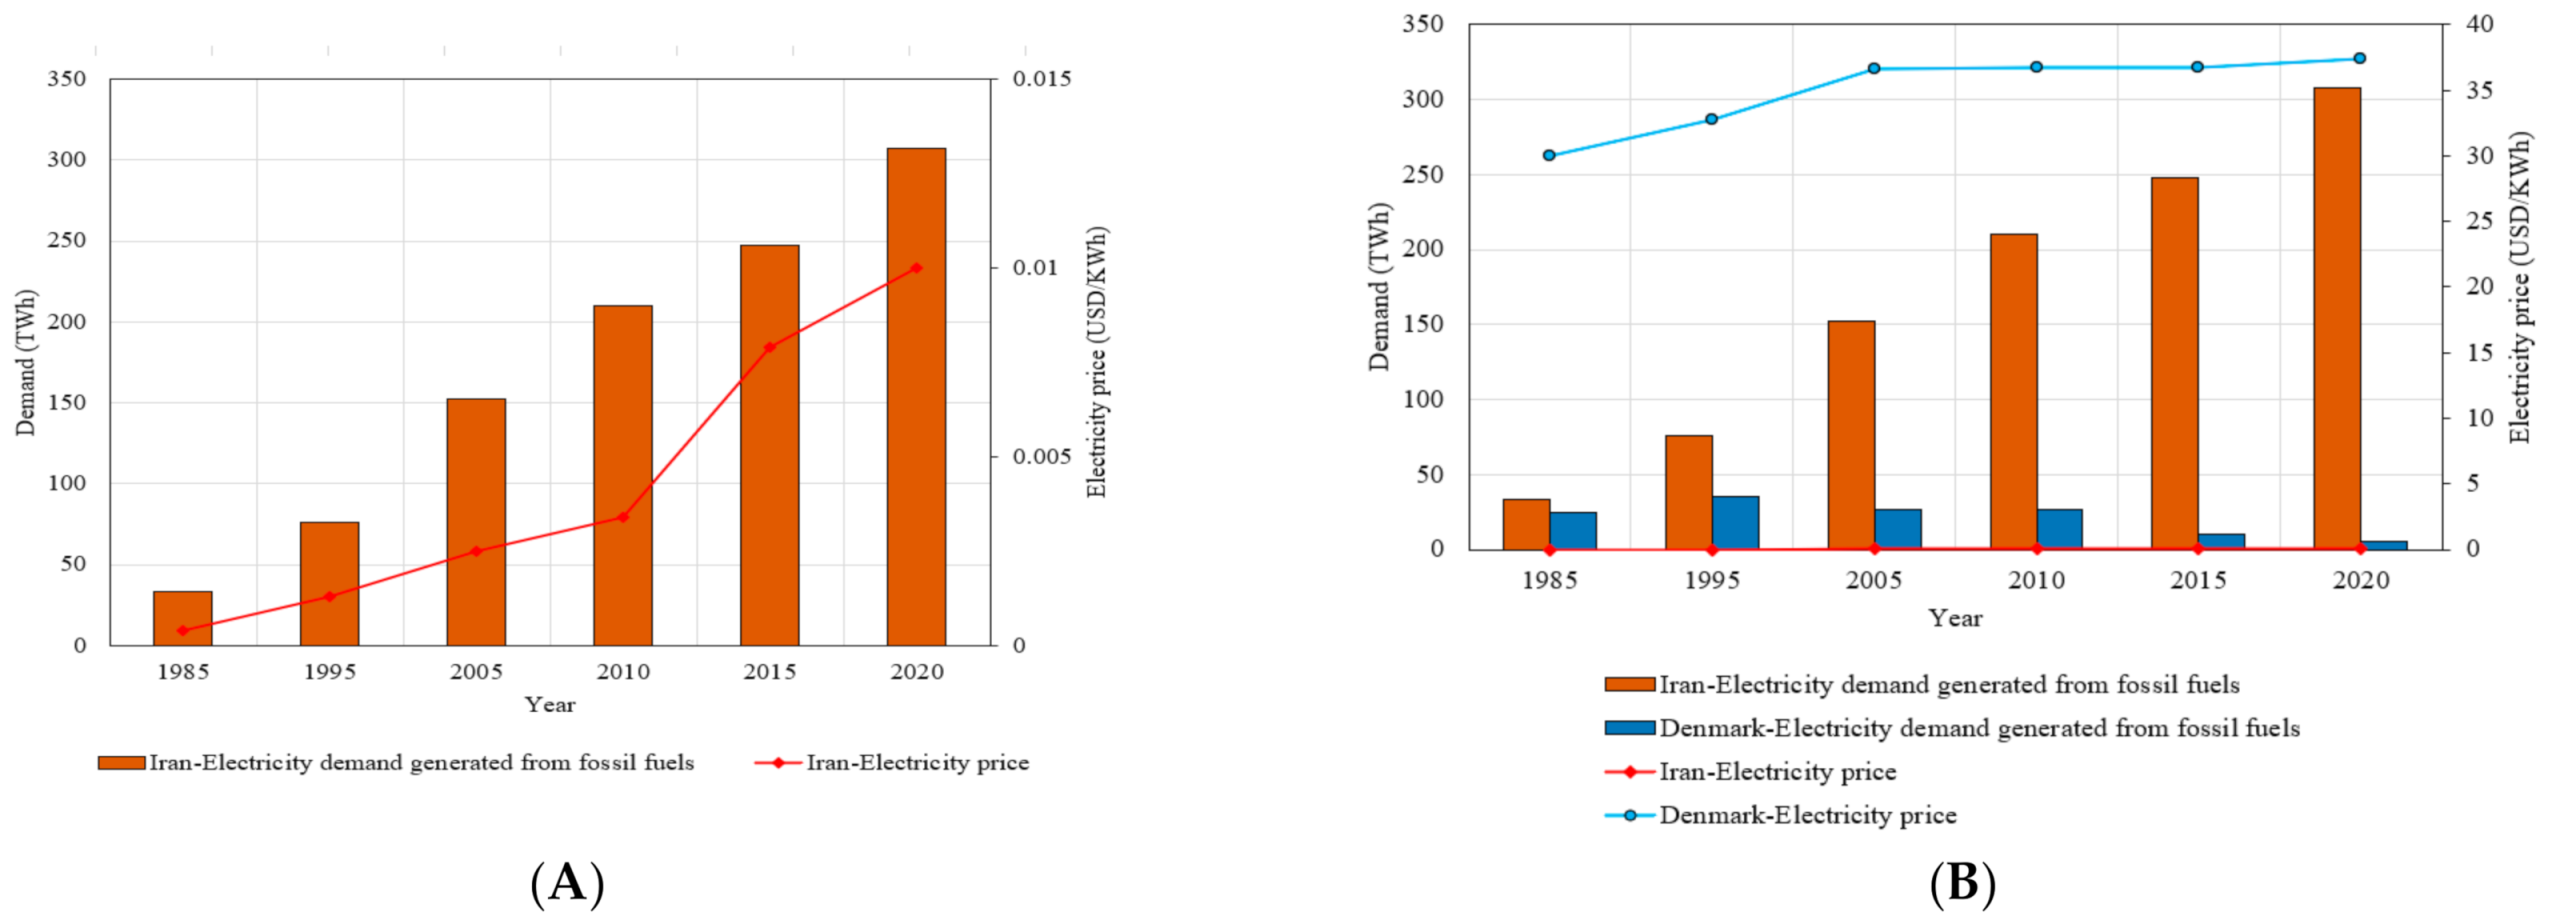
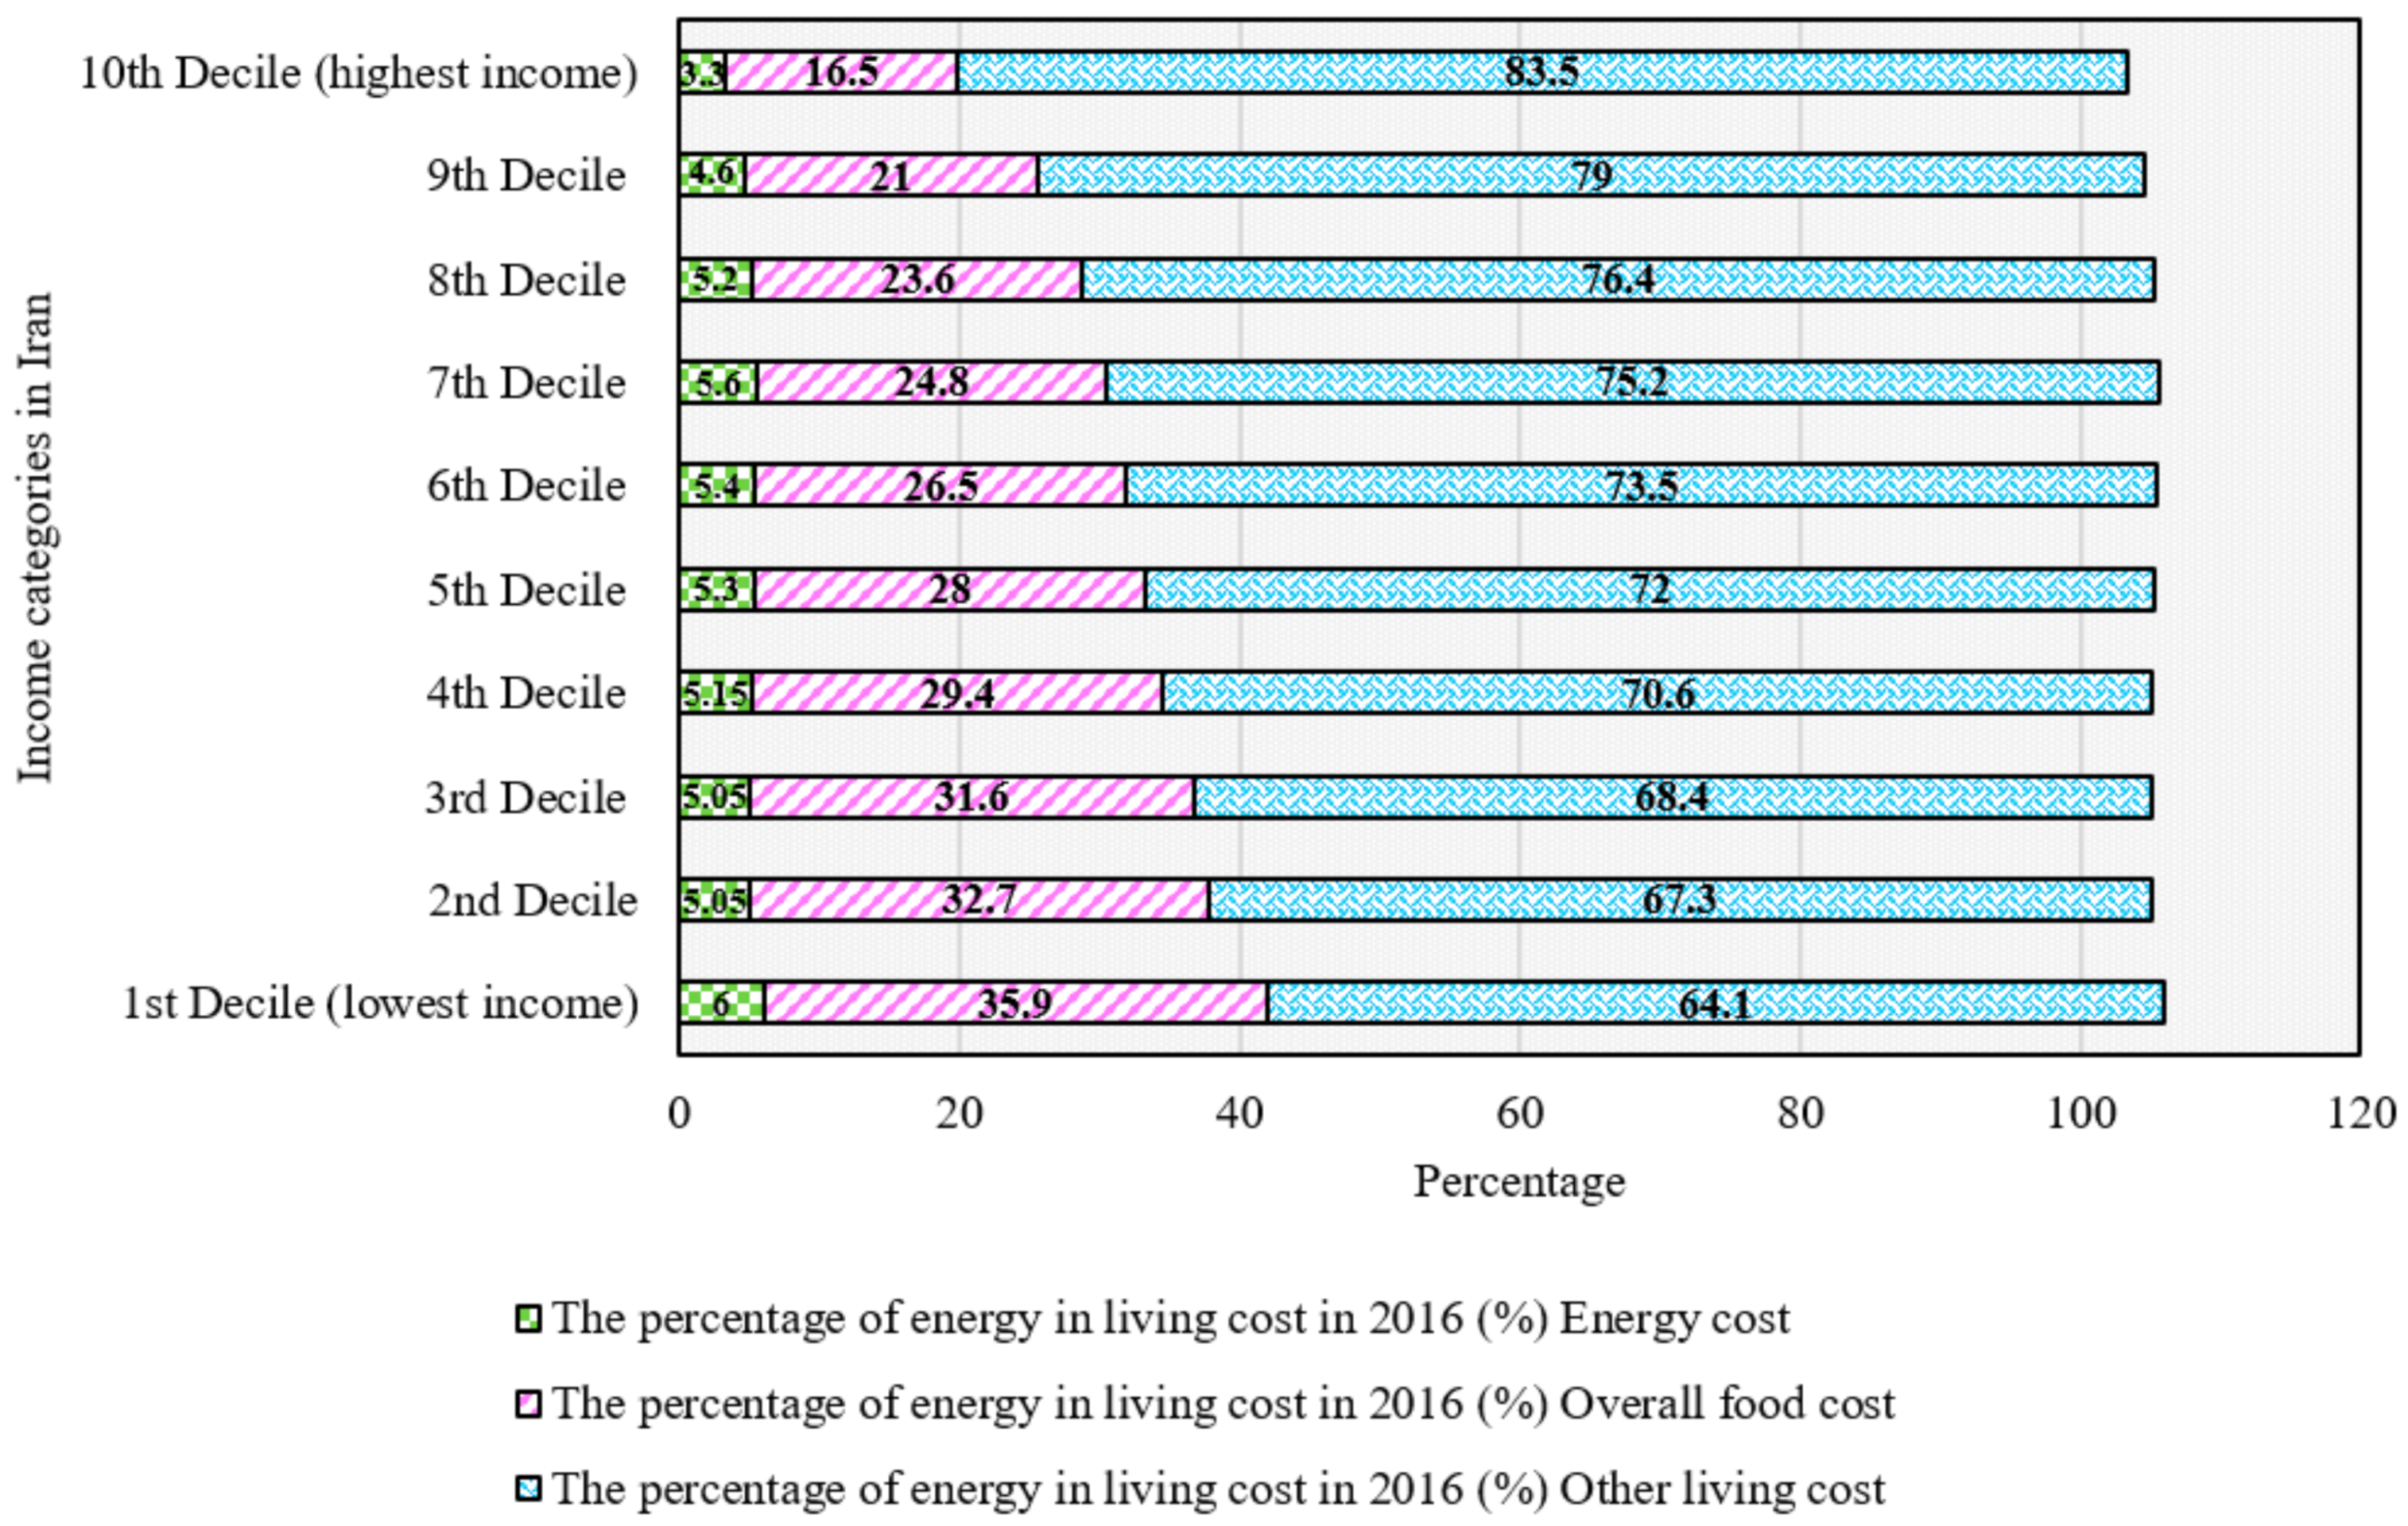
For countries especially with high electricity costs, the price seems to be correlated with the decreasing demand for domestic electricity use. The electricity cost data were collected in this study from [54] to explore further the current and previous status of electricity prices in Iran. After analysing the data, it is worth mentioning that Iran started implementing a subsidy reform to increase electricity prices after 2010 (Figure 18). Unfortunately, it has not affected the increasing demand for domestic electricity use in Iran. A significant gap can still be observed when a price comparison between Iran and Denmark is implemented. This may explain the growing trend in electricity demand in Iran. Accordingly, although there was a sharp increase in the electricity price in Iran, a negligible amount of households’ income belongs to energy costs (Figure 19). According to the data from the National Statistics Centre of Iran, the highest and lowest income of Iranian households allocate 2.5% and 6.8% of their income to energy costs, respectively.
According to the growing trend in electricity demand due to the lower price of electricity in Iran, it seems that there is a necessity for a mental shift in households to have a conscious way of living to reduce electricity consumption, since it appears that there are important factors that are currently influencing electricity consumption in Iran related to their behaviour. Therefore, this study found that the electricity price is not the only solution to address the increasing or decreasing trend in domestic electricity demand in Iran. For further understanding of additional behavioural-related factors, deeper comparisons between Iran and other countries with reduced domestic electricity use (i.e., Australia and Germany) can be beneficial to reveal other factors correlated with domestic electricity use, which are explained in the following sections.

2.4. Correlation between Increasing/Decreasing Trend in Electricity Consumption and Different Factors in Iran

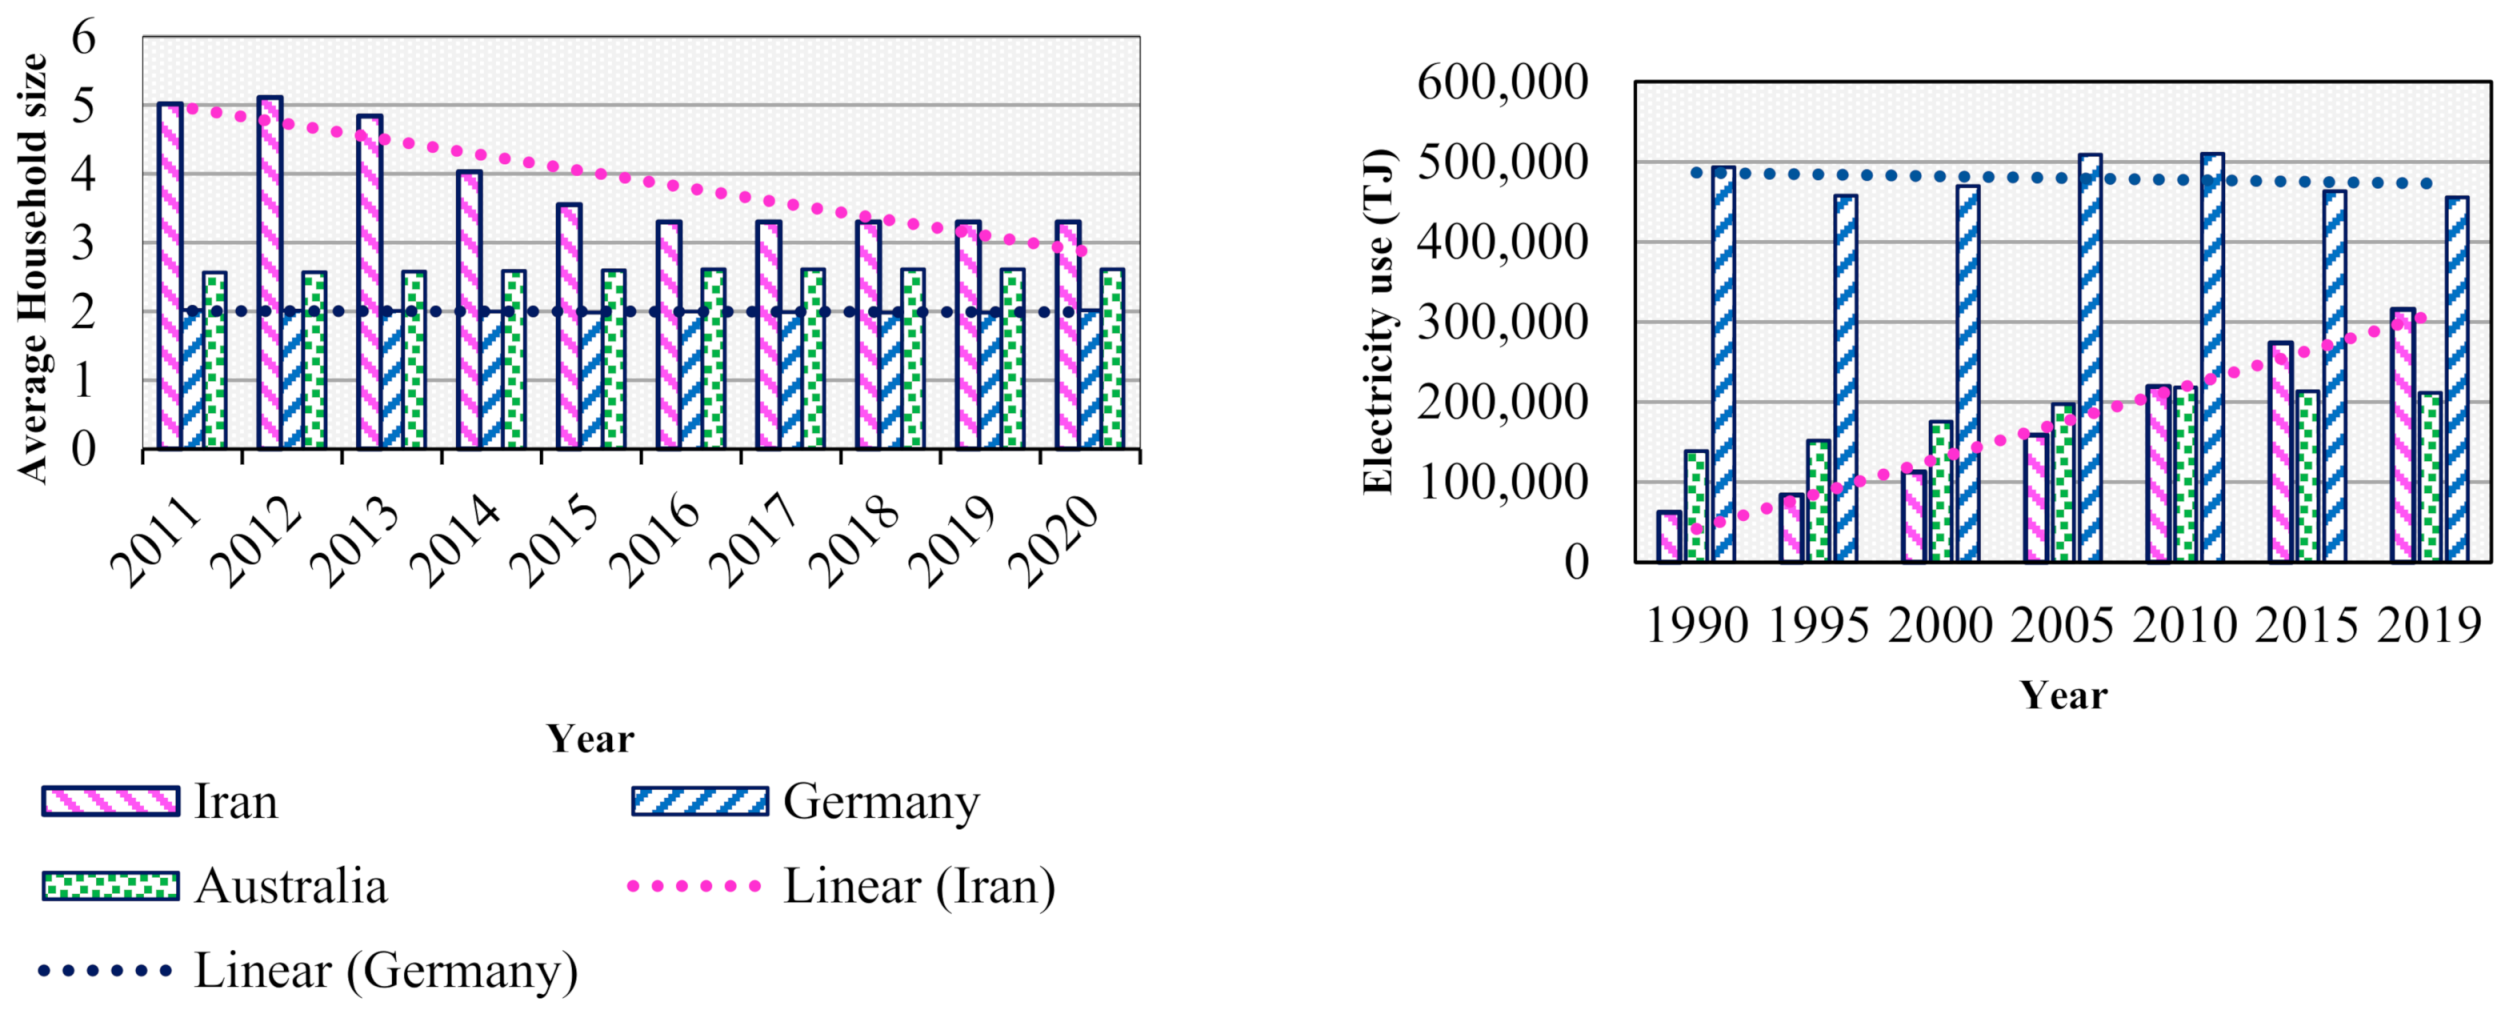
To further explore other factors affecting electricity consumption in countries with high and low electricity prices, this study gathered data to compare Iran, Australia, and Germany’s electricity use per capita and their household size over the years [41,42,43,44].
After analysing the average household size over the years (Figure 20), a correlation was found between the decrease in household size with the reduction in electricity use in Australia and Germany. This result could be expected since in the previous section, a decreasing trend in the overall domestic electricity demand was seen in Australia and Germany. Therefore, the analysis in this study showed that as their average household size decreased, the electricity use demand decreased in these countries. However, this correlation was not seen in Iran. In contrast to the decreasing trend of household size in Iran, domestic electricity consumption always increased from 2011 to 2020.
The comparison between the electricity usage per capita and household size of developed countries and oil-rich countries showed that Iran seems to be not very efficient in terms of domestic electricity consumption. Therefore, when considering domestic electricity consumption per capita, other factors may become important in addition to climatic factors, such as households’ behavioural factors. Therefore, although the electricity usage per capita may be related to climatic factors in a country with higher per capita electricity usage, in another country, the behaviour of the households can also be affected by different reasons, such as their policies regarding energy subsidy as well as electricity price. Another important factor that can affect electricity consumption is the living space per person. For instance, according to statistics, the average per capita residential area in Germany and Australia is estimated to be 44.6 and 87 square metres, respectively [55,56]. This can also explain the reason for their high electricity consumption as compared to Iran. However, it is worth mentioning that the living space per person has been increasing in recent years in Iran, thus, contributing to the rise in the electricity consumption. Therefore, regarding the current living space situation, the per capita residential area is also variable in different provinces of Iran. On average, the per capita residential floor space in Iranian provinces can be between 20 and 50 square meters. According to the statistical centre in Iran, three dimensions for living area per person can be observed based on the average density of provinces. In low, middle, and high densities, the maximum living space per person is 59.2, 41.7, and 37 square meters, respectively [57].
The above comparative analysis of domestic electricity uses in developed countries, and Iran pointed out the significant impact of Iranian households’ behaviour on domestic electricity demand. Therefore, further exploration of behavioural-related issues is crucial to reducing the domestic electricity use inefficiency in Iran.

3. Comparison of Domestic Electricity Uses between Provinces of Iran to Distinguish between Behavioural-Related Factors and Other Factors

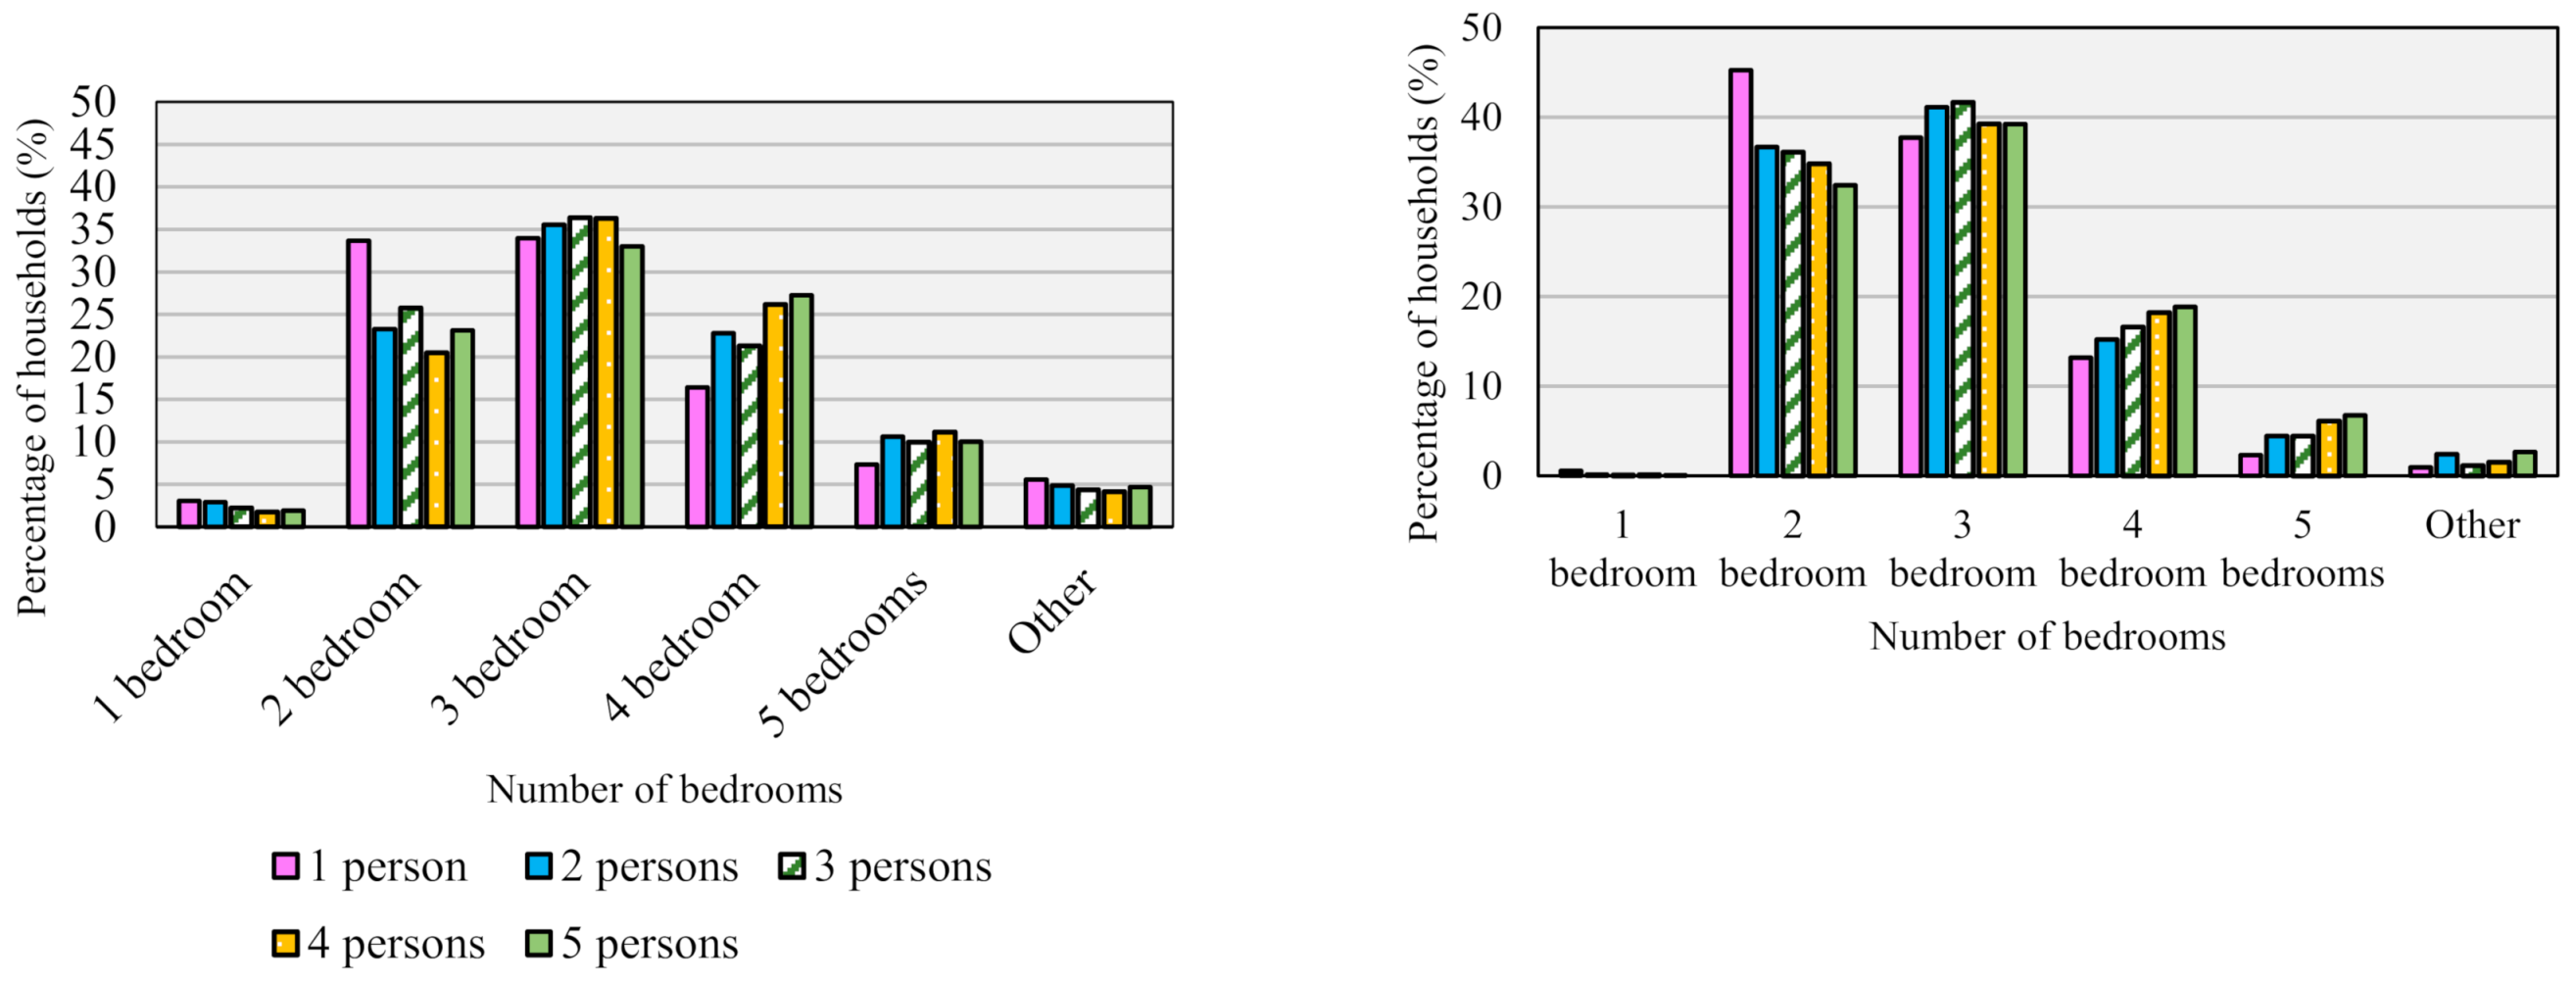
One of the most crucial behavioural-related issues affecting electricity use is house size, which seems to be related to Iranian households’ tendency to live in a larger unit area (Figure 21). Compared to 2012, smaller household sizes (one to two persons) tended to choose larger houses in 2018 despite their small population. Interestingly, the data showed a change in accommodation of one- to two-person households from one- to two-bedroom unit apartments to more than two bedrooms in 2018. The same result was seen for two- and three-person households, who prefer to live in two- and three-bedroom units. In general, the demand for one-bedroom units has decreased, while the larger unit areas have gained popularity among households. It is worth mentioning that the four- and five-bedroom units are reduced due to an increase in the number of people living in apartments rather than single-family houses. Living in a larger unit area can significantly affect households’ electricity consumption.
For further understanding of other factors, this study compared the provinces of Iran to find out whether there is a difference in their electricity demand in the following section.

3.1. Electricity Use in Provinces of Iran and Important Factors Affecting Demand

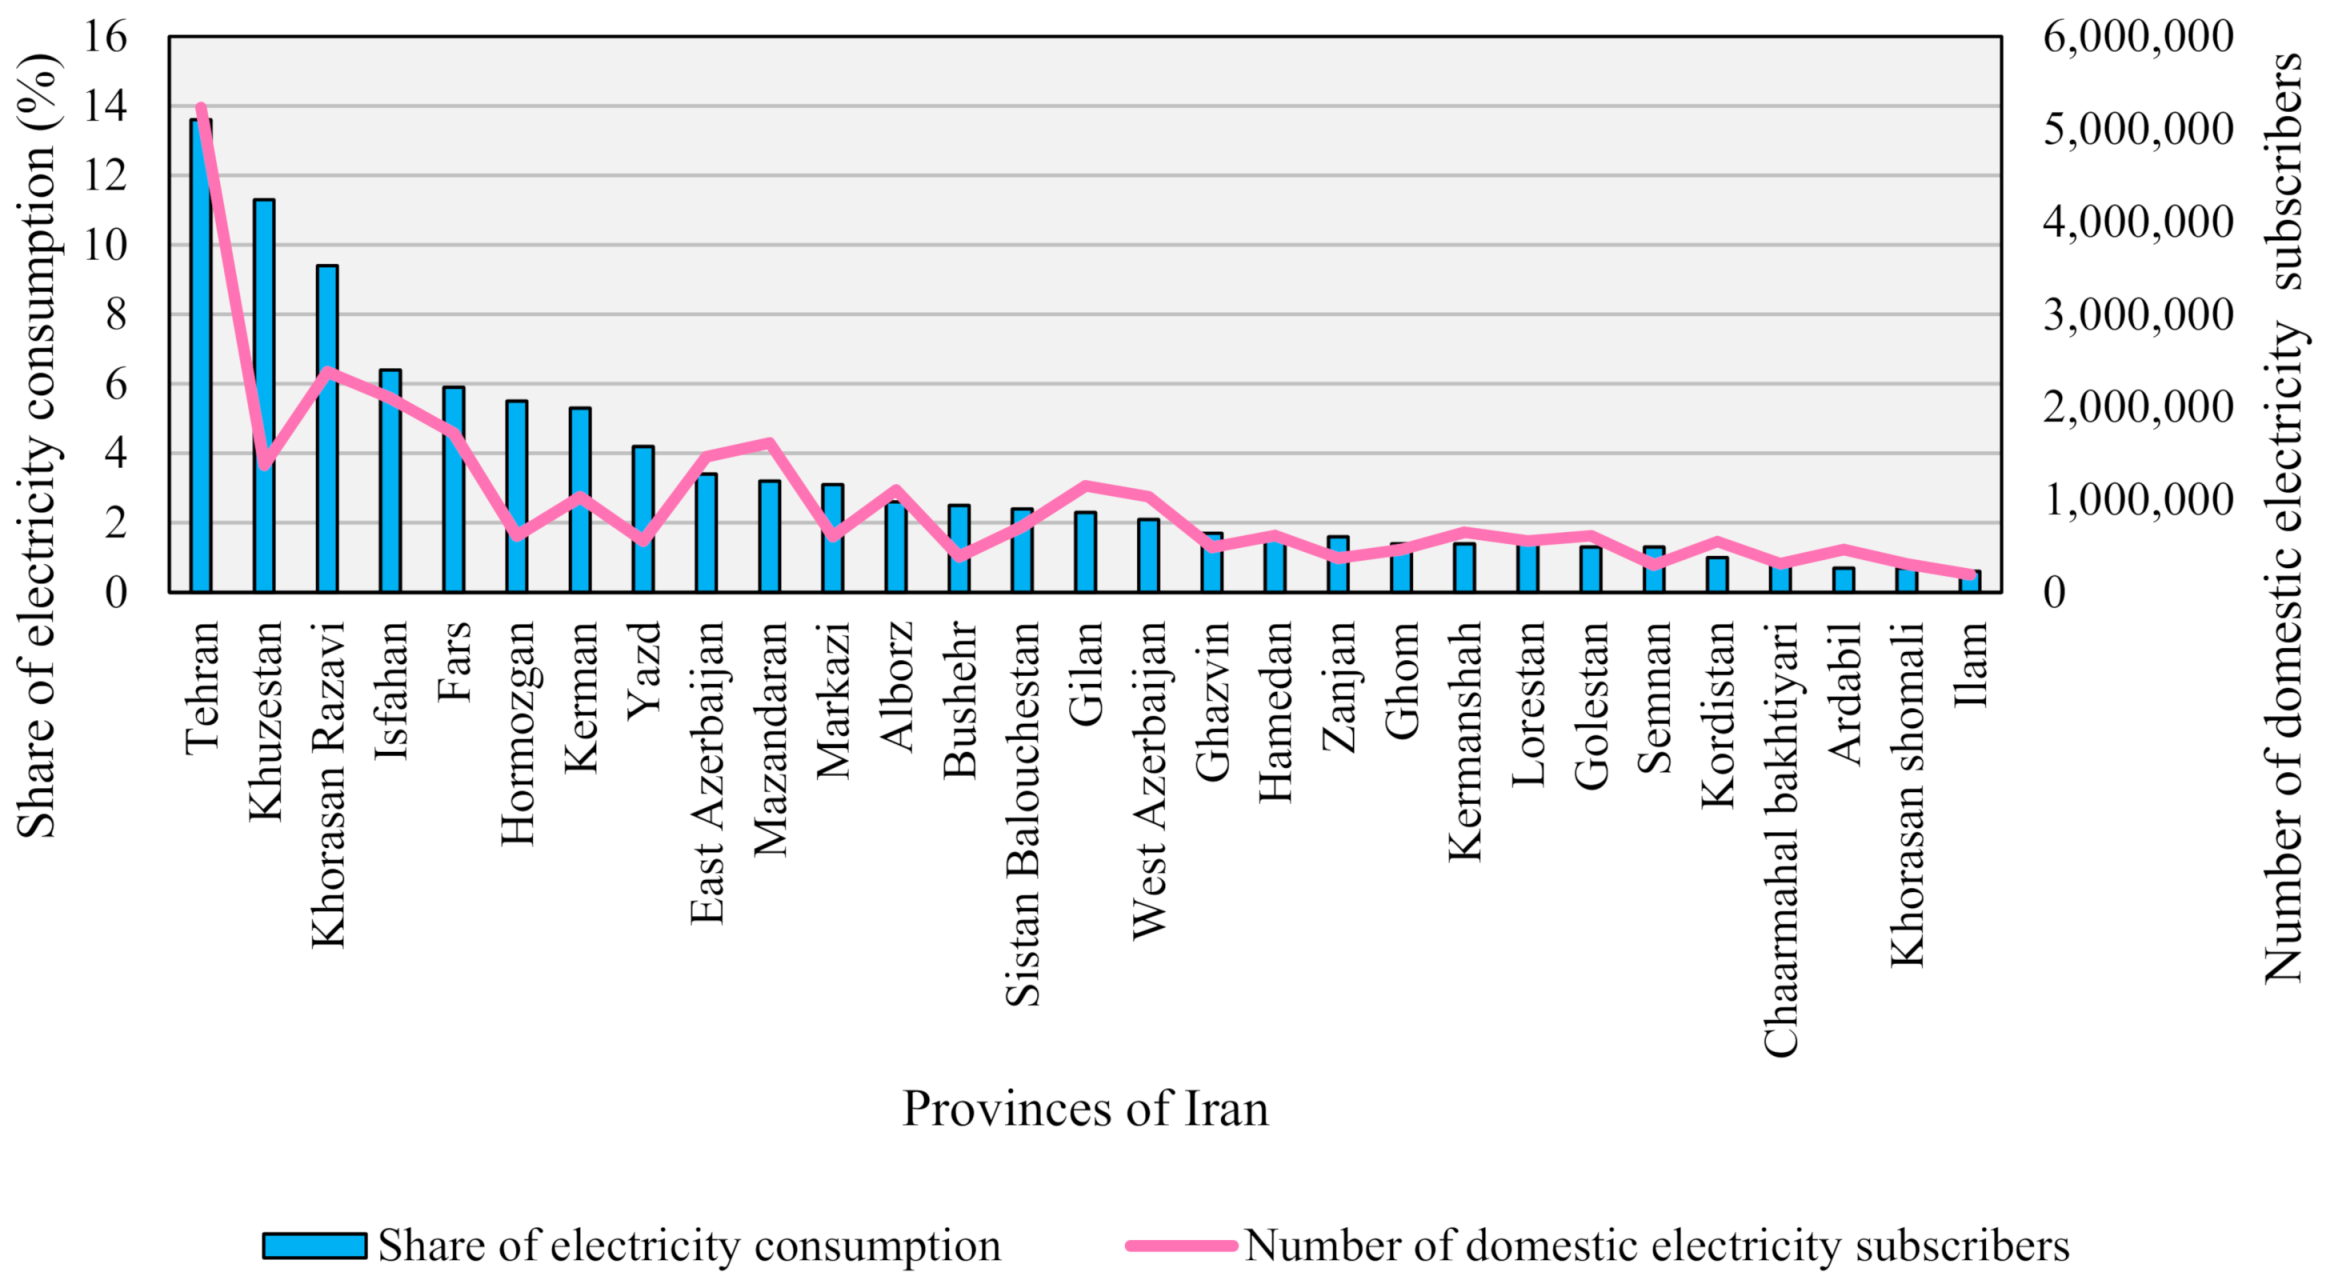
One of the factors which can affect electricity demand is household subscribers. Therefore, among the provinces of Iran, such as Khuzestan, Isfahan, Kerman, Yazd etc., Tehran is playing a pivotal role in decreasing the growth in total electricity demand of the country due to a high number of subscribers. According to Figure 22, with a significant share of electricity use, Tehran accounts for 13.6% of the total percentage, while the remaining provinces are below 11.3%. The findings support the view of previous studies that pointed out the importance of population on energy consumption [58,59,60].
Although in cities like Tehran, the number of subscribers can significantly affect the overall electricity use in a province, other factors can be as crucial as the subscribers. For instance, in Khuzestan, electricity use is extremely higher than its portion of subscribers, drawing attention to other important factors affecting electricity consumption.

3.1.1. Climatic Factors as One of the Reasons behind the High per Capita Electricity Use

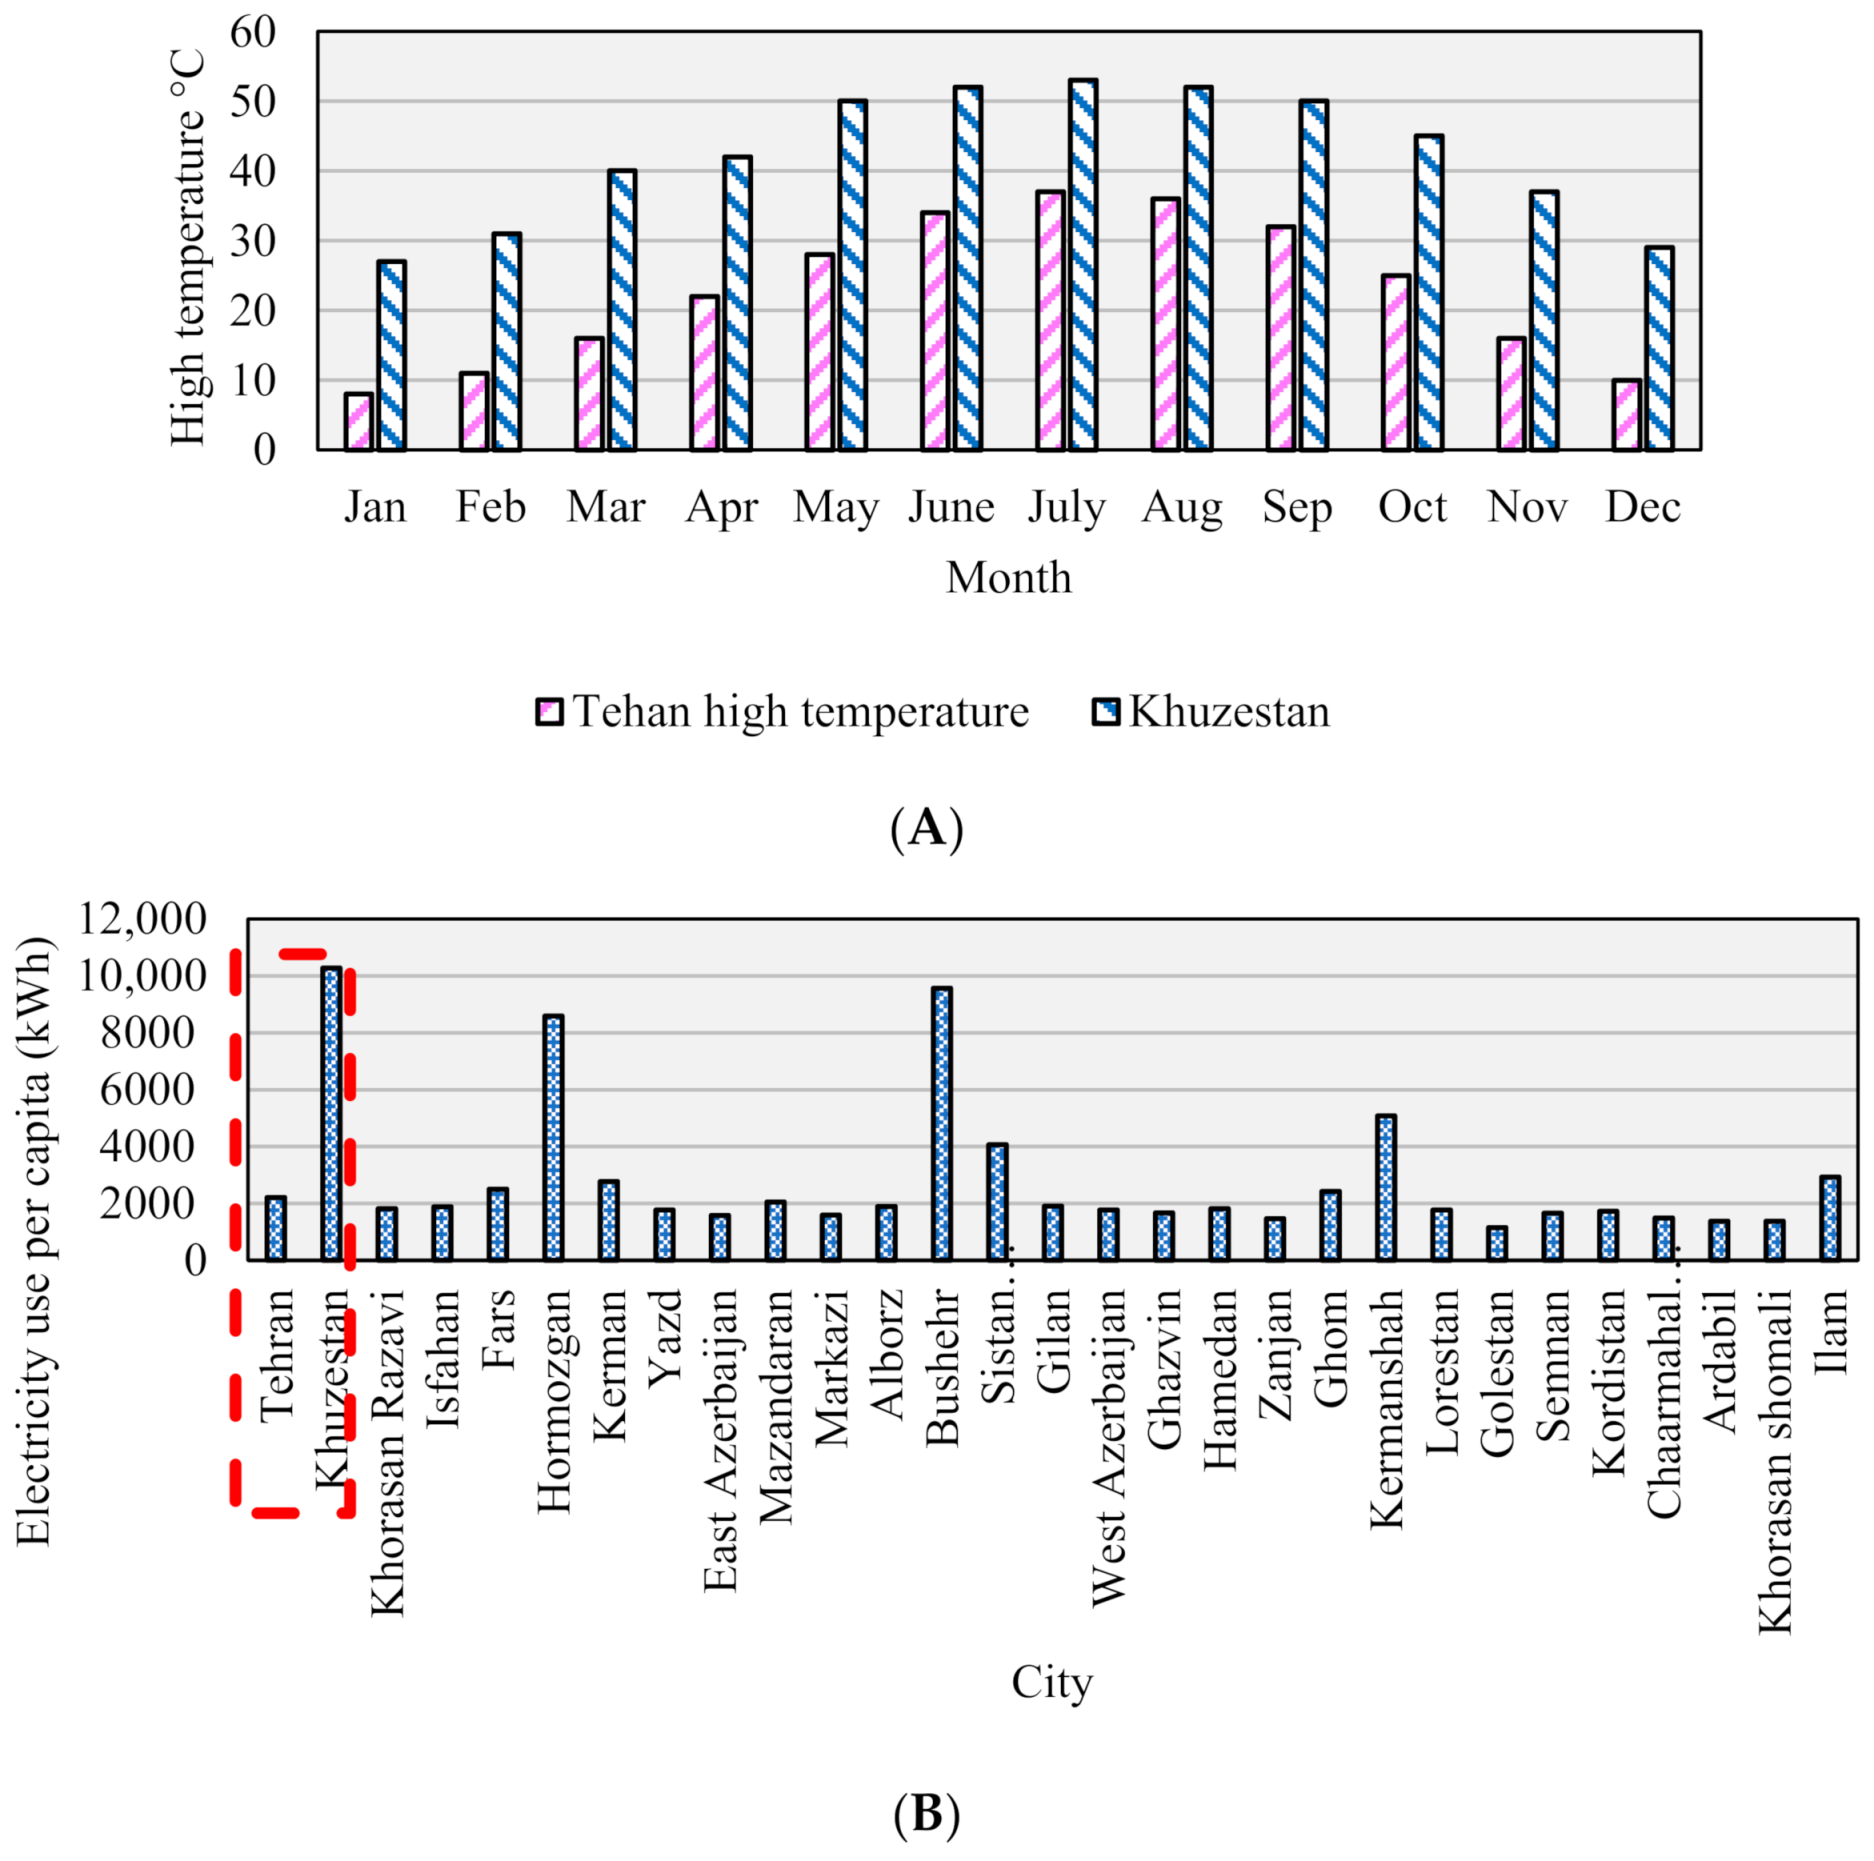
According to Batliwala and Reddy (1993) [61], energy demand depends on per capita energy use. Therefore, to further understand other influencing factors of domestic electricity demand, Tehran and Khuzestan were compared in terms of overall characteristics and electricity use per capita. As indicated previously, the household subscribers were not wholly associated with the electricity use in Khuzestan due to the lower number of electricity subscribers but significantly higher electricity use than in Tehran. A question may arise regarding the inefficient use of electricity in Khuzestan. To understand whether households in Khuzestan use electricity inefficiently, the electricity uses per capita of Tehran and Khuzestan were compared. After comparing the climate of Tehran and Khuzestan (Figure 23), this study found the reason behind the large share of electricity use in Khuzestan to be the harsh climate, which in turn has affected the per capita use of electricity. Accordingly, unlike Tehran, the temperature in Khuzestan can be extremely high, based on which the per-capita electricity use would inevitably increase. Therefore, this study found that the high electricity usage per capita in Khuzestan does not necessarily imply their inefficient use. In other words, the climate drives the occupants to use more electricity to alleviate discomfort levels experienced in a harsh climate.

3.1.2. Non-Climatic Factors as One of the Reasons behind the High per Capita Electricity Use

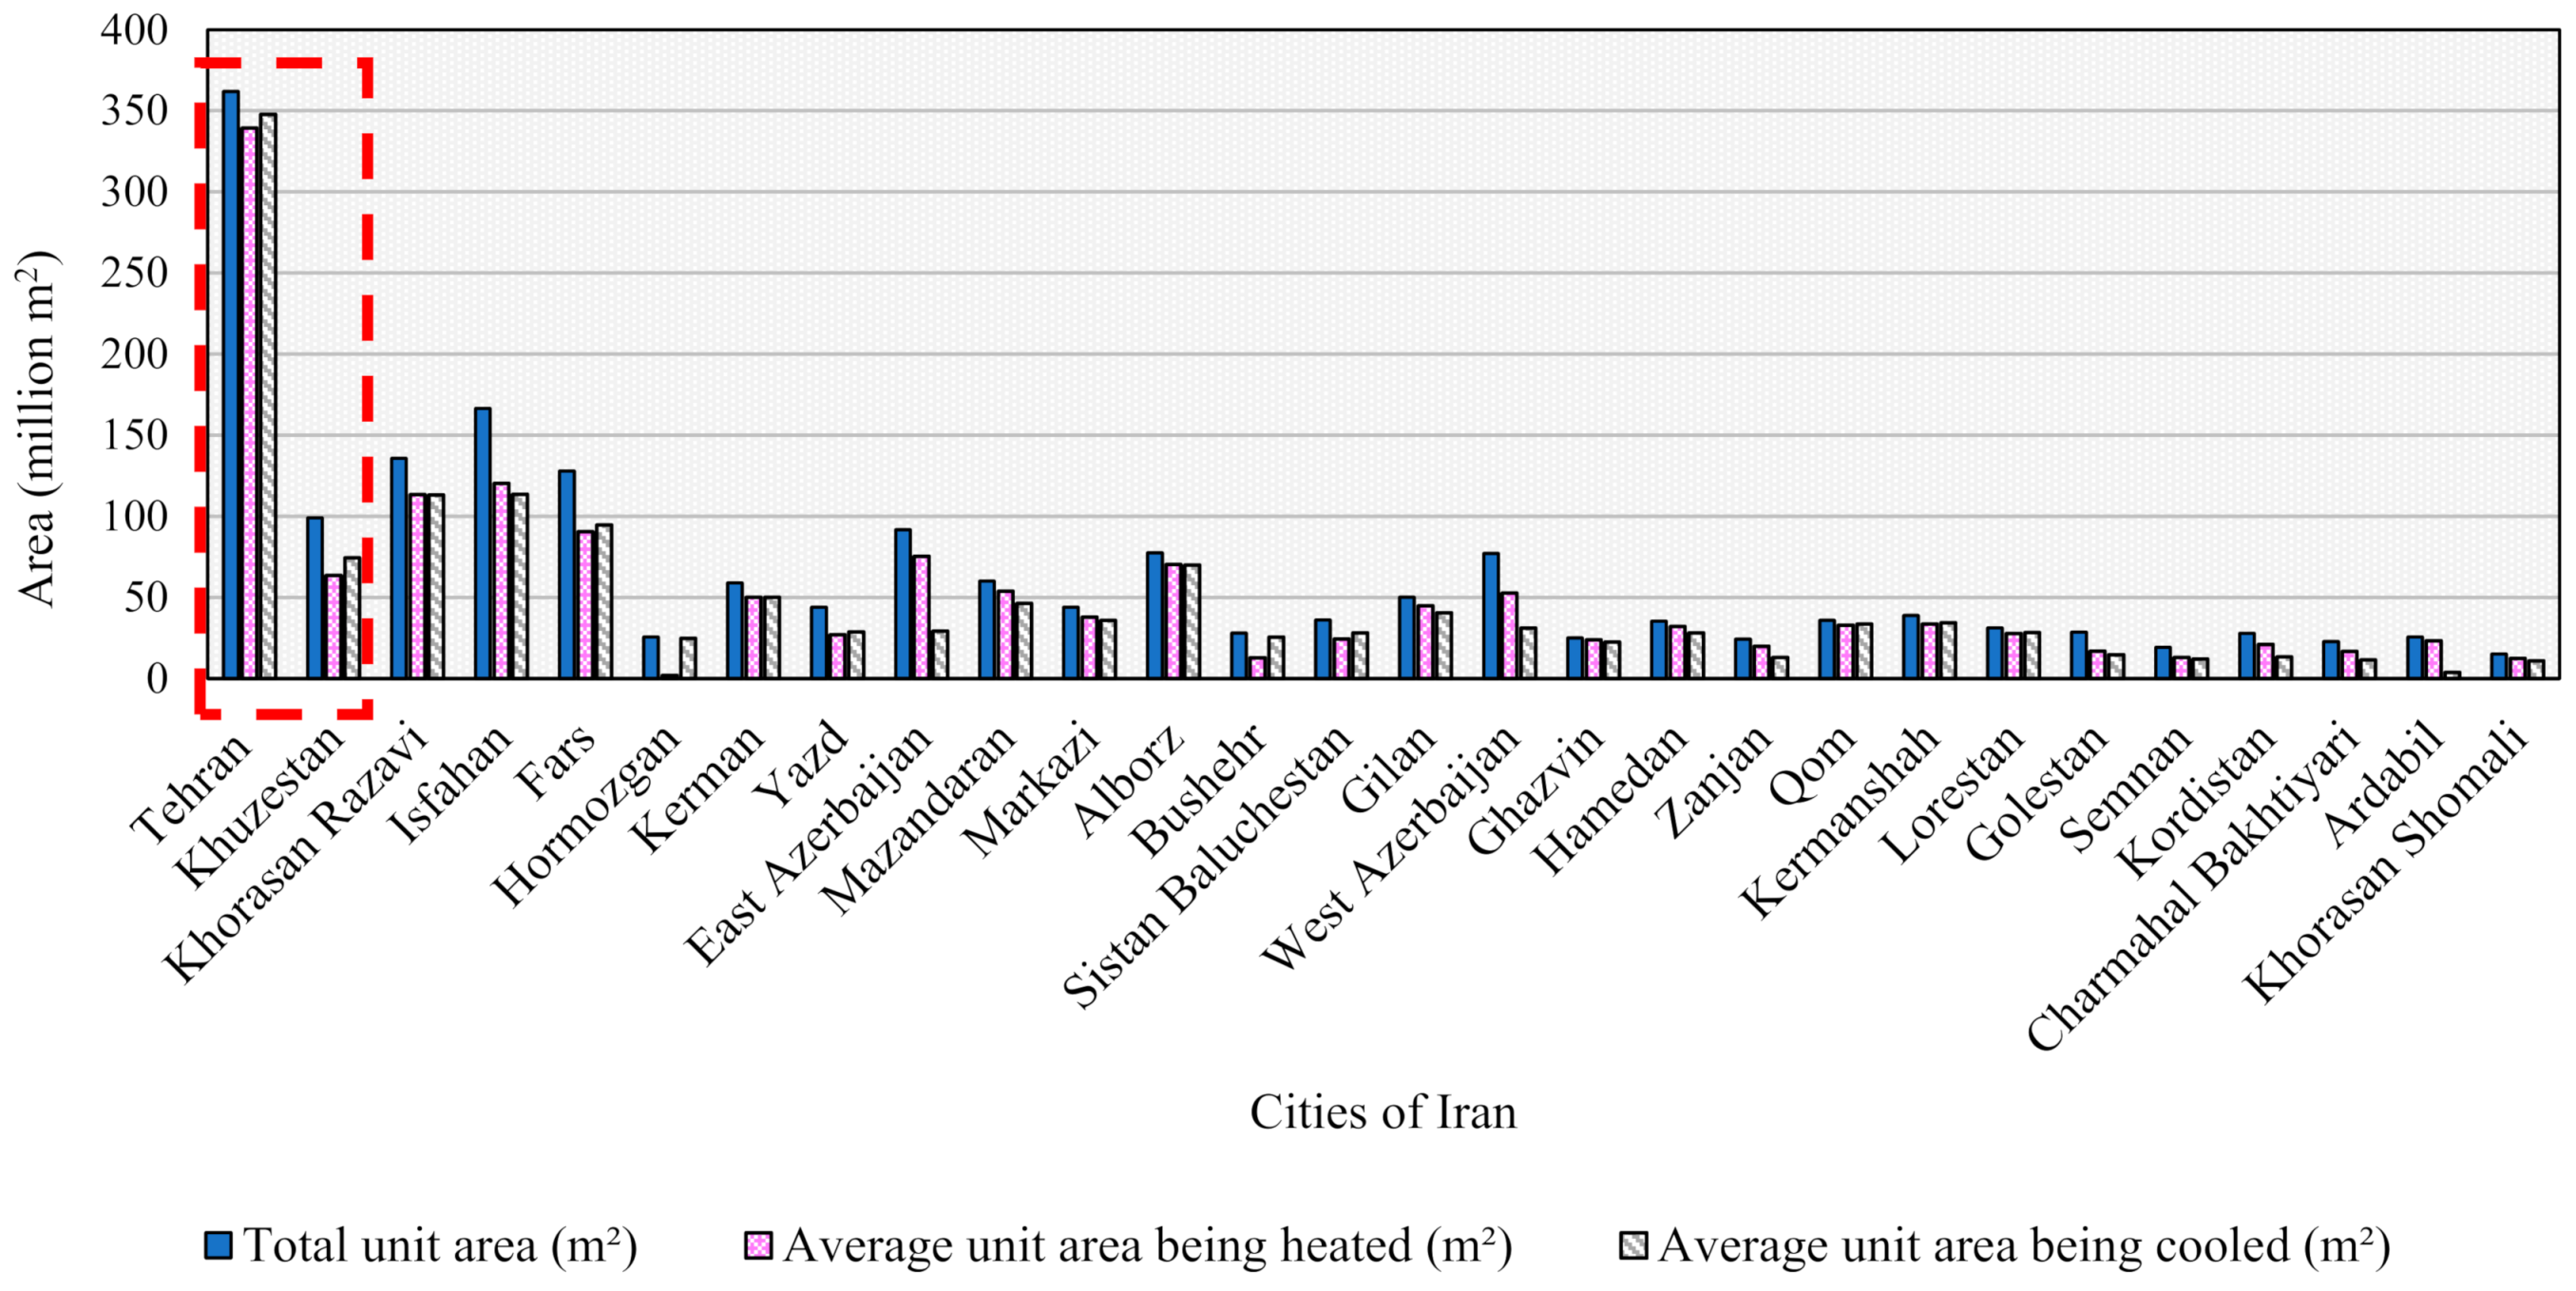
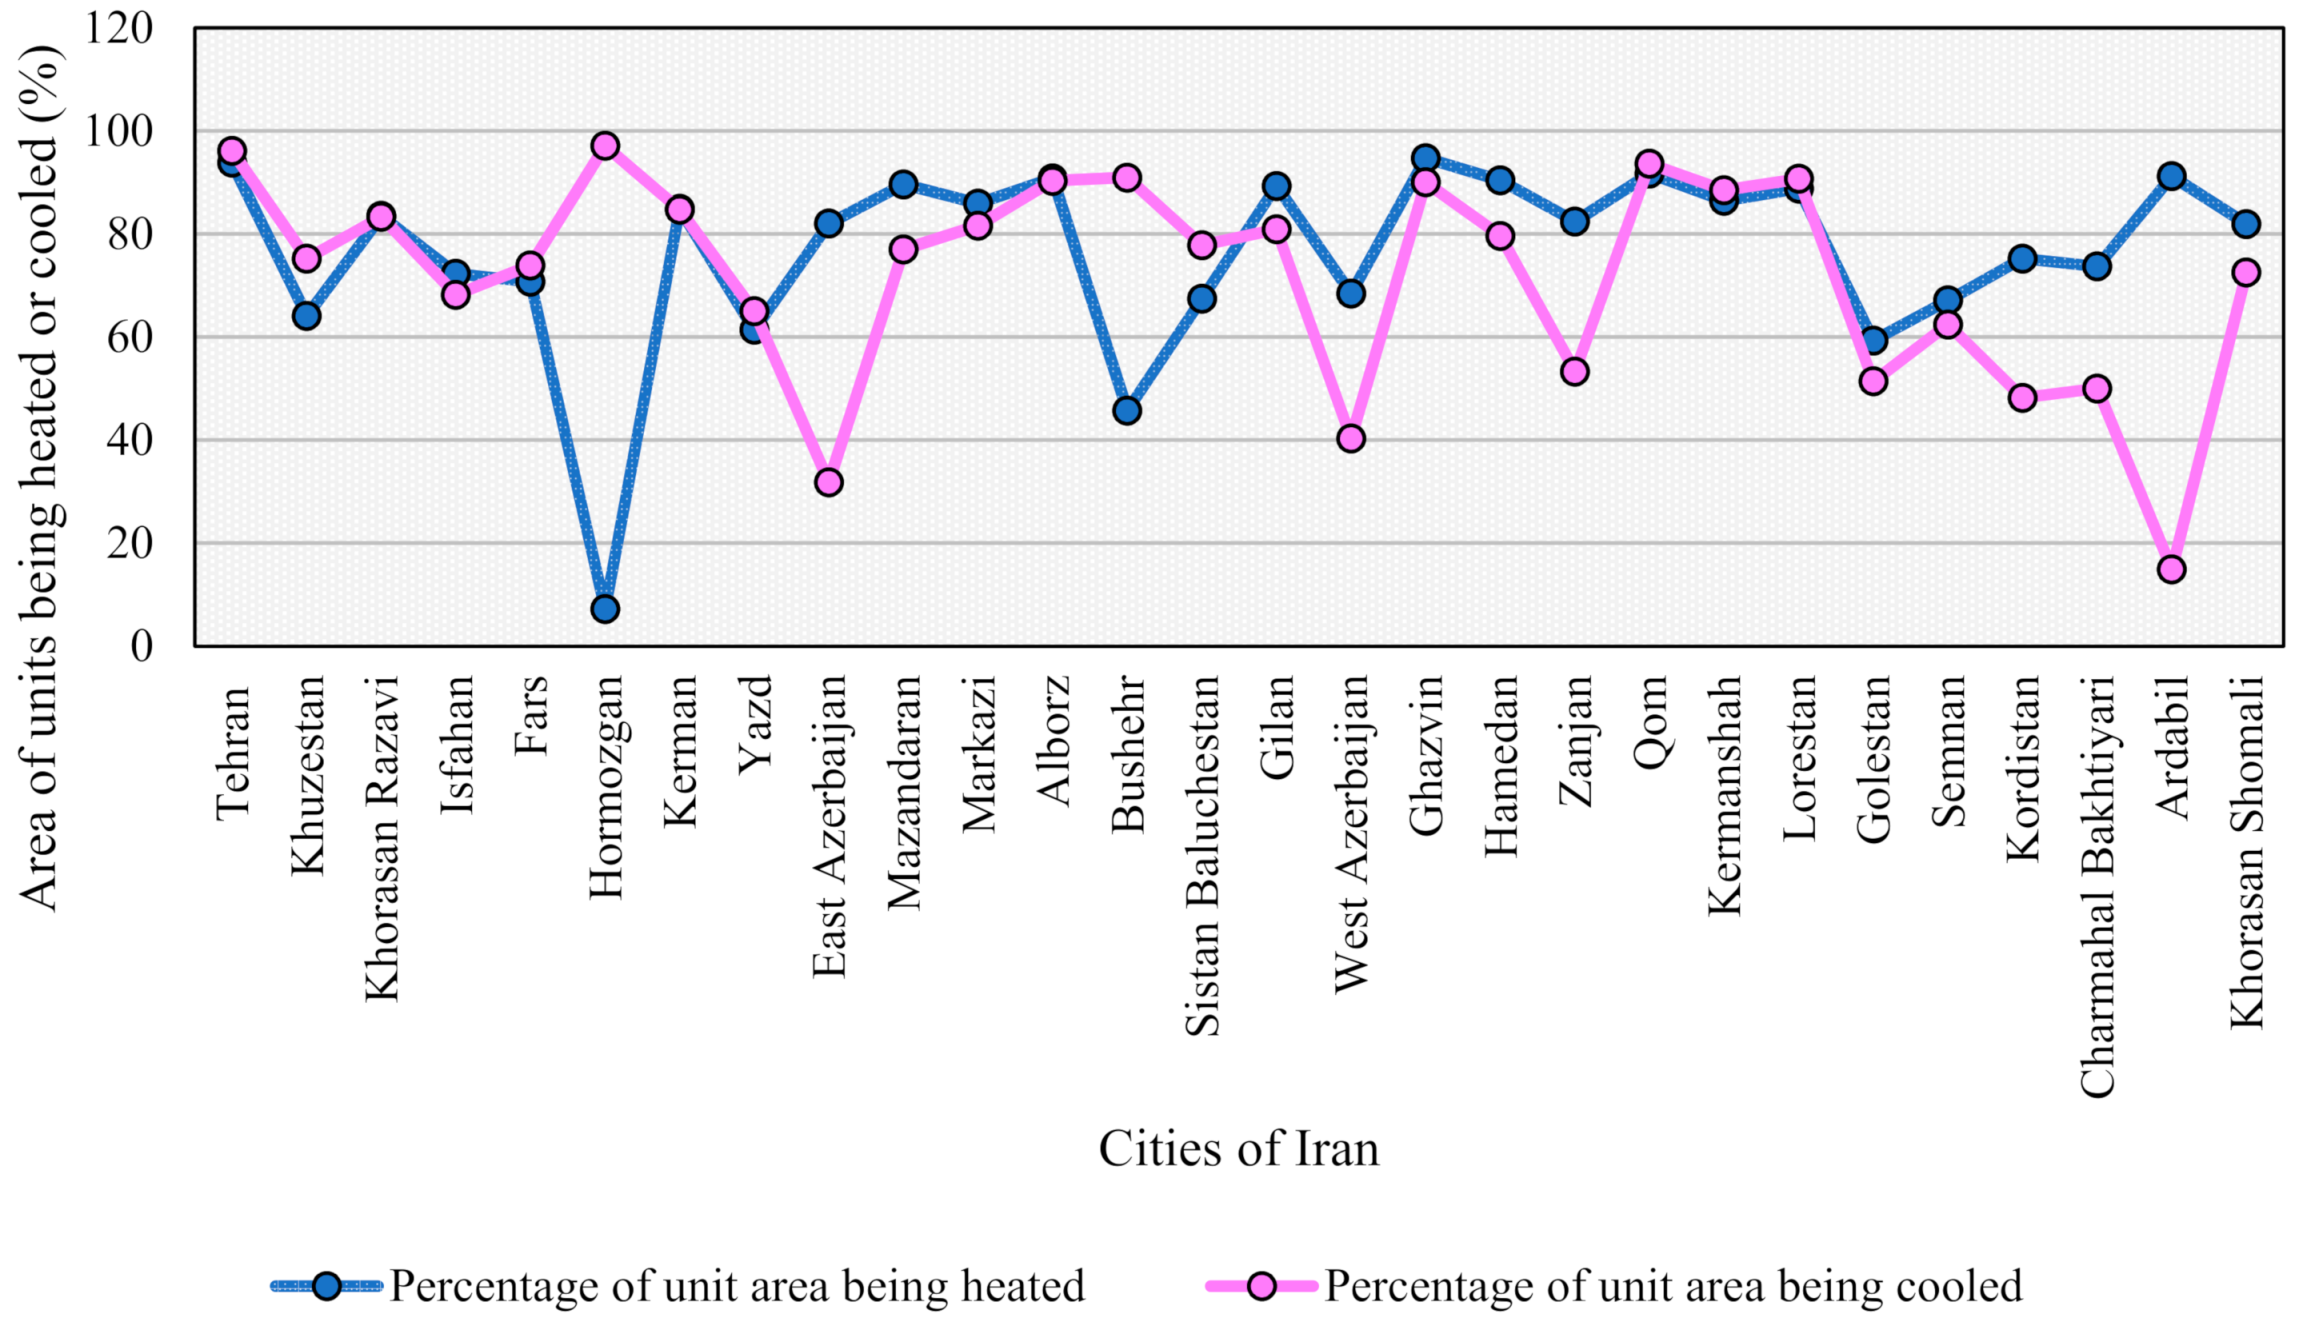
While climatic factors can be crucial in electricity use per capita, non-climatic factors can also be influential. As discussed previously, an increase in Khuzestan’s electricity usage per capita may not necessarily equate to the inefficient electricity use of households due to climatic factors. This can also be seen through the electricity price allocated for each province based on the climate conditions of that specific province. For instance, the electricity price for Khuzestan province is much lower per kWh electricity consumption of the occupants than in Tehran province. However, the climate is not the only factor on which the efficient use of electricity per capita is based. Therefore, additional aspects need to be investigated. For this purpose, this study explored and compared the average unit areas being heated or cooled in Tehran and Khuzestan to determine the non-climatic aspects which can lead to the inefficient use of electricity per capita (Figure 24 and Figure 25). This study found that although Khuzestan’s electricity use per capita is higher than in Tehran, the average and percentage of cooled unit areas in Khuzestan are significantly lower than in Tehran. Surprisingly, despite the harsh climate in Khuzestan, the portion of areas being cooled is lower than in Tehran. Interestingly, this study revealed that with a milder temperature in Tehran, occupants still heat and cool a more significant portion of their unit areas, nearly 96.1%. This comparison revealed that non-climatic factors have led to a higher percentage of unit areas being cooled despite the milder climate in Tehran.
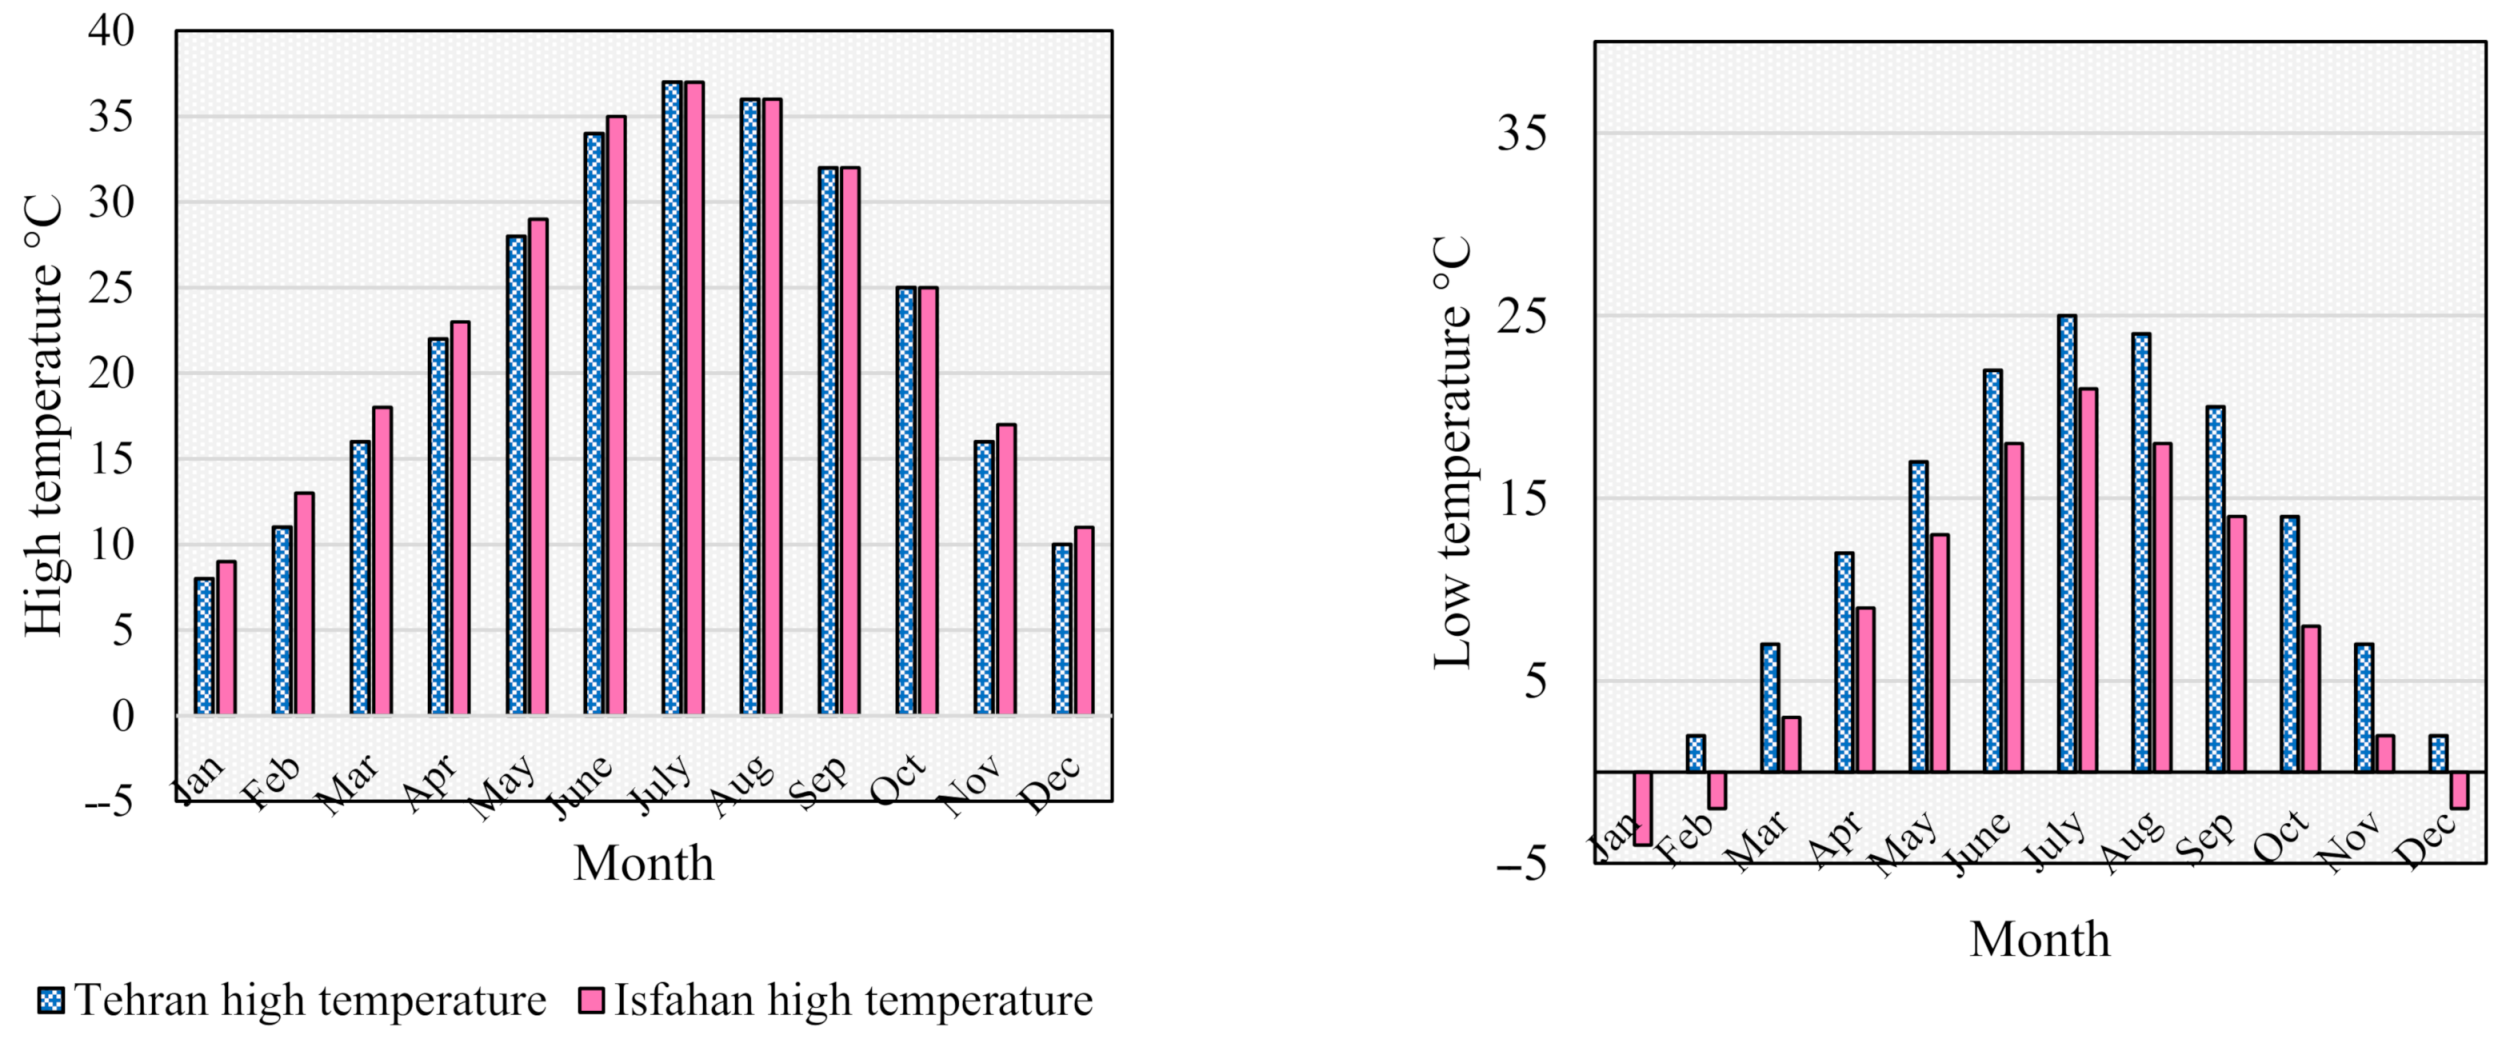
This study found that in situations where the cities’ climate differs, a harsh climate could explain a province’s high per capita electricity use. The comparison also showed that there could be provinces with milder temperatures but higher electricity usage per capita than other provinces with a harsh climate. To further explore the non-climatic factors affecting electricity demand, this study selected a province with nearly the same climate as Tehran. Figure 26 depicts the high and low temperatures in different months of Tehran and Isfahan. Although Isfahan experiences higher and lower temperatures during summer and winter, the amount can be negligible as no provinces can have the same climate. Therefore, considering the temperature as a control variable, a comparative analysis of the percentage of unit areas being heated and cooled in Tehran and Isfahan was conducted.
Interestingly, the analysed results revealed that even with the same temperature, Tehran includes a higher percentage of their spaces for heating and cooling than Isfahan. Therefore, it can be concluded that the non-climatic factor can be an essential reason for increased electricity use per capita in Tehran, primarily related to the households’ behavioural issues. For instance, although Isfahan experiences higher temperatures during summer or lower temperatures during winter, the households employed a lower percentage of space areas to cool and heat their living areas than Tehran. It is worth mentioning that the higher percentage of space areas for cooling and heating purposes may also depend on the higher number of occupants in a living space. The dependency of energy use on household size was also indicated by other studies that investigated the energy use behaviour of occupants in different countries and Iran [62,63,64,65]. However, as this study compared the household size of Tehran and Isfahan over the years, a decreasing trend was observed in the household size of both provinces. However, unlike Isfahan, as the household size decreased, the electricity consumption pattern increased in Tehran (Figure 27).
The comparative analysis between Tehran and other provinces revealed that in addition to climatic reasons, behavioural factors, namely house size, heated or cooled area percentage of space, and household size, could play a crucial role in increasing the amount of electricity used per capita.
Overall, in the global as well as local context, behavioural factors can explain most of the increasing trend in either “total” electricity demand or “per capita” electricity demand in Iran and Tehran when compared to other countries and provinces in Iran (i.e., Isfahan and Australia). Similar to Iran, a study by [66] revealed that energy use per capita in Qatar was one of the highest in the world, which is heavily subsidised for consumers [67]. It is worth mentioning that in Qatar, building practitioners have started to explore new approaches to reducing energy use by enhancing energy efficiency [68]. The Gulf Organization for Research and Development has developed the Global Sustainability Assessment System (GSAS) as their building sustainability assessment system to achieve energy efficiency while considering the local needs of Qatar. However, such a sustainability rating system has not been implemented in Iran for different types of buildings.
The above comparison in this research showed that unlike Australia in a global context and Isfahan in a local context, the reduction in household size had not affected the portion of space heating or cooling in Iran and Tehran. Based on the comparative analysis, non-climatic factors seem to be the main reason for domestic electricity use in Iran. Regarding climatic factors, the high per capita electricity use of occupants was seen to be associated with the temperature. However, the high per capita use due to non-climatic factors seems to be related to behavioural aspects of the households rather than the temperature, which have been affected by the energy subsidy of this country.

4. Behaviour as a Crucial Factor to Be Included in the Policy Enactment of Iran to Address High per Capita

In terms of energy, several regulations were developed by the Ministry of Housing and Urban Planning to achieve energy efficiency in the design and construction of buildings in Iran. The national energy efficiency regulation, known as Code No. 19, is one of the energy regulations which includes policies for external wall insulation materials, double glazing windows and their materials, and installation of building control systems based on the different climatic situations of different provinces of Iran [69]. Although Code No. 19 is mandatory for the buildings, there are barriers to the implementation. One of the barriers is the lack of specific codes for different building types, especially for residential buildings. It is also worth mentioning that, in contrast to most developed countries, there is no specific assessment system in Iran based on which the evaluation of the energy performance can be performed.
The most important barrier to the implementation of the Code No. 19 is the low energy price in this country, which has negatively affected the implementation of this regulation in a comprehensive manner. Therefore, many architects may not consider the regulations due to the high cost of implementing energy efficiency standards. Due to the cheap energy in Iran, the building industry has also faced the issue of insufficient trained architects and supervisors for the Code No. 19 implementation.
This cheap energy has also caused other critical issues regarding energy consumption in Iran. As discussed previously, the energy subsidy in Iran, as an oil-rich country, has significantly affected occupants’ behaviour. This subsidy has made it difficult for these countries to achieve efficiency through occupants’ energy use behaviour. Many researchers proposed revisions to subsidy policies after the issues created by the energy subsidy. For instance, studies conducted in China [20,70] pointed out that energy subsidy reform can be a solution to reduce energy use by reallocating a subsidy among different income groups in the domestic sector. Wang et al. (2009) and Liu and Li (2011) [71,72] also indicated that subsidy reform for fossil fuels could improve energy consumption while encouraging energy conservation. Other studies [23,73] highlighted the necessity for other solutions to substitute the fossil fuel subsidy with renewable energies or other effective social security systems, which could prevent significant inefficiencies in the Middle East regions’ energy use patterns.
Although removing the energy subsidy is indicated to be an effective solution for energy use reduction by many researchers [74], it may have some drawbacks. For instance, Fattouh and El-Katiri (2013) [23] pointed out that removing the energy subsidy can directly and indirectly affect households. First, it can result in higher prices for households’ electricity use and second, it may result in higher costs for other goods that use energy as an intermediate input. Therefore, removing the fossil fuel subsidy may bring about potential socio-economic issues [22].
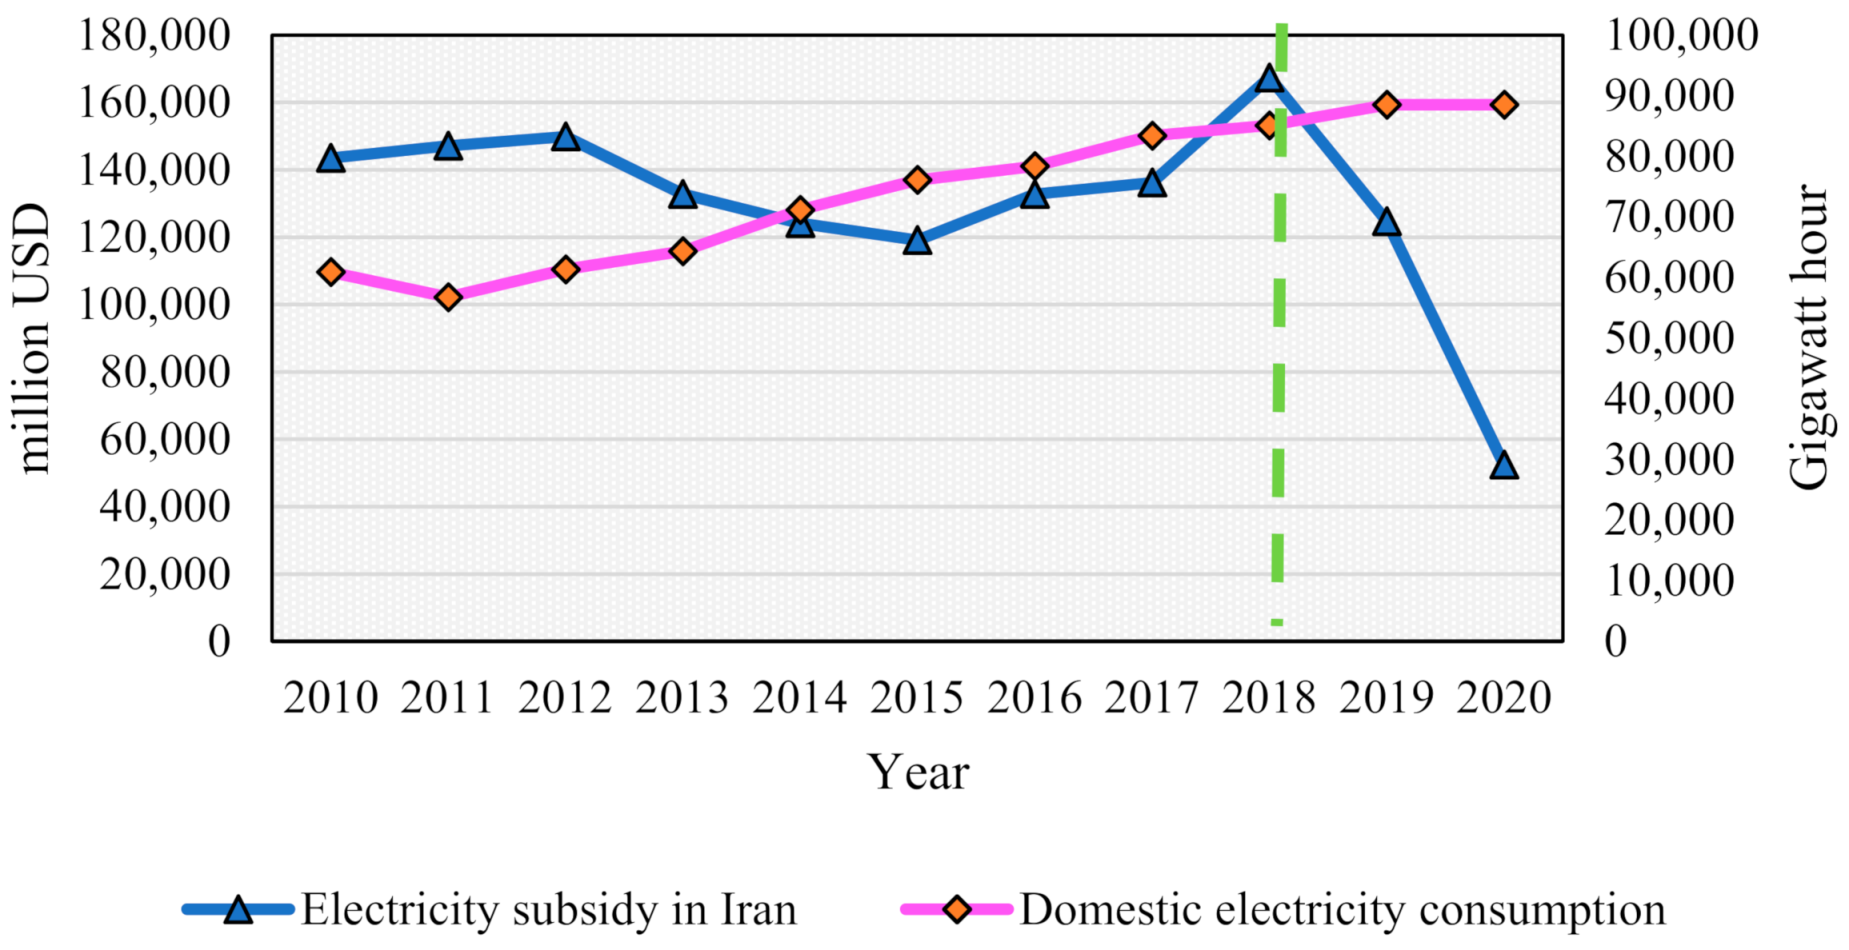
In addition to subsidy removal proposed by researchers, policymakers endeavoured to reduce the increase in occupants’ energy use by raising energy prices. In 2010, the Iranian subsidy reform aimed to remove the energy subsidy to reduce energy demand. Although this policy effectively reduced electricity consumption in the short term, the effect was not sustainable in the long term (Figure 28). According to data gathered from IEA (2022), although the subsidy had a decreasing trend from 2018 to 2020, domestic electricity had an increasing demand (Figure 29).
As the subsidy reform was not successful in decreasing the domestic electricity demand, other policies were enacted as incentives and penalties to encourage or persuade households to reduce inefficient electricity use under “Energy Consumption Pattern Reform”. Based on this reform, the Ministry of Energy and the Ministry of Housing and Urban Planning of Iran defined an efficient average electricity consumption per m2. For households exceeding the average energy use pattern, the electricity price would have a 100% increase to further allocate the money to low-income people under the subsidy reform. However, the increasing electricity demand of Iranian households showed that monetary rewards seem unsustainable in terms of changing households’ behaviour in the long term. A study implemented by [75] concluded that increasing fossil fuel prices have little impact on reducing fossil fuel consumption in Iran.
Interestingly, Wang et al. [76] concluded that the energy price had a negligible effect on per capita energy use. Moreover, different studies have highlighted that energy efficiency policies may bring about a rebound effect, which should not be ignored [77]. This can be explained by the crucial role of households’ behaviour on electricity demand, as concluded in this study. Therefore, when considering energy use per capita, it seems necessary for future studies to pay more attention to behavioural aspects of households to change their behaviour while reducing energy use. Unfortunately, the current energy policy gives little attention to behaviour change in households. For instance, in the “Energy balance report” published in 2018, in the section of “Efficiency in energy supply and demand” (p. 63) and subsection of “Building and domestic energy appliance” (p. 67), less attention was paid to energy use behaviour of households. For instance, under the subsection policy of “Optimisation of supply and distribution of energy and environmentally friendly technologies”, it proposed solutions to prevent power plants’ supply limitations. In addition, it developed proposals for overcoming the summer peak of 2018 and informed the power plants about the proposals. However, it was more related to power plant capacity increase rather than the behaviour, which is concluded to have a significant effect on electricity use in Iran. Moreover, under the policy of load management of the demand side (p. 73), the Ministry of Energy has paid most of the attention to the industrial, agricultural, and commercial sectors and less to the domestic sector.
The main action implemented by the Ministry of Energy, which was slightly related to behaviour, were the ‘enhancement of efficiency of technical room, replacement of heating and cooling appliances’, and ‘improving materials and infrastructure of the building’ under section 12 of the policy of removal of production barriers in the construction sector. Although under the policy of “Financial support” of “Building and domestic energy appliances”, the Ministry of Energy is providing monetary rewards for the reduction in energy intensity which can be related to behaviour change (e.g., shelters for evaporative coolers, replacing an old refrigerator, washing machine, iron, etc., with high efficiency), it is mostly on the improvements in the building appliances. However, there is less broad education for households in this regard.
Despite the existing challenges regarding the removal of energy subsidies, some developing countries have proposed solutions to reduce electricity consumption instead of increasing the electricity price. For instance, several incentives for renewable energies were offered as priority policies in African and Latin American countries to decouple economic growth and carbon emissions [78]. As a result, to address the issue of high electricity demand at an affordable price, they suggested supporting the use of energy efficient equipment together with education initiatives on efficient use of energy and appliances [79]. Moreover, some countries have made a lot of progress in managing the political challenges of the subsidy reform. For instance, in Kenya, a gradual approach was employed to eliminate the subsidy over the course of nearly eight years through a combination of tariff increases and reductions in technical losses [80]. This can be a very feasible approach for Iran where an initial price spike and inflation occurred after implementing subsidy reform. In Ghana and Nigeria, a comprehensive public information campaign was created before implementing the subsidy reform. Also, there are some countries which have proposed lifeline tariffs for low-income occupants for a specific amount of energy consumption in a month, such as Uganda and Kenya. Research in the Arab world showed that transforming the reform of domestic energy prices to a set of effective mitigation measures can create opportunities for the government to lower the socio-economic cost of subsidy reforms. This can protect low-income occupants from an erosion of their incomes, while raising public acceptance of pricing reforms effectively [81]. Similarly to Iran, Gulf states are one of the highest in terms of per capita living standards. To address high electricity consumption, some Gulf states have been trying to raise electricity prices and increase income subsidies, which can be an option in reducing their growth of electricity consumption.
Another attempt to reduce electricity consumption is proposing effective solutions in terms of behaviour change interventions to motivate occupants towards energy efficiency rather than removing the subsidy. In this regard, different approaches have been implemented to reduce energy use, namely behaviour change interventions and behaviour prediction models. However, previous research concluded that further improvements are required to achieve a better solution in terms of interventions. According to Santangelo and Tondelli (2017) [62], three important solutions are necessary to reduce electricity use. In the first step, the occupants’ awareness needs to be increased. A study conducted in Qatar [15] suggested user education, engagement, and awareness to be effective solutions for domestic energy conservation. In another study conducted by Oryani et al. (2022) [24], the need for a rise in public environmental awareness as well as diversifying the energy mix in Iran were highlighted as important solutions. Although under the education and awareness policy, there is a defined section for educating housewives in terms of the culture of correct energy use, it has not been practically implemented in Iran. Moreover, in terms of behaviour prediction models, inflexibility in behaviour predictions was seen [65], which necessitates further investigations regarding household behaviour variations and everyday habits. Nowadays, paying attention to consumer behaviour for energy prediction models is becoming increasingly important for researchers [65,82,83,84]. The second important factor is to understand their motivation towards energy conservation. Lastly, the feasibility of energy-efficient behaviour needs to be achieved. It should be noted that energy use behaviour change is a multi-dimensional factor that not only includes psychological and socio-cultural aspects to understand the way occupants think about and use energy [85,86] but also implies further consideration of physical, cognitive, emotional, personalised, and habitual aspects of the behaviour to achieve more feasible energy policies in Iran.

5. Conclusions and Prospects

This study endeavoured to explore the driving factors affecting fossil fuel reliance and its correlation to households’ behaviour towards the increasing trend in total and per capita electricity use in the domestic sector on a global and local scale. In the global context, this study revealed that due to the energy subsidy, the oil-rich countries’ reliance on fossil fuels increased over the years while developed countries grew their investments in renewable energies. This, in turn has significantly affected oil-rich countries, such as Iran, in terms of their domestic electricity demand, resulting in a more inefficient use of electricity, which was mostly related to households’ behaviour. In the local context, the trend and tendency of electricity use in the domestic sector were analysed to understand the outcomes of the energy subsidy in Iran. Findings showed an increasing trend towards electricity generation from fossil fuels over the years, affecting households’ inefficient energy use behaviour. However, in countries such as Denmark, the electricity price has contributed as an intervention in households’ increasing electricity consumption behaviour, while the energy subsidy in oil-rich countries acted as an encouragement for households’ domestic electricity use.
In addition, this study explored the climatic and non-climatic factors affecting domestic electricity use by comparing several provinces of Iran to explore crucial behavioural factors regarding high domestic electricity use per capita. The results revealed that not only does Tehran have higher electricity consumption due to more subscribers than other provinces in Iran, but the households’ electricity use per capita was also affected by behavioural issues. After comparing Tehran with Isfahan and Khuzestan, results showed that the high electricity use per capita in Tehran mainly was due to house size, heated or cooled area percentage of space, and household size. Interestingly, although Isfahan and Khuzestan have higher temperatures during summer, their electricity use behaviour seems more efficient than in Tehran.
It is worth mentioning that the aim of this study is to investigate the important factors which have affected energy consumption of residential buildings in Iran and to compare Iran with other developed countries with high energy costs. Although there are studies and available data regarding the high energy use in Iran, there is a lack of research to compare the main factors contributing to Iran and other countries’ electricity consumption. Therefore, to answer this important question, the authors needed to explore the important differences between countries with low electricity use and countries with high electricity use and whether this high electricity use can be related to the per capita usage or not. After studying different countries’ electricity consumption, this study found that the energy subsidy can play a crucial role in oil-rich countries’ high electricity use in residential buildings. However, this was not enough to conclude that the removal of the energy subsidy is the only way to overcome this situation. This has also been highlighted by previous researchers in the field of economy. For instance, various oil-rich countries have started to develop their own sustainability assessment systems to rate their residential buildings based on their efficiency. Therefore, removing the fossil fuel subsidy alone may not address the issues with which the oil-rich countries are struggling, due to lower income occupants. Moreover, as indicated previously, the removal of the energy subsidy can only be effective in the short term, due to the increasing electricity usage per capita. This electricity usage per capita can be explained by occupants’ behaviour. Therefore, a question may arise regarding new solutions proposed based on the investigation of aspects affecting human behaviour. This can create opportunities for policy makers to include occupants’ energy behaviour in their policy enactment, to reduce their electricity consumption in the domestic sector. To further understand the effect of energy subsidies in other oil-rich countries, future studies might be beneficial to investigate the solutions proposed by some of the oil-rich countries to reduce electricity use.
Therefore, after studying the electricity usage per capita in countries with or without an energy subsidy, it was revealed that high per capita electricity usage in most countries is due to occupants’ behaviour and there are several important factors affecting this behaviour in various ways. The high electricity usage per capita can be explained by climatic factors and non-climatic factors. The former may not provide effective solutions because the occupants have minimal expectation from their living environments due to comfort. However, non-climatic factors can shed light on one of the important solutions to be considered in future policies (e.g., different electricity prices based on different house or household sizes).
The results of the study could shed light on the issues that oil-rich countries have faced due to energy subsidy allocation to electricity generation from fossil fuels. Raising the awareness of energy practitioners, policymakers, and designers regarding the important causes of the increase in the domestic electricity demand issues faced by oil-rich countries and Iran could encourage future studies to consider behavioural factors in energy policies. This can also lead to more practical solutions for reducing fossil fuel consumption while reducing the domestic electricity use per capita in Iran and other oil-rich countries.

Author Contributions

D.F. led overall research activities, conceptualisation, methodology, literature review, formal analysis, research outcomes and manuscript drafting; M.N. contributed to principal research supervision and refinement of manuscript development; and H.D. contributed to partial research supervision. All authors have read and agreed to the published version of the manuscript.

Funding

This research received no external funding.

Institutional Review Board Statement

Not applicable.

Informed Consent Statement

Not applicable.

Acknowledgments

The authors would like to express their sincere gratitude to the Melbourne School of Design, Faculty of Architecture, Building and Planning, The University of Melbourne, for providing access to the facilities required for this research activity and a full PhD scholarship given to the first author of this paper.

Conflicts of Interest

The authors declare no conflict of interest.

References

  1. Intergovernmental Panel on Climate Change. IPCC First Assessment Report; WMO: Geneva, Switzerland, 1990.
  2. IPCC. Climate Change Fifth Assessment Report; WMO: Geneva, Switzerland, 2014; p. 4.
  3. Bouckaert, S.; Pales, A.F.; McGlade, C.; Remme, U.; Wanner, B.; Varro, L.; D’Ambrosio, D.; Spencer, T. Net Zero by 2050: A Roadmap for the Global Energy Sector; IEA: Paris, France, 2021.
  4. World Resources Institute. 2020. Available online: https://www.wri.org/data/climate-watch-cait-country-greenhouse-gas-emissions-data (accessed on 10 March 2022).
  5. IPCC. Global Warming of 1.5 °C: An IPCC Special Report on the Impacts of Global Warming; Intergovernmental Panel on Climate Change: Geneva, Switzerland, 2018.
  6. Aryanpur, V.; Ghahremani, M.; Mamipour, S.; Fattahi, M.; Gallachóir, B.Ó.; Bazilian, M.D.; Glynn, J. Ex-post analysis of energy subsidy removal through integrated energy systems modelling. Renew. Sustain. Energy Rev. 2022, 158, 112116. [Google Scholar] [CrossRef]
  7. Solaymani, S.; Kardooni, R.; Kari, F.; Yusoff, S.B. Economic and environmental impacts of energy subsidy reform and oil price shock on the Malaysian transport sector. Travel Behav. Soc. 2015, 2, 65–77. [Google Scholar] [CrossRef]
  8. Solaymani, S. Energy subsidy reform evaluation research—Reviews in Iran. Greenh. Gases Sci. Technol. 2021, 11, 520–538. [Google Scholar] [CrossRef]
  9. Solaymani, S. A Review on Energy and Renewable Energy Policies in Iran. Sustainability 2021, 13, 7328. [Google Scholar] [CrossRef]
  10. Ouyang, X.; Lin, B. Impacts of increasing renewable energy subsidies and phasing out fossil fuel subsidies in China. Renew. Sustain. Energy Rev. 2014, 37, 933–942. [Google Scholar] [CrossRef]
  11. IEA. World Energy Outlook 2017 Executive Summary; Energy Policy; IEA: Paris, France, 2017; p. 90024-4.
  12. OECD. Improving the Environment through Reducing Subsidies; Organisation for Economic Cooperation and Development: Paris, France, 1999; Volume 1–3. [Google Scholar]
  13. OECD. Reforming Energy and Transport Subsidies: Environmental and Economic Implications; Organisation for Economic Cooperation and Development: Paris, France, 1997. [Google Scholar]
  14. Burniaux, J.-M.; Martin, J.P.; Oliveira-Martins, J. The Effect of Existing Distortions in Energy Markets on the Costs of Policies to Reduce CO2 Emissions: Evidence from GREEN; the Economic Costs of Reducing CO2 Emissions (OECD Economic Studies No 19); Organisation for Economic Cooperation and Development: Paris, France, 1992. [Google Scholar]
  15. Al-Marri, W.; Al-Habaibeh, A.; Watkins, M. An investigation into domestic energy consumption behaviour and public awareness of renewable energy in Qatar. Sustain. Cities Soc. 2018, 41, 639–646. [Google Scholar] [CrossRef]
  16. El-Katiri, L.; Fattouh, B. A Brief Political Economy of Energy Subsidies in the Middle East and North Africa, International Development Policy. Rev. Int. Polit. Développement 2017, 7, 58–87. [Google Scholar]
  17. Verme, P. Subsidy Reforms in the Middle East and North Africa region: A review. In The Quest for Subsidy Reforms in the Middle East and North Africa Region; Springer: Cham, Switzerland, 2017; pp. 3–31. [Google Scholar]
  18. Clements, M.B.J.; Coady, M.D.; Fabrizio, M.S.; Gupta, M.S.; Alleyne, M.T.S.C.; Sdralevich, M.C.A. Energy Subsidy Reform: Lessons and Implications; International Monetary Fund: Washington, DC, USA, 2013. [Google Scholar]
  19. Moerenhout, T.; Irschlinger, T. Exploring the Trade Impacts of Fossil Fuel Subsidies; International Institute for Sustainable Development: Winnipeg, MB, Canada, 2020. [Google Scholar]
  20. Sun, C. An empirical case study about the reform of tiered pricing for household electricity in China. Appl. Energy 2015, 160, 383–389. [Google Scholar] [CrossRef]
  21. Dube, I. Impact of energy subsidies on energy consumption and supply in Zimbabwe. Do the urban poor really benefit? Energy Policy 2003, 31, 1635–1645. [Google Scholar] [CrossRef]
  22. Adom, P.K.; Adams, S. Energy savings in Nigeria. Is there a way of escape from energy inefficiency? Renew. Sustain. Energy Rev. 2018, 81, 2421–2430. [Google Scholar] [CrossRef]
  23. Fattouh, B.; El-Katiri, L. Energy subsidies in the Middle East and North Africa. Energy Strategy Rev. 2013, 2, 108–115. [Google Scholar] [CrossRef]
  24. Oryani, B.; Kamyab, H.; Moridiаn, А.; Azizi, Z.; Rezania, S.; Chelliapan, S. Does structural change boost the energy demand in a fossil fuel-driven economy? New evidence from Iran. Energy 2022, 254, 124391. [Google Scholar] [CrossRef]
  25. Charap, M.J.; da Silva, M.A.R.; Rodriguez, M.P.C. Energy Subsidies and Energy Consumption: A Cross-Country Analysis; International Monetary Fund: Washington, DC, USA, 2013. [Google Scholar]
  26. Al Iriani, M.A.; Trabelsi, M. The economic impact of phasing out energy consumption subsidies in GCC countries. J. Econ. Bus. 2016, 87, 35–49. [Google Scholar] [CrossRef]
  27. Mousavi, B.; Lopez, N.S.A.; Biona, J.B.M.; Chiu, A.S.; Blesl, M. Driving forces of Iran’s CO2 emissions from energy consumption: An LMDI decomposition approach. Appl. Energy 2017, 206, 804–814. [Google Scholar] [CrossRef]
  28. Gazder, U. Energy Consumption Trends in Energy Scarce and Rich Countries: Comparative Study for Pakistan and Saudi Arabia. E3S Web Conf. 2017, 23, 7002. [Google Scholar] [CrossRef]
  29. Gangopadhyay, S.; Ramaswami, B.; Wadhwa, W. Reducing subsidies on household fuels in India: How will it affect the poor? Energy Policy 2005, 33, 2326–2336. [Google Scholar] [CrossRef]
  30. IEA. Fossil Fuel Subsidies Database. 2021. Available online: https://www.iea.org/data-and-statistics/data-product/fossil-fuel-subsidies-database (accessed on 10 March 2022).
  31. IEA. World Energy Balances. 2021. Available online: https://www.iea.org/reports/world-energy-balances-overview (accessed on 8 March 2022).
  32. IEA. Data and Statistics. 2021. Available online: https://www.iea.org/data-and-statistics/data-browser/?country=WORLD&fuel=Electricity%20and%20heat&indicator=ElecIndex (accessed on 10 March 2022).
  33. IEA. Value of Fossil-Fuel Subsidies. 2019. Available online: https://www.iea.org/data-and-statistics/charts/value-of-fossil-fuel-subsidies-by-fuel-in-the-top-25-countries-2019 (accessed on 11 March 2022).
  34. The World Bank. Fossil Fuel Energy Consumption. 2010. Available online: https://data.worldbank.org/indicator/EG.USE.COMM.FO.ZS (accessed on 16 March 2022).
  35. The World Bank. WBG—Doing Business; World Bank Publications: Washington, DC, USA, 2019. [Google Scholar]
  36. World Data. Climate. 2021. Available online: https://www.worlddata.info/asia/iran/ (accessed on 5 March 2022).
  37. Our World in Data. Per Capita Electricity Generation from Fossil Fuels. 2021. Available online: https://ourworldindata.org/grapher/fossil-electricity-per-capita. (accessed on 5 March 2022).
  38. Ritchie, H.; Roser, M.; Rosado, P.; CO₂ and Greenhouse Gas Emissions. Our World Data. Available online: https://ourworldindata.org/co2-emissions?utm_source=coast%20reporter&utm_campaign=coast%20reporter%3A%20outbound&utm_medium=referral (accessed on 10 March 2022).
  39. World Economic Outlook Database. 2021. Available online: https://www.imf.org/en/Publications/WEO/weo-database/2021/October (accessed on 4 March 2022).
  40. Global Carbon Project. Supplemental Data of Global Carbon Project 2021(1.0) [Data Set]; Global Carbon Project: Canberra, Australia, 2021; pp. 1–191. [Google Scholar] [CrossRef]
  41. Australian Bureau of Statistics. Census of Population and Housing 2011 and 2016; Australian Bureau of Statistics: Canberra, Australia, 2017.
  42. Qu, L. Families Then & Now: Households and Families; Australian Institute of Family Studies: Melbourne, Australia, 2020.
  43. Statistisches Bundesamt (Destatis). Household Projections in Germany. 2020. Available online: https://www.destatis.de/EN/Themes/Society-Environment/Population/Households-Families/Tables/projection-household.html (accessed on 10 March 2022).
  44. National Statistics Centre of Iran. 2021. Available online: https://www.amar.org.ir/%D8%AF%D8%A7%D8%AF%D9%87%D9%87%D8%A7-%D9%88-%D8%A7%D8%B7%D9%84%D8%A7%D8%B9%D8%A7%D8%AA-%D8%A2%D9%85%D8%A7%D8%B1%DB%8C (accessed on 10 March 2022).
  45. National Statistics Centre of Iran. 2020. Available online: https://www.amar.org.ir/%D9%BE%D8%A7%DB%8C%DA%AF%D8%A7%D9%87-%D9%87%D8%A7-%D9%88-%D8%B3%D8%A7%D9%85%D8%A7%D9%86%D9%87-%D9%87%D8%A7/%D8%B3%D8%B1%DB%8C%D9%87%D8%A7%DB%8C-%D8%B2%D9%85%D8%A7%D9%86%DB%8C/agentType/ViewType/PropertyTypeID/1 (accessed on 4 March 2022).
  46. Plan and Budget Organisation. National Centres for Environmental Information; National Statistics Centre of Iran: Tehran, Iran, 2022. [Google Scholar]
  47. Tavanir Company. Statistics of Iran’s Electricity Industry, Power Distribution Sector in 2020; Deputy of Research and Human Resources; Information and Communication Technology and Statistics Office, Tavanir Company: Tehran, Iran, 2020. [Google Scholar]
  48. Kaygusuz, K. Energy for Sustainable Development: A case of Developing Countries. Renew. Sustain. Energy Rev. 2012, 16, 1116–1126. [Google Scholar] [CrossRef]
  49. Looney, B. BP Statistical Review of World Energy 2021; BP: London, UK, 2020. [Google Scholar]
  50. IEA. Organisation for Economic Co-Operation and Development and International Monetary Fund via United Nations Global SDG Database; IEA: Paris, France, 2020.
  51. Guerrero-Lemus, R.; Shephard, L.E. Current Energy Context in Africa and Latin America. In Low-Carbon Energy in Africa and Latin America; Springer: Cham, Switzerland, 2017; pp. 39–73. [Google Scholar]
  52. IEA. 2020. Available online: https://www.iea.org/data-and-statistics/data-product/world-energy-statistics-and-balances (accessed on 7 March 2022).
  53. IEA. IEA Energy and Carbon Tracker 2020; IEA, Ed.; IEA: Paris, France, 2021.
  54. Ministry of Energy. Energy Balance. 2020. Available online: https://isn.moe.gov.ir/%D8%A8%D8%AE%D8%B4-%D8%A8%D8%B1%D9%82-%D9%88-%D8%A7%D9%86%D8%B1%DA%98%D9%8A/%D8%B9%D9%85%D9%84%D9%83%D8%B1%D8%AF/%D8%AA%D8%B1%D8%A7%D8%B2%D9%86%D8%A7%D9%85%D9%87-%D8%A7%D9%86%D8%B1%DA%98%D9%8A (accessed on 10 March 2022).
  55. Ministry of Energy. Statistics and Information Network. 2021. Available online: https://moe.gov.ir/%D8%A7%D8%B7%D9%84%D8%A7%D8%B9%D8%A7%D8%AA-%D9%88-%D8%A7%D9%85%D8%A7%D8%B1 (accessed on 9 March 2022).
  56. Bierwirth, A.; Thomas, S. Almost Best Friends: Sufficiency and Efficiency; Can Sufficiency Maximise Efficiency Gains in Buildings? In Proceedings of the First Fuel Now: ECEEE 2015 Summer Study, Toulon/Hyères, France, 1–6 June 2015. [Google Scholar]
  57. Stephan, A.; Crawford, R.H. The Relationship between House Size and Life Cycle Energy Demand: Implications for Energy Efficiency Regulations for Buildings. Energy 2016, 116, 1158–1171. [Google Scholar] [CrossRef]
  58. Azizi, M.M. An Analysis on the Relation Between Per Capita Land Uses and City Size in Iran Urban Comprehensive Plans. Honar-Ha-Ye-Ziba 2014, 18, 25–36. [Google Scholar]
  59. Shaari, M.S.; Rahim, H.A.; Rashid, I. Relationship among population, energy consumption and economic growth in Malaysia. Int. J. Soc. Sci. 2013, 13, 39–45. [Google Scholar]
  60. Lee, C.-C.; Chang, C.-P.; Chen, P.-F. Energy-Income Causality in OECD Countries Revisited: The Key Role of Capital Stock. Energy Econ. 2008, 30, 2359–2373. [Google Scholar] [CrossRef]
  61. Bartleet, M.; Gounder, R. Energy consumption and economic growth in New Zealand: Results of trivariate and multivariate models. Energy Policy 2010, 38, 3508–3517. [Google Scholar] [CrossRef]
  62. Batliwala, S.; Reddy, A.K. Energy Consumption and Population. In Population: The Complex Reality; The Royal Society: London, UK, 1994. [Google Scholar]
  63. Santangelo, A.; Tondelli, S. Occupant behaviour and building renovation of the social housing stock: Current and future challenges. Energy Build. 2017, 145, 276–283. [Google Scholar] [CrossRef]
  64. Tavakoli, E.; Nikkhah, A.; Zomorodian, Z.S.; Tahsildoost, M.; Hoonejani, M.R. Estimating the Impact of Occupants’ Behaviour on Energy Consumption by Pls-SEM: A Case Study of Pakdel Residential Complex in Isfahan, Iran. Front. Sustain. Cities 2022, 4, 700090. [Google Scholar] [CrossRef]
  65. Soltani, M.; Rahmani, O.; Ghasimi, D.S.; Ghaderpour, Y.; Pour, A.B.; Misnan, S.H.; Ngah, I. Impact of household demographic characteristics on energy conservation and carbon dioxide emission: Case from Mahabad city, Iran. Energy 2020, 194, 116916. [Google Scholar] [CrossRef]
  66. Sepehr, M.; Eghtedaei, R.; Toolabimoghadam, A.; Noorollahi, Y.; Mohammadi, M. Modeling the electrical energy consumption profile for residential buildings in Iran. Sustain. Cities Soc. 2018, 41, 481–489. [Google Scholar] [CrossRef]
  67. El-Katiri, L.; Husain, M. Prospects for Renewable Energy in GCC States—Opportunities and the Need for Reform; Oxford Institute for Energy Studies: Oxford, UK, 2014. [Google Scholar]
  68. Sdralevich, M.C.A.; Sab, M.; Zouhar, M.Y.; Albertin, M.G. Subsidy Reform in the Middle East and North Africa: Recent Progress and Challenges Ahead; International Monetary Fund: Washington, DC, USA, 2014. [Google Scholar]
  69. Qader, M.R. Electricity Consumption and GHG Emissions in GCC Countries. Energies 2009, 2, 1201–1213. [Google Scholar] [CrossRef]
  70. Riazi, M.; Hosseyni, S. Overview of current energy policy and standards in the building sector in Iran. Sustain. Dev. Plan. V 2011, 150, 189–200. [Google Scholar]
  71. Zhang, M.M.; Zhou, D.Q.; Zhou, P.; Chen, H.T. Optimal design of subsidy to stimulate renewable energy investments: The case of China. Renew. Sustain. Energy Rev. 2017, 71, 873–883. [Google Scholar] [CrossRef]
  72. Liu, W.; Li, H. Improving energy consumption structure: A comprehensive assessment of fossil energy subsidies reform in China. Energy Policy 2011, 39, 4134–4143. [Google Scholar] [CrossRef]
  73. Wang, Q.; Qiu, H.-N.; Kuang, Y. Market-driven energy pricing necessary to ensure China’s power supply. Energy Policy 2009, 37, 2498–2504. [Google Scholar] [CrossRef]
  74. Kalkuhl, M.; Edenhofer, O.; Lessmann, K. Renewable energy subsidies: Second-best policy or fatal aberration for mitigation? Resour. Energy Econ. 2013, 35, 217–234. [Google Scholar] [CrossRef]
  75. Farajzadeh, Z.; Bakhshoodeh, M. Economic and environmental analyses of Iranian energy subsidy reform using Computable General Equilibrium (CGE) model. Energy Sustain. Dev. 2015, 27, 147–154. [Google Scholar] [CrossRef]
  76. Taghvaee, V.M.; Arani, A.A.; Soretz, S.; Agheli, L. Comparing energy efficiency and price policy from a sustainable development perspective: Using fossil fuel demand elasticities in Iran. MRS Energy Sustain. 2022, 1–14. [Google Scholar] [CrossRef]
  77. Wang, Q.; Su, M.; Li, R.; Ponce, P. The effects of energy prices, urbanization and economic growth on energy consumption per capita in 186 countries. J. Clean. Prod. 2019, 225, 1017–1032. [Google Scholar] [CrossRef]
  78. Steren, A.; Rubin, O.D.; Rosenzweig, S. Energy-efficiency policies targeting consumers may not save energy in the long run: A rebound effect that cannot be ignored. Energy Res. Soc. Sci. 2022, 90, 102600. [Google Scholar] [CrossRef]
  79. Butera, F.; Adhikari, R.S.; Caputo, P.; Facchini, A. The Challenge of Energy in Informal Settlements. A Review of the Literature for Latin America and Africa. In Analysis of Energy Consumption and Energy Efficiency in Informal Settlements of Developing Countries; Politecnico di Milano: Milan, Italy; Enel Foundation: Rome, Italy, 2015; pp. 1–32. [Google Scholar]
  80. Alleyne, M.T.S.C.; Hussain, M.M. Energy Subsidy Reform in Sub-Saharan Africa: Experiences and Lessons; International Monetary Fund: Washington, DC, USA, 2013. [Google Scholar]
  81. Fattouh, B.; El-Katiri, L. Energy Subsidies in the Arab World; United Nations Development Programme: New York, NY, USA, 2012. [Google Scholar]
  82. Luh, S.; Kannan, R.; Schmidt, T.J.; Kober, T. Behavior matters: A systematic review of representing consumer mobility choices in energy models. Energy Res. Soc. Sci. 2022, 90, 102596. [Google Scholar] [CrossRef]
  83. Krumm, A.; Süsser, D.; Blechinger, P. Modelling social aspects of the energy transition: What is the current representation of social factors in energy models? Energy 2022, 239, 121706. [Google Scholar] [CrossRef]
  84. Schafer, A. Introducing Behavioral Change in Transportation into Energy/Economy/Environment Models; World Bank Policy, Research Working Paper No. 6234; World Bank Publications: Washington, DC, USA, 2012. [Google Scholar]
  85. He, H.A.; Greenberg, S. Motivating Sustainable Energy Consumption in the Home; University of Calgary: Calgary, AB, Canada, 2008. [Google Scholar]
  86. Harputlugil, T.; de Wilde, P. The interaction between humans and buildings for energy efficiency: A critical review. Energy Res. Soc. Sci. 2021, 71, 101828. [Google Scholar] [CrossRef]
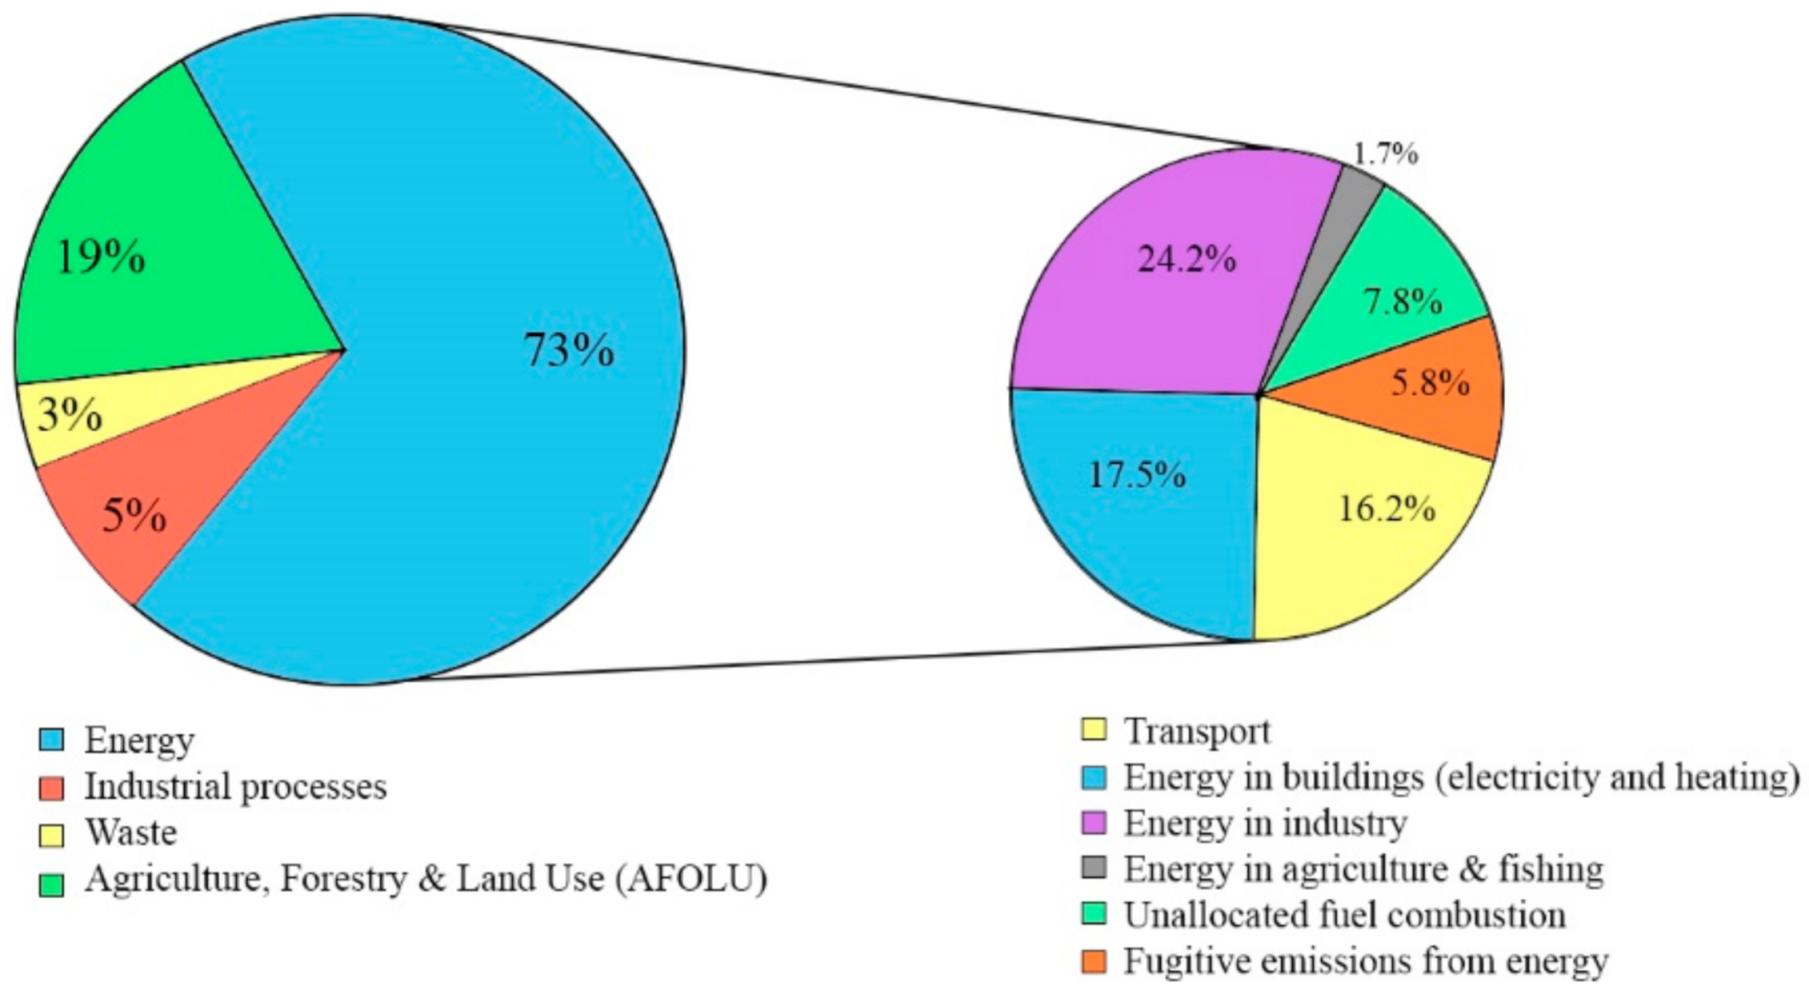
Figure 1. The share of global greenhouse gas emissions (%) from buildings consuming energy worldwide.
Encyclopedia 02 00112 g001
Figure 2. Factors affecting high per capita domestic electricity use in provinces of Iran.
Encyclopedia 02 00112 g002
Figure 3. The energy subsidy of oil-rich countries and Iran by fuel type in 2020 (Data source: [30]).
Encyclopedia 02 00112 g003
Figure 4. Electricity prices in different countries and Iran in 2019 (Data source: [35]).
Encyclopedia 02 00112 g004
Figure 5. CO2 emissions from various resources in Iran [40].
Encyclopedia 02 00112 g005
Figure 6. Primary energy consumption share in Iran, 2019 (Data source: [49]).
Encyclopedia 02 00112 g006
Figure 7. Comparing electricity generated from fossil fuels between countries with low and high electricity prices.
Encyclopedia 02 00112 g007
Figure 8. Electricity use per capita in Australia, Germany, and Iran (kWh).
Encyclopedia 02 00112 g008
Figure 9. Fossil fuel electricity per capita (kWh) of Iran, Australia, and Germany.
Encyclopedia 02 00112 g009
Figure 10. Electricity use per household in Germany versus Iran.
Encyclopedia 02 00112 g010
Figure 11. Subsidy of other countries and Iran per capita in 2020.
Encyclopedia 02 00112 g011
Figure 12. Fossil fuel electricity per capita (kWh) in Belgium and Denmark.
Encyclopedia 02 00112 g012
Figure 13. Fossil fuel electricity per capita (kWh) in Qatar and UAE.
Encyclopedia 02 00112 g013
Figure 14. The rise in end-use electricity and end-use natural gas consumption of occupants in the domestic sector in Iran from 2012 to 2019.
Encyclopedia 02 00112 g014
Figure 15. Electricity consumption by different sectors in Iran.
Encyclopedia 02 00112 g015
Figure 16. The trend in domestic electricity consumption of low and high electricity price countries.
Encyclopedia 02 00112 g016
Figure 17. Domestic electricity consumption per capita in different countries and Iran.
Encyclopedia 02 00112 g017
Figure 18. (A) Electricity demand vs. electricity price in Iran over the years (B) Comparison of electricity demand and price countries with Denmark.
Encyclopedia 02 00112 g018
Figure 19. The portion of energy in living costs of income categories in Iran in 2016.
Encyclopedia 02 00112 g019
Figure 20. Average household size vs. domestic electricity uses in Iran, Germany, and Australia.
Encyclopedia 02 00112 g020
Figure 21. Percentage of household size with type of unit apartments in 2012 vs. 2018 in Iran.
Encyclopedia 02 00112 g021
Figure 22. The comparison between the share of electricity use of provinces in the total consumption of the country vs. the number of household electricity subscribers in 2020.
Encyclopedia 02 00112 g022
Figure 23. Comparison between Tehran and Khuzestan. (A) Monthly highest temperature; (B) electricity use per capita.
Encyclopedia 02 00112 g023
Figure 24. The average area of domestic units being heated or cooled in provinces of Iran in 2018.
Encyclopedia 02 00112 g024
Figure 25. Percentage of units being heated or cooled in provinces of Iran.
Encyclopedia 02 00112 g025
Figure 26. Temperature comparison between Tehran and Isfahan.
Encyclopedia 02 00112 g026
Figure 27. The effect of household size on electricity consumption in Tehran compared to Isfahan.
Encyclopedia 02 00112 g027
Figure 28. The increase in electricity price in Iran (A) and the effect on domestic electricity use per household (B).
Encyclopedia 02 00112 g028
Figure 29. The electricity subsidy for Iran and the effect on domestic electricity consumption.
Encyclopedia 02 00112 g029
Publisher’s Note: MDPI stays neutral with regard to jurisdictional claims in published maps and institutional affiliations.