Article

Development of a Metrological Framework Based on Irradiance and Ventilation for the Characterization and Correction of Low-Cost Radiation Shield Errors

PIMENT Laboratory, University of Reunion Island, 120 Avenue Raymond Barre, 97430 Le Tampon, Reunion, France
*
Author to whom correspondence should be addressed.
Metrology 2026, 6(3), 50; https://doi.org/10.3390/metrology6030050
Submission received: 10 June 2026 / Revised: 21 July 2026 / Accepted: 21 July 2026 / Published: 22 July 2026

Abstract

Low-cost air temperature and relative humidity sensors are increasingly deployed in dense urban monitoring networks for the characterization of urban heat islands and heat exposure. However, measurement accuracy strongly depends on the performance of the radiation shield protecting the sensor from solar heating. This study evaluates five low-cost radiation shield designs, including naturally ventilated, forced-ventilated, spherical, and chimney-type configurations, under tropical outdoor conditions on Reunion Island. Five calibrated SHT31 sensors were deployed simultaneously alongside a reference meteorological station over a five-week measurement campaign. Shield performance was assessed using standard metrological indicators, daytime–nighttime analyses, error distributions, and two-dimensional irradiance–wind diagnostics. Temperature RMSE values ranged from 0.68 to 1.18 °C, while relative humidity RMSE ranged from 2.65 to 7.39%. The forced-ventilated shield provided the best overall temperature performance, whereas the chimney-type design exhibited the largest errors. Combined irradiance–wind analyses showed that measurement errors were primarily governed by the balance between radiative forcing and convective cooling, with maximum temperature biases exceeding 2.5 °C under high-irradiance and low-wind-speed conditions. Based on these findings, several correction approaches were evaluated. A physically interpretable semi-empirical model reduced RMSE by 50%, while a Random Forest model achieved reductions of up to 66%. These results suggest that low-cost meteorological measurements can be substantially improved through appropriate shield design and meteorologically informed calibration procedures, particularly under tropical conditions characterized by strong solar radiation and limited precipitation.

1. Introduction

Urbanization and climate change are intensifying thermal stress in cities worldwide, particularly in tropical regions where high air temperatures and elevated humidity levels combine to increase human discomfort and heat-related health risks [1,2,3]. Urban heat islands and urban overheating are now recognized as major environmental challenges, especially in densely built tropical environments where strong solar radiation, limited ventilation and anthropogenic heat emissions exacerbate local thermal conditions [4,5,6,7]. Understanding these processes requires accurate observations of near-surface air temperature and relative humidity at high spatial and temporal resolutions in order to capture the strong variability of urban microclimates and support the development of effective adaptation strategies [8,9,10,11].
Conventional meteorological networks are generally unable to adequately characterize this variability because professional weather stations remain expensive and sparsely distributed [12,13,14]. Designed primarily for synoptic-scale observations, these stations often fail to resolve the fine-scale thermal contrasts generated by urban morphology, vegetation, land cover and building density [9,15]. Recent advances in Internet of Things (IoT) technologies and low-cost environmental sensors have therefore stimulated the development of dense monitoring networks capable of producing high-resolution meteorological observations at relatively low cost [15,16,17]. Such systems are increasingly used for urban heat island studies, outdoor thermal comfort assessment and citizen-based environmental monitoring [18,19].
Several studies have demonstrated the potential of low-cost meteorological sensors for urban and environmental applications [9,10,15,20,21,22]. However, obtaining accurate air temperature measurements under outdoor conditions remains a major challenge because the measurement quality strongly depends on the performance of the radiation shield protecting the sensor. Radiation shields are intended to minimize direct and indirect radiative heating while maintaining sufficient airflow around the sensing element. In practice, their performance depends on a complex interaction between solar radiation, thermal properties, geometry and ventilation conditions [23,24,25,26,27].
Previous studies have shown that radiation-induced measurement errors can reach several degrees Celsius under unfavorable conditions. Harrison [24] reported significant temperature deviations in naturally ventilated Stevenson screens during periods of weak airflow. Bernard et al. [23] demonstrated that shelter-induced temperature errors are largely governed by shelter radiation sensitivity and thermal response characteristics. More recently, Jin et al. [25] showed that even advanced CFD-optimized naturally ventilated shields may exhibit temperature biases approaching 1 °C under strong radiative forcing. Similar conclusions were reported by Sagova et al. [28], who observed daytime temperature biases reaching 3 °C in low-cost non-aspirated shelters. Collectively, these studies indicate that radiation shield performance is primarily controlled by the balance between radiative heating and convective cooling.
Several approaches have been proposed to mitigate these errors, including mechanically aspirated shields and statistical correction models based on environmental variables such as solar radiation and wind speed [23,28]. Dai et al. [29] combined CFD simulations, field experiments using a fan-aspirated reference shield, and machine-learning correction methods to demonstrate that radiation-induced temperature errors are primarily controlled by the combined effects of solar radiation and airflow conditions. Although aspirated systems generally provide superior performance, they require continuous electrical power, increase maintenance requirements and complicate large-scale deployments [25]. Naturally ventilated low-cost shields therefore remain attractive solutions for dense monitoring networks because of their simplicity, low energy requirements and ease of deployment [30]. However, their metrological performance under realistic outdoor conditions remains insufficiently documented.
This limitation is particularly important in tropical climates. Although large-scale intercomparison campaigns have been conducted under specific environments, such as hot desert conditions in the WMO Ghardaïa experiment [31], field evaluations of low-cost radiation shields under humid tropical conditions remain scarce. Tropical environments combine intense solar radiation, high atmospheric humidity and frequent periods of weak wind speed, creating conditions that are especially challenging for naturally ventilated radiation shields [32]. Under such conditions, excessive radiative heating and insufficient convective cooling may substantially alter the thermal equilibrium of the shelter and increase measurement uncertainty. Nevertheless, most existing evaluations of low-cost meteorological instrumentation have been conducted in temperate climates, laboratory environments or agricultural applications [33,34]. In addition, previous studies generally focus on air temperature alone, whereas the simultaneous impact of shelter design on both air temperature and relative humidity remains comparatively poorly documented despite the critical importance of humidity for thermal comfort and heat-stress assessment [9,35].
A recent review by Abdinoor et al. [33] further highlighted the lack of standardized calibration methodologies, the limited number of outdoor validation studies and the strong heterogeneity of evaluation protocols currently used for low-cost meteorological sensors. More generally, the development of physically meaningful correction approaches for environmental measurements remains closely linked to broader metrological challenges associated with measurement modelling, uncertainty propagation and model validation [36]. These limitations hinder direct comparison between studies and complicate the deployment of reliable dense meteorological observation networks. Furthermore, although previous investigations have identified the importance of radiation and ventilation, relatively few studies have explicitly quantified their combined influence on measurement errors under real outdoor conditions. In particular, the joint dependence of shelter-induced temperature and humidity errors on solar irradiance and wind speed remains poorly characterized, especially in tropical environments.
Addressing these knowledge gaps is essential because measurement biases directly propagate into urban climate analyses, thermal comfort studies and heat-stress assessments. Errors in air temperature and relative humidity measurements may affect the estimation of widely used indicators such as the Heat Index [37], Wet-Bulb Globe Temperature (WBGT) [38] and Universal Thermal Climate Index (UTCI) [39,40]. Improving the characterization of radiation-shield-induced measurement errors is therefore a prerequisite for obtaining reliable observations from dense low-cost meteorological networks.
To address these limitations, this study evaluates five low-cost radiation shield designs deployed alongside a professional meteorological station under tropical outdoor conditions on Reunion Island. Beyond a simple comparison of shelter geometries, the study investigates the physical mechanisms controlling measurement errors through a combined analysis of solar irradiance and wind speed. Particular attention is given to the coupling between temperature and relative humidity errors and to the development of calibration approaches ranging from physically interpretable semi-empirical models to machine-learning techniques. The study addresses three main research questions: (i) Which low-cost radiation shield provides the best agreement with a professional reference station? (ii) How do irradiance and ventilation jointly control temperature and humidity measurement errors? (iii) To what extent can these errors be reduced through calibration procedures? By combining experimental intercomparison, irradiance–ventilation diagnostics and calibration modelling, the proposed framework provides a physically interpretable approach for the characterization and correction of radiation-shield-induced measurement errors in low-cost meteorological observations under tropical conditions.

2. Materials and Methods

The experimental methodology was designed to isolate the influence of radiation shield configurations on air temperature and relative humidity measurements. Five low-cost shelter designs were instrumented with identical thermo-hygrometers and deployed next to a professional meteorological station used as a reference measurement system. The following sections describe the sensor selection procedure, the experimental setup, the meteorological conditions encountered during the campaign, and the statistical methods used for shelter evaluation and calibration.

2.1. Sensor Selection and Validation

Air temperature and relative humidity were measured using Sensirion SHT31 digital thermo-hygrometers (Sensirion AG, Stäfa, Switzerland). This sensor has been widely employed in environmental and urban climate monitoring studies owing to its low power consumption, compact size, fast response time, and good measurement accuracy [20,41,42,43]. In addition, its moderate cost makes it particularly suitable for the deployment of replicated measurement systems and the intercomparison of multiple radiation shield designs.
Table 1 summarizes the main specifications of the SHT31 sensors used in this study.
Prior to deployment, all sensors underwent laboratory validation following the calibration protocol described by [14]. Each sensor was individually compared against reference instrumentation within a climate chamber over a range of controlled temperature and humidity conditions representative of tropical outdoor environments. An additional intercomparison campaign was then conducted by colocating the candidate sensors for a two-week period under identical environmental conditions. Five sensors exhibiting the best agreement were retained for the field experiment. The resulting mean absolute temperature differences between sensors remained below 0.2 °C, confirming the consistency of the selected units. The objective of this preliminary calibration step was to minimize sensor-to-sensor variability and ensure that the observed differences during the outdoor experiment were primarily associated with shelter performance rather than intrinsic sensor offsets.

2.2. Tested Shelter Design

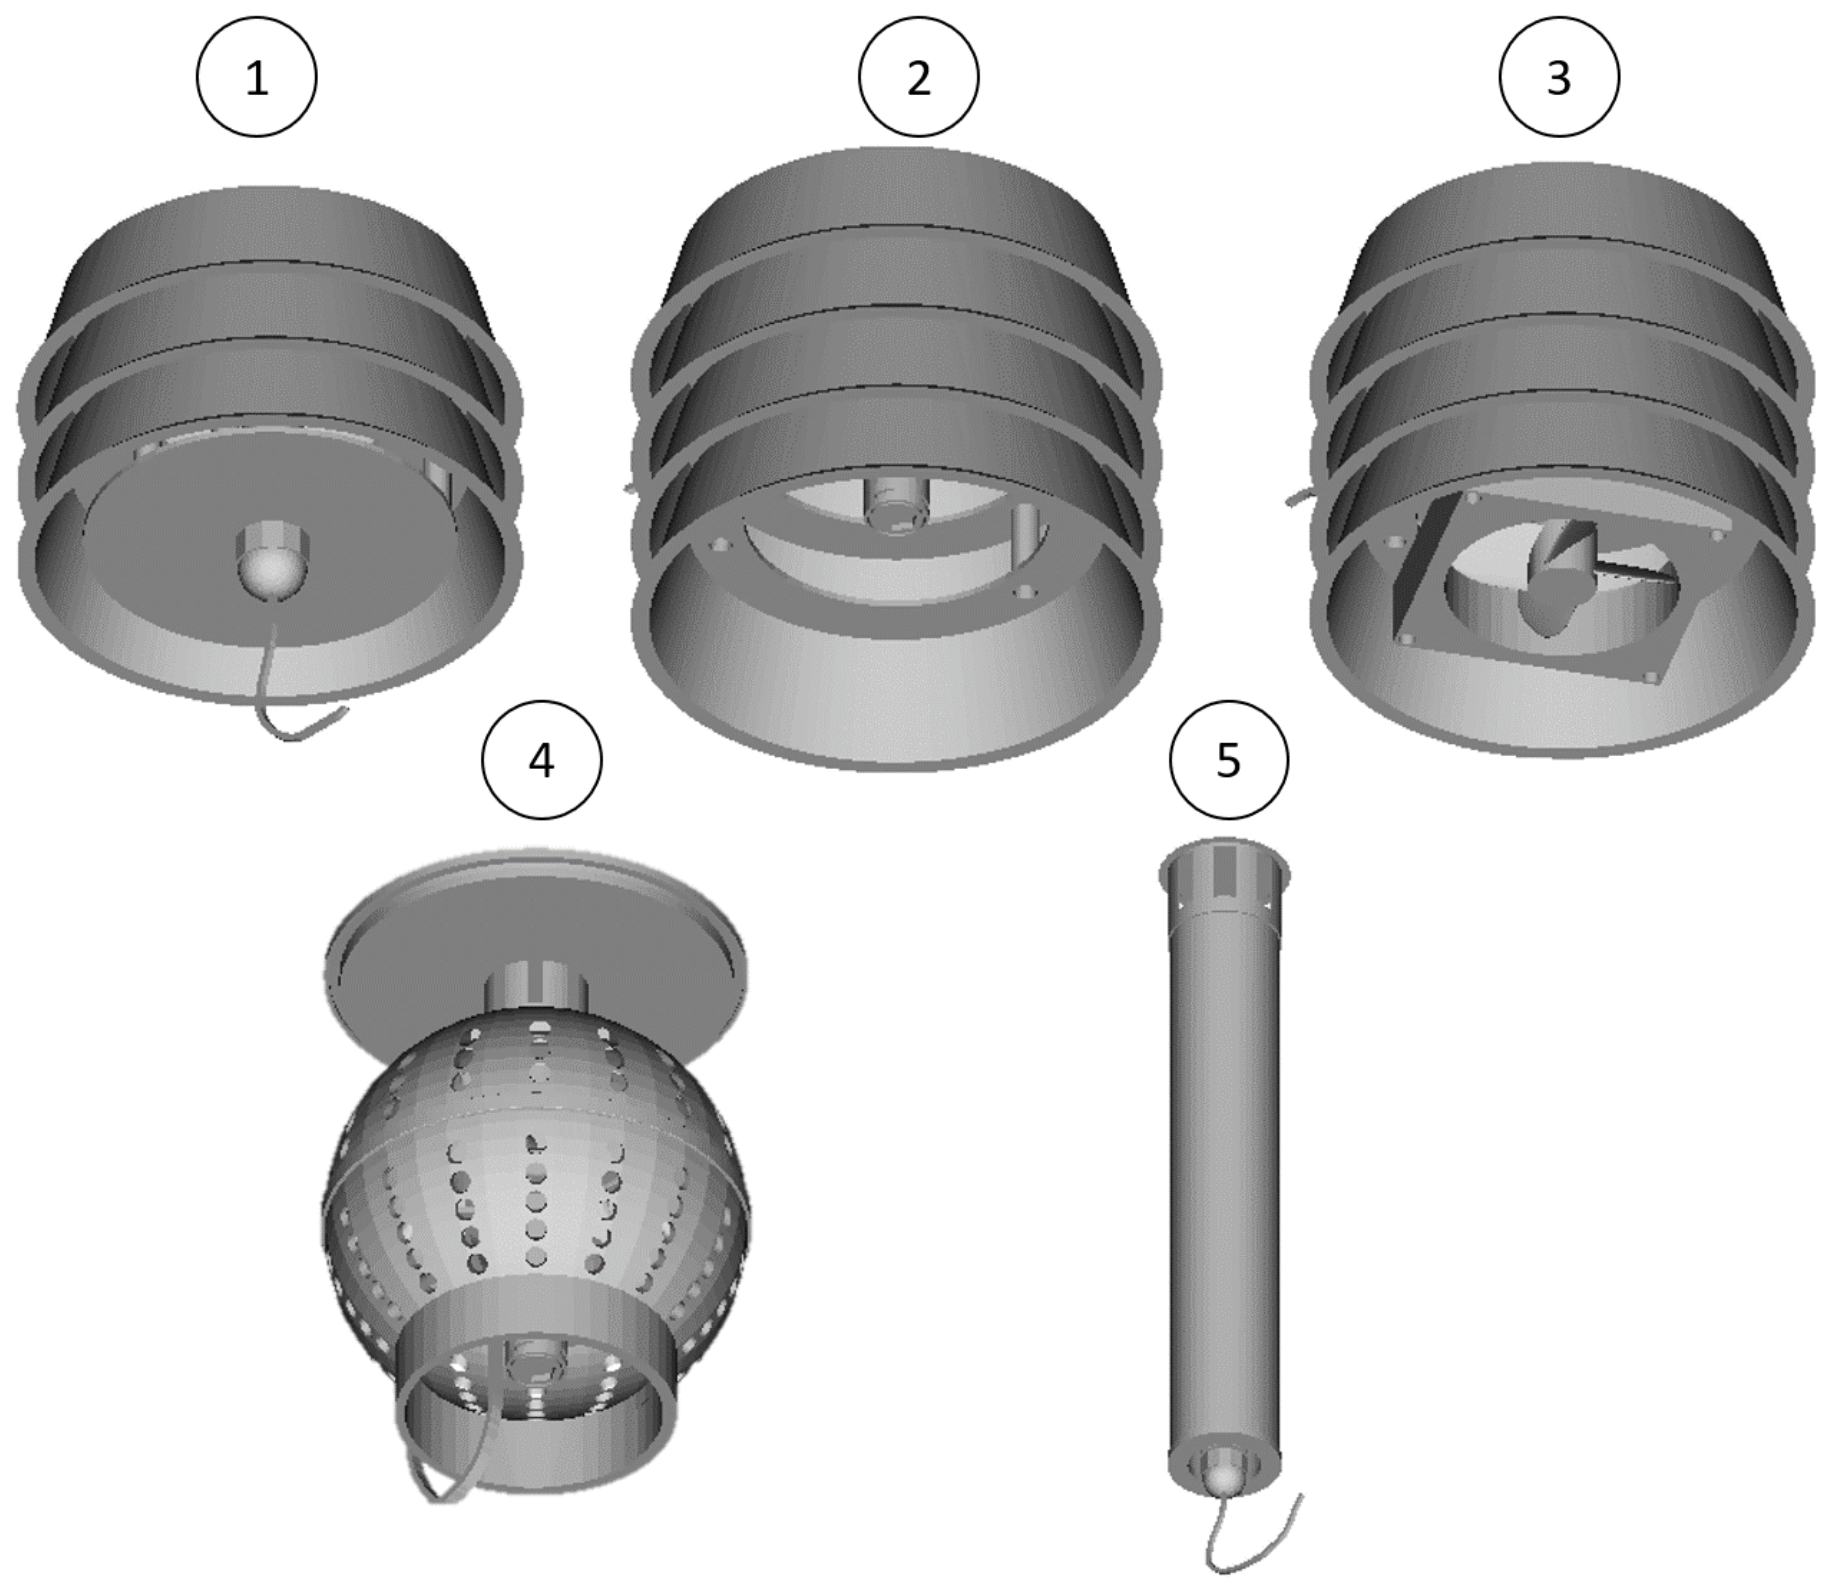
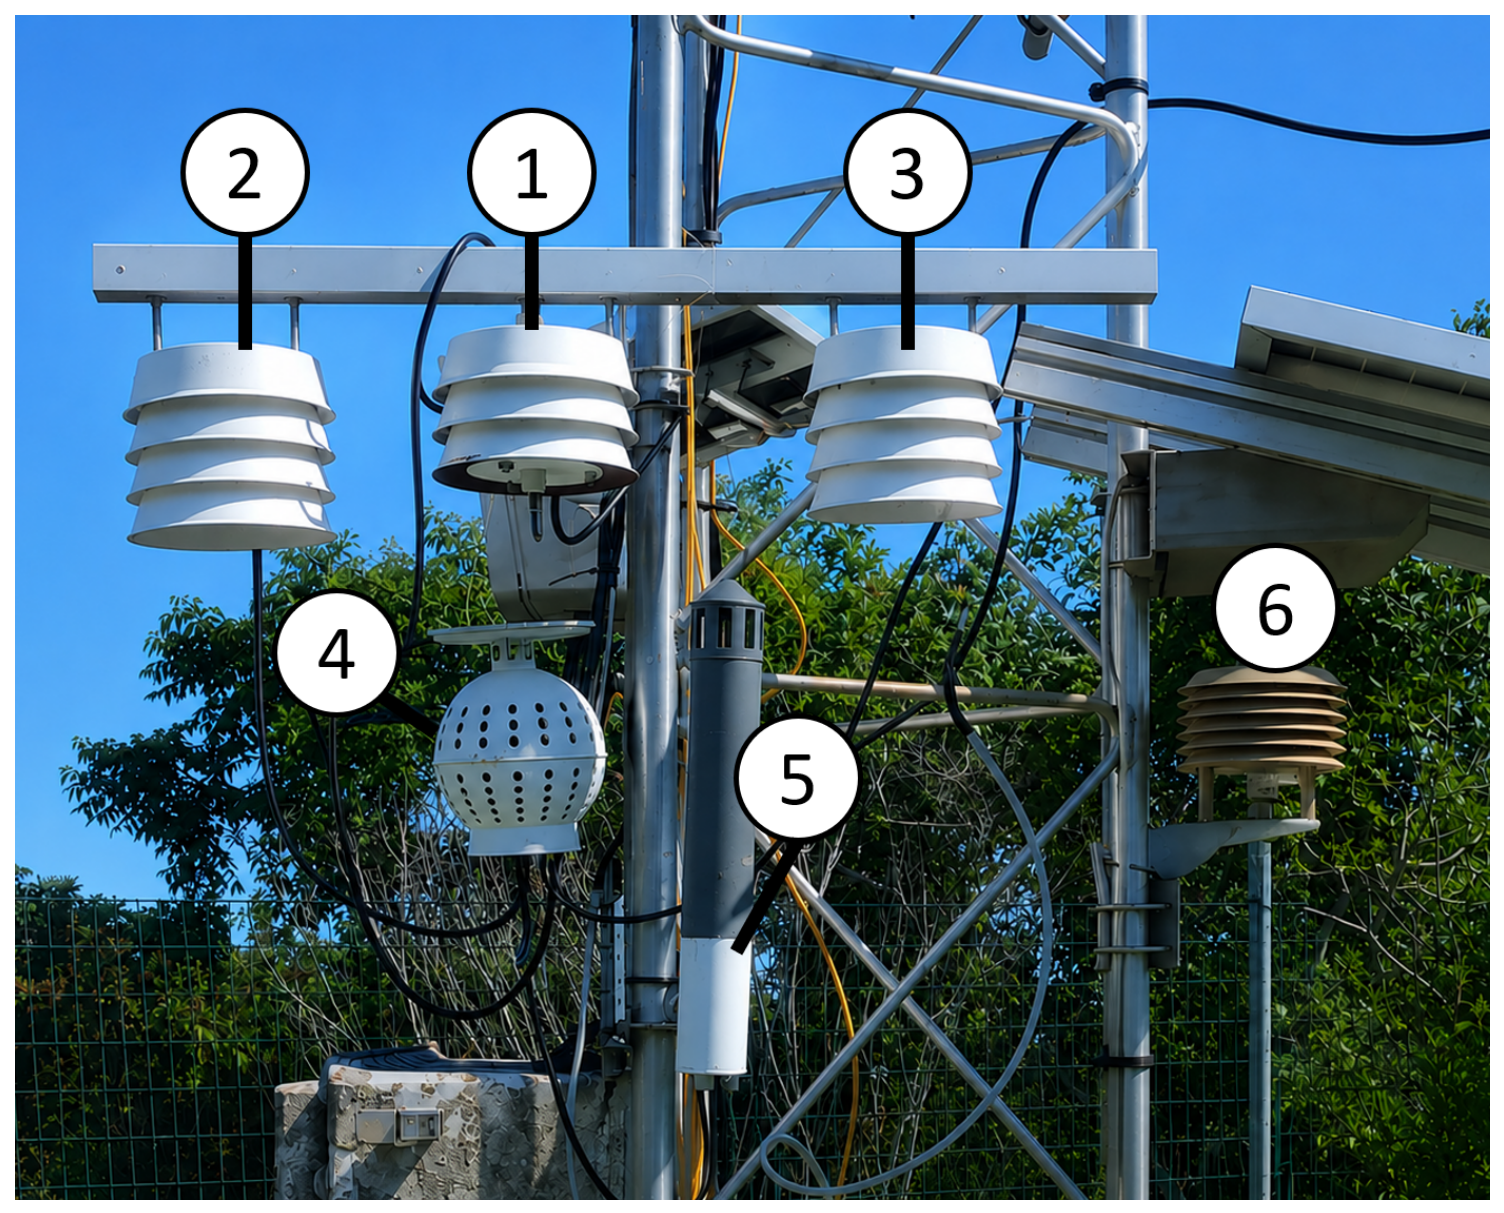
Five low-cost radiation shield configurations were tested in this study (Figure 1). Each shelter was either selected or specifically designed to evaluate a distinct ventilation and radiative protection strategy. The objective was to assess how shelter geometry, material, air circulation pathway, sensor positioning, and active or passive ventilation influence the accuracy of air temperature and relative humidity measurements under tropical outdoor conditions.
Shield 1 corresponds to a very-low-cost radiation shield made from three commercial flower-pot saucers with a nominal diameter of 14 cm. This configuration reproduces the design previously used in [14]. The saucers were painted white in order to increase shortwave reflectance and limit radiative heating of the shelter body. The three plates were separated by 25 mm spacers, following the same assembly principle as in the previous study. Commercial plastic flower-pot saucers are generally made of polypropylene or comparable outdoor-grade plastic materials, selected for their low cost, ease of moulding, light weight, water resistance, and acceptable durability for gardening applications.
In Shield 1, the SHT31 sensor was fixed below the lower saucer using a dedicated 3D-printed holder. This positioning was retained in order to reproduce as closely as possible the configuration previously tested in [14]. It also represents a simple and easily reproducible mounting strategy for low-cost deployments. The design hypothesis behind Shield 1 is based on the classical multi-plate radiation shield principle: the stacked plates block direct solar radiation while allowing ambient air to circulate laterally through the gaps between them. This configuration is simple, inexpensive, easy to reproduce, and potentially suitable for dense low-cost monitoring networks. Its main expected limitation is that the geometry was not originally optimized for meteorological measurements. Air exchange may be reduced under low-wind-speed conditions, and the relatively protected lower cavity may promote heat accumulation around the sensor during periods of high solar radiation. This shelter therefore represents a pragmatic low-cost reference design against which more engineered solutions can be compared.
Shield 2 is a four-plate radiation shield printed in white acrylonitrile styrene acrylate (ASA), with a nominal diameter of 14 cm. The plates were also separated by 25 mm spacers in order to keep a comparable inter-plate distance with Shield 1 while improving control over the geometry. Its design follows the same general multi-plate principle, but 3D printing allows better control of the plate shape, reproducibility, mechanical assembly, and sensor integration. ASA was selected because it offers better resistance to ultraviolet radiation and outdoor weathering than standard PLA, while maintaining adequate mechanical stability for long-term outdoor deployment. The white colour was chosen to increase shortwave reflectance and reduce radiative heating of the shelter body.
Compared with Shield 1, Shield 2 includes an additional plate and a more controlled internal geometry. The four-plate configuration was chosen to increase the number of radiative barriers between the sensing element and the external environment, particularly against direct and reflected shortwave radiation. This additional plate also provides a more protected upper mounting volume for the sensor and creates a geometry compatible with the forced-ventilation version tested in Shield 3. In Shield 2, the SHT31 sensor was therefore suspended from the upper part of the shelter and positioned inside the shield cavity. This sensor placement differs from Shield 1, but was intentionally adopted to make Shield 2 directly comparable with Shield 3. Indeed, because the forced-ventilated design requires the fan to be installed at the bottom of the shield, the sensing element must be placed above the fan, within the ventilated internal air volume. Using the same sensor position in Shields 2 and 3 ensures that the comparison between the naturally ventilated and forced-ventilated ASA shelters is primarily controlled by the presence or absence of active airflow, rather than by a difference in sensor location. Consequently, the comparison between Shields 2 and 3 provides the most rigorous assessment of the isolated contribution of forced ventilation within the present experimental design.
The design hypothesis of Shield 2 is that a controlled 3D-printed multi-plate geometry should improve repeatability and reduce construction variability compared with a shelter assembled from commercial saucers. The stacked plates reduce radiative exposure, while the lateral openings maintain natural ventilation around the sensor. The internal sensor placement is intended to protect the sensing element from direct rain and direct radiation while allowing air exchange through the inter-plate openings. This design therefore aims to balance radiative protection, passive airflow, and compatibility with an actively ventilated configuration. Its expected weakness remains its dependence on ambient wind speed: under calm conditions, natural ventilation may be insufficient to evacuate heat stored by the shield structure.
Shield 3 uses the same four-plate ASA geometry as Shield 2, but includes a small 12 VDC fan to provide forced ventilation. This configuration was designed to isolate the effect of active airflow from the effect of shelter geometry, since Shields 2 and 3 share the same external structure, material, plate spacing, and sensor positioning. The fan was installed at the bottom of the shelter for two main reasons. First, this position allows the fan to draw or push ambient air from an open lower volume, ensuring a direct supply of external air and limiting recirculation within the shield. Second, placing the fan below the shelter allows it to remain protected by the overlying plates from direct rainfall and solar exposure, while keeping the lower air inlet as unobstructed as possible. The SHT31 sensor was consequently fixed from the upper part of the shelter and positioned inside the main airflow path generated by the fan.
This configuration provides a controlled comparison with Shield 2: both shelters have the same geometry and sensor location, while only the ventilation mode differs. The design hypothesis of Shield 3 is that forced ventilation should significantly reduce radiation-induced temperature bias, especially during daytime periods characterized by high solar irradiance and low ambient wind speed. By increasing convective heat transfer and reducing the residence time of air around the sensing element, the fan limits the warming of the internal air volume and improves the coupling between the sensor and the external ambient air. This configuration is expected to provide the best thermal performance among the tested designs. However, it introduces additional constraints in terms of power consumption, mechanical reliability, maintenance, vulnerability of moving parts, and long-term suitability for autonomous dense sensor networks. Shield 3 therefore represents a performance-oriented reference configuration rather than the simplest operational low-cost solution.
Shield 4 is a new spherical radiation shield specifically developed for this study. Its design departs from the classical stacked-plate configuration and explores a more compact three-dimensional airflow geometry. The shelter is composed of five main parts: a lower section, a central belt, a sensor holder, an upper section, and a roof. The lower section allows air intake through a basal opening and through additional holes inclined at 45°. These inclined perforations were designed to promote air entry while reducing the risk of rainwater intrusion during precipitation events. The central belt connects the lower and upper hemispherical parts using 2 mm insertion slots, ensuring mechanical alignment and assembly stability. The internal holder maintains the SHT31 sensor in a fixed position near the centre of the shelter, away from direct contact with the external wall. The upper section mirrors the lower part and includes an opening at the top to facilitate the evacuation of warm air. Finally, the roof provides additional protection against direct solar radiation and rainfall.
The design hypothesis of Shield 4 is based on a combination of radiative shielding, distributed ventilation, and buoyancy-driven air exchange. The spherical body reduces preferential orientation effects relative to planar or louvered geometries, while the distributed perforations allow air to enter from multiple directions. The lower and upper openings are intended to support vertical air exchange by natural convection: warmer air generated inside the shield can escape through the top opening, while cooler ambient air enters from the lower part. The 45° perforations act as rain-protected ventilation paths and may also reduce direct radiative penetration toward the sensor. This design therefore tests whether a compact spherical geometry can provide efficient radiative protection and ventilation without requiring forced airflow. Its potential limitations are related to possible heat storage in the printed shell, reduced airflow under calm conditions, and the risk that the spherical enclosure may trap warm air if buoyancy-driven ventilation is insufficient.
Shield 5 is a chimney-type shelter made from a 300 mm long PVC tube with a nominal diameter of 40 mm. A 3D-printed cap was added at the top to protect the tube from rainfall. The sensing element is positioned in the lower third of the tube. The lower third of the tube was painted white to reduce local absorption of solar radiation near the sensor, whereas the upper two-thirds were left in the original matte grey colour of the PVC.
The design hypothesis of Shield 5 is based on the chimney effect. Solar heating of the upper grey part of the PVC tube is expected to warm the air column and generate upward buoyancy-driven airflow. This vertical airflow should draw ambient air from the lower part of the tube and evacuate warmer air through the top, thereby increasing passive ventilation around the sensor. The white lower section aims to minimize radiative heating in the immediate vicinity of the sensing element, while the darker upper section is intentionally used to enhance thermal forcing and promote convection. This shelter therefore explores an alternative passive ventilation mechanism, in which controlled solar absorption is used to generate airflow rather than being avoided entirely. The main expected risk is that the same absorbed solar energy may also increase the internal air temperature if the chimney flow is too weak, particularly during low-wind conditions. Therefore, this design provides an interesting test of whether buoyancy-induced ventilation can compensate for additional radiative heating in a low-cost tubular shelter.
Overall, the five tested shelters cover a range of design strategies: a very-low-cost commercial saucer assembly, an optimized 3D-printed naturally ventilated multi-plate shield, an actively ventilated version of the same geometry, a novel spherical naturally ventilated shield, and a tubular chimney-effect shelter. Particular attention was given to sensor positioning in the multi-plate shelters. Shield 1 reproduces the previous low-cost configuration of [14], with the sensor mounted below the lower plate, whereas Shields 2 and 3 use an internal upper-mounted sensor position to ensure a fair comparison between passive and forced ventilation using the same ASA geometry. This experimental comparison allows the influence of material, geometry, passive airflow, forced ventilation, sensor placement, and radiative exposure to be assessed under identical outdoor tropical conditions. It should nevertheless be noted that sensor position itself may influence local airflow patterns, thermal stratification, and heat accumulation inside naturally ventilated shelters. Consequently, the present study should be interpreted as an intercomparison of complete shelter configurations rather than as a strict geometrical comparison isolated from sensor placement effects. Although the influence of sensor location cannot be quantified independently using the present dataset, it is expected to remain secondary compared with the large radiation-induced errors observed under conditions of strong solar irradiance and weak ventilation. However, sensor positioning may contribute to part of the residual performance differences observed between shelters exhibiting otherwise similar geometrical characteristics. A summary of the main characteristics, estimated material costs, and power requirements of the tested shelters is provided in Table 2.

2.3. Set-Up Location and Environment

The experimental campaign was conducted on the University of La Réunion campus located in Le Tampon (21.28° S, 55.52° E), on the southwest Indian Ocean island of La Réunion, France. The study area is characterized by a tropical climate according to the Köppen–Geiger classification [44], with warm temperatures, high relative humidity and strong solar radiation throughout most of the year.
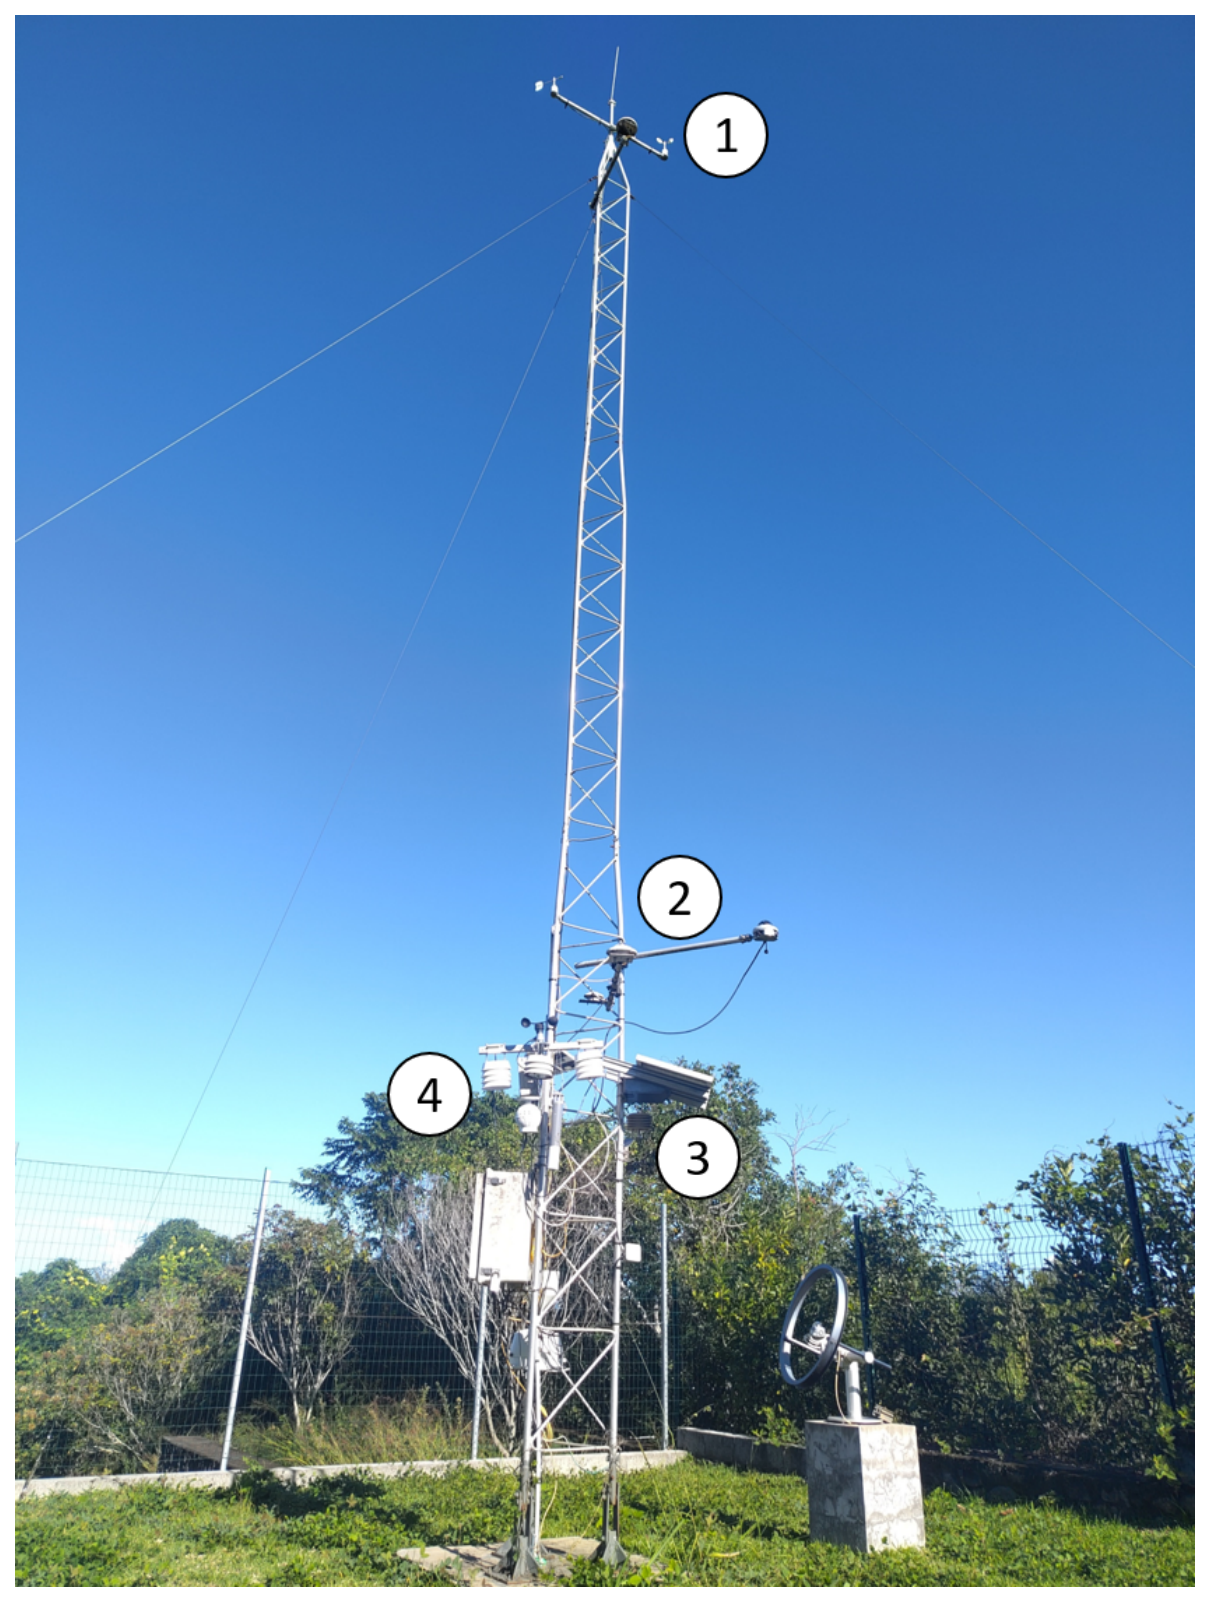
The experiment was carried out in the immediate vicinity of the university meteorological station, which served as the reference measurement system. The station is installed in an open grass-covered area and is equipped with professional meteorological instrumentation, including air temperature and relative humidity sensors, a pyranometer, an anemometer, a rain gauge and a barometric pressure sensor (Figure 2).
Reference air temperature and relative humidity measurements were obtained using a Campbell Scientific 41303-5A (Campbell Scientific, Logan, UT, USA) naturally aspirated six-plate radiation shield equipped with a Campbell Scientific HygroVue5 temperature and relative humidity sensor. The HygroVue5 is a meteorological-grade digital sensor with a specified temperature accuracy of ±0.2 °C over the range 20–60 °C and a relative humidity accuracy of ±1.8% RH over the range 0–80% RH. Particular attention was given to the installation of the reference system. As shown in Figure 2 and Figure 3, the 41303-5A radiation shield was mounted beneath the photovoltaic panel supplying the weather station. Because the photovoltaic panel is permanently oriented toward the north, the reference shield remained shaded throughout the day. This configuration substantially reduced direct solar exposure of the reference sensor and minimized radiation-induced heating of the measurement system. Nevertheless, the reference shield remained a naturally ventilated radiation shield rather than a mechanically aspirated system. Consequently, a small residual radiative bias cannot be completely excluded under conditions of strong solar radiation and weak ambient ventilation [29]. The temperature and relative humidity errors reported in the present study should therefore be interpreted as deviations relative to a professional meteorological reference system with a finite measurement uncertainty rather than as absolute errors relative to an ideal aspirated standard.
The five low-cost radiation shields were installed on a vertical support located on the reference weather station (Figure 3). All sensors were mounted at approximately 2 m above ground level, corresponding to the standard height commonly used for near-surface air temperature and relative humidity measurements [45].
The experimental design follows the general logic of outdoor radiation-shield intercomparison protocols, in which multiple screens are operated simultaneously under the same environmental forcing and compared against a selected working reference [31]. The close proximity between the experimental setup and the reference station ensured that all tested shields were exposed to nearly identical environmental conditions, allowing direct intercomparison between shield designs as well as comparison with professional meteorological observations. The objective of this configuration was to isolate the influence of radiation shield design on temperature and humidity measurements while minimizing spatial variability in the surrounding meteorological conditions.
Data acquisition was performed using an ESP32 microcontroller coupled with a TCA9548A I2C multiplexer and a microSD storage module. This architecture allowed simultaneous acquisition of the five SHT31 sensors despite their identical I2C addresses. The measurement campaign extended from 24 April to 28 May 2026, providing more than one month of observations under a wide range of meteorological conditions. Measurements were recorded at a one-minute interval, resulting in a dataset comprising more than 45,000 synchronized observations for each monitored variable.

2.4. Meteorological Conditions During the Experiment

Table 3 summarizes the main atmospheric variables recorded during the experiment. Air temperature ranged from 13.2 to 29.6 °C, with a mean value of 20.5 °C and a median of 19.9 °C. Relative humidity remained high throughout the campaign, with an average value of 82.8% and a median of 84.2%, reflecting the humid tropical climate of the study site. The 5th and 95th percentiles ranged from 65.8% to 96.8%, respectively. Wind conditions were generally weak, with a mean wind speed of 0.73 m s−1. More than 25% of the observations corresponded to calm conditions, resulting in a median wind speed equal to 0 m s−1. Considering only non-zero wind observations, the median wind speed reached 1.9 m s−1. Such low-ventilation conditions are particularly relevant for evaluating naturally ventilated radiation shields, as radiation-induced measurement biases are known to increase under weak airflow conditions. Global horizontal irradiance (GHI) exhibited strong variability throughout the campaign, ranging from 0 to 1187 W m−2. The overall median irradiance was equal to 0 W m−2 because approximately half of the observations corresponded to nighttime conditions. For daytime periods only, the median irradiance reached 377 W m−2, while the 95th percentile exceeded 800 W m−2. These values indicate that the tested shelters were exposed to intense solar radiation conditions representative of tropical environments. Rainfall remained generally limited during the experiment, with a maximum recorded value of 1.41 mm over the measurement interval, whereas atmospheric pressure remained stable around 998 hPa. Overall, the experimental campaign covered a broad range of environmental conditions, including periods of high solar radiation, elevated humidity, and weak wind speeds. These conditions are particularly suitable for evaluating naturally ventilated radiation shields because radiation-induced errors are expected to be maximized under the combination of strong solar irradiance and weak airflow. However, rainfall remained limited throughout the campaign, and the present results should therefore primarily be interpreted as representative of tropical periods dominated by strong radiative forcing and low precipitation.
The median values of wind speed and global irradiance were equal to zero because a substantial fraction of the dataset corresponded to calm wind conditions and nighttime periods, respectively.

2.5. Statistical Analysis

The performance of each radiation shield was evaluated by comparing temperature and relative humidity measurements against the nearby reference weather station. Following the recommendations of [46], several complementary statistical indicators were used to quantify both systematic and random measurement errors.
For a given variable X, the measurement error was defined as:
Δ X = X shield X ref ,
where X shield corresponds to the measurement obtained from the tested shelter and X ref is the corresponding reference value.
The mean bias error (MBE) was used to quantify systematic overestimation or underestimation:
M B E = 1 n i = 1 n ( X i s h i e l d X i r e f ) .
The mean absolute error (MAE) was used to characterize the average magnitude of the measurement error independently of its sign:
M A E = 1 n i = 1 n X i s h i e l d X i r e f .
The root mean square error (RMSE) was used as the primary indicator of overall measurement performance because it gives greater weight to large deviations:
R M S E = 1 n i = 1 n ( X i s h i e l d X i r e f ) 2 .
The standard deviation of the error distribution ( S D e r r o r ) was also computed to quantify measurement repeatability independently of the mean bias:
S D e r r o r = 1 n 1 i = 1 n ( Δ X i Δ X ¯ ) 2 .
The ability of each shelter to reproduce temporal variability was assessed using the Pearson correlation coefficient (r):
r = i = 1 n ( X i s h i e l d X ¯ s h i e l d ) ( X i r e f X ¯ r e f ) i = 1 n ( X i s h i e l d X ¯ s h i e l d ) 2 i = 1 n ( X i r e f X ¯ r e f ) 2 .
The coefficient of determination ( R 2 ) was additionally computed to evaluate the fraction of variance explained by the tested shelter measurements.
To investigate the physical origin of measurement errors, the dataset was separated into daytime and nighttime periods using a global horizontal irradiance (GHI) threshold of 20 W m−2. Temperature and relative humidity errors were subsequently analysed as a function of solar irradiance, wind speed, time of day, and their combined effects.
Error distributions were examined using boxplots and kernel density estimation (KDE), while two-dimensional irradiance and wind heatmaps were used to characterize the environmental controls of shelter performance. Median values were preferred in the heatmap analysis to reduce the influence of extreme observations and better represent the typical shelter response under each meteorological condition.

2.6. Temperature Error Correction Models

The previous analyses showed that shelter-induced temperature errors mainly result from the balance between radiative heating and convective cooling. Therefore, calibration models were developed to correct the raw temperature measurements using meteorological predictors measured by the reference weather station.
For each shield, the observed temperature error was defined as:
Δ T obs = T shield T ref ,
where T shield is the temperature measured inside the tested radiation shield and T ref is the reference air temperature. The correction models were trained to predict Δ T obs rather than T ref directly. The corrected temperature was then obtained as:
T corr = T shield Δ T ^ ,
where Δ T ^ is the predicted shelter-induced temperature error.
A first correction model was defined as a simple linear regression:
Δ T ^ = a G H I + b U + c ,
where G H I is the global horizontal irradiance (W m−2), U is the wind speed (m s−1), and a, b, and c are fitted coefficients. In this formulation, a represents the sensitivity of the shelter to radiative forcing, b represents the influence of wind-driven convective cooling, and c represents a residual bias independent of the meteorological conditions. This model is highly interpretable, but assumes that the effects of radiation and wind speed are additive and linear.
A second model was formulated using a semi-empirical approach based on the physical balance between radiative heat gain and convective heat removal. Since radiative heat input is expected to increase with G H I , while convective cooling increases with wind speed, the shelter-induced temperature error can be approximated as being proportional to the ratio between irradiance and ventilation. The following model was therefore tested:
Δ T ^ = a G H I U + b + c .
In this equation, parameter a controls the overall conversion of radiative forcing into a temperature error and therefore reflects the combined thermal response of the shelter. Larger values of a indicate a stronger sensitivity of the shelter to radiative loading relative to its cooling capacity. Parameter b represents an effective background ventilation or cooling term. It accounts for residual heat dissipation mechanisms that remain active even under weak wind conditions, such as natural convection, shelter geometry effects, or active ventilation. Finally, c represents a residual temperature bias independent of meteorological forcing.
For model calibration and validation, the complete dataset was divided chronologically into independent training and testing periods in order to preserve the temporal structure of the meteorological time series and avoid information leakage between successive measurements. The first 78.5% of the observations (35,364 one-minute records collected between 24 April and 21 May 2026) were used for model calibration, whereas the remaining 21.5% (9 667 observations collected between 21 May and 28 May 2026) were reserved for independent model evaluation. This chronological split was preferred over a random partition because consecutive meteorological observations exhibit strong temporal autocorrelation and because randomly mixing observations originating from the same meteorological events between training and testing datasets would lead to overly optimistic estimates of predictive performance. The reported validation metrics therefore correspond exclusively to predictions obtained on unseen meteorological conditions occurring after model calibration.
For each shield, the coefficients of the linear and semi-empirical models were estimated exclusively on the training dataset by minimizing the squared difference between the observed and predicted temperature errors:
min i = 1 n Δ T obs , i Δ T ^ i 2 .
In addition to these interpretable models, two more flexible approaches were evaluated: a second-order polynomial regression using G H I and U as predictors, and a Random Forest regression model including G H I , wind speed, relative humidity, local time, and raw shield temperature as input variables. The Random Forest regression was implemented using the RandomForestRegressor class from the scikit-learn library (version 1.7.2) in Python (version 3.10.11). For each shelter, the model consisted of 500 decision trees, with no predefined maximum tree depth. At each split, the number of candidate predictors was set to the square root of the total number of input variables, and a minimum of 10 observations was required in each terminal leaf to limit excessive model complexity. A fixed random seed of 42 was used to ensure reproducibility. No automated grid or randomized hyperparameter search was performed; the same fixed and regularized configuration was applied to all five shelters to ensure a consistent comparison between shelter designs. Model fitting was performed exclusively on the chronological training dataset, and the independent test period was not used for model selection or parameter adjustment. These models were included to assess the potential performance gain associated with nonlinear and interaction-based corrections while preserving an identical temporal training and validation strategy across all correction approaches.

3. Results

3.1. Basic Metrological Characterization

3.1.1. Performance Metrics

The overall metrological performance of the five tested radiation shields was evaluated using the MBE, MAE, RMSE, standard deviation of the error, Pearson correlation coefficient (r), and coefficient of determination ( R 2 ), using the nearby reference weather station as the reference measurement system (Table 4).
For air temperature measurements, all shelters exhibited strong correlations with the reference station, with Pearson correlation coefficients ranging from 0.986 to 0.992 and R 2 values between 0.883 and 0.961. These results indicate that all tested configurations successfully reproduced the temporal variability of ambient air temperature. However, significant differences were observed in terms of measurement accuracy.
The forced-ventilated shield (S3) achieved the lowest RMSE (0.68 °C) despite exhibiting the highest positive mean bias (0.43 °C). This result indicates that active ventilation substantially reduced the variability of the error distribution, producing more stable measurements throughout the campaign. In contrast, the PVC chimney design (S5) exhibited the largest RMSE (1.18 °C) and the highest error variability (σ = 1.16∘C), suggesting that the passive chimney effect was insufficient to compensate for radiation-induced heating under tropical conditions.
Among the naturally ventilated designs, the flower-pot saucer shield (S1) showed the lowest RMSE (0.71 °C), followed by the ASA multi-plate shield (S2, RMSE = 0.82 °C) and the spherical shield (S4, RMSE = 0.92 °C). Although S2 and S4 were specifically designed to improve airflow and radiative protection, their overall performance remained slightly inferior to the simpler saucer-based design.
The humidity measurements exhibited a similar behaviour. Since relative humidity is indirectly affected by temperature errors through the psychrometric relationship, the largest humidity errors were observed for the shelters exhibiting the strongest thermal biases. The saucer shield (S1) presented the largest humidity bias (MBE = −7.0%) and RMSE (7.39%), whereas the ASA-based designs S2 and S3 showed the best overall humidity performance with RMSE values of 2.69% and 2.65%, respectively. These results indicate that improved thermal control directly benefits humidity measurements.

3.1.2. Day/Night Separation

To better understand the physical origin of measurement errors, the dataset was separated into daytime and nighttime periods using a global horizontal irradiance threshold of 20 W m−2. This distinction is particularly relevant because radiation-induced biases are expected to dominate during daytime, whereas shelter thermal inertia and ventilation effects become the main error sources during nighttime.
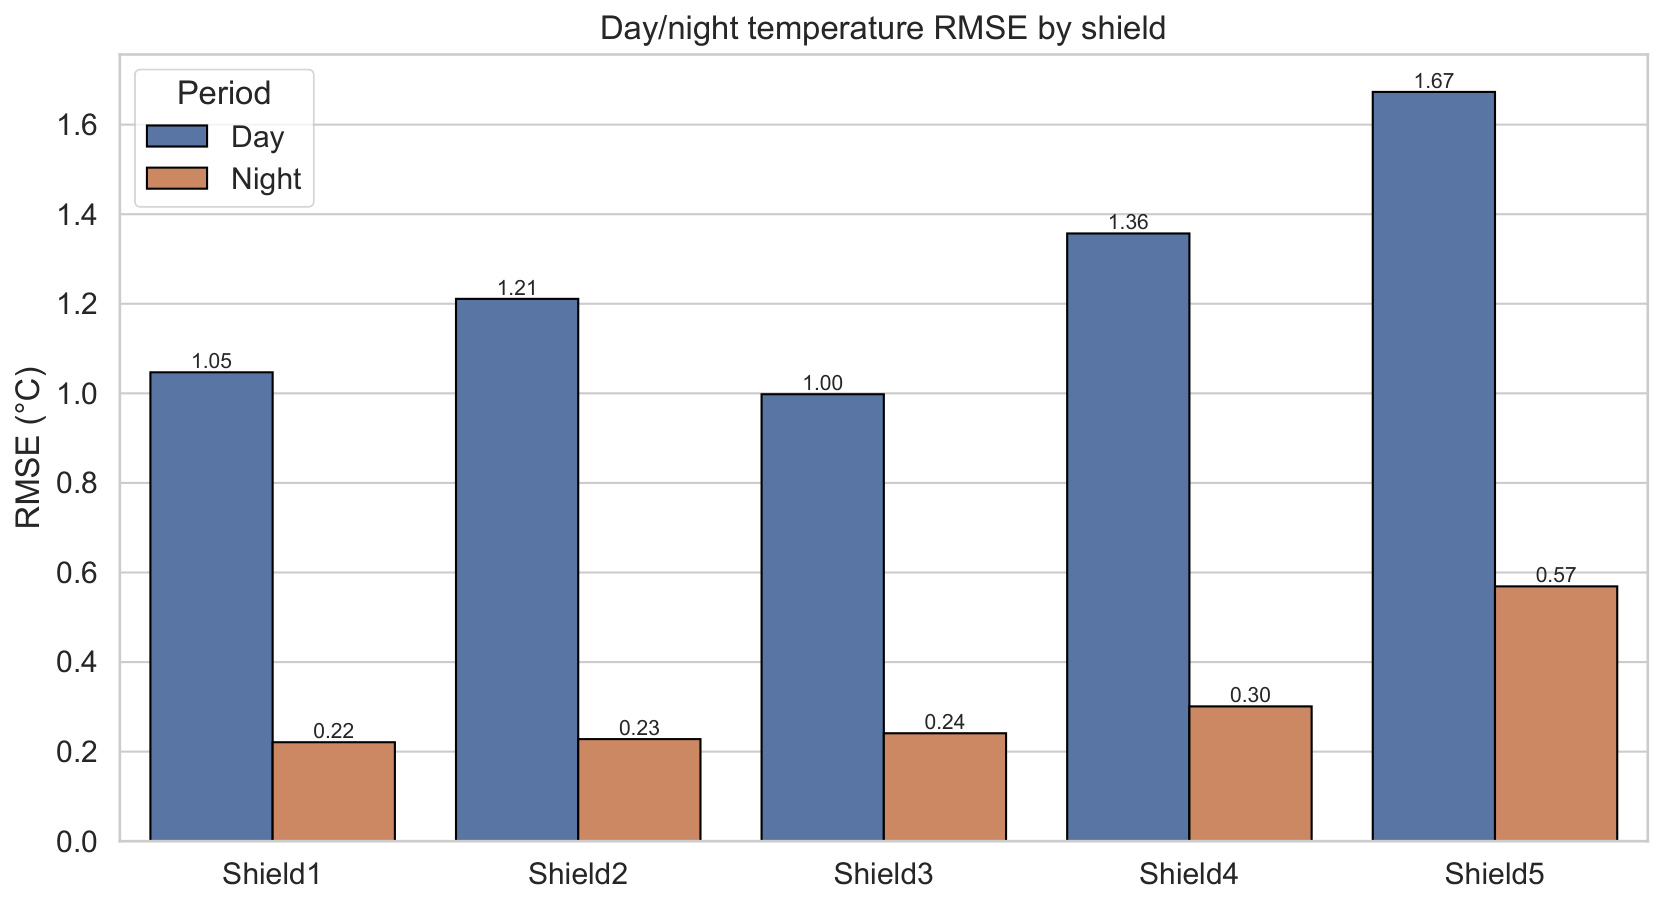
A pronounced contrast between daytime and nighttime performance was observed for all shelters (Figure 4).
During daytime, temperature errors increased substantially for all naturally ventilated shelters. The forced-ventilated ASA shield (S3) achieved the lowest daytime RMSE (1.00 °C), confirming the effectiveness of active airflow in reducing radiative heating of the sensing element. The flower-pot saucer shield (S1) and the ASA passive shield (S2) exhibited intermediate performances, with RMSE values of 1.05 °C and 1.21 °C, respectively. The spherical shield (S4) showed a larger daytime RMSE of 1.36 °C, while the PVC chimney design (S5) performed worst with a daytime RMSE of 1.67 °C.
These results strongly suggest that the additional airflow generated by the fan in S3 effectively mitigated solar radiation errors. In contrast, the chimney-based ventilation strategy implemented in S5 was unable to prevent substantial daytime overheating. The larger daytime bias observed for S5 (MBE = 1.22 °C) further supports this interpretation.
At night, all shelters exhibited a dramatic reduction in error magnitude. RMSE values decreased below 0.30 °C for S1 to S4, indicating that radiative forcing represented the dominant daytime error mechanism. Under these conditions, the differences between the passive designs became negligible. The only exception was S5, which maintained a higher nighttime RMSE (0.57 °C) and a systematic negative bias (−0.52 °C). This behaviour suggests that the PVC tube geometry may have introduced stronger thermal inertia effects than the other shelter configurations.
The day–night comparison therefore clearly demonstrates that solar radiation constitutes the primary source of measurement uncertainty and confirms the benefit of forced ventilation under high-radiation tropical conditions.

3.1.3. Distribution of Errors

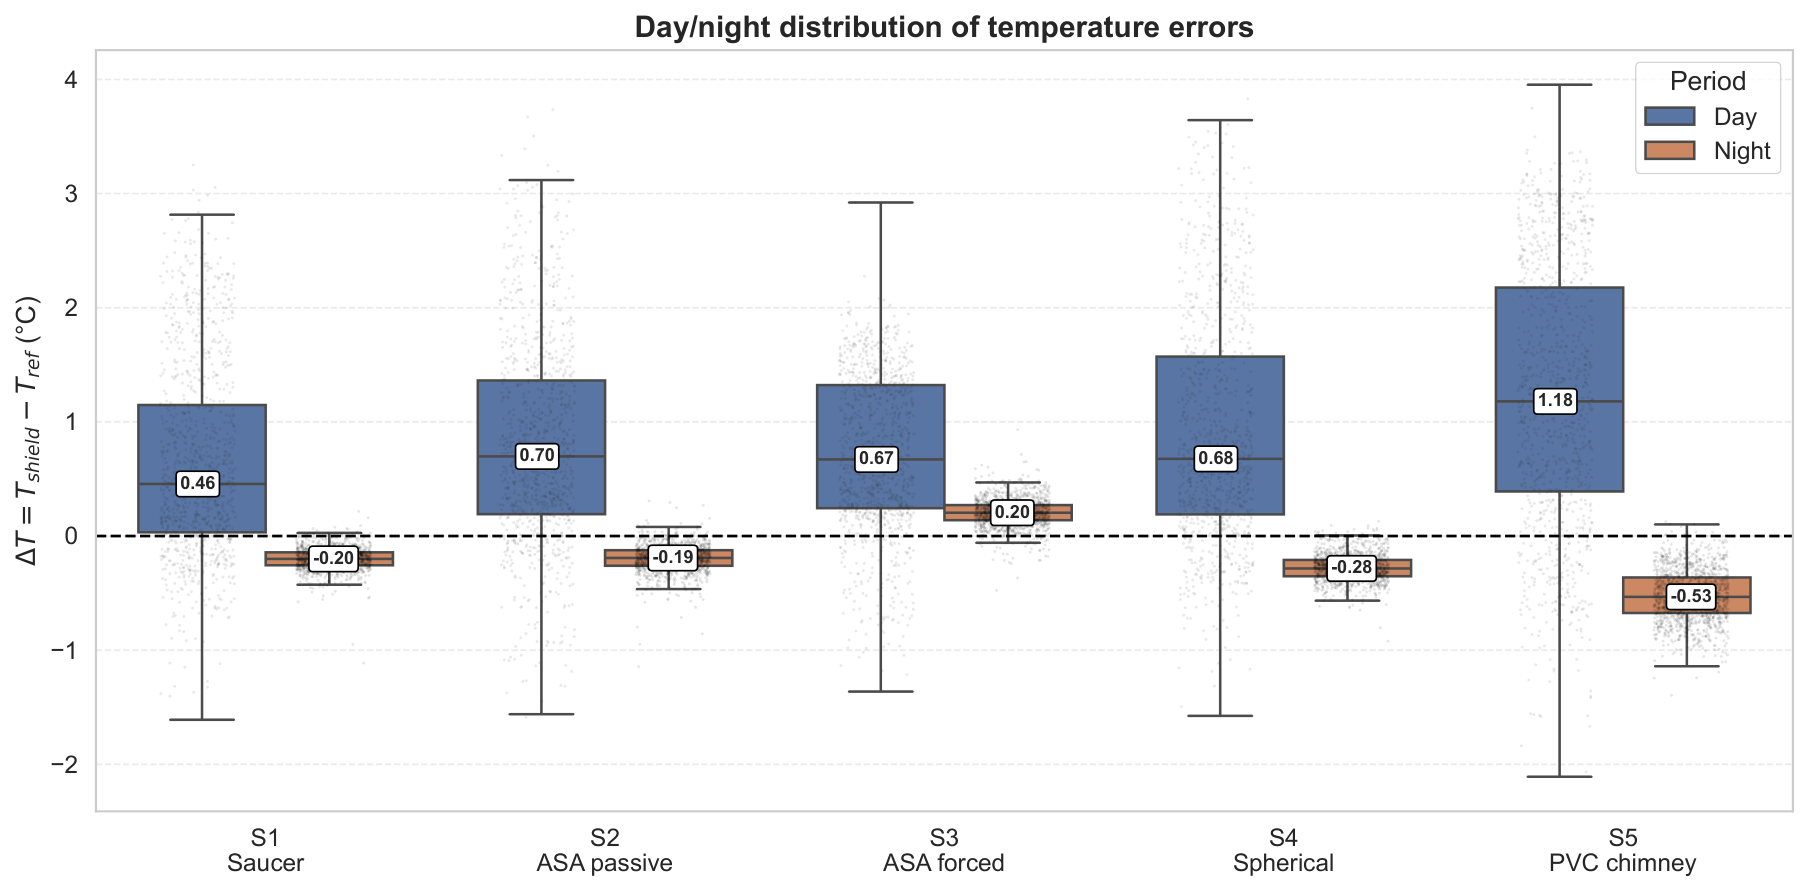
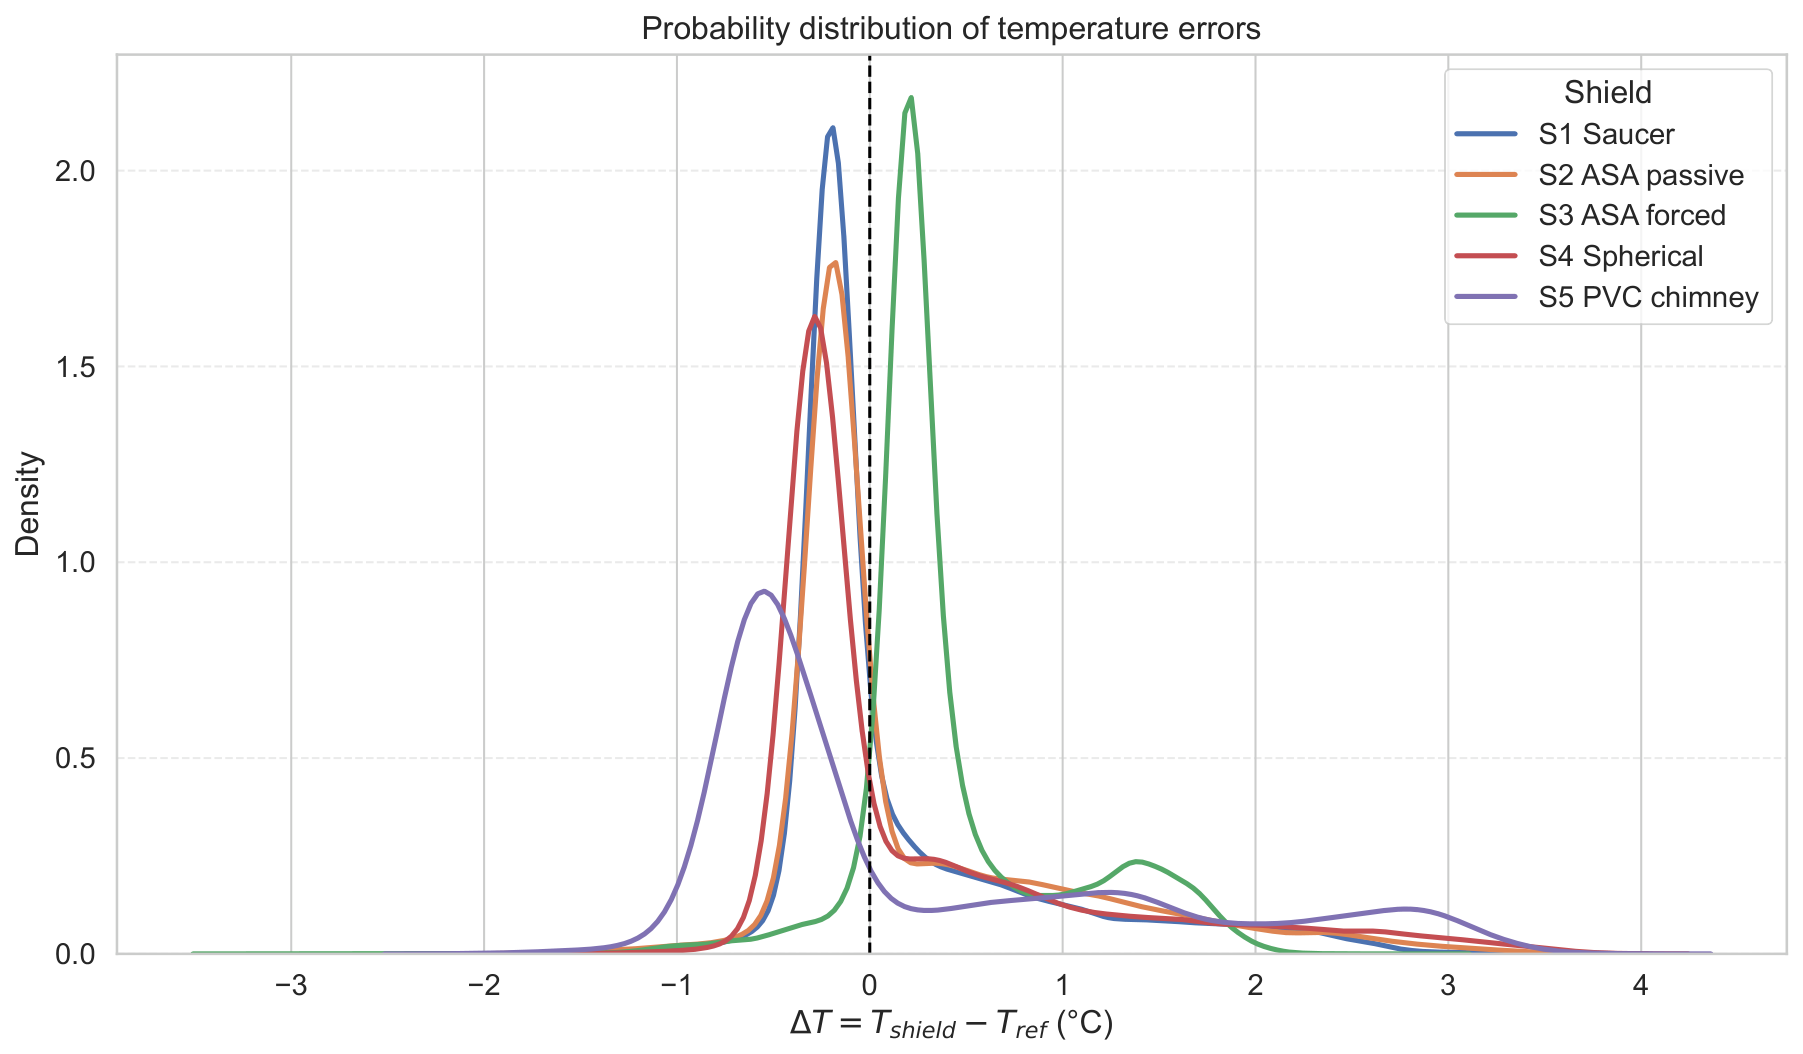
The distributions of temperature errors were further analysed using kernel density estimation (KDE) and day/night boxplots (Figure 5 and Figure 6). While the boxplots provide a compact summary of the median, interquartile range, and extreme values, the KDE curves offer additional insight into the shape of the error distributions, including asymmetry, multimodality, and the occurrence of extreme deviations. Together, these representations provide a more comprehensive assessment of shelter robustness than summary performance metrics alone.
The KDE distributions reveal marked differences in the behaviour of the tested shelters (Figure 6). The forced-ventilated shield (S3) exhibits the narrowest and most concentrated probability density function, with a pronounced peak around 0.2 °C. This indicates that most measurements remain clustered near a relatively constant bias, resulting in the lowest overall RMSE among the tested configurations. Although S3 exhibits a systematic positive offset, its narrow distribution demonstrates excellent repeatability and reduced sensitivity to changing environmental conditions.
The passive shields S1, S2, and S4 exhibit broader distributions with peaks located slightly below zero. All three shelters present a pronounced positive tail extending beyond 2 °C, indicating the occurrence of intermittent overheating events. Among these designs, S1 shows the narrowest distribution, whereas S2 and S4 exhibit progressively larger dispersion.
The PVC chimney shelter (S5) displays a fundamentally different behaviour. Its probability density function is considerably wider than those of the other shelters and exhibits the most pronounced tails. In particular, a secondary mode is visible at large positive temperature errors, suggesting that the shelter occasionally experiences substantial overheating events. The broad shape of the KDE distribution indicates that the thermal behaviour of the chimney design is less stable and more dependent on external meteorological conditions than the other tested configurations.
The day/night boxplots provide additional insight into the physical origin of these distributions. During daytime conditions, all shelters exhibit positive temperature biases, confirming that solar radiation constitutes the dominant source of measurement error. Median daytime errors increase from 0.46 °C for S1 to 1.18 °C for S5. The naturally ventilated shields S1, S2, and S4 exhibit similar daytime behaviour, with median errors between 0.46 and 0.70 °C. The forced-ventilated shield S3 also remains positively biased during daytime, with a median error of 0.67 °C, but presents a noticeably reduced spread compared with the passive designs. This observation confirms that forced ventilation primarily improves measurement stability by limiting the occurrence of extreme overheating events rather than completely eliminating the daytime bias.
At night, the distributions collapse toward values close to zero for all shelters, demonstrating that most of the daytime error originates from solar heating. Nighttime median errors remain within ±0.3 °C for S1 to S4, indicating very similar performance once radiative forcing is removed. The only notable exception is S5, which exhibits a larger negative nighttime bias (−0.53 °C). This behaviour suggests the presence of stronger thermal inertia effects within the PVC tube geometry, likely associated with heat storage and delayed cooling of the shelter structure.

3.2. Environmental Controls of Measurement Errors

3.2.1. Combined Influence of Solar Radiation and Wind Speed

Although solar radiation and wind speed individually influence shield performance, their effects are strongly coupled. Radiation generates thermal loading of the shield structure, whereas wind enhances convective heat exchange and promotes ventilation of the sensing volume. Consequently, the largest measurement errors are expected under conditions combining strong solar irradiance and weak wind speed.
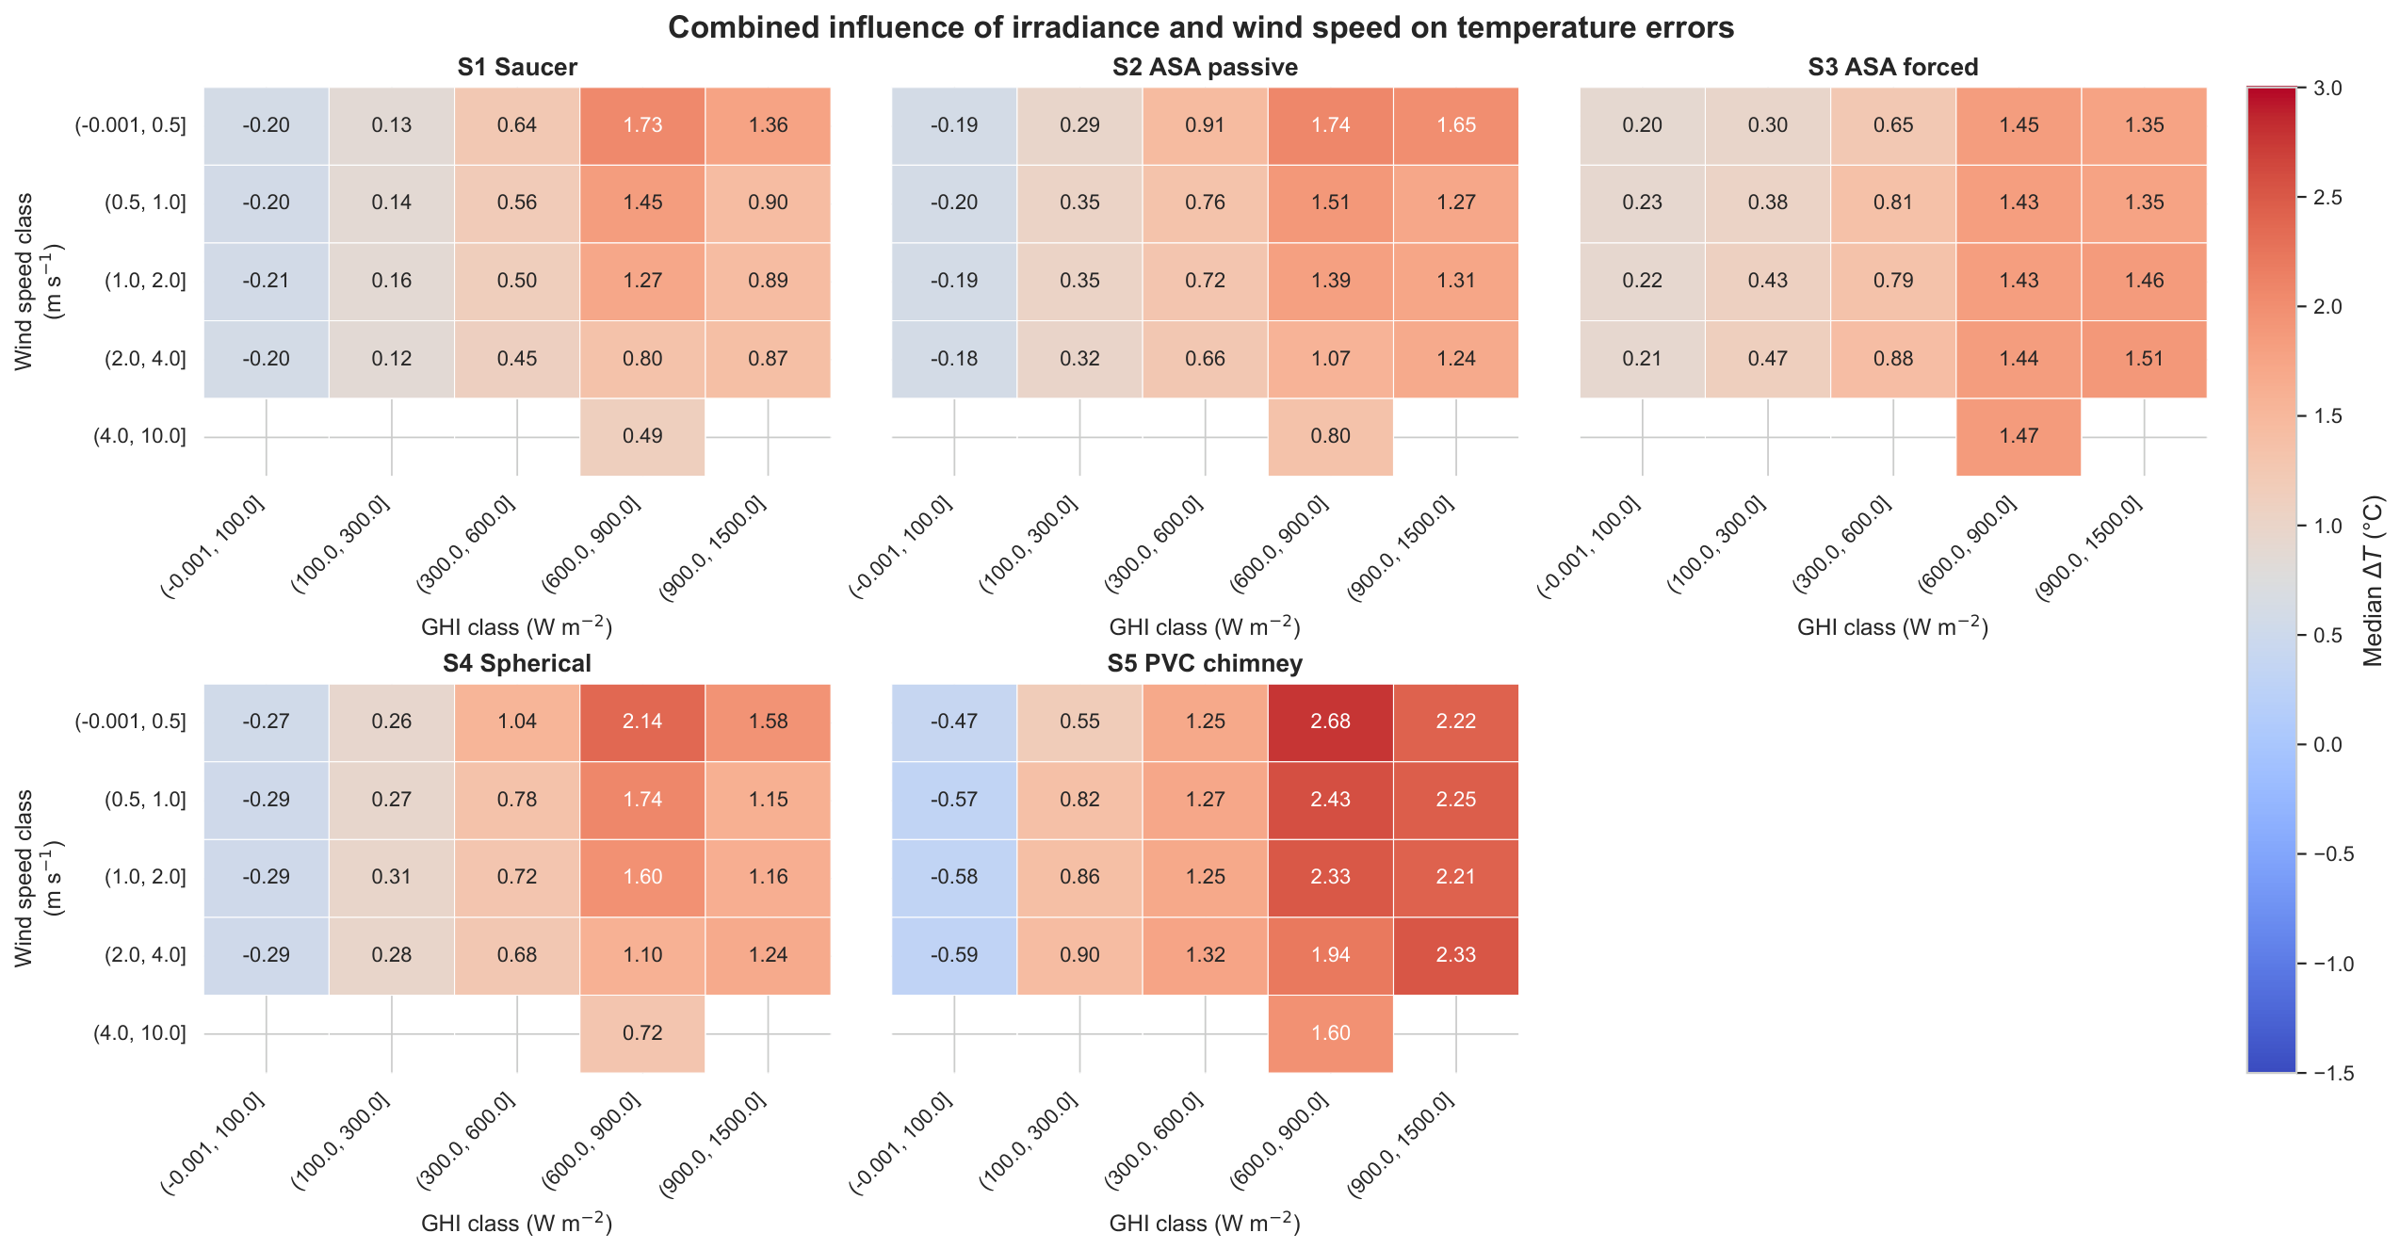
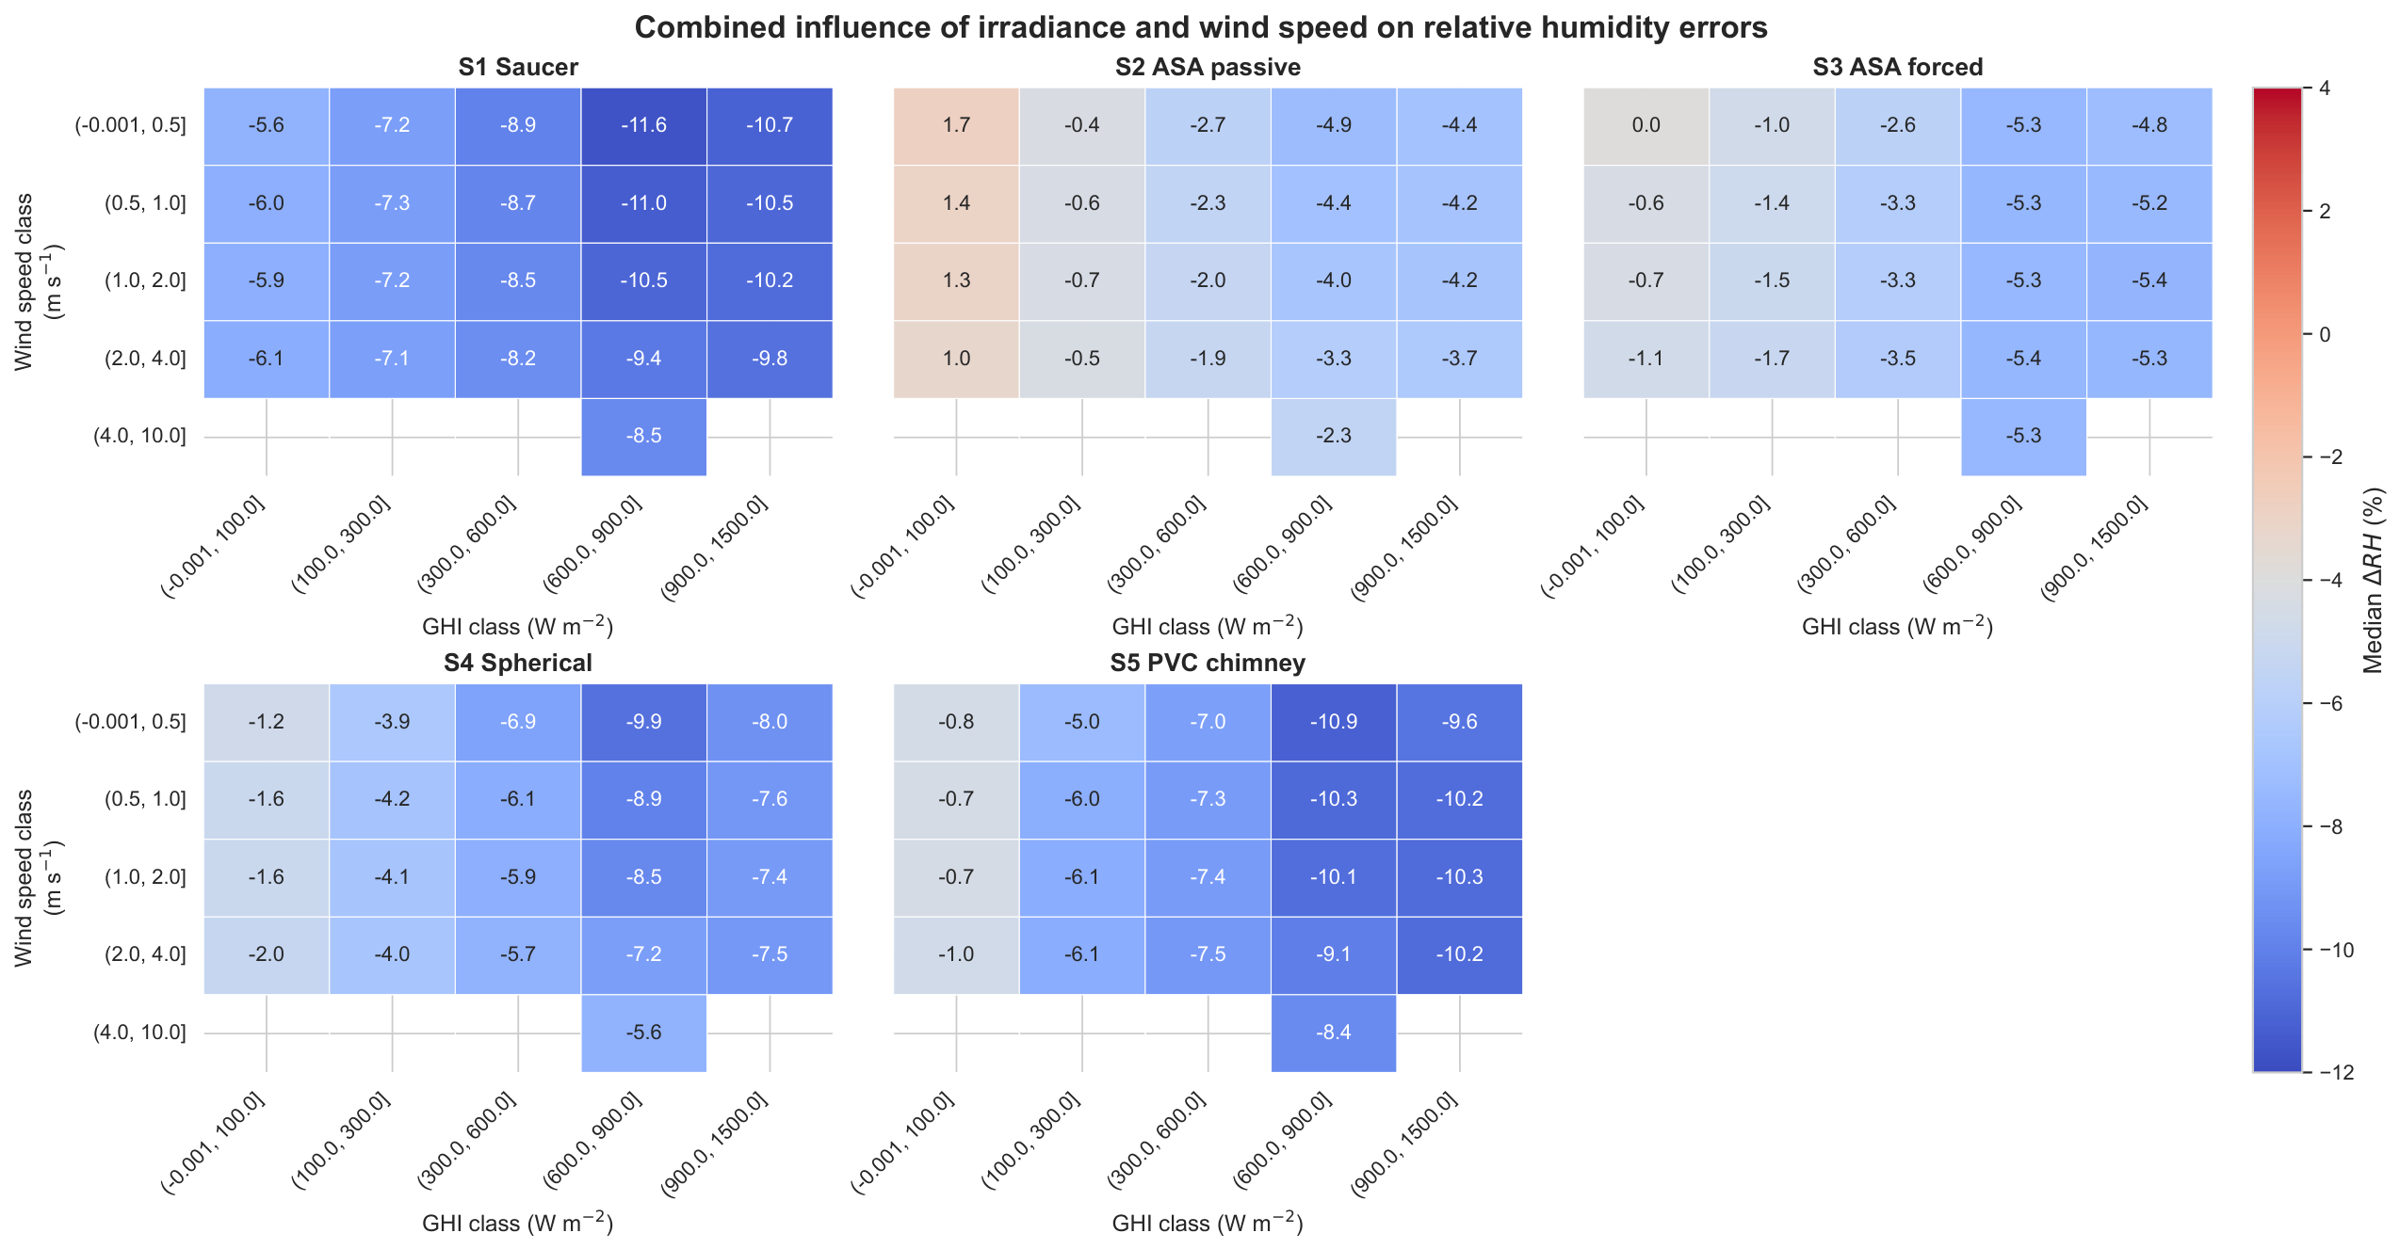
To investigate this interaction, median temperature and relative humidity errors were computed for combinations of irradiance and wind speed classes. The resulting two-dimensional error maps are presented in Figure 7 and Figure 8.
The temperature heatmaps reveal a remarkably consistent pattern across all shelter designs. For every configuration, temperature errors remain close to zero under low-irradiance conditions (<300 W m−2), regardless of wind speed. Under these conditions, radiative forcing is insufficient to produce significant shelter heating, and the influence of ventilation remains limited.
As irradiance increases, however, temperature errors increase rapidly. The largest positive biases systematically occur for irradiance levels above approximately 600 W m−2, confirming that solar heating is the dominant driver of shelter-induced temperature errors. The magnitude of this response strongly depends on shelter design.
The passive saucer shield (S1) exhibits moderate daytime overheating, with median errors reaching approximately 1.7 °C under low-wind and high-radiation conditions. The passive ASA shield (S2) behaves similarly but generally produces slightly larger positive biases. The forced-ventilated ASA shield (S3) displays a markedly different behaviour. Although positive temperature biases remain visible at high irradiance, the error field is considerably more homogeneous across wind classes, indicating that active ventilation reduces the sensitivity of the shelter to atmospheric conditions.
The spherical shelter (S4) exhibits stronger radiative sensitivity than the plate-based designs. Under irradiance between 600 and 900 W m−2 and weak winds, median temperature errors approach 2 °C. This behaviour suggests that the enclosed spherical geometry promotes heat accumulation when radiative loading exceeds the natural ventilation capacity.
The PVC chimney shelter (S5) presents the largest errors of all tested configurations. Median temperature biases exceed 2.5 °C under strong irradiance and low wind speed, and remain above 2 °C even under moderate ventilation. These results indicate that the intended chimney effect was unable to compensate for the substantial solar heating of the PVC tube. Instead, the shelter appears to amplify radiative heating through thermal storage within the structure.
The influence of wind speed is also clearly visible in the temperature heatmaps. For a given irradiance class, increasing wind speed generally reduces temperature errors. This effect is particularly evident for the passive shelters S1, S2 and S4, where median errors decrease by approximately 30 to 50% between the lowest and highest wind classes. Enhanced airflow promotes convective heat removal and improves coupling between the sensor and ambient air. In contrast, the response of S3 is much less dependent on wind speed, demonstrating that the internal fan effectively decouples shelter performance from ambient ventilation conditions.
The relative humidity heatmaps exhibit a nearly perfect inverse response to the temperature fields. As expected from psychrometric relationships, regions associated with positive temperature biases correspond to negative relative humidity biases. The largest humidity underestimations therefore occur under the same meteorological conditions that generate the largest temperature errors: strong solar radiation combined with weak wind speed.
For the saucer shield (S1), relative humidity errors reach values below −11%, indicating substantial drying biases during highly radiative conditions. Similar behaviour is observed for the spherical (S4) and PVC chimney (S5) shelters, where humidity underestimation frequently exceeds −8 to −10%.
The ASA-based shields exhibit considerably smaller humidity errors. The passive ASA design (S2) maintains humidity biases generally between −2 and −5% for most irradiance–wind combinations, while the forced-ventilated configuration (S3) provides the most stable humidity response overall. Even under strong irradiance, humidity errors remain substantially lower than those observed for S1, S4 and S5.
A particularly important result emerging from both heatmaps is that maximum measurement errors do not occur under either high radiation alone or low wind alone. Instead, they occur under the combined occurrence of strong irradiance and weak ventilation. This confirms that radiation-induced heating becomes problematic only when convective heat removal is insufficient. Conversely, moderate or strong winds can substantially mitigate radiative biases, even under intense solar loading.
These two-dimensional analyses therefore provide a physical interpretation of shelter performance that cannot be obtained from one-dimensional irradiance or wind analyses alone. They demonstrate that shelter behaviour is governed by the balance between radiative heat input and convective heat removal. Among the tested designs, the forced-ventilated ASA shelter (S3) appears to provide the most robust performance across the full range of meteorological conditions, whereas the PVC chimney shelter (S5) is the most sensitive to the combined effects of radiation and weak ventilation.

3.2.2. Temperature and Humidity Coupling

Because relative humidity is thermodynamically linked to air temperature, shelter-induced temperature biases inevitably affect humidity measurements. A strong and systematic inverse relationship was observed for all configurations. Positive temperature biases were consistently associated with negative humidity biases, confirming the expected psychrometric coupling. Linear regressions yielded slopes ranging from approximately 3.1 to 3.7 % RH per degree Celsius (Table 5). These values indicate that a temperature overestimation of 1 °C typically results in an apparent underestimation of relative humidity by approximately 3%. The corresponding coefficients of determination ( R 2 ) ranged from 0.74 to 0.94, demonstrating that temperature errors explain a large fraction of the observed humidity variability. The similarity of the regression slopes among the five shelters suggests that the observed humidity errors are primarily driven by temperature measurement errors rather than by intrinsic limitations of the humidity sensing element itself. Consequently, a substantial fraction of the relative humidity bias originates indirectly from shelter overheating under radiative conditions. This finding provides an important interpretation of the humidity results presented previously. The largest negative humidity biases observed under strong solar radiation and weak wind conditions are largely a consequence of the positive temperature biases generated by shelter heating. Conversely, shelter designs that effectively limit radiative temperature errors also provide improved humidity measurements. These results are particularly relevant for applications involving thermal comfort and heat-stress assessment, such as UTCI or Heat Index. Since these indicators simultaneously depend on temperature and relative humidity, shelter-induced overheating may artificially amplify perceived atmospheric dryness and introduce additional uncertainty into heat-stress evaluations.

3.3. Diurnal Evolution of Shelter Errors

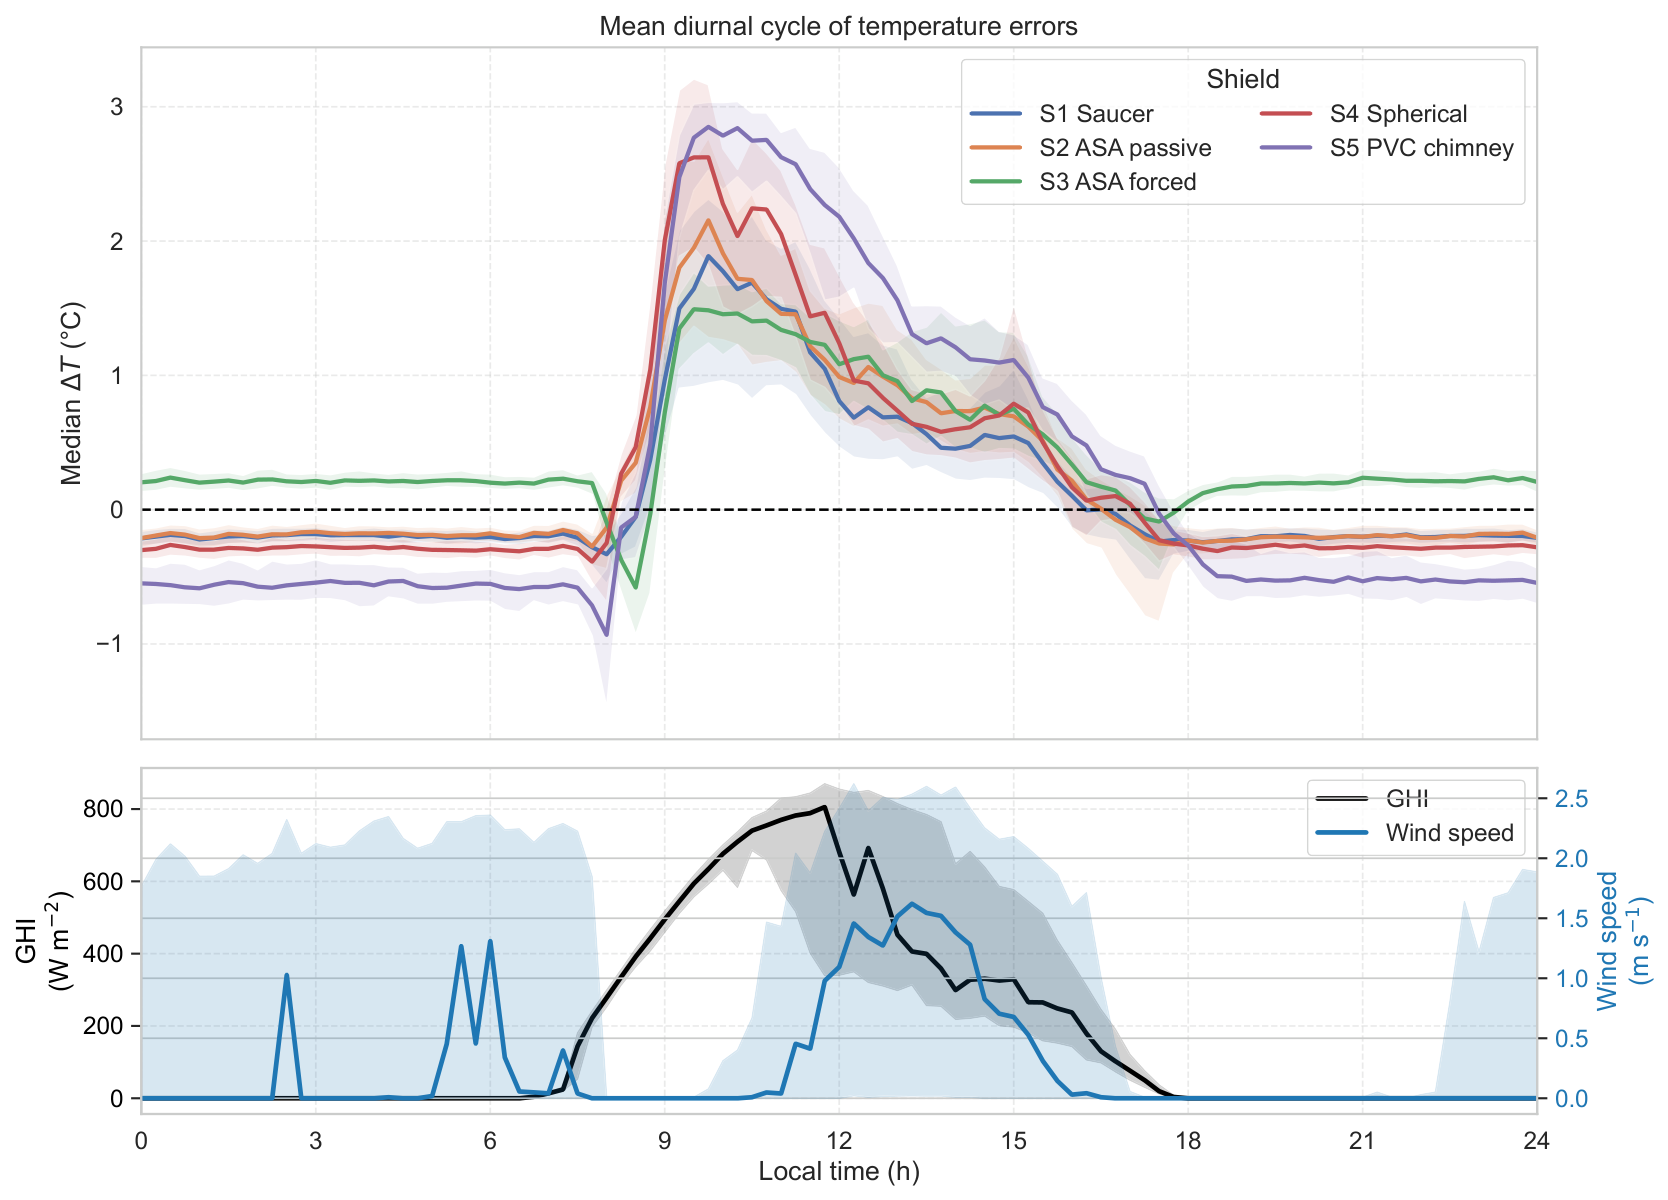
To investigate the temporal dynamics of shelter performance, the median diurnal cycle of temperature errors was analysed together with the corresponding cycles of GHI and wind speed (Figure 9). This representation provides insight into the meteorological conditions responsible for the development and dissipation of radiation-induced measurement errors.
The diurnal cycles reveal a close relationship between shelter errors and the combined evolution of radiative and aerodynamic conditions. During nighttime, when solar radiation is absent, all shelters exhibit relatively stable temperature errors. S1, S2 and S4 remain slightly negatively biased, S3 maintains a small positive offset, whereas S5 exhibits the strongest negative nighttime bias. These differences remain limited compared with daytime errors and suggest that radiative forcing is the dominant source of uncertainty.
A rapid increase in temperature errors occurs shortly after sunrise. Between approximately 08:00 and 10:00 local time, all shelters experience a sharp transition from near-zero errors to substantial positive biases. Interestingly, this period corresponds to rapidly increasing solar radiation while wind speed remains close to zero. The morning hours therefore combine strong radiative loading with minimal convective cooling, creating the most unfavourable conditions for naturally ventilated radiation shields.
The largest median temperature errors are observed between 09:30 and 10:00 local time, significantly earlier than the peak in reference air temperature and nearly two hours before the maximum daily irradiance. Peak errors reach 1.49 °C for the forced-ventilated ASA shield (S3), 1.89 °C for the saucer shield (S1), 2.15 °C for the passive ASA shield (S2), 2.62 °C for the spherical shield (S4), and 2.85 °C for the PVC chimney shelter (S5). The occurrence of these maxima before the irradiance peak demonstrates that shelter overheating is not controlled by solar radiation alone.
After approximately 11:00 local time, temperature errors progressively decrease despite irradiance remaining close to its daily maximum. The lower panel of Figure 9 shows that this reduction coincides with a marked increase in wind speed, which rises from nearly zero during the morning to values approaching 1.5 m s−1 around midday. Enhanced airflow promotes convective heat exchange between the shelter and the surrounding atmosphere, thereby reducing the thermal disequilibrium responsible for sensor overheating.
This behaviour provides direct observational evidence that ventilation plays a key role in mitigating radiation-induced errors. The results therefore support the interpretation derived from the two-dimensional irradiance–wind heatmaps presented previously: the largest errors occur under the combined occurrence of strong solar radiation and weak ventilation rather than under maximum irradiance alone.
Among the tested shelters, the forced-ventilated configuration S3 exhibits the smallest daytime overheating and the fastest recovery. Its error amplitude remains substantially lower than that of the passive shelters throughout the day, confirming that active ventilation effectively reduces sensitivity to changing atmospheric conditions. Conversely, the PVC chimney shelter S5 displays both the largest morning peak and the slowest afternoon recovery. Elevated errors persist for several hours after the morning maximum, suggesting that heat accumulated within the PVC structure is released progressively throughout the afternoon. This behaviour is consistent with the larger daytime biases and nighttime offsets observed previously.

3.4. Calibration Models

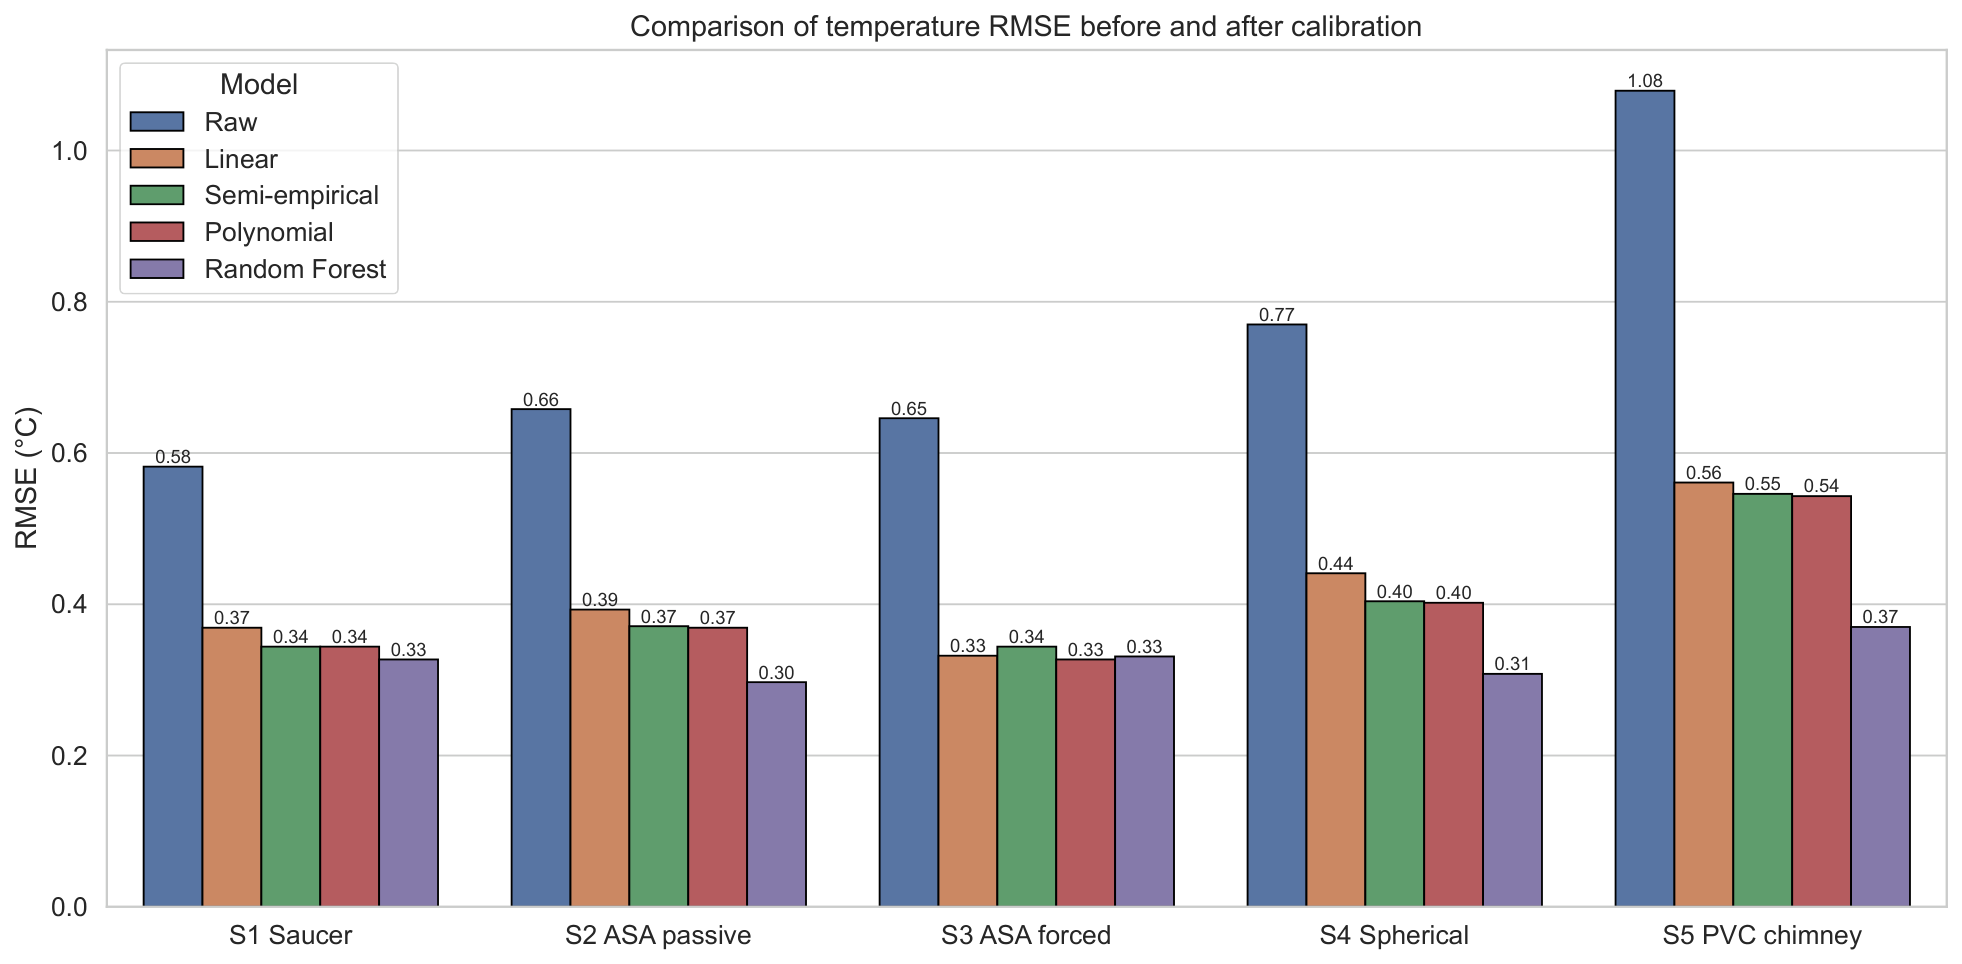
The calibration models substantially improved the accuracy of all tested radiation shields when evaluated on the independent temporal test period (Table 6, Figure 10). The dataset was split chronologically, with the first part of the campaign used for model training (24 April 2026 09:58 to 21 May 2026 15:08; n = 35,364) and the remaining period used for independent testing (21 May 2026 15:09 to 28 May 2026 10:26; n = 9667 ). This temporal split was used to avoid information leakage between calibration and evaluation periods and to account for the temporal dependence of the one-minute observations.
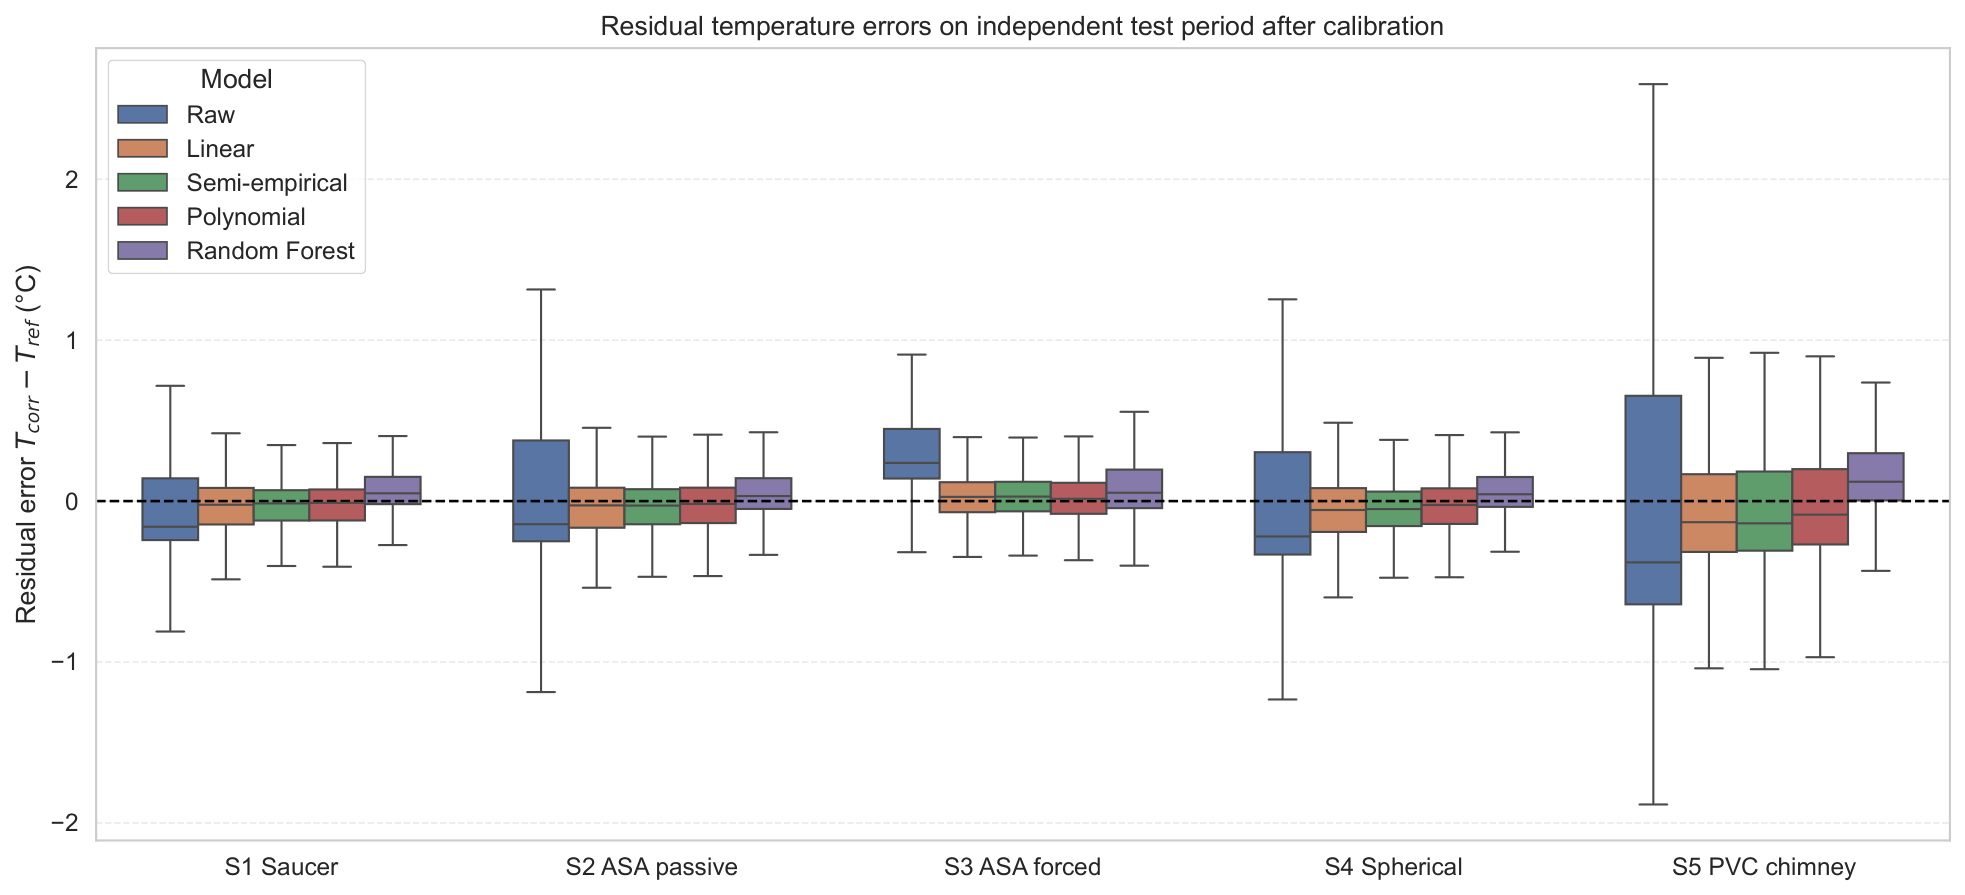
Across the five shelter configurations, temperature RMSE on the independent test period was reduced by approximately 37–66% relative to the raw measurements, demonstrating that a large fraction of the observed error can be explained from the local meteorological conditions. The largest improvement was obtained for the PVC chimney shelter (S5), for which the raw RMSE decreased from 1.08 °C to 0.56 °C using the linear correction, 0.55 °C using the semi-empirical model, and 0.37 °C using the Random Forest model. The spherical shelter (S4) also showed a strong improvement, with RMSE decreasing from 0.77 °C to 0.31 °C after Random Forest correction. In contrast, the forced-ventilated shield (S3), which already exhibited relatively low raw errors, showed more moderate but still substantial improvements, with RMSE reduced from 0.65 to 0.33 °C.
A notable result is that the simple linear correction already removes a substantial fraction of the measurement error on the independent test period. Depending on shelter configuration, RMSE reductions ranged from 36.6 to 49.0%, indicating that much of the shelter-induced bias can be explained by the first-order effects of solar irradiance and wind speed. This result is fully consistent with the previous analyses showing that the largest errors occurred under conditions combining strong radiative forcing and weak ventilation. The semi-empirical formulation yielded slightly better results than the linear model for most passive shelters, with RMSE reductions ranging from 40.8 to 49.4%. Although the performance gain remains modest, the fitted coefficients provide valuable physical insight into shelter behaviour (Table 7).
The estimated coefficients in Table 7 are consistent with the physical interpretation derived from the irradiance and wind analyses. The PVC chimney shelter (S5) exhibits by far the largest value of parameter a, indicating the strongest sensitivity of the shelter thermal response to the balance between radiative forcing and ventilation. This result agrees with the large daytime overheating previously identified in the diurnal cycles and irradiance/wind heatmaps. Conversely, the plate-based shelters exhibit lower values of a, reflecting a weaker conversion of radiative loading into measurement error. The fitted values of parameter b are also informative. The highest values are obtained for S3 and S5, suggesting that additional cooling processes not explicitly represented by the ambient wind speed contribute to the observed thermal response. In the case of S3, this behaviour is consistent with the action of the internal fan, whereas for S5 it likely reflects the complex airflow and heat storage processes occurring within the chimney geometry. The polynomial model produced only marginal improvements compared with the semi-empirical formulation. This result suggests that most of the correctable error is already captured by the physically based irradiance-to-ventilation relationship identified in Equation (10). Consequently, increasing model complexity beyond this formulation provides limited additional benefit. The Random Forest model achieved the best predictive performance for most shelter configurations on the independent test period, with final RMSE values ranging from 0.30 to 0.37 °C and reductions reaching 65.7% for S5. However, the difference between the Random Forest and the semi-empirical or polynomial models remained limited for S1 and S3. These results indicate that nonlinear interactions between irradiance, wind speed, humidity, shelter temperature and time of day contribute to the residual error structure, but also confirm that a large fraction of the error can already be corrected using simpler physically interpretable formulations.
The distributions of residual errors after calibration further confirm these improvements (Figure 11). All correction approaches substantially reduced both systematic bias and error dispersion relative to the raw measurements. The Random Forest model produced the narrowest residual distributions for the shelters exhibiting the largest uncorrected errors, particularly S4 and S5. Nevertheless, the semi-empirical model achieved comparable bias reduction while retaining direct physical interpretability and stronger consistency with the radiative–convective mechanisms identified throughout the analysis.

4. Discussion

4.1. Implications for Low-Cost Meteorological Monitoring

The results obtained in this study highlight the challenges associated with the deployment of low-cost meteorological sensors under tropical outdoor conditions. Although all tested shelters reproduced the general temporal variability of air temperature and relative humidity, substantial measurement biases were observed under strong solar radiation and weak wind conditions. These conditions are particularly common in urban environments, where low-cost sensor networks are increasingly used to investigate local climate variability, urban heat islands, and human thermal comfort [20,47,48,49].
A major outcome of this work is that shelter performance cannot be adequately assessed using global metrics alone. While RMSE and correlation coefficients provide useful overall indicators, the irradiance–wind heatmaps revealed that measurement errors are strongly condition-dependent and controlled by the balance between radiative loading and ventilation. This finding is consistent with the physical interpretation proposed by Bernard et al. [23], who identified radiation sensitivity as a primary driver of shelter-induced temperature errors, and with earlier studies showing that radiative errors increase with increasing solar loading and decreasing wind speed [27,31]. The present study further demonstrates that the largest errors occur when high irradiance coincides with weak ventilation, emphasizing the importance of considering both forcing mechanisms simultaneously. Similar conclusions were obtained during the COAT metrological intercomparison campaign conducted in Arctic conditions, where García Izquierdo et al. [26] reported that solar irradiance represented the dominant forcing mechanism while wind speed substantially reduced shield divergences.
The observed error magnitudes are comparable to those reported in previous radiation shield intercomparison studies [25,50,51]. Jin et al. [25] showed that optimized naturally ventilated shields can substantially reduce radiative overheating through improved aerodynamic design. Similarly, the present results highlight the importance of airflow around the sensing element. The superior performance of the forced-ventilated shield and the good performance of the ASA multi-plate designs confirm that enhancing ventilation remains one of the most effective strategies for limiting shelter-induced biases.
Beyond temperature measurements alone, this study also demonstrates that shelter-induced overheating directly propagates into relative humidity measurements. This aspect remains largely overlooked in most radiation-shield evaluations despite its importance for thermal comfort and heat-stress applications. The strong coupling observed between temperature and humidity errors indicates that a temperature overestimation of 1 °C typically produces an apparent underestimation of relative humidity of approximately 3%. Consequently, shelter selection may affect not only air temperature measurements but also derived climatic indicators, supporting the conclusions of Lipina et al. [52] regarding the broader consequences of radiation-shield choice.
From an operational perspective, a particularly encouraging result is that relatively simple and inexpensive shield geometries (less than 20 €) can achieve corrected RMSE values as low as 0.30 to 0.37 °C on an independent validation period when combined with appropriate correction procedures. While the forced-ventilated configuration achieved the most robust raw performance, the passive ASA multi-plate shelters provided comparable, and in some corrected configurations slightly superior, accuracy at substantially lower cost and without energy consumption. This finding is particularly relevant for dense monitoring networks where deployment cost, maintenance requirements, and energy autonomy often represent major constraints. Compared with approaches based on detailed CFD simulations and neural-network correction models [29], the semi-empirical correction proposed here is less complex but remains directly linked to the balance between radiative heating and convective cooling. In this context, virtual-experiment approaches may provide a useful complementary route for testing the sensitivity of correction models and identifying dominant uncertainty sources before large-scale field deployment [53].
More generally, the proposed correction framework suggests that part of the performance gap between low-cost and professional systems can be compensated through physically based post-processing. Because the dominant error mechanisms appear to be directly linked to irradiance and ventilation, the resulting correction models remain physically interpretable and could potentially be implemented in operational monitoring networks after additional validation under a broader range of environmental conditions. Such approaches may therefore contribute to reducing the dependence on expensive aspirated radiation shields in some large-scale urban climate monitoring applications.

4.2. Limitations and Future Work

Several limitations should be considered when interpreting the present results. First, the experiment was conducted over a relatively short period (24 April to 28 May 2026) at a single tropical site. Although the campaign encompassed a broad range of irradiance, humidity and wind conditions, additional measurements covering multiple seasons would be required to assess the long-term robustness of the tested shelters.
Second, the reference measurement system relied on a naturally ventilated professional radiation shield rather than on a mechanically aspirated reference system. Although the reference sensor was carefully installed under permanent shading conditions to minimize radiation-induced biases, a small residual shelter error cannot be completely excluded under conditions of strong solar radiation and weak ambient ventilation. Consequently, the temperature and humidity errors reported in this study should be interpreted as deviations relative to a professional meteorological reference system rather than as absolute metrological errors relative to an ideal aspirated standard. Future investigations could benefit from the use of a mechanically aspirated reference system in order to better quantify both the residual radiative bias and the associated reference measurement uncertainty of naturally ventilated professional shields [27] under tropical high-radiation conditions.
Third, the sensor position was not strictly identical across all shelter configurations because the mounting strategy was adapted to the engineering constraints and ventilation concepts of each design. In particular, the SHT31 sensor was installed beneath the lower plate in the saucer shield (S1), whereas it was positioned inside the shield cavity in the ASA multi-plate configurations (S2 and S3) and centrally within the spherical design (S4). Since sensor location may influence local airflow patterns, thermal stratification and heat accumulation inside naturally ventilated shelters, part of the observed differences may reflect the combined influence of shelter geometry and sensor placement rather than geometry alone. Although the magnitude of this effect is expected to remain small compared with the strong radiation-induced errors observed under high irradiance and weak ventilation conditions, its independent contribution could not be quantified using the present experimental design. In addition, only a single realization of each shelter configuration was evaluated during the present campaign. Although the five SHT31 sensors were previously intercompared and calibrated prior to deployment, the experimental design does not allow the respective contributions of sensor variability, manufacturing tolerances, mounting differences and local exposure effects to be fully separated from the influence of shelter architecture itself. Consequently, the present results should be interpreted primarily as an intercomparison of representative low-cost shelter concepts rather than as a complete assessment of intra-design variability and reproducibility. Future studies could therefore benefit from replicated shelter units and systematically controlled sensor positions within identical shelter geometries in order to better isolate the respective roles of shelter architecture, sensor placement and manufacturing variability on measurement uncertainty [26].
Furthermore, rainfall remained very limited during the experimental campaign, with a maximum recorded precipitation of only 1.41 mm over the measurement interval. Consequently, the behaviour of the tested shelters under prolonged rainfall, wet surface conditions, or latent heat exchange processes associated with wet surfaces and evaporation could not be evaluated. Additional experiments conducted during wetter periods would therefore be required to assess the robustness of the proposed correction models under a broader range of tropical meteorological conditions.
Finally, the present results were obtained at a single tropical site and under a specific range of environmental conditions representative of high-radiation tropical periods. Consequently, caution should be exercised before extrapolating the observed shelter performances to other climates, seasons, exposure conditions or deployment configurations. Additional experiments conducted over longer periods, at multiple sites and under a wider range of meteorological conditions would be required not only to assess the broader applicability of the conclusions presented here, but also to contribute to the development of traceable and uncertainty-aware low-cost environmental observations consistent with emerging metrological frameworks for climate-quality measurements [54].

5. Conclusions

This study evaluated the performance of five low-cost radiation shield designs for air temperature and relative humidity measurements under tropical outdoor conditions. More than 45,000 one-minute observations were collected over a five-week experimental campaign and compared with measurements from a professional reference weather station.
All tested shelters successfully reproduced the temporal variability of atmospheric conditions, but significant differences were observed in terms of measurement accuracy. The forced-ventilated ASA shield provided the best overall performance, whereas the PVC chimney design exhibited the largest temperature and humidity errors. The analyses consistently showed that shelter-induced biases are primarily controlled by the interaction between solar radiation and ventilation. The largest errors occurred under conditions combining strong irradiance and weak wind speed, while nighttime measurements showed substantially reduced biases for all configurations.
The results further demonstrated that temperature and relative humidity errors are strongly coupled, with a temperature overestimation of 1 °C typically producing an apparent underestimation of relative humidity of approximately 3%. This finding highlights the importance of considering both variables when evaluating radiation shield performance, particularly for applications involving thermal comfort and heat-stress assessment.
Finally, the proposed correction models substantially improved measurement accuracy for all shelter configurations. While the Random Forest approach achieved the largest RMSE reductions, the semi-empirical model provided the most attractive compromise between performance, simplicity and physical interpretability. This distinction is important from a metrological perspective because machine-learning models require specific attention to training-data uncertainty, model selection, parameter uncertainty and possible distribution shifts when they are used as part of a measurement or correction chain [55]. In contrast, the semi-empirical model directly reflects the balance between radiative heating and convective cooling identified throughout the study, providing a promising framework for improving the quality of low-cost meteorological observations under tropical conditions characterized by strong radiative forcing and limited precipitation. Additional evaluations under wetter conditions and during periods of sustained rainfall would nevertheless be required to assess the robustness and transferability of the proposed correction framework.

Author Contributions

A.L.: conceptualization, investigation, data curation, methodology, writing—original draft, writing—review and editing, validation and visualization. B.M.-D.: writing—review and editing. G.R.: writing—review and editing. All authors have read and agreed to the published version of the manuscript.

Funding

This research received no external funding.

Data Availability Statement

The raw data supporting the conclusions of this article will be made available by the authors on request.

Acknowledgments

We thank the University of Reunion Island and the PIMENT laboratory for their invaluable technical and administrative assistance. We are especially grateful to Enzo Giordano, undergraduate Civil Engineering student, whose significant contribution to 3D modeling and field data collection was essential to this study.

Conflicts of Interest

The authors declare no conflicts of interest.

Abbreviations

The following abbreviations are used in this manuscript:
ASAAcrylonitrile Styrene Acrylate
GHIGlobal Horizontal Irradiance
IoTInternet of Things
KDEKernel Density Estimation
MAEMean Absolute Error
MBEMean Bias Error
PPPolypropylene
PVCPolyvinyl Chloride
RHRelative Humidity
RMSERoot Mean Square Error
SHT31Sensirion Temperature and Humidity Sensor
UTCIUniversal Thermal Climate Index
WBGTWet-Bulb Globe Temperature

References

  1. Nazarian, N.; Krayenhoff, E.S.; Bechtel, B.; Hondula, D.M.; Paolini, R.; Vanos, J.; Cheung, T.; Chow, W.T.L.; de Dear, R.; Jay, O.; et al. Integrated Assessment of Urban Overheating Impacts on Human Life. Earth’s Future 2022, 10, e2022EF002682. [Google Scholar] [CrossRef] [Scilit]
  2. Zendeli, D.; Colaninno, N.; Maiullari, D.; van Esch, M.; van Timmeren, A.; Marconi, G.; Bonora, R.; Morello, E. From heatwaves to ‘healthwaves’: A spatial study on the impact of urban heat on cardiovascular and respiratory emergency calls in the city of Milan. Sustain. Cities Soc. 2025, 124, 106181. [Google Scholar] [CrossRef] [Scilit]
  3. Naserikia, M.; Nazarian, N.; Hart, M.A.; Sismanidis, P.; Bechtel, B.; Meissner, K. Two decades of urban heat intensification and exposure across 1400 cities. Commun. Earth Environ. 2026. [Google Scholar] [CrossRef] [Scilit]
  4. Sari, D.P. A Review of How Building Mitigates the Urban Heat Island in Indonesia and Tropical Cities. Earth 2021, 2, 653–666. [Google Scholar] [CrossRef] [Scilit]
  5. Lefevre, A.; Malet-Damour, B.; Boyer, H.; Rivière, G. Urban heat island in the tropics: A review of advances, challenges, and future directions. City Environ. Interact. 2025, 28, 100265. [Google Scholar] [CrossRef] [Scilit]
  6. Méndez-Lázaro, P.A.; Napoli, C.D.; Rivas-Tumanyan, S.; Pérez-Ríos, N.; Sepúlveda, L.G.; Rodríguez, E.; Morales, E.; Martínez, O.; Cabrera-Rivera, L.T.; Sánchez-Sepúlveda, M.V.; et al. Too hot and too humid in the Caribbean: Impacts of extreme heat events and non-accidental mortality in the tropical island of Puerto Rico (2015–2020). J. Clim. Change Health 2025, 25, 100484. [Google Scholar] [CrossRef] [Scilit] [PubMed]
  7. Santamouris, M. Analyzing the heat island magnitude and characteristics in one hundred Asian and Australian cities and regions. Sci. Total Environ. 2015, 512–513, 582–598. [Google Scholar] [CrossRef] [Scilit] [PubMed]
  8. Yang, J.; Bou-Zeid, E. Designing sensor networks to resolve spatio-temporal urban temperature variations: Fixed, mobile or hybrid? Environ. Res. Lett. 2019, 14, 074022. [Google Scholar] [CrossRef] [Scilit]
  9. Cao, C.; Yang, Y.; Lu, Y.; Schultze, N.; Gu, P.; Zhou, Q.; Xu, J.; Lee, X. Performance Evaluation of a Smart Mobile Air Temperature and Humidity Sensor for Characterizing Intracity Thermal Environment. J. Atmos. Ocean. Technol. 2020, 37, 1891–1905. [Google Scholar] [CrossRef] [Scilit]
  10. Feigel, G.; Plein, M.; Zeeman, M.; Metzger, S.; Matzarakis, A.; Schindler, D.; Christen, A. High spatio-temporal and continuous monitoring of outdoor thermal comfort in urban areas: A generic and modular sensor network and outreach platform. Sustain. Cities Soc. 2024, 119, 105991. [Google Scholar] [CrossRef] [Scilit]
  11. Gubler, M.; Christen, A.; Remund, J.; Brönnimann, S. Evaluation and application of a low-cost measurement network to study intra-urban temperature differences during summer 2018 in Bern, Switzerland. Urban Clim. 2021, 37, 100817. [Google Scholar] [CrossRef] [Scilit]
  12. Vitanova, L.; Petrova-Antonova, D.; Shirinyan, E. Urban digital twin for assessing and understanding urban Heat Island impacts. Urban Clim. 2025, 62, 102530. [Google Scholar] [CrossRef] [Scilit]
  13. Jacoby Cureau, R.; Balocco, C.; Pigliautile, I.; Piselli, C.; Fabiani, C.; Cotana, F.; Carletti, C.; Sciurpi, F.; Pisello, A.L. On urban microclimate spatial-temporal dynamics: Evidence from the integration of fixed and wearable sensing and mapping techniques. Environ. Res. 2024, 262, 119795. [Google Scholar] [CrossRef] [Scilit] [PubMed]
  14. Lefevre, A.; Malet-Damour, B.; Boyer, H.; Rivière, G. Advancing Urban Microclimate Monitoring: The Development of an Environmental Data Measurement Station Using a Low-Tech Approach. Sustainability 2024, 16, 3093. [Google Scholar] [CrossRef] [Scilit]
  15. Young, D.T.; Chapman, L.; Muller, C.L.; Cai, X.M.; Grimmond, C.S.B. A Low-Cost Wireless Temperature Sensor: Evaluation for Use in Environmental Monitoring Applications. J. Atmos. Ocean. Technol. 2014, 31, 938–944. [Google Scholar] [CrossRef] [Scilit]
  16. Cano-Suñén, E.; Martínez, I.; Fernández, Á.; Zalba, B.; Casas, R. Internet of Things (IoT) in Buildings: A Learning Factory. Sustainability 2023, 15, 12219. [Google Scholar] [CrossRef] [Scilit]
  17. Salamone, F.; Chinazzo, G.; Danza, L.; Miller, C.; Sibilio, S.; Masullo, M. Low-Cost Thermohygrometers to Assess Thermal Comfort in the Built Environment: A Laboratory Evaluation of Their Measurement Performance. Buildings 2022, 12, 579. [Google Scholar] [CrossRef] [Scilit]
  18. Eingrüber, N.; Berg, P.; Korres, W.; Löhnert, U.; Schneider, K. Parameterization and citizen science based validation of a high-resolution microclimate model to identify temperature patterns in a climate change adapted urban high-density area. City Environ. Interact. 2026, 29, 100302. [Google Scholar] [CrossRef] [Scilit]
  19. Meier, F.; Fenner, D.; Grassmann, T.; Otto, M.; Scherer, D. Crowdsourcing air temperature from citizen weather stations for urban climate research. Urban Clim. 2017, 19, 170–191. [Google Scholar] [CrossRef] [Scilit]
  20. Lefevre, A.; Malet-Damour, B.; Boyer, H.; Rivière, G. From urban heat island to thermal resilience: Lessons from low-cost microclimate monitoring in a small tropical island. Urban Clim. 2026, 67, 102913. [Google Scholar] [CrossRef] [Scilit]
  21. McBroom, B.D.; Rahn, D.A.; Brunsell, N.A. Urban fraction influence on local nocturnal cooling rates from low-cost sensors in Dallas-Fort Worth. Urban Clim. 2024, 53, 101823. [Google Scholar] [CrossRef] [Scilit]
  22. Romero Rodríguez, L.; Sánchez Ramos, J.; Álvarez Domínguez, S. Simplifying the process to perform air temperature and UHI measurements at large scales: Design of a new APP and low-cost Arduino device. Sustain. Cities Soc. 2023, 95, 104614. [Google Scholar] [CrossRef] [Scilit]
  23. Bernard, J.; Kéravec, P.; Morille, B.; Bocher, E.; Musy, M.; Calmet, I. Outdoor Air Temperature Measurement: A Semi-Empirical Model to Characterize Shelter Performance. Climate 2019, 7, 26. [Google Scholar] [CrossRef] [Scilit]
  24. Harrison, R.G. Natural ventilation effects on temperatures within Stevenson screens. Q. J. R. Meteorol. Soc. 2010, 136, 253–259. [Google Scholar] [CrossRef] [Scilit]
  25. Jin, W.; Zhou, Y.; Tang, J.; Amdadul, H.M. Design and Experimental Validation of a High-Accuracy Naturally Ventilated Radiation Shield for Near-Surface Air Temperature Observation. Atmosphere 2026, 17, 272. [Google Scholar] [CrossRef] [Scilit]
  26. García Izquierdo, C.; Hernandez, S.; Parrondo, M.; Casas, A.; Viola, A.; Mazzola, M.; Merlone, A.; Roulet, Y.A. COAT Project: Intercomparison of Thermometer Radiation Shields in the Arctic. Atmosphere 2024, 15, 841. [Google Scholar] [CrossRef] [Scilit]
  27. Huwald, H.; Higgins, C.W.; Boldi, M.; Bou-Zeid, E.; Lehning, M.; Parlange, M.B. Albedo effect on radiative errors in air temperature measurements. Water Resour. Res. 2009, 45, 2008WR007600. [Google Scholar] [CrossRef] [Scilit]
  28. Sagova, Z.; Kuznetsov, P.; Evstigneev, V.; Krenicky, T.; Voronin, D.; Kotelnikov, D.; Yakimovich, B. Improving the Accuracy of Air Temperature Monitoring for Automated Tasks in Agriculture Using Affordable Meteorological Equipment. Acta Technol. Agric. 2025, 28, 176–182. [Google Scholar] [CrossRef] [Scilit]
  29. Dai, W.; Tan, M.; Zhu, H. Design of a radiation shield applied to surface air temperature monitoring. J. Instrum. 2023, 18, P02015. [Google Scholar] [CrossRef] [Scilit]
  30. Botero-Valencia, J.S.; Mejia-Herrera, M.; Pearce, J.M. Design and implementation of 3-D printed radiation shields for environmental sensors. HardwareX 2022, 11, e00267. [Google Scholar] [CrossRef] [Scilit] [PubMed]
  31. Lacombe, M. Results of the WMO intercomparison of thermometer screens/shields and hygrometers in hot desert conditions. In Proceedings of the TECO-2010—WMO Technical Conference on Meteorological and Environmental Instruments and Methods of Observation, Helsinki, Finland, 30 August–1 September 2010; Volume 30. [Google Scholar]
  32. Emmanuel, R. Urban Climate Challenges in the Tropics: Rethinking Planning and Design Opportunities; Imperial College Press: London, UK, 2016. [Google Scholar]
  33. Abdinoor, J.A.; Hashim, Z.K.; Horváth, B.; Zsebő, S.; Stencinger, D.; Hegedüs, G.; Bede, L.; Ijaz, A.; Kulmány, I.M. Performance of Low-Cost Air Temperature Sensors and Applied Calibration Techniques—A Systematic Review. Atmosphere 2025, 16, 842. [Google Scholar] [CrossRef] [Scilit]
  34. Rodríguez-Rama, J.A.; Madrigal, L.P.; Lázaro, A.M.; Lorenzo, J.M.; Laso, A.G.; Mustelier, J.L.C.; Martín-Sánchez, D.A. Metrological Validation of Low-Cost DS18B20 Digital Temperature Sensors Using the TH-001 Procedure: Calibration Models, Uncertainty, and Reproducibility. Metrology 2026, 6, 21. [Google Scholar] [CrossRef] [Scilit]
  35. Vellei, M.; Herrera, M.; Fosas, D.; Natarajan, S. The influence of relative humidity on adaptive thermal comfort. Build. Environ. 2017, 124, 171–185. [Google Scholar] [CrossRef] [Scilit]
  36. Gum, J. Guide to the Expression of Uncertainty in Measurement—Part 6: Developing and Using Measurement Models; JCGM GUM-6:2020; Joint Committee for Guides in Metrology (JCGM): Sèvres, France, 2020. [Google Scholar]
  37. Steadman, R.G. A Universal Scale of Apparent Temperature. J. Appl. Meteorol. Climatol. 1984, 23, 1674–1687. [Google Scholar] [CrossRef] [Scilit] [PubMed]
  38. Budd, G.M. Wet-bulb globe temperature (WBGT)—Its history and its limitations. J. Sci. Med. Sport 2008, 11, 20–32. [Google Scholar] [CrossRef] [Scilit] [PubMed]
  39. Jendritzky, G.; de Dear, R.; Havenith, G. UTCI-Why another thermal index? Int. J. Biometeorol. 2011, 56, 421–428. [Google Scholar] [CrossRef] [Scilit] [PubMed]
  40. Bröde, P.; Fiala, D.; Błażejczyk, K.; Holmér, I.; Jendritzky, G.; Kampmann, B.; Tinz, B.; Havenith, G. Deriving the operational procedure for the Universal Thermal Climate Index (UTCI). Int. J. Biometeorol. 2012, 56, 481–494. [Google Scholar] [CrossRef] [Scilit] [PubMed]
  41. Mobaraki, B.; Komarizadehasl, S.; Castilla Pascual, F.J.; Lozano-Galant, J.A. Application of Low-Cost Sensors for Accurate Ambient Temperature Monitoring. Buildings 2022, 12, 1411. [Google Scholar] [CrossRef] [Scilit]
  42. Martín-Garín, A.; Millán-García, J.; Baïri, A.; Millán-Medel, J.; Sala-Lizarraga, J. Environmental monitoring system based on an Open Source Platform and the Internet of Things for a building energy retrofit. Autom. Constr. 2018, 87, 201–214. [Google Scholar] [CrossRef] [Scilit]
  43. Kim, C.; Cho, J.; Kim, J.; Song, Y.; Kang, J.; Yeon, J. Spall Repair Patch Health Monitoring System Using BIM and IoT. Buildings 2024, 14, 1589. [Google Scholar] [CrossRef] [Scilit]
  44. Peel, M.C.; Finlayson, B.L.; McMahon, T.A. Updated world map of the Köppen-Geiger climate classification. Hydrol. Earth Syst. Sci. 2007, 11, 1633–1644. [Google Scholar] [CrossRef] [Scilit]
  45. Lalic, B.; Eitzinger, J.; Foken, T.; Weidinger, T. (Eds.) Micrometeorological Measurements: An Introduction for Beginners; Springer Textbooks in Earth Sciences, Geography and Environment; Springer Nature Switzerland: Cham, Switzerland, 2026. [Google Scholar] [CrossRef] [Scilit]
  46. Willmott, C.J. Some Comments on the Evaluation of Model Performance. Bull. Am. Meteorol. Soc. 1982, 63, 1309–1313. [Google Scholar] [CrossRef] [Scilit]
  47. Arion, I.D.; Morar, I.M.; Truta, A.M.; Cervelli, E.; Brîndușa, R.A.; Arion, F.H. Designing IoT Sensor Networks for Microclimate Monitoring Across the Urban–Forest Gradient: From Urban Heat Drivers to Forest Buffering Mechanisms. Sustainability 2026, 18, 5253. [Google Scholar] [CrossRef] [Scilit]
  48. Bala, R.S.; Hosseinzadeh, S.; Sadeghineko, F.; Thomson, C.S.; Emmanuel, R. A Portable Non-Motorized Smart IoT Weather Station Platform for Urban Thermal Comfort Studies. Future Internet 2025, 17, 222. [Google Scholar] [CrossRef] [Scilit]
  49. Lau, K.; Lam, C.K.C.; Krüger, E.; Nouri, A.S.; Peng, Z.; Santucci, D.; Matzarakis, A. From street level to science: Advancing methods for climate walks to improve human thermal comfort. Int. J. Biometeorol. 2026, 70, 112. [Google Scholar] [CrossRef] [Scilit] [PubMed]
  50. Sakalis, V.D.; Tsatalas, S.A. Comparative testing of selected solar radiation shields under hot Mediterranean summer conditions. Meteorol. Atmos. Phys. 2024, 136, 23. [Google Scholar] [CrossRef] [Scilit]
  51. Tarara, J.M.; Hoheisel, G.A. Low-cost Shielding to Minimize Radiation Errors of Temperature Sensors in the Field. HortScience 2007, 42, 1372–1379. [Google Scholar] [CrossRef] [Scilit]
  52. Lipina, P.; Procházka, J.; Brabec, M.; Novotný, D.; Geletič, J.; Lehnert, M. Effect of Radiation Shield Type on Air Temperature Measured by Urban Station; Extensive Intercomparison Study in Ostrava, Czech Republic. J. Appl. Meteorol. Climatol. 2026, 65, 587–605. [Google Scholar] [CrossRef] [Scilit]
  53. Wübbeler, G.; Marschall, M.; Kniel, K.; Heißelmann, D.; Härtig, F.; Elster, C. GUM-Compliant Uncertainty Evaluation Using Virtual Experiments. Metrology 2022, 2, 114–127. [Google Scholar] [CrossRef] [Scilit]
  54. Woolliams, E.; Cox, M.; Loizeau, X.; Mittaz, J.; Mota, B.; De Vis, P.; Cobb, A.; Gardiner, T.; Robinson, R.; Hunt, S.; et al. A Metrological Framework for Addressing Uncertainty in Satellite and In Situ Earth Environmental Observations. Surv. Geophys. 2025. [Google Scholar] [CrossRef] [Scilit]
  55. Bilson, S.; Cox, M.; Pustogvar, A.; Thompson, A. A metrological framework for uncertainty evaluation in machine learning classification models. Metrologia 2025, 62, 064001. [Google Scholar] [CrossRef] [Scilit]
Figure 1. Models of the five tested radiation shields: (1) flower-pot saucer shield, (2) 3D-printed ASA multi-plate shield, (3) forced-ventilated ASA multi-plate shield, (4) spherical 3D-printed shield, and (5) PVC chimney-type shield.
Metrology 06 00050 g001
Figure 2. Overview of the reference meteorological station located on the University of La Réunion campus (Le Tampon, France). The numbered elements indicate: (1) cup anemometer used for wind speed measurements, (2) pyranometer used for global horizontal irradiance (GHI) measurements, (3) Campbell Scientific 41303-5A six-plate naturally ventilated radiation shield providing the reference air temperature and relative humidity measurements, and (4) vertical support carrying the five tested low-cost radiation shields.
Metrology 06 00050 g002
Figure 3. Close-up view of the experimental setup showing the five tested low-cost radiation shields and the reference radiation shield. The numbered elements correspond to: (1) flower-pot saucer shield (S1), (2) naturally ventilated ASA multi-plate shield (S2), (3) forced-ventilated ASA multi-plate shield (S3), (4) spherical shield (S4), (5) PVC chimney shield (S5), and (6) reference radiation shield. All sensors were installed at approximately 2 m above ground level and operated simultaneously throughout the experiment.
Metrology 06 00050 g003
Figure 4. Daytime and nighttime RMSE values for the five tested radiation shields. Daytime conditions correspond to GHI > 20 W m−2.
Metrology 06 00050 g004
Figure 5. Daytime and nighttime distributions of temperature errors for the five tested radiation shields.
Metrology 06 00050 g005
Figure 6. Kernel density estimation of temperature measurement errors for the five tested radiation shields.
Metrology 06 00050 g006
Figure 7. Median temperature error ( Δ T ) as a function of global horizontal irradiance (GHI) and wind speed for the five tested radiation shields.
Metrology 06 00050 g007
Figure 8. Median relative humidity error ( Δ R H ) as a function of global horizontal irradiance (GHI) and wind speed for the five tested radiation shields.
Metrology 06 00050 g008
Figure 9. Mean diurnal cycle of median temperature errors for the five tested radiation shields (upper panel) together with the corresponding median diurnal cycles of global horizontal irradiance (GHI) and wind speed (lower panel). Shaded areas represent the interquartile range.
Metrology 06 00050 g009
Figure 10. Comparison of temperature RMSE before and after calibration for each shield and correction model on the independent temporal test period.
Metrology 06 00050 g010
Figure 11. Residual temperature errors after correction for each shield and calibration model on the independent temporal test period.
Metrology 06 00050 g011
Table 1. Main specifications of the SHT31 thermo-hygrometer used in this study.
ParameterValue
Temperature range 40 to 125 °C
Temperature accuracy (datasheet)±0.2 °C
Relative humidity range0–100% RH
Relative humidity accuracy (datasheet)±2% RH
Response time ( τ 63 )∼8 s
Communication protocolI2C
Supply voltage3.3 to 5 V
Typical unit cost∼25 €
Table 2. Summary of the main characteristics of the tested radiation shields. Estimated costs correspond to the shield materials only and are expressed in euros excluding taxes (EUR, 2026 prices). The SHT31 sensor, data logger, power supply, and mounting structure were not included in the cost calculation.
ShieldMaterialVentilationDesign ConceptPower (W)Cost (€)
S1 SaucerPPPassiveMulti-plate shield06.35
S2 ASA passiveASAPassiveMulti-plate shield07.66
S3 ASA forcedASAForcedFan-aspirated multi-plate1.6814.95
S4 SphericalASAPassiveSpherical ventilation05.45
S5 PVC chimneyPVC + ASAPassiveChimney-effect ventilation04.07
Table 3. Meteorological conditions recorded by the reference weather station during the experimental campaign (24 April–28 May 2026).
VariableMeanStdMinMaxMedian
Air temperature (°C)20.53.513.229.619.9
Relative humidity (%)82.89.947.398.684.2
Wind speed (m s−1)0.71.10.05.60.0
Global irradiance (W m−2)185276011870
Rainfall (mm)0.00.00.01.40.0
Pressure (hPa)998.21.0995.01001.0998.0
Table 4. Overall performance metrics of the five tested radiation shields relative to the reference weather station.
ShieldVariableMBEMAERMSE SD error Pearson r R 2
S1Temperature0.160.450.710.690.990.96
S1Relative humidity−7.027.027.392.310.990.44
S2Temperature0.240.520.820.780.990.94
S2Relative humidity−0.042.112.692.690.990.93
S3Temperature0.430.480.680.530.990.96
S3Relative humidity−1.341.892.652.290.990.93
S4Temperature0.240.600.920.890.990.93
S4Relative humidity−3.433.454.753.290.980.77
S5Temperature0.230.901.181.160.990.88
S5Relative humidity−3.443.565.223.930.970.72
Table 5. Linear relationship between temperature and relative humidity errors for each radiation shield.
ShieldSlope (% RH °C−1) R 2
S1 Saucer−3.050.84
S2 ASA passive−3.250.89
S3 ASA forced−3.700.74
S4 Spherical−3.500.90
S5 PVC chimney−3.300.94
Table 6. Performance of the calibration models applied to temperature measurements on the independent temporal test period.
ShieldModelMBEMAERMSE SD error R 2 RMSE Reduction (%)
S1Raw0.060.380.580.580.960.00
S1Linear−0.070.230.370.360.9936.62
S1Semi-empirical−0.060.210.340.340.9940.85
S1Polynomial−0.060.210.340.340.9940.88
S1Random Forest0.110.190.330.310.9943.84
S2Raw0.120.450.660.650.950.00
S2Linear−0.080.240.390.390.9840.32
S2Semi-empirical−0.070.230.370.360.9943.69
S2Polynomial−0.070.220.370.360.9943.93
S2Random Forest0.070.180.300.290.9954.87
S3Raw0.390.450.650.520.960.00
S3Linear−0.010.190.330.330.9948.61
S3Semi-empirical−0.000.200.340.340.9946.75
S3Polynomial−0.000.190.330.330.9949.40
S3Random Forest0.110.200.330.310.9948.83
S4Raw0.110.520.770.760.940.00
S4Linear−0.070.270.440.440.9842.76
S4Semi-empirical−0.060.240.400.400.9847.59
S4Polynomial−0.060.240.400.400.9847.75
S4Random Forest0.100.180.310.290.9959.98
S5Raw0.090.831.081.080.880.00
S5Linear−0.070.400.560.560.9747.99
S5Semi-empirical−0.060.390.550.540.9749.41
S5Polynomial−0.070.380.540.540.9749.71
S5Random Forest0.180.250.370.330.9965.68
Table 7. Coefficients of the semi-empirical temperature error correction model fitted on the training period. RMSE values correspond to the independent temporal test period.
ShieldabcRMSERMSE Reduction (%)
S10.01285.45−0.210.3440.85
S20.01887.04−0.190.3743.69
S30.015410.000.170.3446.75
S40.01605.07−0.260.4047.59
S50.039110.00−0.420.5549.41
Disclaimer/Publisher’s Note: The statements, opinions and data contained in all publications are solely those of the individual author(s) and contributor(s) and not of MDPI and/or the editor(s). MDPI and/or the editor(s) disclaim responsibility for any injury to people or property resulting from any ideas, methods, instructions or products referred to in the content.