Article

Beyond Hertz: Accurate Analytical Force–Indentation Equations for AFM Nanoindentation with Spherical Tips

by
Stylianos-Vasileios Kontomaris
1,*,
Anna Malamou
2,
Gamal M. Ismail
3,
Anna Katsiki
4 and
Andreas Stylianou
1,*
1
School of Sciences, European University Cyprus, Nicosia 2404, Cyprus
2
BioNanoTec Ltd., Nicosia 2043, Cyprus
3
Department of Mathematics, Faculty of Science, Islamic University of Madinah, Madinah 42351, Saudi Arabia
4
Department of Electrical and Computer Engineering, University of Patras, 26504 Patras, Greece
*
Authors to whom correspondence should be addressed.
Metrology 2025, 5(4), 63; https://doi.org/10.3390/metrology5040063
Submission received: 26 July 2025 / Revised: 15 October 2025 / Accepted: 21 October 2025 / Published: 23 October 2025

Abstract

The Hertz equation is the most widely used equation for data processing in AFM nanoindentation experiments on soft samples when using spherical indenters. Although valid only for small indentation depths relative to the tip radius, it is usually preferred because it directly relates applied force to indentation depth. Sneddon derived accurate equations relating force and contact radius to indentation depth for shallow and deep indentations, but they are rarely used in practice. This paper presents analytical approaches to solving Sneddon’s nonlinear system. Using Taylor series expansions and a simple equation linking applied force, average contact radius, and indentation depth, we derive a two-term equation that directly relates force to indentation depth. This expression is accurate for h ≤ 1.5 R, where h is the indentation depth and R is the indenter radius, making it applicable to most practical AFM measurements on soft materials. It should be used instead of the Hertzian model for extracting Young’s modulus, thereby enhancing measurement accuracy without increasing the complexity of data processing. In addition, the results are generalized to produce a series solution that is valid for large indentation depths. The newly derived equations proposed in this paper are tested on both simulated and experimental data from cells, demonstrating excellent accuracy.

1. Introduction

Atomic Force Microscopy (AFM) is a powerful tool for the morphological and mechanical characterization of soft biological samples due to its ability to operate under near-physiological conditions [1,2,3,4,5]. In addition, AFM applications extend far beyond structural and mechanical characterization at the nanoscale, as it has also been proven to serve as a diagnostic tool [6,7]. A major application of AFM is in cancer diagnosis. The mechanical properties of normal and cancerous cells differ significantly, with cancerous cells typically being softer than normal ones [8,9,10,11,12,13,14,15,16,17]. The sensitivity provided by AFM, which applies forces on the order of picoNewtons, makes it the most appropriate tool for detecting mechanical differences between normal and cancerous cells [8,12]. In addition, AFM can be used for direct cancer diagnosis by testing tissue samples. Plodinec et al. were the first to show that stiffness distributions, expressed in terms of Young’s modulus, differ significantly between normal and cancerous tissues. Normal tissues exhibit a uniform single-peak distribution, while malignant tissues show a distribution with two distinct maxima, commonly referred to as the Low Elasticity Peak (LEP) and the High Elasticity Peak (HEP) [18,19,20,21,22,23]. It is also important to note that the diagnostic capabilities of AFM extend far beyond cancer, as it has also been used to detect various pathological conditions such as osteoarthritis [24,25] and Alzheimer’s disease [26,27,28,29], among other disorders [1,30].
Mechanical nanocharacterization using AFM is based on fitting appropriate contact mechanics models to the force–indentation data, with Young’s modulus determined as a fitting parameter at the point of interest [31,32]. The mathematical model used for data processing is chosen based on the geometry of the indenter (e.g., spherical or pyramidal) and the indentation rate [32,33,34,35,36,37,38]. For very soft materials and low indentation rates with spherical indenters, the Hertz model is preferred in most cases due to the simplicity of the fitting process [32]:
F = 4 3 E R 1 / 2 h 3 / 2 ,
where F is the applied force on the material, R is the indenter’s radius, h is the indentation depth, E = E / ( 1 v 2 ) is the reduced modulus and E, v are the Young’s modulus and the Poisson’s ratio of the material, respectively. Equation (1) applies under the condition that the indentation depth is significantly smaller than the tip radius (h ≪ R) [39]. A typical limit is usually h < R/10 [39]. For large indentation depths, Equation (1) is no longer appropriate. In this case, Sneddon’s equations should be used instead [40,41]:
F = E 2 1 v 2 r c 2 + R 2 l n R + r c R r c 2 r c R ,
where r c is the contact radius between the indenter and the sample. The indentation depth is related to the contact radius and the indenter’s radius by the following equation [40,41]:
ln R + r c R r c = 2 h r c .
The system of Equations (2) and (3) cannot be solved analytically to derive an equation that directly relates the applied force to the indentation depth, which would simplify data processing. The reason is that the contact radius is strongly depth dependent, varying from r c = R h for shallow indentations (Hertzian limit) to r c R for very deep indentations [40]. For this reason, empirical or numerical equations have been derived to enable direct data processing. In the work of Müller et al., an empirical equation based on a parabolic indenter and a truncated power series approximation was presented; as stated within the paper, this expression was provided through personal communication with Wolfgang Dobler (JPK Instruments, Berlin, Germany) [42]:
F = 4 3 E 1 v 2 R 1 / 2 h 3 / 2 1 1 10 h R 1 840 h R 2 + 11 15,120 h R 3 + 1357 6,652,800 h R 4 .
Although accurate in most cases, Equation (4) produces significant errors at very large indentation depths. Two years later, Kontomaris and Malamou used numerical methods to derive an exact equation relating the applied force to the indentation depth for large h/R ratios [40]:
F = 4 E R 1 2 3 1 v 2 h 3 2 c 1 + M = 2 N 3 2 Μ c M R ( 3 2 M ) h M 3 / 2 .
Equation (5) can be safely used instead of Equations (2) and (3) for deep indentations. However, it should be noted that the number of terms to be used and the exact values of the coefficients c 1 , c 2 , , c N depend on the h/R ratio. Usually, for very large indentation depths, six terms should be used, and the appropriate coefficients are presented as follows: c 1 = 1.0100000 , c 2 = 0.0730300 , c 3 = 0.1357000 , c 4 = 0.0359800 , c 5 = 0.0040240 and c 6 = 0.0001653 [40]. A disadvantage of Equation (5) is that it introduces errors for low h/R ratios, within the range where the classical Hertzian model (Equation (1)) remains valid. The reason is that the coefficients c 1 , c 2 , , c N were determined to reproduce the results of Sneddon’s equations for large h/R ratios (where h / R ).
The goal of this work is to present the first fully analytical derivation of a direct force–indentation equation, without relying on numerical or empirical approaches. In addition, our goal is to provide an analytical equation that offers excellent accuracy across the entire range—from the Hertzian limit (h ≪ R) to intermediate cases and large indentations. This is important in practical applications, as it eliminates the need to switch between different models or use hybrid fitting approaches. We will first focus on providing a simple two-term equation suitable for small and intermediate indentation depths. Subsequently, we will extend the previous findings to the case of large indentation depths and present a unified expression valid across a common domain. In this way, the same equation can be used for both the Hertzian limit at very small indentations and larger depths, facilitating data processing for scientists working in the AFM field.
This paper is organized as follows: In Section 2.1, an analytical method for deriving the two-term force–indentation depth relationship is presented. In Section 2.2, the results are generalized using a series solution valid for deep indentations. In Section 2.3, the protocol for testing the proposed equations using simulated data and experimental data from cells is presented. In Section 3 (Results), the analytical equations derived in Section 2.1 and Section 2.2 are compared to the numerical solution of Sneddon’s equations (Equations (2) and (3)) and to other existing empirical or numerical solutions (Equations (4) and (5)) to demonstrate their increased accuracy and reliability. In addition, simulated data and experimental data from cancer cells are used to further evaluate the accuracy of the proposed approach. In Section 4 (Discussion), several practical aspects of the proposed approach are presented, including the potential to correct existing equations used for shallow sphero-conical indentations and its relevance to the major challenge of heterogeneous samples, such as cells.

2. Materials and Methods

2.1. An Analytical Approach to Obtain a Force–Indentation Relationship

In most practical cases, the maximum indentation depth does not exceed the indenter’s radius. Therefore, we can derive a simple two-term solution for these applications, which is easy to apply and suitable for developing new elementary fitting algorithms. First, we will re-formulate Equation (3) with respect to the variable x = r c / R .
h R = 1 2 r c R ln 1 + r c R 1 r c R y = 1 2 x l n 1 + x 1 x = 1 2 x [ l n 1 + x l n 1 x ] ,
where y = h / R . Using Taylor series around x = 0 , we obtain:
l n 1 + x = n = 1 1 n + 1 x n n
and,
l n 1 x = n = 1 x n n
Keeping only three terms in Equations (7) and (8) and substituting them into Equation (6), we conclude
y = 1 2 x n = 1 1 n + 1 x n n + n = 1 x n n 1 2 x x x 2 2 + x 3 3 + x + x 2 2 + x 3 3 = x 2 + 1 3 x 4
Equation (9), can be easily solved with respect to x (where x > 0). In particular, Equation (9) can be modified as follows:
x 2 2 + 3 x 2 3 y = 0
Let, x 2 = t x = t . Therefore, Equation (10) takes the form: t 2 + 3 t 3 y = 0 . Since t > 0 , we keep only the following solution:
t = 3 + 12 y + 9 1 / 2 2 x y = 12 y + 9 1 2 3 2 1 / 2 = 1 2 3 1 + 4 y 3 1 2 3 1 / 2
Using a Taylor series expansion around y = 0 for the term 1 + 4 y 3 1 / 2 we conclude:
1 + 4 y 3 1 / 2 = n = 0 1 / 2 n 4 y 3 n 1 + 2 y 3 2 y 2 9 +
Using only three terms of Equation (12), Equation (11) is simplified as follows:
x y 1 2 3 1 + 2 y 3 2 y 2 9 3 1 2 = y y 2 3 1 2 = y 1 2 1 y 3 1 2
In addition, using a Taylor series expansion around y = 0 for the term 1 y 3 1 / 2 we get:
1 y 3 1 / 2 = n = 0 1 / 2 n y 3 n 1 y 6 y 2 72
Using the first two terms in Equation (14), Equation (13) is written in the following simple form:
x y y 1 2 y 3 / 2 6
Finally,
r c = R h 1 / 2 1 6 1 R 1 / 2 h 3 2
Equation (16) provides the contact radius between the spherical indenter and the elastic half space for spherical indentations. It consists of the classic term R h provided by Hertzian analysis and an appropriate term 1 6 1 R h 3 2 which extends its validity for deeper indentation depths. An important question at this point is how Equation (16) can be used to derive a force–indentation equation. According to Pharr et al. [43], the contact stiffness is related to the contact radius for any axisymmetric indenter as follows:
d F d h = 2 E r c h .
Equation (17), can be re-arranged as below:
F = 2 E 0 h r c y d y + C
where C is the constant of integration. Since for h = 0 , F = 0 is should be C = 0 . In addition, the average contact radius is defined as follows:
r ¯ c = 1 h 0 h r c y d y
Using Equation (19), Equation (18) can be simplified as below:
F = 2 E r ¯ c h
It is also important to note that an alternative derivation of Equation (20), based on classic Sneddon’s equations for axisymmetric indenters [41], is presented in [44]. By substituting Equation (16), to Equation (19) we get:
r ¯ c = 1 h 0 h ( R u 1 / 2 1 6 1 R 1 / 2 u 3 2 ) d u = 2 3 R h 1 / 2 1 15 1 R 1 / 2 h 3 / 2
Finally, by combining Equations (20) and (21) we conclude in:
F = 4 3 E R 1 / 2 h 3 / 2 2 15 E R 1 / 2 h 5 2
Equation (22) is an extension of classic Hertzian Equation (1) for larger indentation depths. It provides results nearly identical to Sneddon’s solution in classical cases where the indentation depth does not exceed the indenter’s radius. However, as will be demonstrated in the following sections, its accuracy extends beyond the limit h = R.

2.2. Extended Solution for Larger Indentation Depths

Equation (15) can be expressed in series form as follows:
x = r c R = n = 0 1 c n y n + 1 / 2
where c 0 = 1 and c 1 = 1 / 6 . Figure 1 presents the r c / R ratio as a function of h / R when using the Hertz model ( r c = R h ) , Sneddon’s model (Equation (3)) and Equation (23). It is evident that a two-terms approximation (Equation (16)) leads to significant underestimation of the contact radius for large indentations. Due to the geometry of the contact, for large indentations we expect that r c R . This behavior is consistent with Sneddon’s equation (Equation (3)). For h R , previous studies [40] have shown that the force–indentation relationship becomes approximately linear. This case is primarily of theoretical interest and lies beyond the objectives of the present study. In this section, we will focus on moderately large indentation depths. Since the truncated series (Equation (23)) deviates significantly for large h/R, the physics of the contact demands the inclusion of higher-order terms to enhance the accuracy. Therefore, the idea is to include additional terms with appropriate coefficients in order for our solution to closely match Sneddon’s solution for practical applications. Thus, we can consider higher order terms in Equation (23) as follows:
x = r c R = n = 0 m c n y n + 1 / 2 = c 0 y 1 / 2 + c 1 y 3 / 2 + + c m y m + 1 / 2
The coefficients c 2 , ,   c m can be systematically calculated using Equation (6). To illustrate this, consider an indentation ratio y = h/R = 1.5, which lies in the regime where the two-term series begins to lose accuracy (see Figure 1). In this case, Equation (6) results in x 0.925 . Substituting into the three-term series form we obtain:
x = c 0 y 1 / 2 + c 1 y 3 / 2 + c 2 y 5 / 2 c 2 = 0.925 1.5 1 2 + 1 6 1.5 3 / 2 1.5 5 / 2 0.0023
To further extend the applicability of Equation (24) to even larger indentation depths, a fourth term c 3 can be introduced. Consider an indentation ratio y = h/R = 2.5, representative of a large indentation regime. Using Equation (6), the corresponding contact radius ratio is calculated as x 0.988 . Thus,
x = c 0 y 1 / 2 + c 1 y 3 / 2 + c 2 y 5 / 2 + c 3 y 7 / 2 c 3 = 0.988 2.5 1 2 + 1 6 2.5 3 2 0.0023 2.5 5 2 2.5 7 / 2 0.0017
In other words, the mathematical approach is straightforward: we include additional terms in the series solution (Equation (24)) to ensure agreement with the classical Sneddon’s solution. Then, we calculate the appropriate coefficients so that the two equations match each other. It is also interesting to note that the underestimation of the contact radius in Equation (16) also explains the positive values of the coefficients c 2 and c 3 .
It should be clarified that the present series expansion is formally derived for small values of h / R and r c / R , and thus its direct asymptotic validity for h R is limited. In this work, the inclusion of higher-order terms is not intended to model the full-contact regime but rather to extend the applicability of the formulation to moderately large indentation depths with practical applications ( h / R > 1 ), where lower-order approximations begin to lose accuracy. The additional coefficients were determined to ensure agreement with the exact (Sneddon) solution within this range, providing a physically consistent and accurate description of the contact behavior. We note that, although the magnitude of the series terms decreases with increasing order, this does not ensure formal convergence of the series for large h / R .
Using Equation (24) and the coefficients already calculated above, we can calculate the average radius:
r ¯ c = 1 h 0 h c 0 R u 1 / 2 + c 1 1 R 1 2 u 3 2 + c 2 1 R 3 2 u 5 2 + c 3 1 R 5 2 u 7 2 d u 2 3 R h 1 2 2 30 1 R 1 2 h 3 2 + 2 3000 1 R 3 2 h 5 2 + 2 5000 1 R 5 2 h 7 2
Equation (27) can also be written in the simple form:
r ¯ c R = 2 n = 0 3 1 n + 2 1 d n h R n + 1 2
where
d n = { 3 30 3000 5000 n = 0 n = 1 n = 2 n = 3
Figure 1 also presents the r c / R ratio as a function of h / R for the four-term approximation equation (Equation (27)). It is evident that the four-term solution stabilizes the r c / R ratio at unity even for h / R = 5 , in accordance with the physical and geometric principles of the problem.
In addition, using Equation (20) we conclude:
F = 4 E R 2 n = 0 3 1 n + 2 1 d n h R n + 3 2
or,
F = 4 3 E R 1 2 h 3 2 4 30 E R 1 2 h 5 2 + 4 3000 1 R 3 2 h 7 2 + 4 5000 1 R 5 2 h 9 2
The same procedure can also be applied on a theoretical basis for even deeper indentations using the following general equation:
F = 4 E R 2 n = 0 m 1 n + 2 1 d n h R n + 3 2
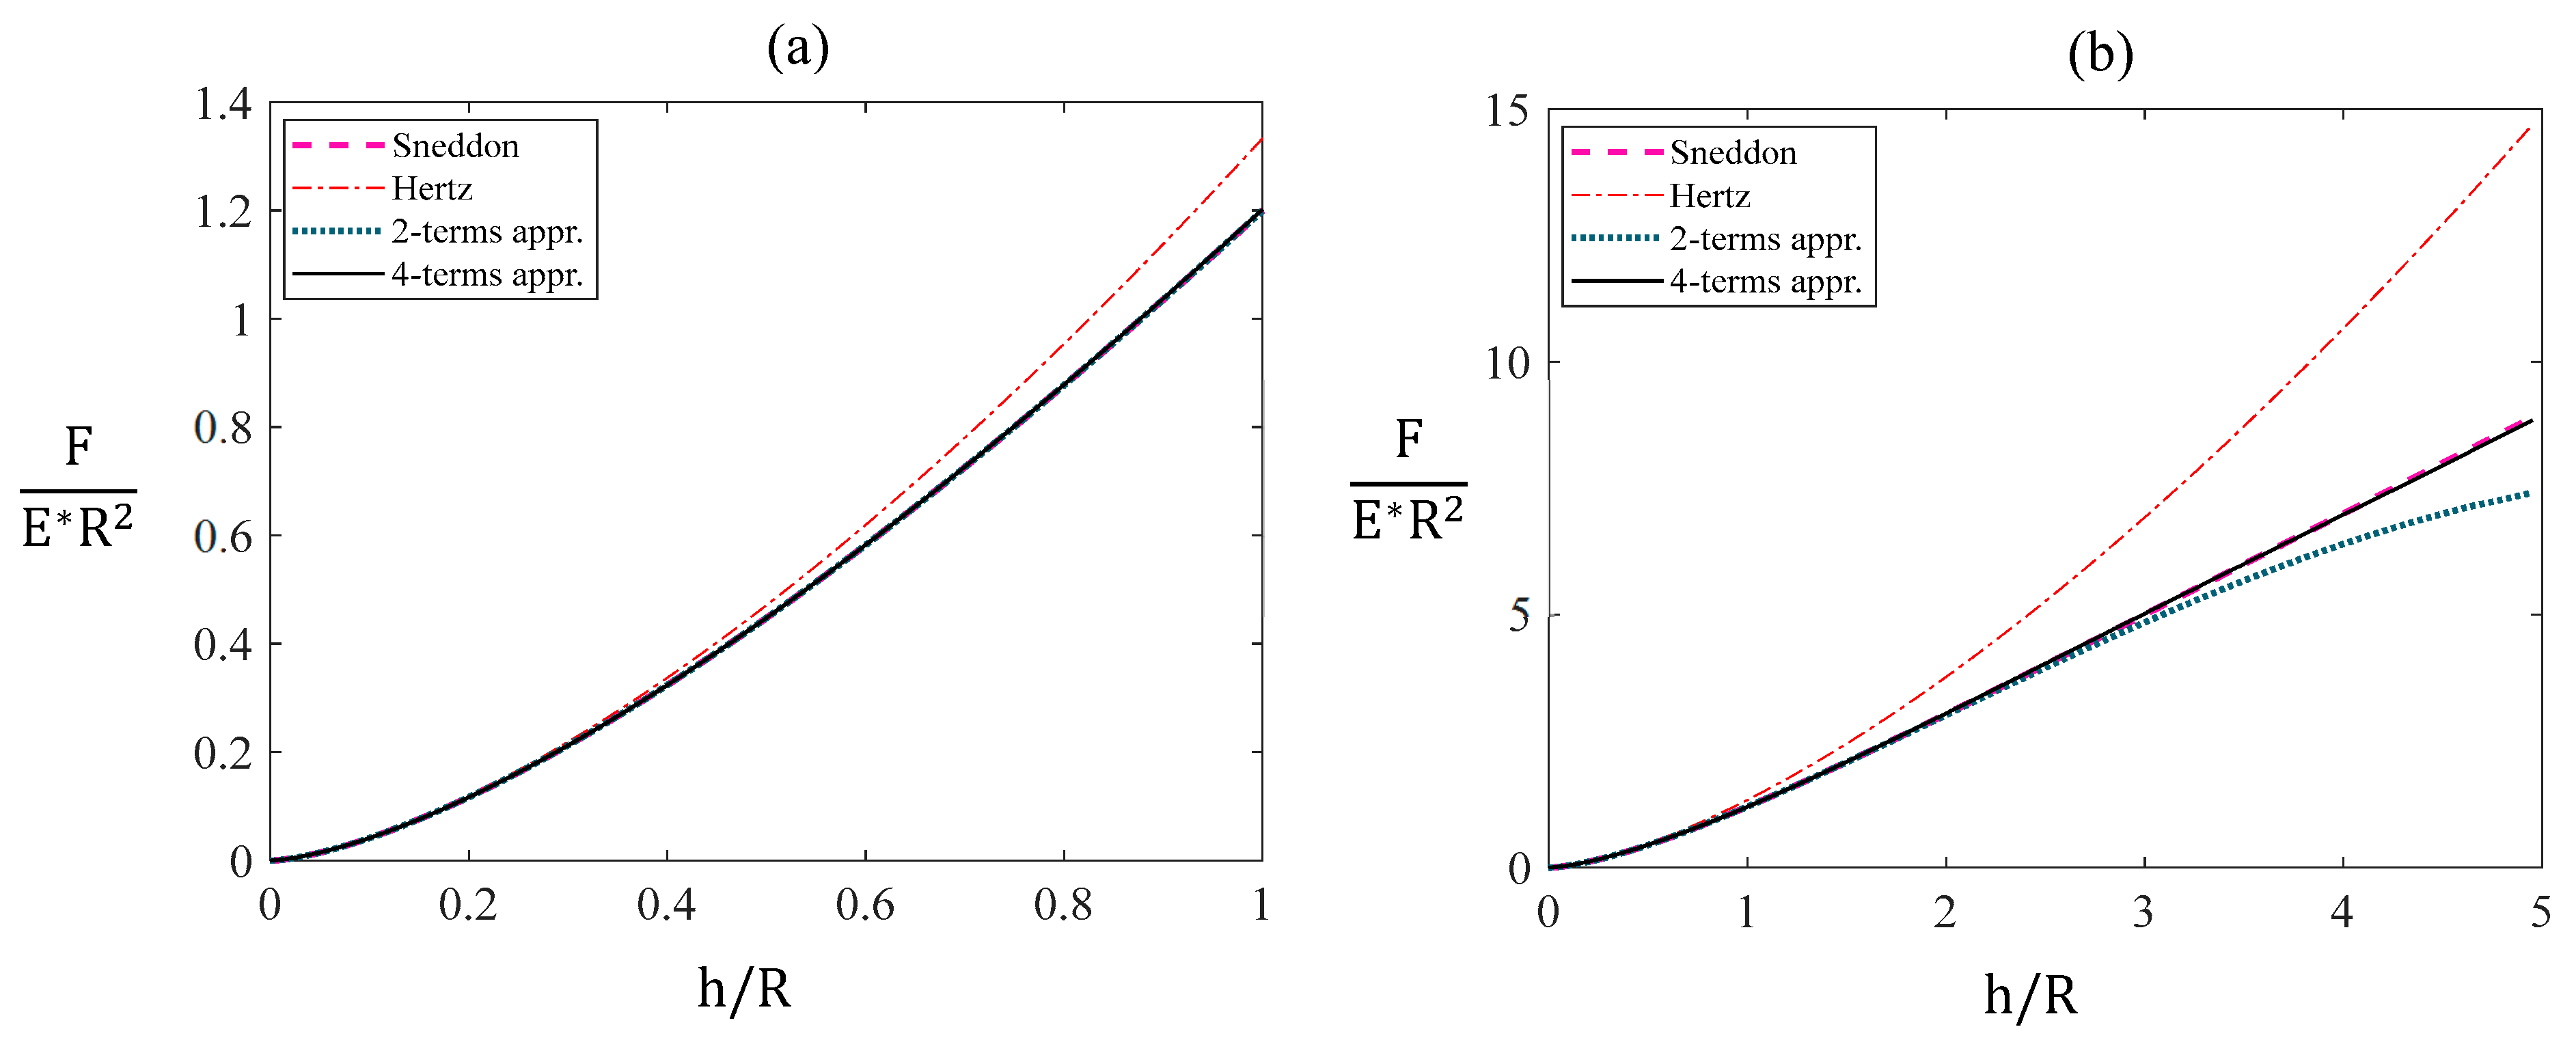
where m denotes an arbitrary positive integer. In Figure 2, the variation of F E R 2 with respect to h R is shown when using Hertz equation (Equation (1)), classic Sneddon’s equations (Equations (2) and (3)) and when using Equations (22) and (31). The results are presented for comparison in the domain 0 h / R 1 (Figure 2a) and in the domain 0 h / R 5 (Figure 2b). A two-term approximation in Equation (32) underestimates the applied force for deep indentations. A four-term approximation provides accurate results even for h / R = 5 .

2.3. Simulated and Experimental Results

In this paper, we used open-access simulated data for an elastic half-space with a Young’s modulus of 20 kPa and a Poisson’s ratio of 0.5 [45] (The data can be found at the following link: https://sourceforge.net/projects/jrobust/files/ (accessed on 1 June 2025) by selecting “Files”, then “Test Files”, and finally downloading “SimulatedCurves.rar”). The simulated force–indentation data were generated in Mathematica 8.0 to emulate real force curves acquired using tips of spherical geometries mounted on a cantilever with a spring constant of 0.1 N/m. The curves were produced based on the appropriate force–indentation relationships, with random Gaussian-distributed noise added to simulate experimental variability. The simulation assumed spherical indenters with a radius of 1 μm. In addition, simulated curves using spheroconical indenters (from the same repository) with a radius of 0.2 μm and a cone half-angle of 35° were also used. We also used simulated data obtained through the finite element analysis (FEA) method, following the procedure described in [46,47]. More specifically, to simulate nanoindentation of an elastic half-space, an axisymmetric geometry consisting of a spherical indenter and an elastic half-space is considered [46,47]. The computational domain includes two regions: the indenter with a spherical tip of radius R = 1 μm and the elastic half-space (specimen). The specimen’s width and height, W and H, are chosen much larger than R to minimize finite-size effects. According to [46,47], setting W and H equal to ten times R ensures size-independent results. To simulate penetration of the elastic half-space, a fixed support is applied at the bottom boundary of the specimen, while its right boundary remains free. A uniform downward force is applied at the top of the indenter [46,47]. Contact between the indenter and the specimen is modeled using the augmented Lagrange method, which provides highly accurate results [47]. Both the indenter and the specimen are modeled as linear elastic materials defined by their Young’s modulus and Poisson’s ratio. To ensure that the indenter behaves as a rigid body, its modulus is set much higher than that of the specimen. Specifically, the Young’s modulus of the indenter is set to 240 GPa, while that of the tested material is 100 kPa. Poisson’s ratios are set to 0.2 for the indenter and 0.5 for the specimen [47]. The computational domain is meshed with quadrilateral elements of size 5 × 10⁻⁸ m, which has been previously verified to yield mesh-independent results [47]. All simulations were performed using ANSYS Academic Mechanical 2025 R2.
Furthermore, indentation experiments were performed on A172 human glioma cells (ATCC) using a spherical probe with a 2.5 μm radius. The cantilever’s spring constant was measured at 0.08 N/m using the thermal noise method [48]. The Poisson’s ratio was considered to be equal to 0.5. The experimental procedure followed the protocol described by Louca et al. [49]. The quality of each fitting was assessed using the R-squared coefficient (R2), with values closer to 1 indicating higher accuracy.

3. Results

Figure 3 presents the errors associated with the Müller et al. equation (Equation (4)), the equation by Kontomaris and Malamou (Equation (5)), the simple two-term equation (Equation (22)), and the four-term approximation (Equation (31)) proposed in this paper, for comparison. The error is calculated in any case using the following equation:
ε % = F F S n e d d o n 1 100 %   .
From Figure 3a, it is evident that both Müller’s equation and the two- and four-term approximations provide results that are nearly identical to Sneddon’s solutions for small indentation depths.
The numerical solution (Equation (5)) has the disadvantage of exhibiting an error for shallow indentations, where the classical Hertzian equation applies. This is an expected result, as the model was specifically designed to capture the force–indentation relationship for deep indentations [40]. Figure 3b shows that Müller’s equation fails to capture the system’s behavior for deep indentations. Furthermore, the two-term approximation proposed in this paper (Equation (22)) also leads to a significant error. On the contrary, the numerical solution (Equation (5)) and the proposed four-term equation (Equation (31)) provide excellent accuracy. The accuracy of Equation (31) is remarkable, considering that it is based on only a four-term truncated series solution. An important initial result from the analysis presented here is that the simple two-term Equation (22) provides excellent accuracy in nearly all practical cases, as the associated error remains negligible up to h 1.5 R. In addition, the four-term approximation provides accurate results for any indentation depth. Thus, the proposed approach is not only the first to be derived using mathematical tools and physical considerations, but it is also the most appropriate and straightforward for real applications involving shallow, deep, and very deep indentations.
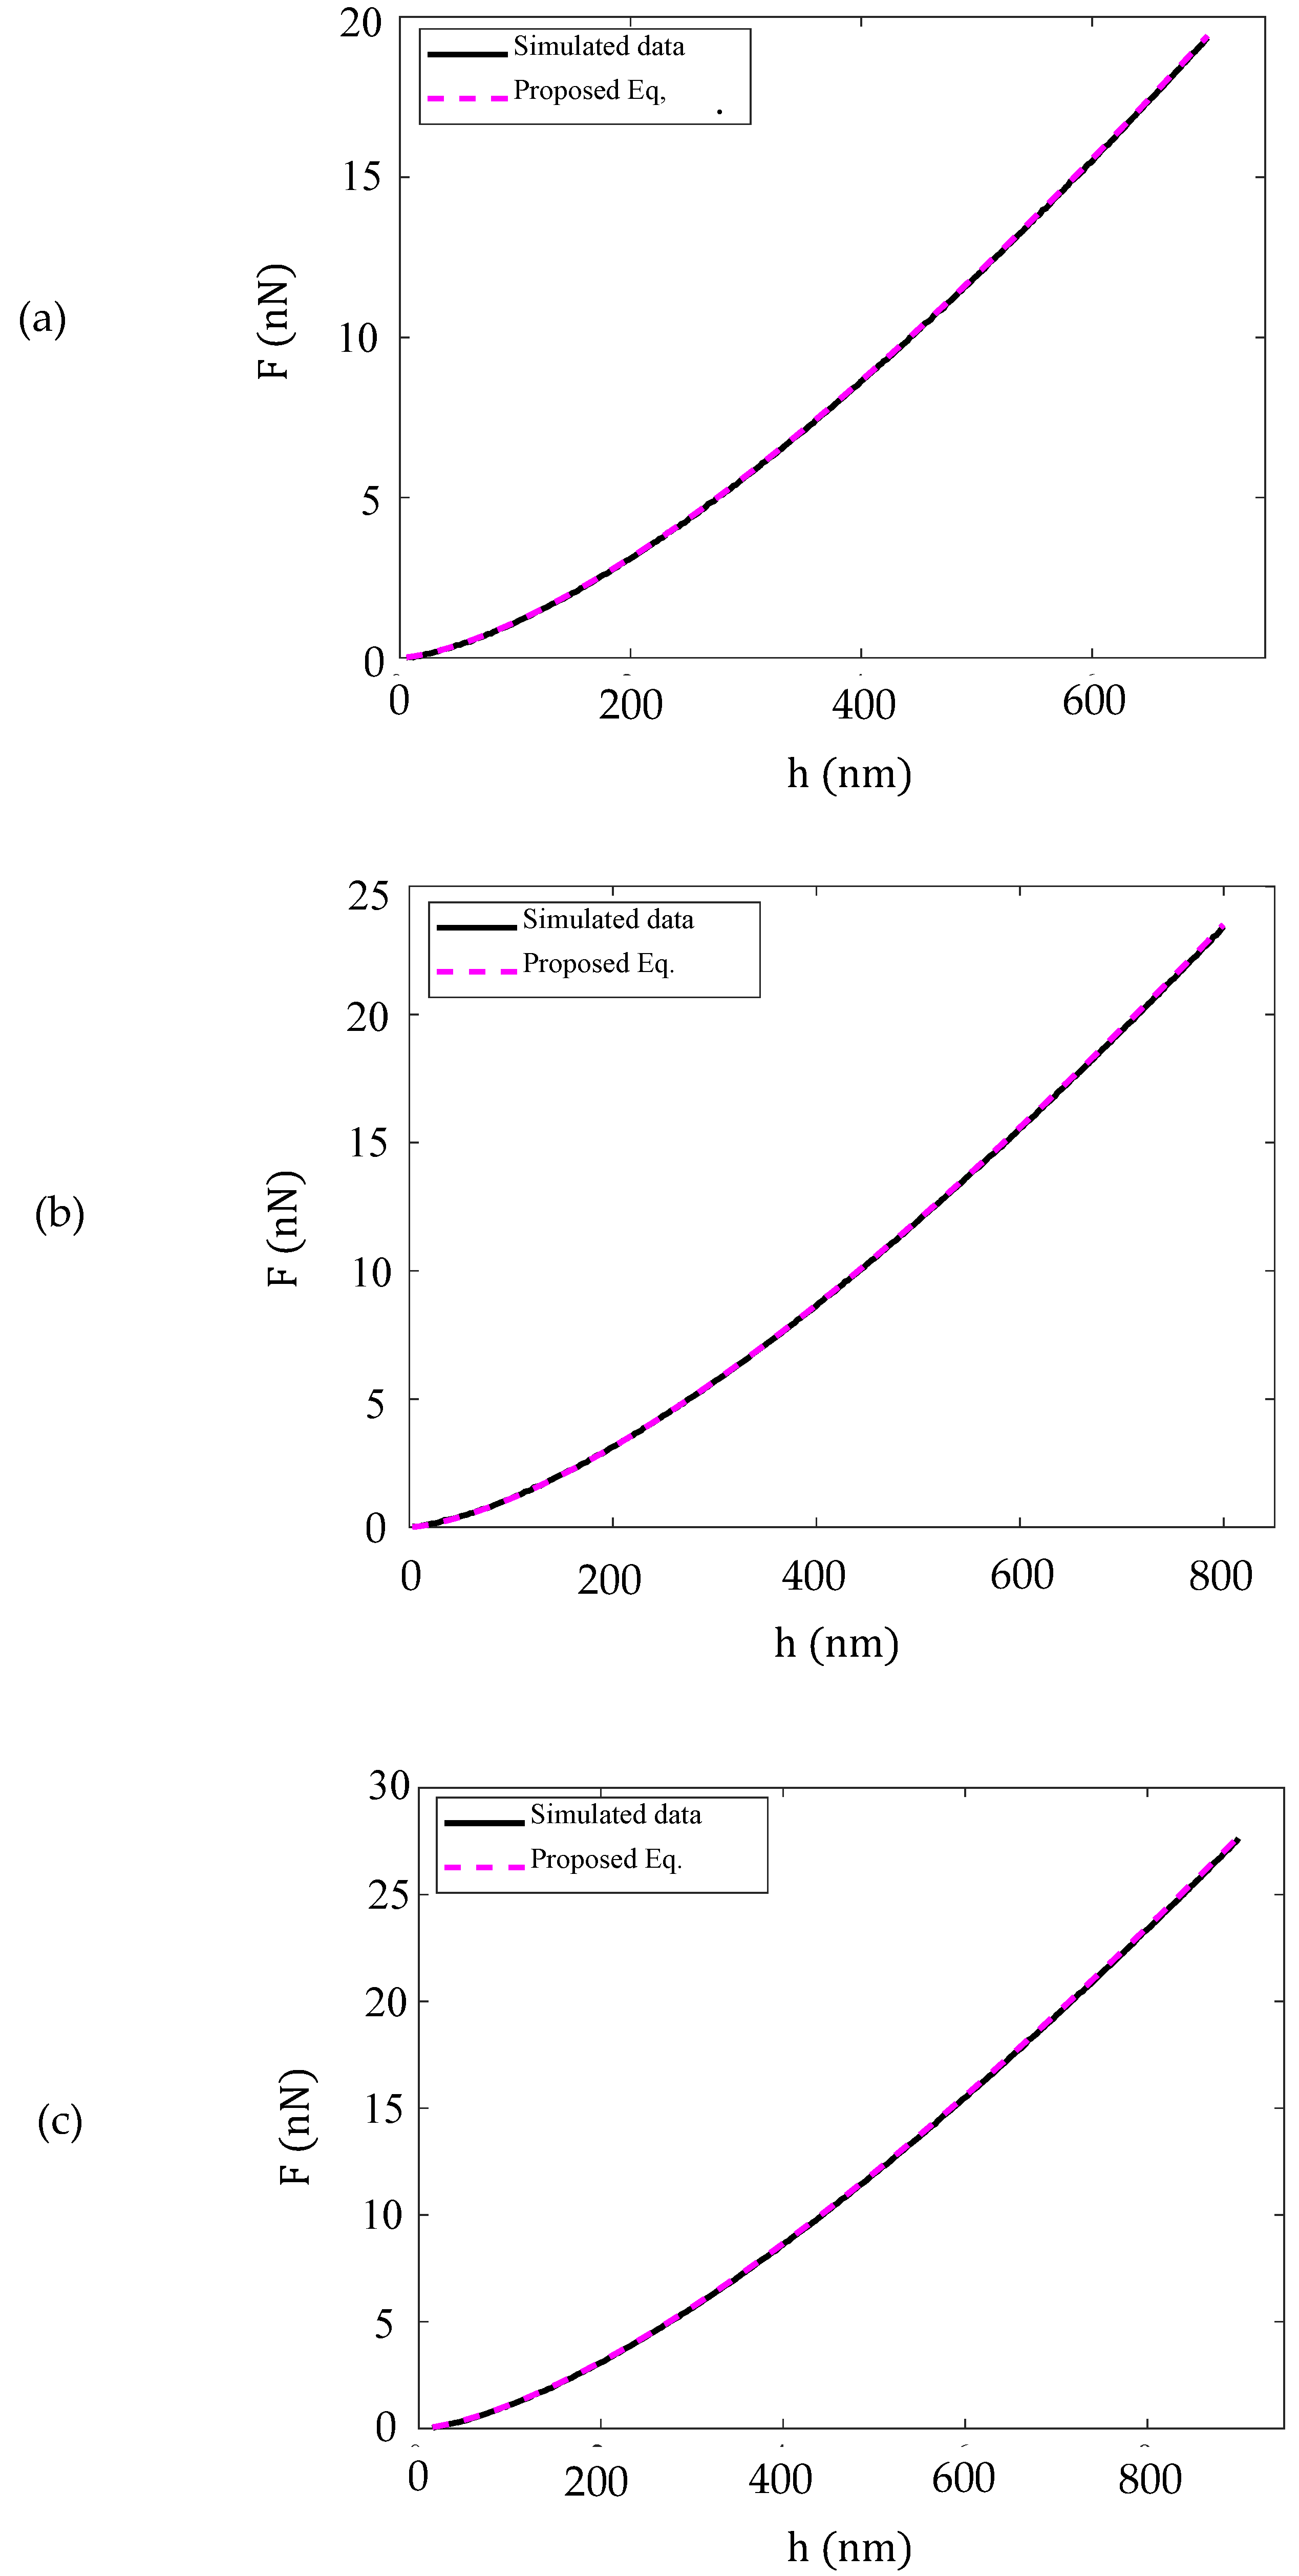
Equation (22) was also tested to simulated and experimental data according to the protocol presented in Section 2.3. In particular, in Figure 4, simulated data from the AtomicJ repository are presented. The maximum indentation depth is 700 nm in Figure 4a, 800 nm in Figure 4b, and 900 nm in Figure 4c. Equation (22) was fitted to the data in all cases, resulting in values of 20.05 kPa, 20.10 kPa, and 20.07 kPa, respectively. In all cases, the R-squared coefficient was 1.0000.
In addition, Figure 5 presents simulated data obtained from FEA modeling of an elastic half-space with a Young’s modulus of 100 kPa and a Poisson’s ratio of 0.5 as described in Section 2.3 [46]. The data were fitted to Equation (22), resulting in:
F = 5758 · 10 6 h 3 2 3.819 · 10 7 h 5 2   ,  
where F is expressed in nN and h in nm. The R-squared coefficient was 1.000.0 Using Equations (22) and (34), we calculated a Young’s modulus of E 102   kPa , confirming the accuracy of Equation (22).
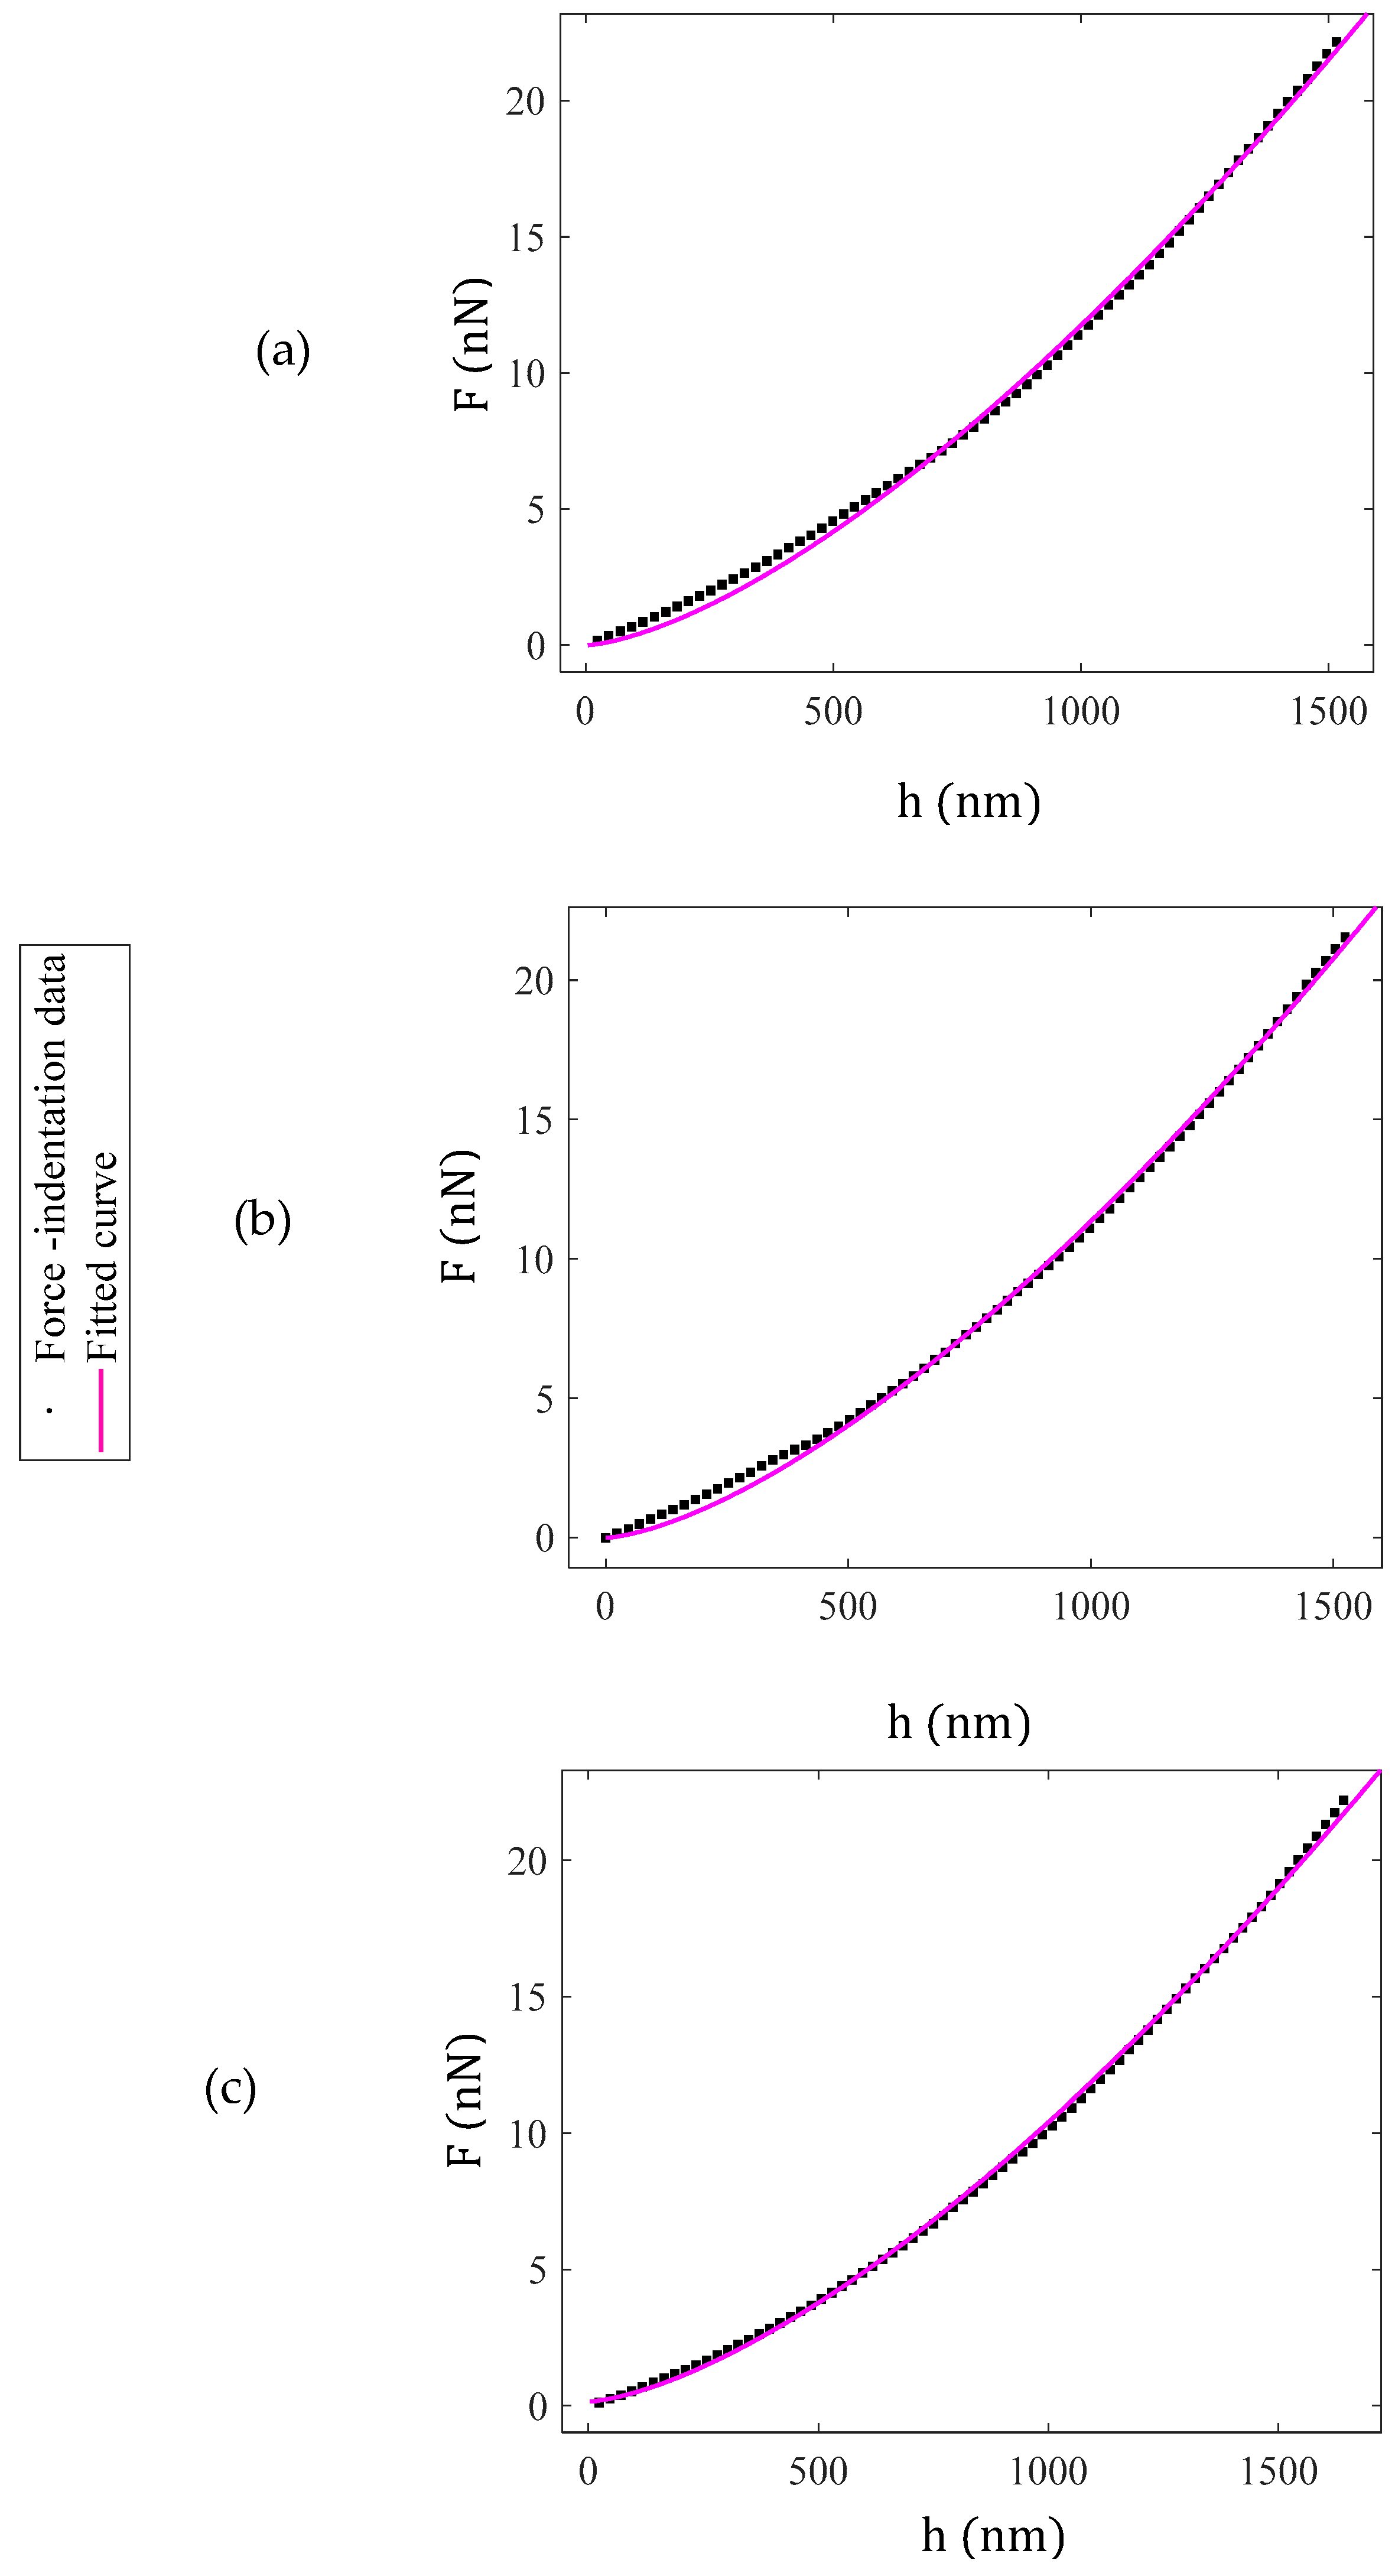
In addition, in Figure 6, three characteristic force–indentation curves from a A172 human glioma cell are presented. The data presented in Figure 6a were fitted in Equation (22), resulting in:
F = 3744 · 10 7 h 3 2 2.671 · 10 9 h 5 2   ,
where F is expressed in nN and h in nm. The R—squared coefficient resulted in 0.9977.
Therefore,
4 3 E R 1 / 2 = 3744 · 10 7 n N n m 3 2 = 11.84 N m 3 2   .
Thus, using R = 2.5 · 10 6 m and v = 0.5 , Equation (36) yields E = 4.21   k P a . The data presented in Figure 6b were fitted to:
F = 3613 · 10 7 h 3 2 2.452 · 10 9 h 5 2   h   i n   n m , F   i n   n N .
The Young’s modulus resulted in E = 4.06   k P a and the R—squared coefficient resulted in 0.9985. In addition, for the data presented in Figure 6c:
F = 3644 · 10 7 h 3 2 2.532 · 10 9 h 5 2   h   i n   n m , F   i n   n N .  
The Young’s modulus resulted in E = 4.10   k P a and the R—squared coefficient resulted in 0.9993.
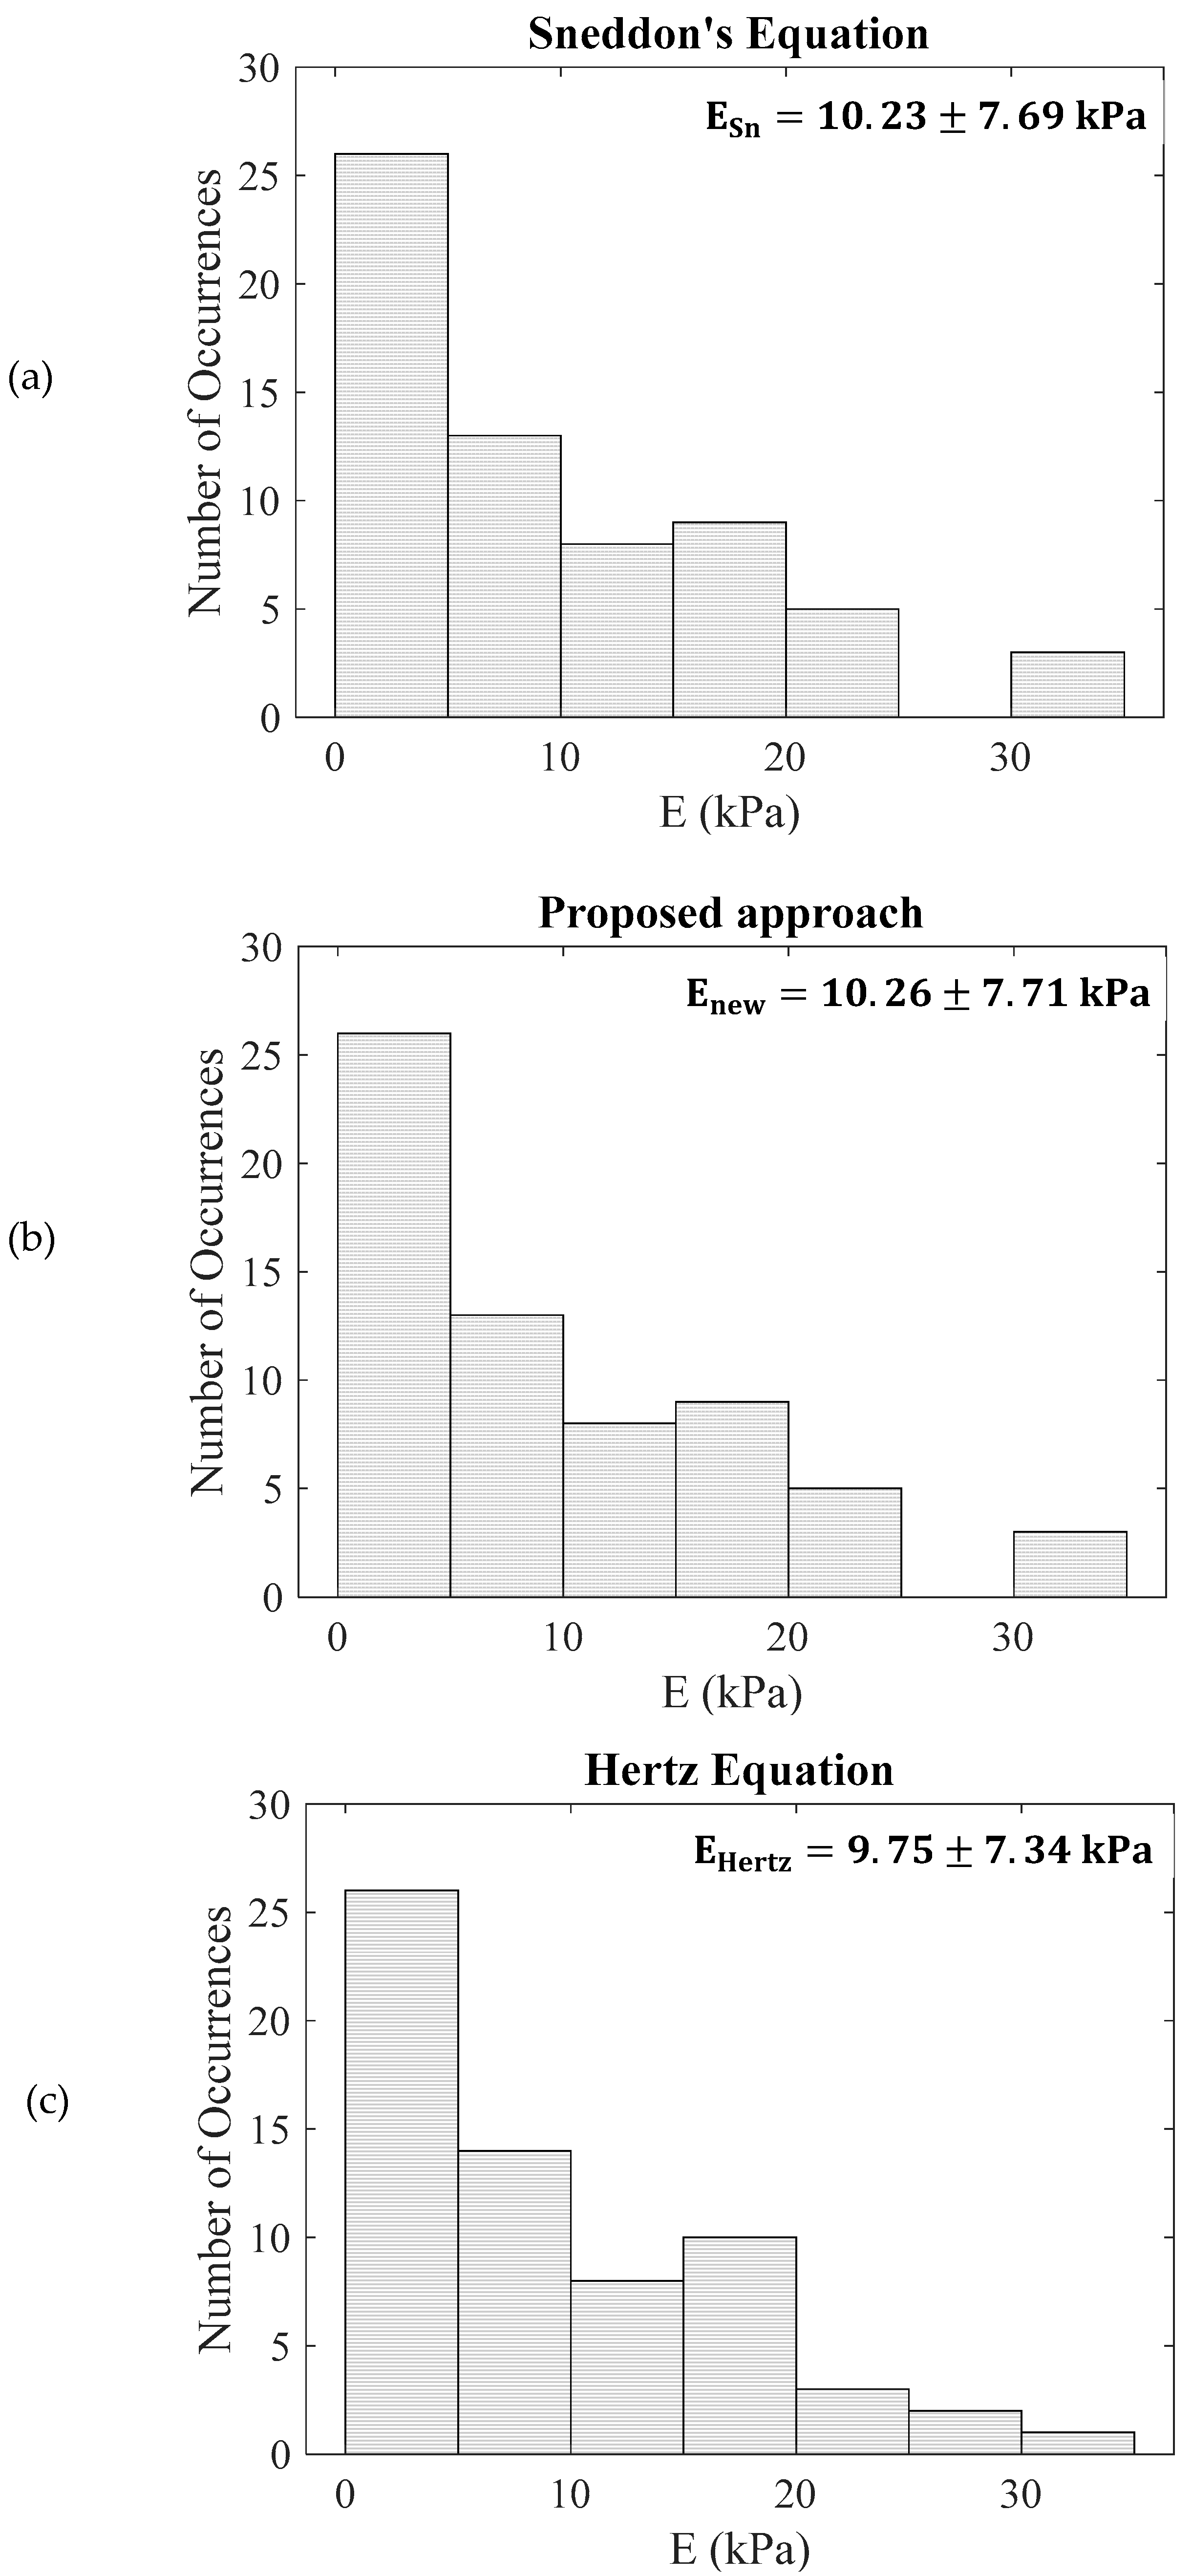
In addition, Figure 7 presents the Young’s modulus values obtained from 64 force–indentation curves obtained on an A172 human glioma cell. In Figure 7a, the Young’s modulus was calculated using Sneddon’s Equations (2) and (3) with the AtomicJ software, while in Figure 7b, the values were calculated by fitting the force–indentation data to Equation (22). The results were nearly identical as expected. In particular, when using Sneddon’s equations (Equations (2) and (3)), the Young’s modulus resulted in E S n = 10.23 ± 7.69   k P a , while when using Equation (22) resulted in E n e w = 10.26 ± 7.71   k P a . The case of fitting the data to Hertz equation is also presented for comparison. In this case, E H e r t z = 9.75 ± 7.34   k P a .
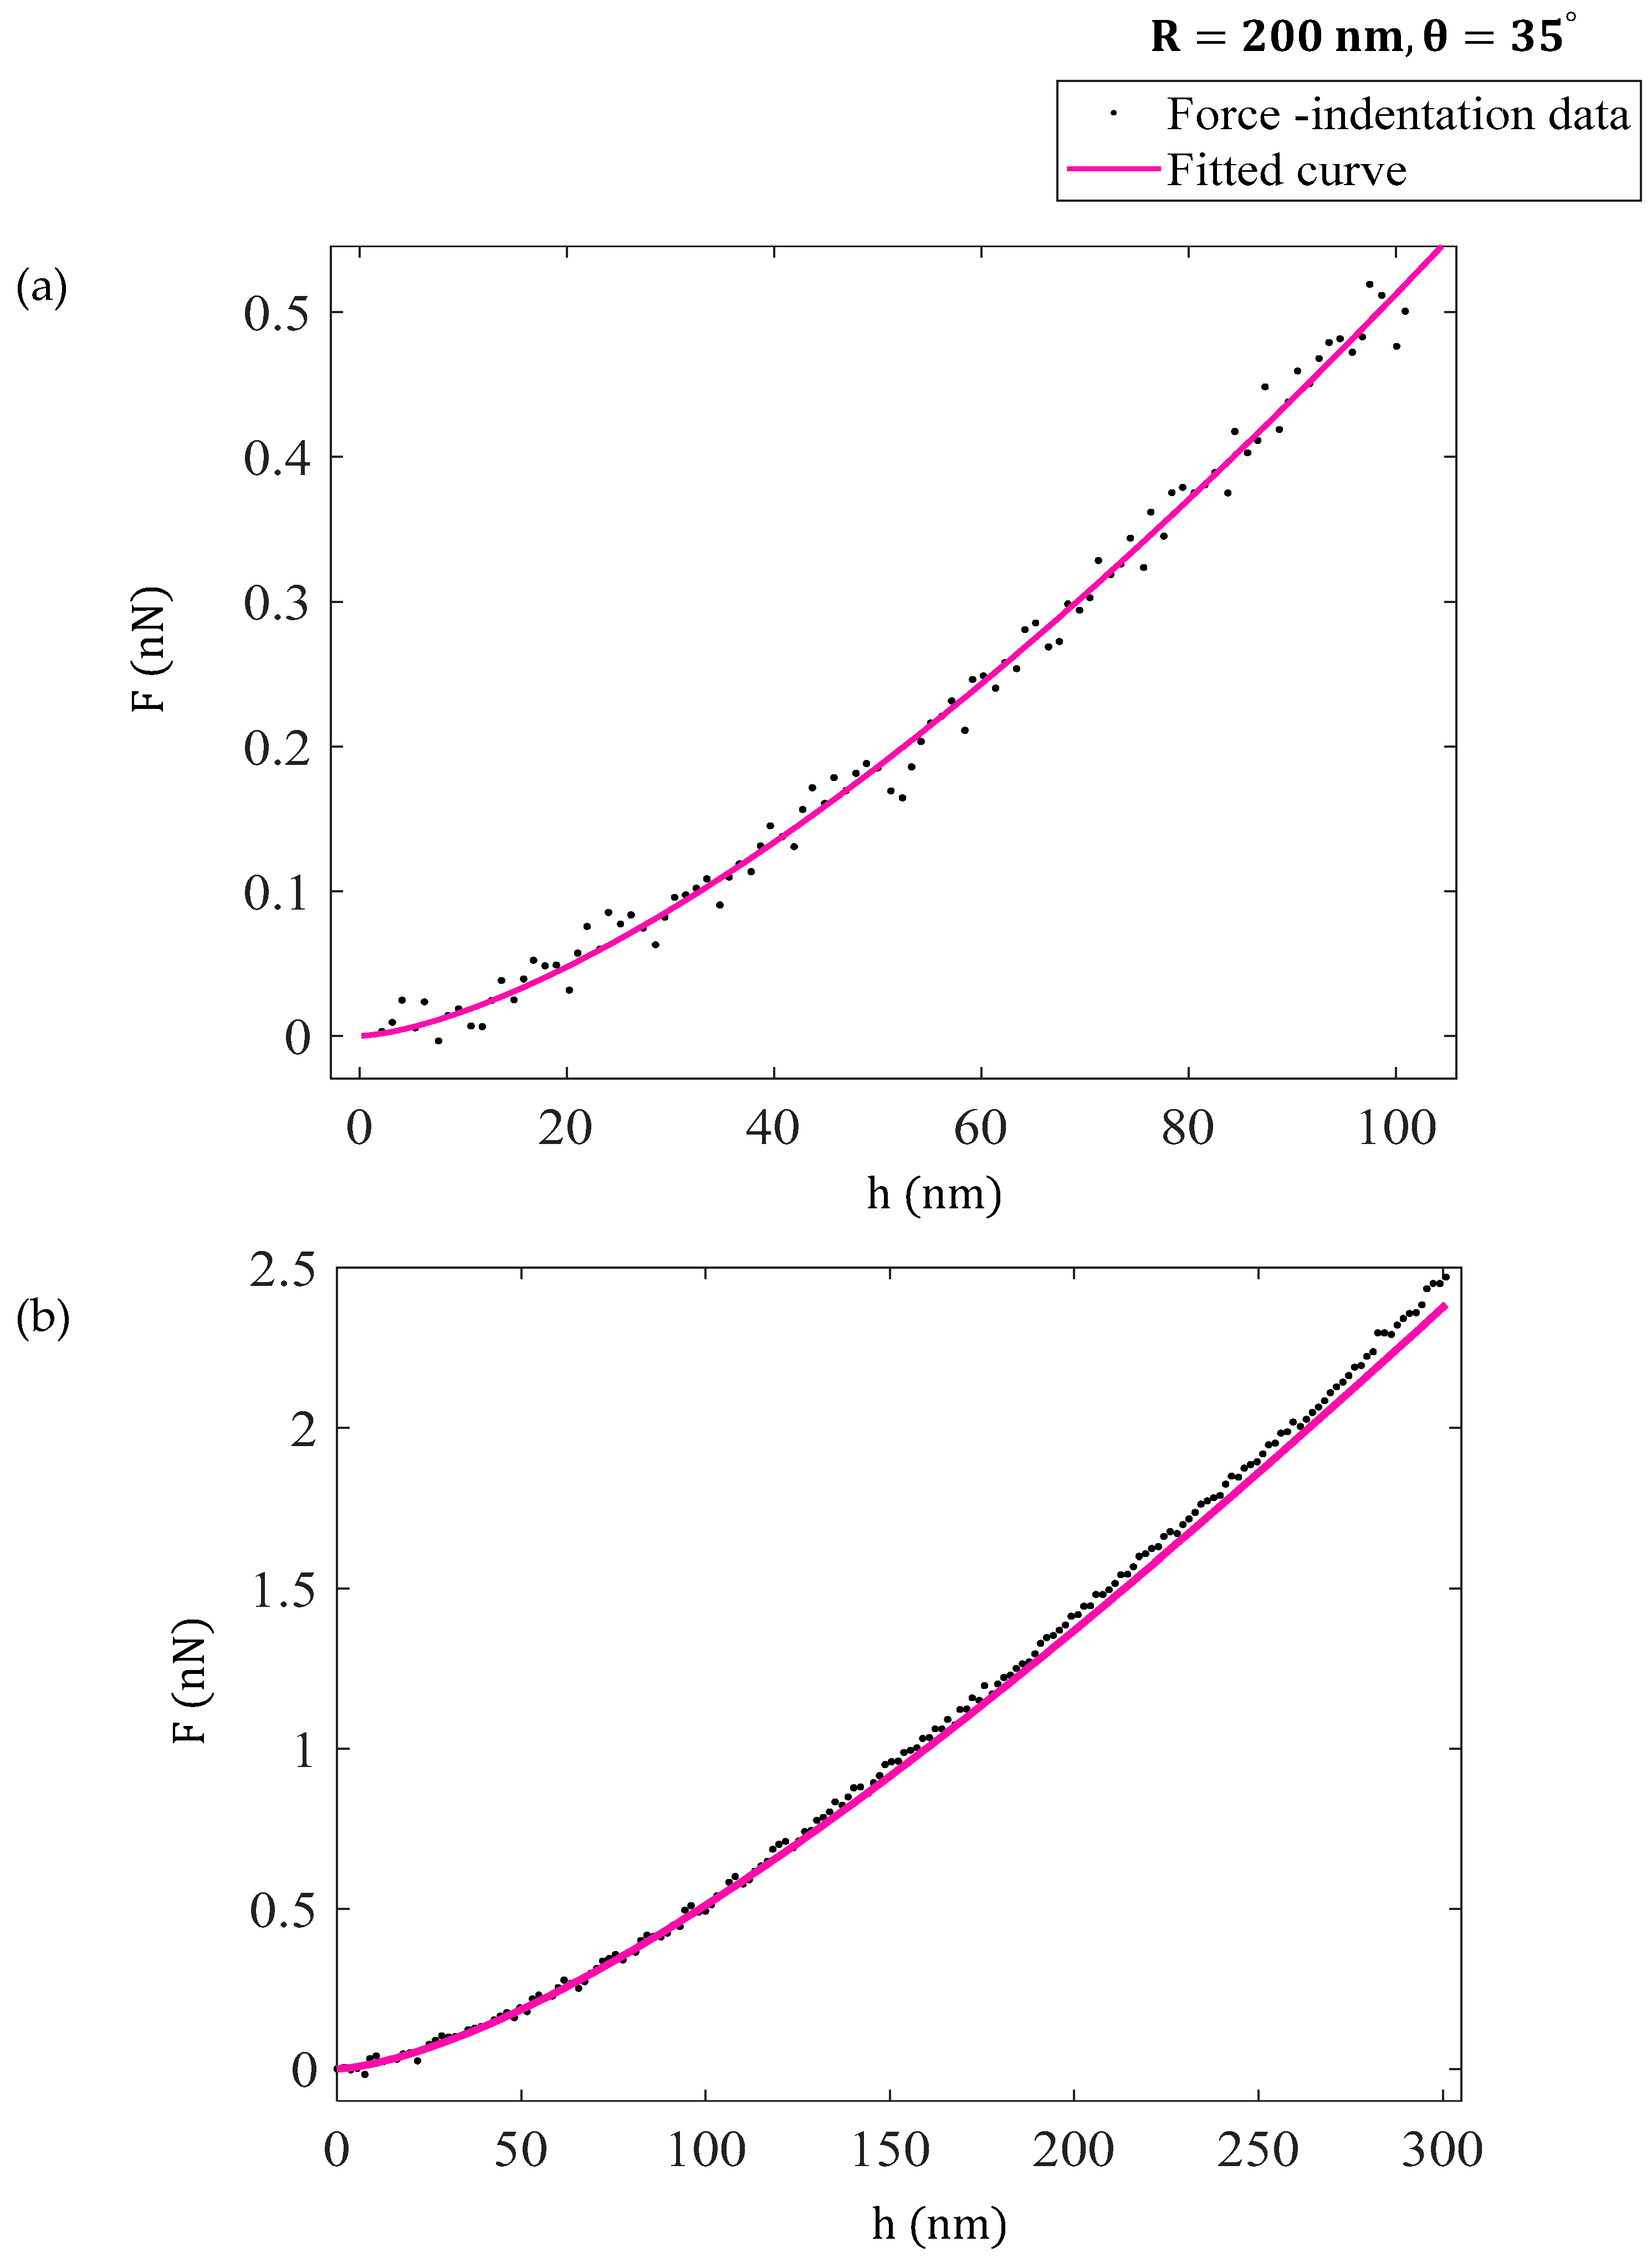
In Figure 8, simulated force–indentation data obtained using a sphero-conical indenter with a tip radius of R = 0.2 μm on an elastic half-space with a Young’s modulus of E = 20 kPa are also presented. The maximum indentation depth was 0.1 μm. Since a large portion of the curve corresponds to contact with the spherical part of the indenter, Equation (22) provides a reliable approximation. The data was fitted to the following equation:
F = 5400 · 10 7 h 3 2 2.765 · 10 9 h 5 2 .
where F is expressed in nN and h in nm. The R—squared coefficient resulted in 0.9934.
The Young’s modulus resulted in 21.4 kPa. The slight deviation from the exact value of 20 kPa can be attributed to the Gaussian noise introduced during the simulation process in AtomicJ [45], as well as to the use of an ideal spherical approximation, whereas the actual contact involves a sphero-conical geometry. Equation (39) is also shown in comparison with same simulated data on the same elastic half space for a maximum indentation depth of 300 nm. A significant portion of the contact area between the indenter and the sample is conical. Equation (22) accurately describes the initial part of the curve but loses accuracy as the indentation depth increases. Nevertheless, in the case of shallow sphero-conical indentations—where the spherical portion of the tip predominantly interacts with the sample—Equation (22) remains a valid and practical choice. A more detailed discussion on the behavior of sphero-conical indenters is provided in the Discussion section.

4. Discussion

The Hertzian equation is the most commonly used model for AFM indentation data with spherical indenters, though it is only valid for small indentation depths relative to the tip radius. Sneddon has derived more accurate equations applicable to any indentation depth. However, these classical models do not directly relate force to indentation depth and often require complex corrections or numerical methods. Other formulations—either empirical or derived through numerical methods with extended correction series—have also been proposed in the literature. However, an analytical process focused on deriving equations that relate the force to the indentation depth for large indentations using spherical indenters has not yet been presented in the literature. The reason is that there is no closed-form solution for the system of Equations (2) and (3) derived by Sneddon. As a result, previous attempts relied solely on numerical analysis or introduced empirical coefficients to the classic Hertz model.
In this study, a different approach was adopted. Sneddon’s Equation (3) was rewritten in the form of Equation (6), where the variable is the ratio x = r c / R. Using a Taylor series expansion, we transformed Sneddon’s equation into a simple quadratic equation. By solving the equation with respect to x and keeping only the positive solution, we succeeded in deriving a simple equation that directly relates the contact radius to the indentation depth. Subsequently, we derived the average radius function in order to substitute it into the classical equation that relates the applied force to the contact radius and the indentation depth. Finally, a two-term equation, valid for h 1.5   R was derived. The idea was generalized for larger indentations depths using a simple series solution. The two-term solution underestimated the contact radius for large indentation depths. Due to the contact geometry, the contact radius should tend toward a limiting value equal to the indenter’s radius. Therefore, we added additional terms for the contact radius, creating a series solution. Finally, using the average contact radius again, a four-term equation capturies the behavior of the system for 0 < h R < 5 .
Despite the excellent accuracy of Equations (2) and (3), Hertz’s classic equation remains the preferred model among researchers in the field of AFM mechanical characterization of soft biological materials, such as cells and tissues, due to its remarkable simplicity in data processing. Equations (2) and (3) have the major disadvantage that they do not directly relate the applied force to the indentation depth, making the fitting process in practical applications difficult. Two numerical/empirical equations appropriate for the fitting process have also been presented in the literature (Equations (4) and (5)). Equation (4) fails to capture the system’s behavior for very large indentations, while Equation (5) was created to provide perfect accuracy for very large indentations and therefore produces an error at the Hertzian limit. On the other hand, the equations proposed in this paper have been derived using straightforward mathematical and physical considerations that will help researchers in the field better understand sphere–sample interactions, particularly those without a strong mathematical background. In addition, the four-term equation (Equation (31)) is the most reliable for both limits (shallow and deep indentations) and remains significantly simpler than the numerical Equation (5).
Table 1 presents the equations from the literature for deep spherical indentations, as discussed in this paper. Apart from the mathematical interest and the simplification of the fitting procedure, another major advantage of deriving an approximate analytical solution is the potential to extend the equation to the case of heterogeneous materials. This task can be easily performed using the weighted mean value theorem for integrals. Let f , g : [ 0 , h ] R be such that f is continuous and g is integrable and does not change the sign on [ 0 , h ] . Then, there exists a number c 0 , h such that [50]:
0 h f y g y d y = f ( c ) 0 h g y d y .
For heterogeneous materials the generic differential Equation (6) can be modified as below:
d F d h = 2 E ( h ) r c h .  
Equation (41) can be written as follows:
F = 0 h 2 E ( y ) r c y d y .  
Equation (42), using Equation (40) can be written in the form:
F = 2 E ( c ) 0 h r c y d y ,
where E * ( c ) is an ‘average’ value of the materials properties in the domain 0 y h . By applying the same procedure described in Section 2.1 and Section 2.2 to expand r c y as a power series, we easily arrive at:
F = 4 E ( c ) R 2 n = 0 m 1 n + 2 1 d n h R n + 3 2
It is also important to note that the E ( c ) parameter is strongly depth-dependent when testing real biological materials. Therefore, depending on the exact indentation depth in each experiment, the result of the fitting process will also differ.
Another critical point is related to sphero-conical indentations. The applied force and the indentation depth for this case are provided below [51].
F = 4 3 E 1 v 2 R 1 2 h 3 2       f o r   h < h T ,   F = 2 Ε 1 v 2 r c h r c 2 2 tan θ π 2 arcsin R T r c r c 3 3 R + r c 2 R T 2 1 2 R T 2 tan θ + r c 2 R T 2 3 R   f o r   ,   h > h T ,   w h e r e ,   h = r c t a n ( θ ) π 2 arcsin R T r c r c R r c 2 R T 2 1 2 r c .
In Equation (45), h T represents the transition depth between the spherical and the conical parts of the indenter, R T indicates the transition radius between the spherical and conical parts of the indenter and R represents the radius of the spherical tip of the indenter. If the spherical tip merges smoothly (tangentially) with the conical body [51] then the transition radius between the spherical and conical parts of the indenter is defined as follows:
R T = R c o s θ .
It is also interesting to note that when the conical part of the indenter is in contact with the sample, the same problem arises—there is no direct equation relating the force to the indentation depth. However, a new equation has recently been derived for this case (valid for h > h T ) [52]. Therefore, for spheroconical indentations:
F = 4 3 E * R 1 2 h 3 2 2 15 E R 1 2 h 5 2   ,   for   h < h T , F = 2 π E tan θ h 2 + 4 π E * [ R T tan θ h T ] h ,   f o r   , h > h T .
Equation (46) indicates that for small conical half-angles, the transition radius R T can approach the radius of the indenter   R . In such cases, a relatively large portion of the spherical tip is in contact with the sample, and the classical Hertzian Equation (1), which is valid only for small indentation depths ( h R ), can lead to significant errors. Therefore, the approximation provided by Equation (22) should be used instead. More generally, sphero-conical indentations require different treatments depending on the contact regime. When the spherical portion of the indenter is in contact with the sample, the force–indentation relationship proposed in this work provides a more accurate description of the initial contact. This ensures that both the geometry of the indenter and the extent of the contact area are properly accounted for, particularly in cases with small conical half-angles where the classical Hertz model becomes insufficient.
An important advantage of the proposed four-term approximation is that it provides a simple analytical relationship between the applied force and indentation depth, similar in spirit to the widely used Hertz model. This allows the standard AFM data processing workflow to remain unchanged, with the only modification occurring in the final fitting step. Unlike purely numerical approaches to Sneddon’s solution, the series-based equation can be applied directly to force–indentation data, facilitating efficient analysis without iterative computations. Furthermore, while the present study focuses on homogeneous materials, the approach can, in principle, be extended to materials with smoothly varying mechanical properties, including soft biological samples with depth-dependent effective moduli. Thus, the proposed model not only improves the accuracy of indentation analysis for moderately large depths but also opens new possibilities for the exploration of heterogeneous and biologically relevant systems.
Another important point to mention is that, as in the classical Hertz and Sneddon models, the proposed formulation requires prior knowledge of the Poisson’s ratio, since the fitting parameter corresponds to E 1 v 2 . Consequently, the Young’s modulus can only be determined if 𝜈 is known. This limitation is not critical for soft biological materials, which are typically assumed to have ν 0.5 due to their high water content. However, for materials with different Poisson’s ratios, the present approach remains applicable provided that ν can be independently measured or estimated.
It is also important to note that in the study by Wang et al. [53], the authors performed FEM simulations and observed an error when applying the Hertz equation, as expected. To address this, they introduced a correction factor (1 − h/R), which improved the accuracy of the results. This approach is consistent with the correction applied in Equation (22) of the present work.
In addition, it is important to emphasize that although Sneddon’s equation, and consequently the equations presented in this paper, are mathematically valid in theory, both Hertz’s and Sneddon’s equations have practical limitations regarding indentation depth. In most cases strains should not be larger than 20% to ensure a linear elastic response [32]. Several models have been used to estimate strain in indentation experiments. For a Hertzian contact, the indentation strain can be calculated using the simple equation ε = r c / R = R h / R [54]. Popov provides an alternative approximate equation, defined as ε h / ( 2 r c ) , which can be used for cylindrical, spherical, or conical indenters [55]. Therefore, large indentations can lead to strains as high as 40–50%, exceeding the limits of a purely linear elastic response. However, in certain cases involving biological materials such as cells and tissues, large indentation depths and high strains are commonly encountered in experimental procedures. Typical examples include experiments on cells, in which indentation depths of approximately 1.6 μm have been previously used [11]. Another example of high strains in indentation experiments is the case of tissues, where pyramidal tips with a half-angle of 35° are typically employed [18,25]. According to Popov’s equation [55], in this case the strain is given by ε = 1 2 tan θ = 0.35 . However, it is important to note that high strains may lead to nonlinearly elastic contact, and this should be considered in experimental procedures.
Another important point to note is that, in the present analysis, adhesion forces were not considered. The mathematical formulation describe an idealized case of a rigid spherical indenter pressing into an elastic half-space without surface interactions. This assumption is justified by the experimental conditions typically employed in AFM measurements of soft biological materials, where adhesion can be effectively minimized. For example, AFM probes are often passivated with non-adhesive coatings such as polyethylene glycol (PEG), and measurements are frequently performed in liquid environments to mimic physiological conditions. Under these circumstances, capillary and van der Waals forces are greatly reduced, and adhesion in liquid is generally one to two orders of magnitude smaller than in humid air [32,56,57,58]. Moreover, the indentation depths investigated are usually well above the range where adhesive effects dominate, ensuring that elastic deformation governs the response. Consequently, the assumption of adhesionless contact is widely accepted for modeling and interpreting AFM-based mechanical characterization of soft materials [59].
Future research will focus on extending the applicability of the equations presented in this paper to viscoelastic materials and materials of finite thickness. Sneddon’s equation, and consequently the approximations proposed in this paper, are valid in cases where viscoelastic effects are minimal. Several models in the literature extend the applicability of Equation (1) to account for the viscoelastic effects of a material [60,61]. However, when employing Equation (1), the restriction h R , as in the case of elastic contact, also applies. Therefore, extending the equations proposed in this paper to account for viscoelastic effects in deep spherical indentations represents a very interesting topic for future research. Another interesting idea for future work is to extend the applicability of the proposed equation to samples with finite thickness. Garcia and Garcia proposed extensions of the Hertzian equations for different geometries in the case of thin elastic materials [62]. However, an extension for deep spherical indentations in samples with finite thickness is currently lacking and warrants further investigation.
A short list of the key advantages of the proposed equations derived in this paper is provided below:
  • The proposed four-term equation is valid across all indentation depths, from shallow to very deep, eliminating the need to switch between models.
  • The method presented in this paper provides a direct, closed-form force–indentation relationship without numerical iteration or empirical fitting.
  • The proposed equations (two-term and four-term) are free from arbitrary coefficients, ensuring consistent results across different applications.
  • They simplify data processing, accelerate analysis, and improve accuracy in biomechanical studies and diagnostics.
  • They offer a physically grounded model that supports further extensions to complex materials.

5. Conclusions

In this work, we introduced a novel analytical method to derive a force–indentation relationship for spherical indenters based on fundamental mathematical principles. By employing Taylor series expansions of Sneddon’s equations combined with the general differential equation for axisymmetric indenters, we obtained a practical two-term expression for data analysis. This equation is straightforward to apply and is also valid for materials with depth-dependent mechanical properties. The results were further extended to include large indentation depths using a simple series solution. Validation against both simulated and experimental cellular data confirmed the excellent accuracy and applicability of the proposed equations, making them a valuable tool for AFM indentation experiments.

Author Contributions

Conceptualization, S.-V.K.; methodology, S.-V.K., A.M., G.M.I., A.K. and A.S.; software, S.-V.K. and A.M.; validation, S.-V.K., A.M., G.M.I., A.K. and A.S.; formal analysis, S.-V.K., A.M., G.M.I., A.K. and A.S.; investigation, S.-V.K., A.M., G.M.I., A.K. and A.S.; resources, S.-V.K., A.M., G.M.I. and A.S.; data curation, S.-V.K. and A.S.; writing—original draft preparation, S.-V.K.; writing—review and editing, S.-V.K., A.M., G.M.I., A.K. and A.S.; supervision, A.S. and S.-V.K.; project administration, S.-V.K. and A.S.; funding acquisition, S.-V.K. and A.S. All authors have read and agreed to the published version of the manuscript.

Funding

Funded by the European Union. Views and opinions expressed are however those of the authors only and do not necessarily reflect those of the European Union or REA. Neither the European Union nor the granting authority can be held responsible for them.

Data Availability Statement

The original contributions presented in this study are included in the article. Further inquiries can be directed to the corresponding author.

Conflicts of Interest

Author Anna Malamou was employed by the company BioNanoTec. The remaining authors declare that the research was conducted in the absence of any commercial or financial relationships that could be construed as a potential conflict of interest.

References

  1. Krawczyk-Wołoszyn, K.; Roczkowski, D.; Reich, A.; Żychowska, M. Applying the Atomic Force Microscopy Technique in Medical Sciences—A Narrative Review. Biomedicines 2024, 12, 2012. [Google Scholar] [CrossRef] [PubMed]
  2. Argatov, I.; Jin, X.; Mishuris, G. Atomic force microscopy-based indentation of cells: Modelling the effect of a pericellular coat. J. R. Soc. Interface 2023, 20, 20220857. [Google Scholar] [CrossRef]
  3. Kiio, T.M.; Park, S. Nano-scientific Application of Atomic Force Microscopy in Pathology: From Molecules to Tissues. Int. J. Med. Sci. 2020, 17, 844–858. [Google Scholar] [CrossRef]
  4. Hinterdorfer, P.; Garcia-Parajo, M.F.; Dufrêne, Y.F. Single-Molecule Imaging of Cell Surfaces Using Near-Field Nanoscopy. Acc. Chem. Res. 2012, 45, 327–336. [Google Scholar] [CrossRef]
  5. Li, M.; Dang, D.; Liu, L.; Xi, N.; Wang, Y. Imaging and Force Recognition of Single Molecular Behaviors Using Atomic Force Microscopy. Sensors 2017, 17, 200. [Google Scholar] [CrossRef]
  6. Carvalho, F.A.; Connell, S.; Miltenberger-Miltenyi, G.; Pereira, S.V.; Tavares, A.; Ariëns, R.A.S.; Santos, N.C. Atomic Force Microscopy-Based Molecular Recognition of a Fibrinogen Receptor on Human Erythrocytes. ACS Nano 2010, 4, 4609–4620. [Google Scholar] [CrossRef] [PubMed]
  7. Rusu, M.; Dulebo, A.; Curaj, A.; Liehn, E.A. Ultra-rapid non-invasive clinical nano-diagnostic of inflammatory diseases. Discov. Rep. 2014, 1, e2. [Google Scholar] [CrossRef]
  8. Lekka, M.; Gil, D.; Pogoda, K.; Dulińska-Litewka, J.; Jach, R.; Gostek, J.; Klymenko, O.; Prauzner-Bechcicki, S.; Stachura, Z.; Wiltowska-Zuber, J.; et al. Cancer cell detection in tissue sections using AFM. Arch. Biochem. Biophys. 2012, 518, 151–156. [Google Scholar] [CrossRef]
  9. Goldmann, W.H.; Ezzell, R.M. Viscoelasticity in wild-type and vinculin-deficient (5.51) mouse F9 embryonic carcinoma cells examined by atomic force microscopy and rheology. Exp. Cell Res. 1996, 226, 234–237. [Google Scholar] [CrossRef]
  10. Goldmann, W.H.; Galneder, R.; Ludwig, M.; Xu, W.; Adamson, E.D.; Wang, N.; Ezzell, R.M. Differences in elasticity of vinculin-deficient F9 cells measured by magnetometry and atomic force microscopy. Exp. Cell Res. 1998, 239, 235–242. [Google Scholar] [CrossRef]
  11. Lekka, M.; Laidler, P.; Gil, D.; Lekki, J.; Stachura, Z.; Hrynkiewicz, A.Z. Elasticity of normal and cancerous human bladder cells studied by scanning force microscopy. Eur. Biophys. J. 1999, 28, 312–316. [Google Scholar] [CrossRef] [PubMed]
  12. Lekka, M.; Lekki, J.; Marszałek, M.; Golonka, P.; Stachura, Z.; Cleff, B.; Hrynkiewicz, A.Z. Local elastic properties of cells studied by SFM. Appl. Surf. Sci. 1999, 141, 345–349. [Google Scholar] [CrossRef]
  13. Li, Q.S.; Lee, G.Y.H.; Ong, C.N.; Lim, C.T. AFM indentation study of breast cancer cells. Biochem. Biophys. Res. Commun. 2008, 374, 609–613. [Google Scholar] [CrossRef] [PubMed]
  14. Faria, E.C.; Ma, N.; Gazi, E.; Gardner, P.; Brown, M.; Clarke, N.W.; Snook, R.D. Measurement of elastic properties of prostate cancer cells using AFM. Analyst 2008, 133, 1498–1500. [Google Scholar] [CrossRef]
  15. Zhou, Z.L.; Ngan, A.H.W.; Tang, B.; Wang, A.X. Reliable measurement of elastic modulus of cells by nanoindentation in an atomic force microscope. J. Mech. Behav. Biomed. Mater. 2012, 8, 134–142. [Google Scholar] [CrossRef] [PubMed]
  16. Cross, S.E.; Jin, Y.-S.; Rao, J.; Gimzewski, J.K. Nanomechanical analysis of cells from cancer patients. Nat. Nanotechnol. 2007, 2, 780–783. [Google Scholar] [CrossRef]
  17. Stylianou, A.; Gkretsi, V.; Stylianopoulos, T. Transforming Growth Factor-β modulates Pancreatic Cancer Associated Fibroblasts cell shape, stiffness and invasion. Biochim. Biophys. Acta 2018, 1862, 1537–1546. [Google Scholar] [CrossRef]
  18. Plodinec, M.; Loparic, M.; Monnier, C.A.; Obermann, E.C.; Zanetti-Dallenbach, R.; Oertle, P.; Hyotyla, J.T.; Aebi, U.; Bentires-Alj, M.; Lim, R.Y.H.; et al. The nanomechanical signature of breast cancer. Nat. Nanotechnol. 2012, 7, 757–765. [Google Scholar] [CrossRef]
  19. Ansardamavandi, A.; Tafazzoli-Shadpour, M.; Omidvar, R.; Jahanzad, I. Quantification of effects of cancer on elastic properties of breast tissue by Atomic Force Microscopy. J. Mech. Behav. Biomed. Mater. 2016, 60, 234–242. [Google Scholar] [CrossRef]
  20. Tian, M.; Li, Y.; Liu, W.; Jin, L.; Jiang, X.; Wang, X.; Ding, Z.; Peng, Y.; Zhou, J.; Fan, J.; et al. The nanomechanical signature of liver cancer tissues and its molecular origin. Nanoscale 2015, 7, 12998–13010. [Google Scholar] [CrossRef]
  21. Ciasca, G.; Sassun, T.E.; Minelli, E.; Antonelli, M.; Papi, M.; Santoro, A.; Giangaspero, F.; Delfini, R.; De Spirito, M. Nanomechanical signature of brain tumors. Nanoscale 2016, 8, 19629–19643. [Google Scholar] [CrossRef]
  22. Cui, Y.; Zhang, X.; You, K.; Guo, Y.; Liu, C.; Fang, X.; Geng, L. Nanomechanical Characteristics of Cervical Cancer and Cervical Intraepithelial Neoplasia Revealed by Atomic Force Microscopy. Med. Sci. Monit. 2017, 23, 4205–4213. [Google Scholar] [CrossRef]
  23. Minelli, E.; Ciasca, G.; Sassun, T.E.; Antonelli, M.; Palmieri, V.; Papi, M.; Maulucci, G.; Santoro, A.; Giangaspero, F.; Delfini, R.; et al. A fully-automated neural network analysis of AFM force-distance curves for cancer tissue diagnosis. Appl. Phys. Lett. 2017, 111, 143701. [Google Scholar] [CrossRef]
  24. Stolz, M.; Gottardi, R.; Raiteri, R.; Miot, S.; Martin, I.; Imer, R.; Staufer, U.; Raducanu, A.; Düggelin, M.; Baschong, W.; et al. Early detection of aging cartilage and osteoarthritis in mice and patient samples using atomic force microscopy. Nat. Nanotechnol. 2009, 4, 186–192. [Google Scholar] [CrossRef] [PubMed]
  25. Loparic, M.; Wirz, D.; Daniels, A.U.; Raiteri, R.; Vanlandingham, M.R.; Guex, G.; Martin, I.; Aebi, U.; Stolz, M. Micro- and nanomechanical analysis of articular cartilage by indentation-type atomic force microscopy: Validation with a gel-microfiber composite. Biophys. J. 2010, 98, 2731–2740. [Google Scholar] [CrossRef] [PubMed]
  26. Connelly, L.; Jang, H.; Teran Arce, F.; Capone, R.; Kotler, S.A.; Ramachandran, S.; Kagan, B.L.; Nussinov, R.; Lal, R. Atomic force microscopy and MD simulations reveal pore-like structures of all-d-enantiomer of Alzheimer’s β-amyloid peptide: Relevance to the ion channel mechanism of AD pathology. J. Phys. Chem. B 2012, 116, 1728–1735. [Google Scholar] [CrossRef]
  27. Hane, F.; Drolle, E.; Choi, Y.; Attwood, S.; Gaikwad, R.; Leonenko, Z. Atomic force microscopy and Kelvin probe force microscopy to study Alzheimer’s disease. In Proceedings of the Materials Science & Technology Conference and Exhibition 2013, Montreal, QC, Canada, 27–31 October 2013; pp. 2817–2824. [Google Scholar]
  28. Song, S.; Ma, X.; Zhou, Y.; Xu, M.; Shuang, S.; Dong, C. Studies on the interaction between vanillin and β-amyloid protein via fluorescence spectroscopy and atomic force microscopy. Chem. Res. Chin. Univ. 2016, 32, 172–177. [Google Scholar] [CrossRef]
  29. Han, S.W.; Shin, H.K.; Adachi, T. Nanolithography of amyloid precursor protein cleavage with β-secretase by atomic force microscopy. J. Biomed. Nanotechnol. 2016, 12, 546–553. [Google Scholar] [CrossRef]
  30. Zhang, Y.; Zhang, W.; Wang, S.; Wang, C.; Xie, J.; Chen, X.; Xu, Y.; Mao, P. Detection of human erythrocytes influenced by iron deficiency anemia and thalassemia using atomic force microscopy. Micron 2012, 43, 1287–1292. [Google Scholar] [CrossRef]
  31. Mendová, K.; Otáhal, M.; Drab, M.; Daniel, M. Size Matters: Rethinking Hertz Model Interpretation for Cell Mechanics Using AFM. Int. J. Mol. Sci. 2024, 25, 7186. [Google Scholar] [CrossRef]
  32. Krieg, M.; Fläschner, G.; Alsteens, D.; Gaub, B.M.; Roos, W.H.; Wuite, G.J.L.; Gaub, H.E.; Gerber, C.; Dufrêne, Y.F.; Müller, D.J. Atomic force microscopy-based mechanobiology. Nat. Rev. Phys. 2019, 1, 41–57. [Google Scholar] [CrossRef]
  33. Abuhattum, S.; Mokbel, D.; Müller, P.; Soteriou, D.; Guck, J.; Aland, S. An explicit model to extract viscoelastic properties of cells from AFM force-indentation curves. iScience 2022, 25, 104016. [Google Scholar] [CrossRef]
  34. Han, R.; Chen, J. A modified Sneddon model for the contact between conical indenters and spherical samples. J. Mater. Res. 2021, 36, 1762–1771. [Google Scholar] [CrossRef]
  35. Sun, W.; Ma, J.; Wang, C.; Li, H.; Wu, C.; Zhang, W. Precise determination of elastic modulus of cell using conical AFM probe. J. Biomech. 2021, 118, 110277. [Google Scholar] [CrossRef]
  36. Chen, S.W.; Teulon, J.M.; Kaur, H.; Godon, C.; Pellequer, J.-L. Nano-structural stiffness measure for soft biomaterials of heterogeneous elasticity. Nanoscale Horiz. 2023, 8, 75–82. [Google Scholar] [CrossRef]
  37. Gavara, N. A beginner’s guide to atomic force microscopy probing for cell mechanics. Microsc. Res. Tech. 2017, 80, 75–84. [Google Scholar] [CrossRef]
  38. Yuan, W.; Ding, Y.; Wang, G. Universal contact stiffness of elastic solids covered with tensed membranes and its application in indentation tests of biological materials. Acta Biomater. 2023, 171, 202–208. [Google Scholar] [CrossRef] [PubMed]
  39. Koruk, H.; Pouliopoulos, A.N. Elasticity and Viscoelasticity Imaging Based on Small Particles Exposed to External Forces. Processes 2023, 11, 3402. [Google Scholar] [CrossRef]
  40. Kontomaris, S.V.; Malamou, A. A novel approximate method to calculate the force applied on an elastic half space by a rigid sphere. Eur. J. Phys. 2021, 42, 025010. [Google Scholar] [CrossRef]
  41. Sneddon, I.N. The relation between load and penetration in the axisymmetric Boussinesq problem for a punch of arbitrary profile. Int. J. Eng. Sci. 1965, 3, 47–57. [Google Scholar] [CrossRef]
  42. Müller, P.; Abuhattum, S.; Möllmert, S.; Ulbricht, E.; Taubenberger, A.V.; Guck, J. nanite: Using machine learning to assess the quality of atomic force microscopy-enabled nano-indentation data. BMC Bioinform. 2019, 20, 465. [Google Scholar] [CrossRef]
  43. Pharr, G.M.; Oliver, W.C.; Brotzen, F.R. On the generality of the relationship among contact stiffness, contact area, and elastic modulus during indentation. J. Mater. Res. 1992, 7, 613–617. [Google Scholar] [CrossRef]
  44. Kontomaris, S.V.; Malamou, A. Revisiting the theory behind AFM indentation procedures: Exploring the physical significance of fundamental equations. Eur. J. Phys. 2022, 43, 015010. [Google Scholar] [CrossRef]
  45. Hermanowicz, P.; Sarna, M.; Burda, K.; Gabryś, H. AtomicJ: An open source software for analysis of force curves. Rev. Sci. Instrum. 2014, 85, 063703. [Google Scholar] [CrossRef]
  46. Kontomaris, S.V.; Malamou, A.; Ismail, G.M.; Psychogios, I.; Stylianou, A. Global linear modeling of AFM indentation curves for soft samples with various indenter geometries. Next Mater. 2025, 9, 101299. [Google Scholar] [CrossRef]
  47. Kontomaris, S.V.; Psychogios, I.; Stergiopoulos, M.; Malamou, A.; Stylianou, A. Quantitative criteria for the validity of the elastic half-space assumption in AFM nanoindentation. Next Mater. 2025, 9, 101180. [Google Scholar] [CrossRef]
  48. Butt, H.J.; Jaschke, M. Calculation of thermal noise in atomic force microscopy. Nanotechnology 1995, 6, 1. [Google Scholar] [CrossRef]
  49. Louca, M.; Stylianou, A.; Minia, A.; Pliaka, V.; Alexopoulos, L.G.; Gkretsi, V.; Stylianopoulos, T. Ras suppressor-1 (RSU-1) promotes cell invasion in aggressive glioma cells and inhibits it in non-aggressive cells through STAT6 phospho-regulation. Sci. Rep. 2019, 9, 7782. [Google Scholar] [CrossRef]
  50. Polezzi, M. On the Weighted Mean Value Theorem for Integrals. Int. J. Math. Educ. Sci. Technol. 2006, 37, 868–870. [Google Scholar] [CrossRef]
  51. Briscoe, B.J.; Sebastian, K.S.; Adams, M.J. The effect of indenter geometry on the elastic response to indentation. J. Phys. D Appl. Phys. 1994, 27, 1156–1162. [Google Scholar] [CrossRef]
  52. Kontomaris, S.V.; Malamou, A.; Stylianou, A. Development of an accurate simplified approach for data processing in AFM indentation experiments. Micron 2025, 190, 103782. [Google Scholar] [CrossRef]
  53. Wang, B.; Lançon, P.; Bienvenu, C.; Vierling, P.; Di Giorgio, C.; Bossis, G. A general approach for the microrheology of cancer cells by atomic force microscopy. Micron 2013, 44, 287–297. [Google Scholar] [CrossRef] [PubMed]
  54. Pathak, S.; Kalidindi, S.R. Spherical nanoindentation stress-strain curves. Mater. Sci. Eng. R Rep. 2015, 91, 1–36. [Google Scholar] [CrossRef]
  55. Popov, V.L. Contact Mechanics and Friction: Physical Principles and Applications, 1st ed.; Springer: Berlin/Heidelberg, Germany, 2010. [Google Scholar]
  56. Hinterdorfer, P.; Dufrêne, Y.F. Detection and localization of single molecular recognition events using atomic force microscopy. Nat. Methods 2006, 3, 347–355. [Google Scholar] [CrossRef] [PubMed]
  57. Chen, X.; Li, B.; Liao, Z.; Li, J.; Li, X.; Yin, J.; Guo, W. Principles and applications of liquid-environment atomic force microscopy. Adv. Mater. Interfaces 2022, 9, 2201864. [Google Scholar] [CrossRef]
  58. Wei, Z.; Zhao, Y.-P. Growth of liquid bridge in AFM. J. Phys. D Appl. Phys. 2007, 40, 4368–4375. [Google Scholar] [CrossRef]
  59. Dokukin, M.B.; Guz, N.V.; Sokolov, I. Quantitative study of the elastic modulus of loosely attached cells in AFM indentation experiments. Biophys. J. 2013, 104, 2123–2131. [Google Scholar] [CrossRef] [PubMed]
  60. Efremov, Y.M.; Okajima, T.; Raman, A. Measuring viscoelasticity of soft biological samples using atomic force microscopy. Soft Matter 2020, 16, 64–81. [Google Scholar] [CrossRef]
  61. Brückner, B.R.; Nöding, H.; Janshoff, A. Viscoelastic properties of confluent MDCK II cells obtained from force cycle experiments. Biophys. J. 2017, 112, 724–735. [Google Scholar] [CrossRef]
  62. Garcia, P.D.; Garcia, R. Determination of the elastic moduli of a single cell cultured on a rigid support by force microscopy. Biophys. J. 2018, 114, 2923–2932. [Google Scholar] [CrossRef]
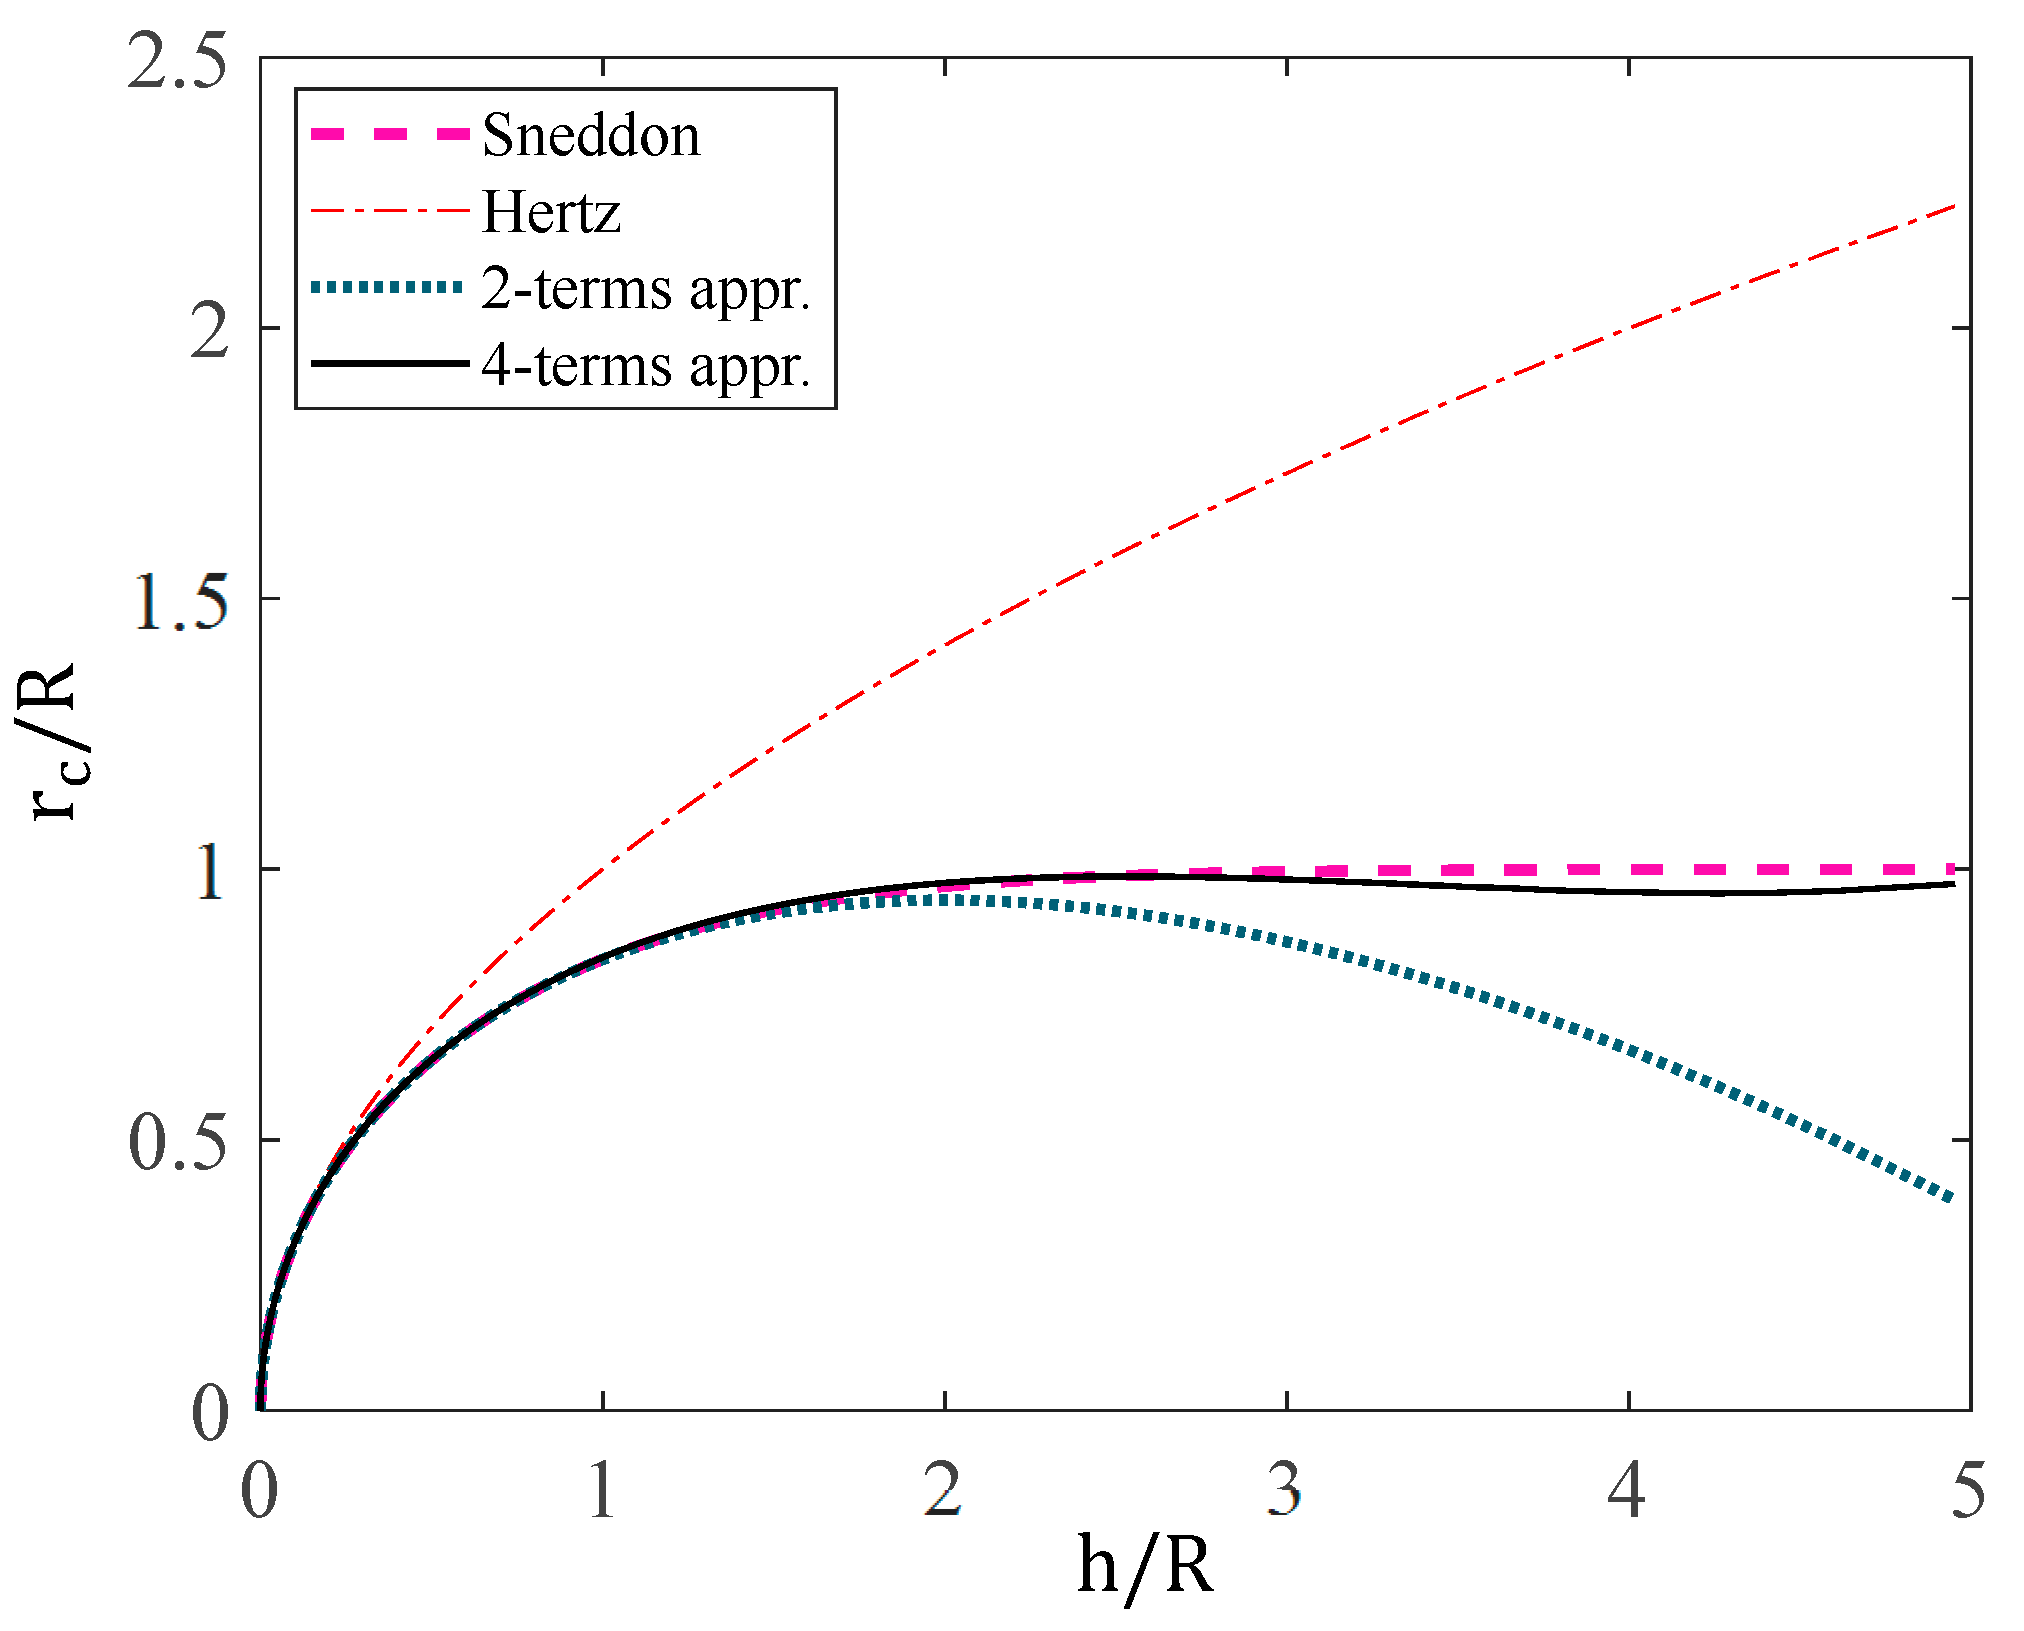
Figure 1. The r c / R ratio as a function of h / R is shown for Hertz’s, Sneddon’s, and the newly derived Equation (24) using both two-term and four-term approximations. The four-term series solution accurately captures the physical behavior of the system.
Metrology 05 00063 g001
Figure 2. The variation of F E R 2 with respect to h R is shown when using the Hertz equation (Equation (1)), the classical Sneddon equations (Equations (2) and (3)), and Equations (22) and (31), in the domains 0 h / R 1 (a) and 0 h / R 5 (b). The four-term approximation (Equation (31)) provides an excellent representation of the force–indentation relationship—closely matching Sneddon’s theoretical framework and exactly matching the Hertz equation in the regime h ≪ R.
Metrology 05 00063 g002
Figure 3. The error associated with Equations (4) and (5), and the two-term and four-term equations proposed in this paper is presented for (a) 0 h / R 0.5 and (b) 0 h R < 5 . The four-term equation capture the system behavior for h / R < 5 .
Metrology 05 00063 g003
Figure 4. Simulated force–indentation data from the AtomicJ repository with maximum indentation depths of 700 nm (a), 800 nm (b), and 900 nm (c). Equation (22) was fitted to all datasets, yielding elastic modulus values of 20.05 kPa, 20.10 kPa, and 20.07 kPa, respectively. In each case, the R-squared coefficient was equal to 1.0000.
Metrology 05 00063 g004
Figure 5. Simulated force–indentation data were obtained using FEA modeling [46,47]. Equation (22) was fitted to the data, confirming the accuracy of the proposed approach.
Metrology 05 00063 g005
Figure 6. Characteristic force–indentation data from A172 human glioma cells and fitted curves using Equation (22). The Young’s moduli were found to be (a) 4.21 kPa, (b) 4.06 kPa, and (c) 4.10 kPa. The R-squared coefficient was close to 1 in all cases.
Metrology 05 00063 g006
Figure 7. The Young’s modulus ± standard deviation was calculated from 64 force curves obtained on A172 human glioma cells using Sneddon’s equation, the newly proposed approach, and the Hertz equation. (a) Histogram corresponding to data fitted using Sneddon’s equations in AtomicJ; (b) histogram corresponding to the same data fitted using the equation proposed in this paper; and (c) histogram corresponding to data fitted using the Hertz equation.
Metrology 05 00063 g007
Figure 8. Simulated data were generated for an elastic half-space with a Young’s modulus of 20 kPa using a spheroconical indenter with a tip radius of 0.2 μm and a cone half-angle of 35°. (a) The maximum indentation depth reached 100 nm, indicating that a significant portion of the contact area involved interaction with the spherical part of the indenter. Equation (22) provides an acceptable approximation in this case. (b) The maximum indentation depth in this case is 300 nm. Therefore, a significant portion of the contact area between the indenter and the sample is conical. Equation (22) accurately describes the initial part of the curve but loses accuracy as the indentation depth increases.
Metrology 05 00063 g008
Table 1. Force–indentation equations for deep spherical indentations.
ModelEquation
Sneddon 1965 [41] F = E 2 1 v 2 r c 2 + R 2 l n R + r c R r c 2 r c R
ln R + r c R r c = 2 h r c
Note: This is an exact mathematical solution. However, it has the disadvantage of not directly relating the applied force to the indentation depth,
which complicates the fitting process.
Müller et al., 2019 [42] F = 4 3 E 1 v 2 R 1 / 2 h 3 / 2 1 1 10 h R 1 840 h R 2 + 11 15,120 h R 3 + 1357 6,652,800 h R 4
Note: It fails to capture the system’s behavior for large indentations.
Kontomaris & Malamou 2021 [40] F = 4 E R 1 2 3 1 v 2 h 3 2 c 1 + M = 2 N 3 2 Μ c M R ( 3 2 M ) h M 3 / 2
where
c 1 = 1.0100000 ,   c 2 = 0.0730300 ,   c 3 = 0.1357000 ,   c 4 = 0.0359800 ,   c 5 = 0.0040240   and   c 6 = 0.0001653 .
Note: It leads to errors for shallow indentations (Hertzian limit) since it was designed for deep indentations.
Two-term solution F = 4 3 E R 1 2 h 3 2 2 15 E R 1 2 h 5 2  
Note :   Perfectly   accurate   for   h 1.5   R .
Four-term solution F = 4 3 E R 1 2 h 3 2 4 30 E R 1 2 h 5 2 + 4 3000 1 R 3 2 h 7 2 + 4 5000 1 R 5 2 h 9 2
Note: Perfectly accurate for any indentation depth.
Disclaimer/Publisher’s Note: The statements, opinions and data contained in all publications are solely those of the individual author(s) and contributor(s) and not of MDPI and/or the editor(s). MDPI and/or the editor(s) disclaim responsibility for any injury to people or property resulting from any ideas, methods, instructions or products referred to in the content.