1. Introduction
Liquid level measurements are critical in various industries, including chemical processing, water treatment, beverage production, and also smart home systems [
1,
2]. The accurate measurement of liquid levels ensures process efficiency, safety, and quality control. The reliability of the level management systems mainly depends on access to a precise level quantity gauge system. The development of sensors for measuring liquid levels has been in progress for many decades, with recorded advancements going back to at least the mid-20th century [
3]. The initial methods utilized mechanical floats and hydrostatic pressure sensors, gradually advancing to capacitive, ultrasonic, optical, and RF-guided technologies, with many factors influencing their selection, including the cost, ease of calibration and operation, response rate, accuracy, and size.
Figure 1 represents a summary of these techniques, which are categorized into direct or indirect and contact or non-contact methods. Compared with conventional float-operated level measurement systems, capacitive-based reading systems require no moving parts, increasing the reliability of such liquid quantity indicators. They have simple, rugged designs and high sensitivity in water level measurements due to the high dielectric constant. To address challenges related to linearity and environmental sensitivity, one study [
4] proposed a modified capacitance-type level transducer for versatile fluid types, while another study [
5] presented a self-calibrating interdigital design. De Palma et al. [
6] contributed a lightweight, low-cost capacitive oil level sensor optimized for aerospace applications. In [
7], further advanced design flexibility was introduced using additive manufacturing for custom sensor fabrication. Recently, significant improvements in sensitivity and dynamic response were introduced in [
8] through a novel helical electrode geometry that significantly improved the sensitivity and dynamic response. To challenge a sensor’s robustness against varying container orientations, Li et al. [
9] proposed an array of capacitive proximity sensors.
Pressure-based level measurement is another contact method that determines the liquid level by measuring the hydrostatic pressure. Hydrostatic level sensors measure the pressure exerted by the liquid column at the bottom of a tank, which is proportional to the liquid level [
10,
11,
12,
13,
14]. A similar technique can be used for liquid density estimation [
15].
In terms of non-contact approaches, vision-based measurement systems utilize cameras and image processing algorithms to track liquid levels [
16,
17], particularly in transparent tanks where light reflections can be captured. While highly accurate, vision-based methods require clear visibility, are affected by environmental lighting, and involve costly computational processing, optical sensors developed using infrared, laser, or fiber-optic techniques have also been studied to measure level variations [
18,
19,
20]. Despite their high precision, their accuracy is affected by temperature fluctuations, and they often require expensive signal processing equipment. As another non-contact approach, ultrasonic level sensors have been studied [
21]. Although they are costly, their overall stability is poor since the propagation of sound waves is susceptible to temperature, humidity, and other environmental factors. The other two well-known non-invasive systems are frequency-modulated continuous wave and pulsed radar systems. Like ultrasonic level transmitters for which beam divergence concerns impact their performance, the radar level measurement approach encounters the same issues. In [
22], an improved radar echo processing method for the non-contact monitoring of industrial tanks was presented, enhancing the resilience against multipath and noisy environments. Although interferences may result in inaccuracies in the measurement results, the performance can be improved. Guided-wave radar-based level systems are fundamentally time domain reflectometry (TDR) systems. A reflected high-frequency electromagnetic signal is processed through a suitable data processing cycle to retrieve the liquid level. In [
23], the liquid level was evaluated by analyzing the propagation delay and reflection profile of signals in two-wire probes. The high cost is the major disadvantage associated with radar level detectors. This is mainly because pulse duration measurements, with their high resolution, require high costs for the overall data acquisition system.
More recently, RF-guided and phase-shift-based techniques have emerged, allowing simultaneous measurements of the dielectric properties and signal propagation time. Phase shift measurements were used to characterize void fractions in multiphase flows in [
24]. The developed sensor is a capacitance sensor that utilizes phase shift detection to estimate the void fraction in air–water two-phase flow. Their system consists of a coaxial electrode structure excited by a sinusoidal signal, where the phase shift between the input and output signals correlates with the effective dielectric constant of the mixture.
Considering the conducting liquid levels with high temporal stability, a constant phase impedance sensor was developed by [
25] to measure the level. Their design comprises a cylindrical capacitor with electrodes immersed in the liquid, excited using a complex impedance detection circuit. Unlike conventional systems that measure either resistive or capacitive variations independently, their method maintains a fixed phase condition while tracking impedance magnitude changes. It lacks compatibility with low-permittivity or non-conductive fluids and is highly sensitive to electrode fouling and parasitic effects, limiting the application of this technique. In [
26], a dual-mode sensor was introduced using a folded bi-wire structure based on a phase shifting technique where two physically separated phenomena were combined in a single sensor. As the results show, this effect can be used to estimate the liquid level through two different determination techniques, which concern the measurement of the overall capacitance of a bi-wire and the electromagnetic wave speed, determined by the indirect measurement of the time required to travel across the conductor (phase shift), in the following indicated as the time of flight (TOF), analogous with free-space rangefinders. Since the two measurement methods are physically independent, such an approach offers an effective solution considering its intrinsic redundancy. Combining such redundancy with the capability to detect both effects simultaneously reduces the size and cost of the sensor significantly. Its safety is thanks to its flexible design, where the folded bi-wire returns to the measurement electronics, meaning all electronics can be placed outside the tank reducing the risk of potential explosion in case of crash, for example in aviation accidents.
This paper presents further improvements for this kind of sensor, especially in terms of the sensitivity in the case of liquids with low dielectric constants validated through multiphysics simulations and experimental measurements. To better explain the system, a study of the overall capacity of the segment of the transmission path was conducted in COMSOL Multiphysics (version 6.0) for different geometries while considering the liquid properties. The rest of the paper is structured as follows. In
Section 2, the principle behind the proposed system is briefly described, followed by the measurement system and detection algorithm. To tackle liquids with low dielectric constants and evaluate the optimized sensitivity,
Section 3 presents a numerical analysis considering different geometries carried out on COMSOL Multiphysics. In
Section 4, the experimental setup and measurement results are discussed in more detail. Finally, the conclusion is presented in
Section 5.
2. Level Sensor Working Principle
The basic operation of the sensor consists of estimating the liquid level by measuring the transmission characteristics of a line of length
L, such as a twisted pair, when a part of it is immersed in the liquid. To implement this, let us assume a sinusoidal wave is supplied to the line through an electrical source at frequencies in the order of a few megahertz, under impedance matching conditions, as shown in
Figure 2. The impedance matching condition implies that the impedance of the generator
and the impedance of the load
are equal to the characteristic impedance of the transmission line
(ratio between the electric field and the magnetic field of its fundamental transmission mode). Typically, for a twisted pair
this is about 120 Ω, although the technique can be applied to different transmission lines, which can be specifically designed with a desired
value. With reference to
Figure 2, the generated signal is acquired in 3 different positions: S at the source; A after the source matching impedance, at the line input; B on the load matching impedance, at the end of the line. The three positions can be acquired simultaneously by the same electronics because physically they can be very close, as the line folds and returns to the measuring electronics.
If the length of the bi-wire as the transmission line is less than 1/10 of the wavelength λ, its parameters per unit length are lumped into electrical components, where only reactance can shift the phase of the voltage along the bi-wires, while a physical length greater that 1/10 λ results in the transition of the lumped model of the bi-wires to a distributed model.
Referring to
Figure 2, it can be easily noted that the phase shift between the sinusoidal signals measured at A and S is due to the equivalent capacitance seen after the impedance
(capacitance between point A and the ground) under the lumped model, while under the distribution model, the phase shift between the signals measured at B and A is due to the TOF of the electromagnetic wave in the transmission line. In summary, between A and S, the phase shift of a single-pole low-pass circuit is measured, which varies with the capacitance, while between B and A the transit time is measured.
As presented in [
22], the changes in line capacitance depend linearly on the level of the liquid that “wets” the conductors, as does the change in TOF. Note that the sensitivity of the two measurements depends on the type of liquid (mainly on its dielectric constant) and on the geometry of the transmission line (on the percentage of the electromagnetic field of the fundamental propagation mode, which is found outside the conductors) and their protection. Note also that the two measurements are physically different, since the change in capacitance depends linearly on the dielectric constant, while the propagation speed is a function of its square root. This implies that the measurement has an intrinsic redundancy, i.e., the two measurements are independent and can provide mutual verification or additional information, such as the measurement of the dielectric constant. Furthermore, while the sensitivity of the TOF measurement increases linearly with the excitation frequency, the capacitive measurement has a maximum when the excitation frequency is equal to the pole frequency of the equivalent RC system, so it is possible to exploit the measurement at multiple excitation frequencies to acquire more information, increase the reliability of the measurement system, and improve its accuracy.
Figure 3 shows the phase-shift-based measurement system. The first implementation of this measurement system was proposed in [
22], which was based on a combination of two independent measurement systems and used to detect the level of liquid without additional modifications. It included a low-cost data acquisition card (Analog Discovery II), able to acquire and generate the signals. In a future more engineered system, the data acquisition card could be replaced by a microcontroller that manages both analog-to-digital converters (ADCs) and digital-to-analog converters (DACs), making the system really low cost.
As mentioned earlier, under the lumped approximation of transmission lines, the bi-wire parameters per unit length such as the resistance (
R), capacitance (
C), and inductance (
L) are lumped into electrical components. In this case, a variation of the liquid level causes a change in capacitance value. In such capacitance-to-phase angle conversion processes, the phase measurement can be performed in the optimum spectral range by adjusting the drive frequency.
Figure 4 presents a detailed flowchart of the measurement system, illustrating the step-by-step process, where two measurements are combined to determine the liquid level.
The system begins by initializing critical parameters such as the probe coating properties, relative permittivity (), probe length (), sampling frequency (), excitation frequency (), and operating mode (lumped or distributed model). The first step in the process is identifying the operating status. If the lumped model is selected, the system proceeds directly to measurement acquisition. Otherwise, it updates the and depending on for the distributed model before moving forward. To simplify the design and reduce the hardware complexity, the system utilizes two ADCs instead of three. Measurement point A is directly connected to ADC1, while ADC2 is shared between two different measurement points (S and B) using relays. This relay configuration allows switching between different measurement modes. Depending on the electronics, one can decide to connect the receiving end to the ADC1 and share ADC2 between point S and A.
In lumped model measurements, the phase difference between sinusoidal signals measured at points S and A is mainly due to the equivalent capacitance of the transmission line, where the presence of series resistance () enhances the sensitivity. After selecting the appropriate operating frequency, an excitation signal is generated. This signal is acquired at both point S and the output at point A using predefined sampling frequencies. To ensure the spectral integrity and minimize spectral leakage, a finite number of periods for discrete Fourier transform (DFT) calculations should be considered. As a result of performing a DFT, phase components for each measured signal are extracted by evaluating the Fourier coefficients. Later, their difference is used to fit into the instrument’s characterization curve correlating the phase shift and liquid level, enabling precise measurements. Once the lumped model measurement is completed, the system verifies whether a transition to the distributed model is necessary. If required, the operating parameters are updated accordingly, and a different measurement approach is employed.
In distributed model measurements, the traveling time between points B and A is measured. Unlike the lumped model, the TOF is derived from the phase shift of a fixed-frequency wave. To do this, the measured signal at point B is connected to ADC2 instead of point S. This enables a precise TOF estimation, which in turn provides an alternative measure of the liquid level. Once the system has been experimentally characterized to establish the linear dependence between phase shifts and the liquid level, both phase acquisition methods contribute to obtaining a final measurement. The redundancy of the two independent measurements enhances the reliability and robustness in determining the liquid level. The process concludes with the system resetting the acquisition counter and checking for any required parameter updates before starting a new measurement cycle. The performance of the developed prototype was experimentally evaluated on an unshielded twisted pair (UTP) as a passive distributed sensing element. It was covered by a thin layer of HD-PE insulation. The estimated total capacitance increased from its nominal value of 56 pF, reaching ~205 pF/m and ~78 pF/m for water (~80) and “test liquid_1”, respectively, with a 20-fold lower dielectric constant (4). The frequency of the excitation sinewave was chosen as 1 MHz for the capacitance measurements with a sample rate of 10 mega samples per second (MSPS), and the DFT was computed on 4000 samples. To measure the TOF with respect to the presence of liquids, the new sampling rate was set to 100 MS/s and the driving frequency to 7.5 MHz. These frequency values are the maximum allowed, considering the bandwidth limitations of the digital generation and acquisition system. For 6.4 m of the twisted-pair cable driven by a sinewave at 7.5 MHz, the phase shift was only due to the distance traveled by the propagated wave. As a result of the characterization, it has been experimentally demonstrated that both phase shifting measurements provide results that vary almost linearly with the liquid level. In addition, the velocity propagation for water and the test liquid extracted using TOF measurements showed a good agreement between the numerical and experimental results. Despite the achieved results, the challenge of improving the performance motivated us to study the transmission path design and tackle its sensitivity.
3. Numerical Analysis
Depending on the design and application, different types of cable can be used as transmission lines such as coax, two-pair wire, or parallel plates. In a previous study, a twisted-pair cable was considered as a transmission path [
22]. The twist per length is one of the characteristic parameters of a twisted-pair cable, which consists of two helix geometries, as represented by
T = 1/
P, where
P is the distance between any similar point on the helix, known as the length for one pitch, which can be determined using the pitch angle. In contrast to two parallel wires, different parameters should be considered in equivalent dielectric constant evaluations for such complicated geometries. To study the contribution of the pitch angle in equivalent dielectrics, a twisted-pair cable is modeled as a system having two dielectrics, surrounding material (
, and an insulation film (
, which are the function of the pitch angle (
), as illustrated in (1).
In case of submerging such a transmission path in a medium other than air, useful information can be extracted by measuring the total capacitance. Using (2), the total capacitance of the partially submerged bi-wires in liquid can be determined [
22]:
where
is the absolute permittivity of the vacuum and
k is a geometry-dependent constant. In this equation,
and
indicate the total length of the transmission path and submerged length, respectively. Unlike conventional time domain reflectometry (TDR) systems, which typically terminate with an open or short-circuited end, the transmission line in this configuration is folded back to the measurement electronics. Consequently,
x represents a calibration offset in the level measurement, as the detected liquid level corresponds to twice the wetted length of the probe. Further computation is necessary to obtain estimations of effective dielectric constants for different surrounding mediums.
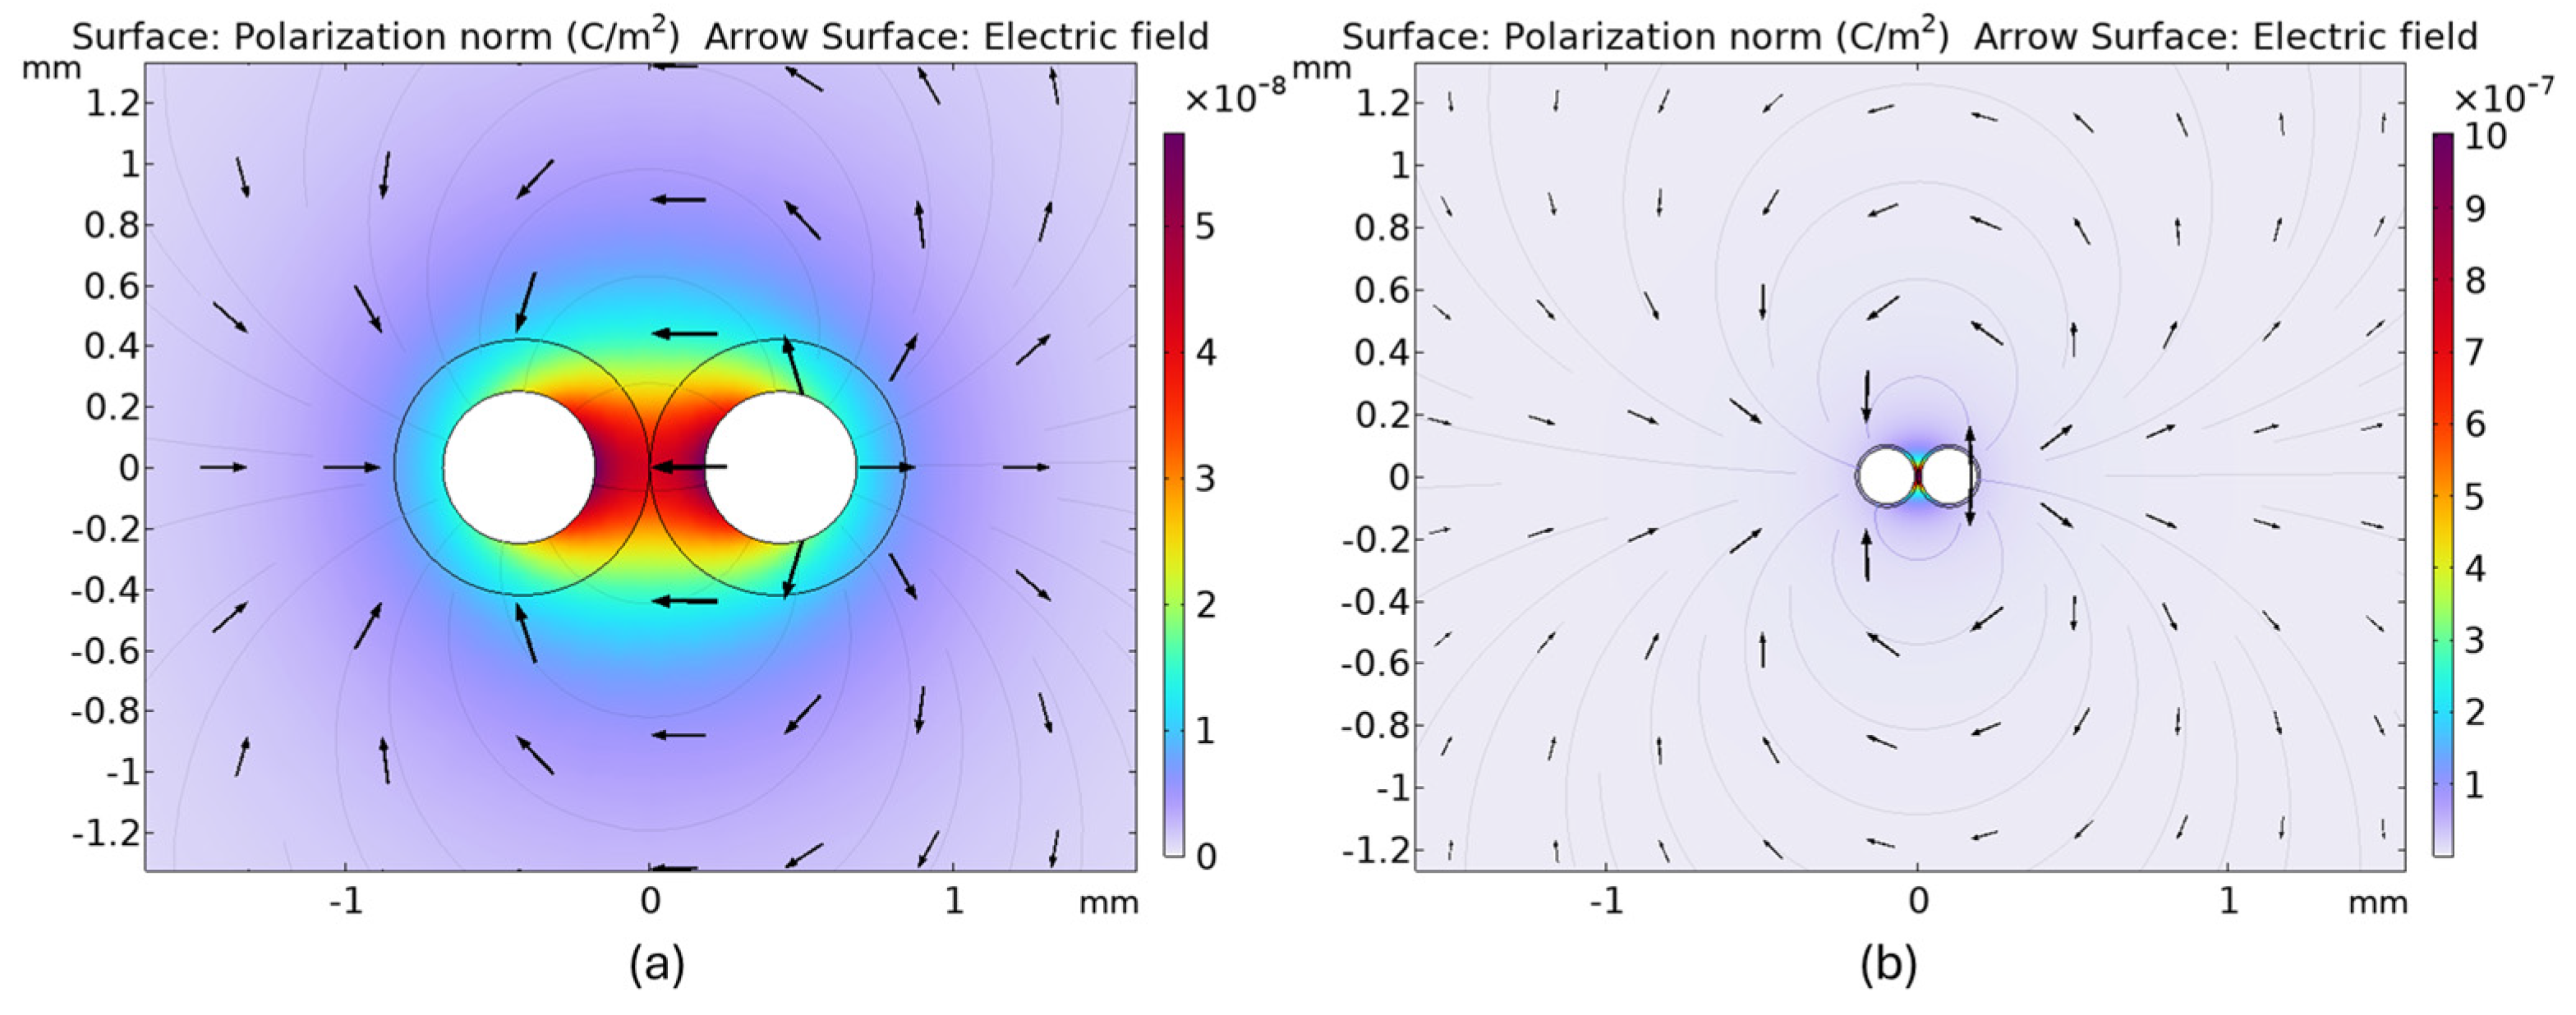
Figure 5 and
Figure 6 show the electric and polarization fields, calculated using COMSOL Multiphysics, for two different geometries (UTP and magnet wire). To accurately estimate the capacitance, the domain used to model the field was sufficiently large, with the appropriate boundary conditions. To avoid a normal current flow across the boundary, electric insulation boundary conditions were applied to the outer boundaries of the surrounding dielectric domain. This condition emulates an isolated system for electric field containment. Additionally, the conductors were modeled as perfect electric conductors (PEC), and a potential difference was applied between them to evaluate the resulting electric field and polarization distribution. In terms of mesh division, a physics-controlled mesh was employed, with an extra-fine resolution in the proximity of the conductors and surrounding insulation layers to accurately capture the high-gradient regions of the electric field. In this simulation, we applied 2 µm as the minimum mesh element size near the conductor–insulator interfaces, while coarser elements (up to 0.5 mm) were used in regions far from the active sensing area. The considered surrounding medium was water, with a dielectric constant of
. As shown in
Figure 5, the unshielded twisted pair used as the first geometry has a diameter for each wire
d = 0.5 mm (24 AWG wire conductor), while the insulator is high-density polyethylene (HD-PE). The distance between the center of the wires (
D) is 0.86 mm. The polarization magnitude is lower because the thicker insulation shields much of the field, reducing the direct interaction of the conductors with the surrounding medium (water). As shown in this figure, the less intense color gradient of the polarization confirms that the dielectric response in water is limited due to the reduced field intensity. Additionally, the increased separation between the conductors further reduces the polarization effect, as the distribution of the induced charges becomes more dispersed. The electric field appears to be more diffused and extends further into the surrounding water, creating a smooth gradient around the conductors. Additionally, they are less concentrated between the conductors, indicating a lower electrostatic interaction.
Figure 6 shows the second geometry, comprising a magnet wire, where
D = 0.2 mm and
d = 0.09 mm, with a very thin layer of insulation. In terms of the polarization and electric fields, the second geometry shows a much stronger and more localized electric field, with high-intensity regions closely surrounding the conductors. The stronger electric field induces a larger polarization response in water, resulting in a significantly higher polarization magnitude (almost 20 times higher than UTP).
The thinner insulation allows more direct electric field penetration, enhancing the polarization effect. Further amplification of the polarization magnitude is introduced by the smaller conductor separation, leading to stronger charge interactions.
Table 1 summarizes the comparison between the two geometry’s electric and polarization field characteristics, always considering water as the surrounding medium.
Figure 7 shows the electric field lines and polarization field strength considering both geometries for another test liquid with a dielectric constant of
as the surrounding medium. Due to stronger field gradients, the second geometry can effectively improve the sensitivity of the developed sensor, especially for liquids with low dielectric constants. The comparison between the total electric energy and capacitance per unit length for air (
, water
and the test liquid as surrounding mediums is presented in
Table 2, for both geometries. As shown in this table, the total capacitance per length is increased by a factor of
6 to measure the water, moving from the first to the second geometry. Such capacitance can be measured through several cost-effective and simple techniques, such as measuring the charge time with a DC current, the capacitive bridge divider, or the relaxation oscillators, or through more complex impedance metering approaches [
27].
As mentioned earlier, if the length of the transmission line is less than 1/10 of the wavelength λ, the bi-wire can be modeled with a simple equivalent circuit, where its capacitance varies due to the presence of liquid.
Following the total capacitance for two geometries and working at 7.5 MHz for the length of 1.3 m, we can estimate the sensitivity and non-linearity of the level sensor using the two geometries.
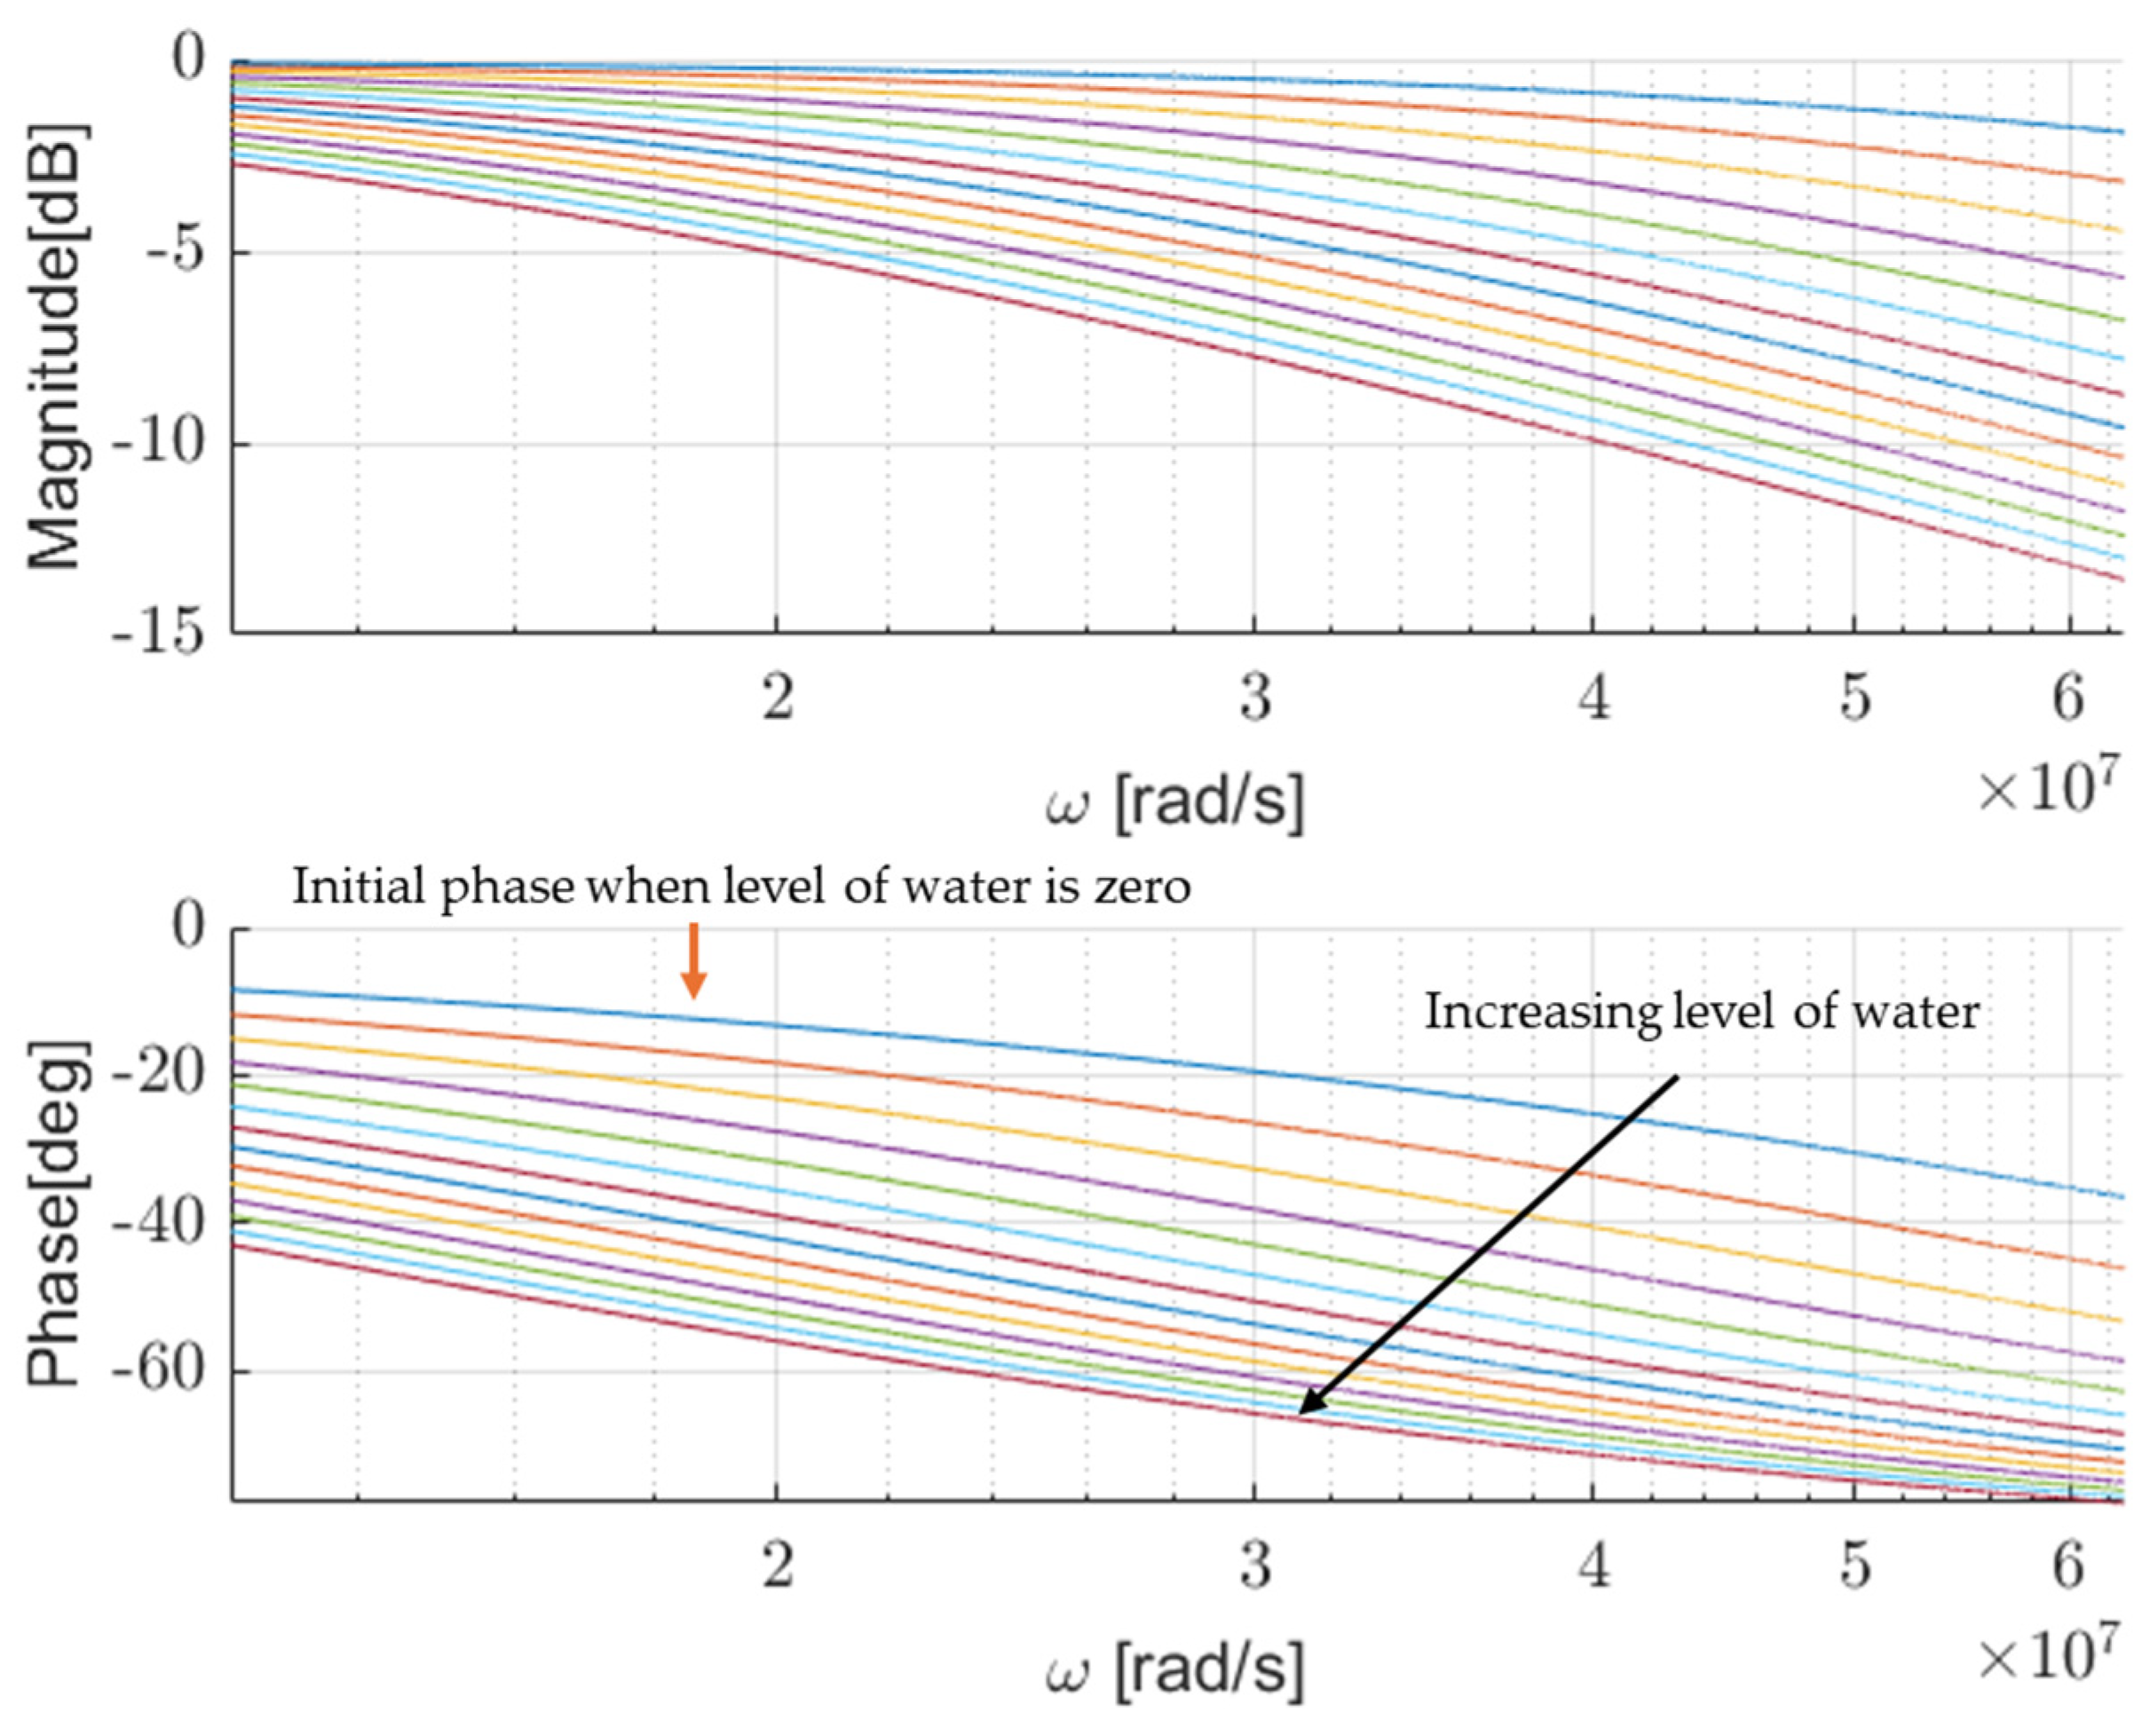
Figure 8 and
Figure 9 show the frequency response of the sensor as a function of increasing the level of the water, following the obtained simulation results for geometries 1 and 2, respectively. Here, the level of water was simulated in incremental steps of 50 mm with a maximum level of 650 mm, considering a round trip of 1.3 m, which was the probe length.
As shown in both figures, with increasing water levels (higher capacitance), the phase shift increases (a more negative shift at a given frequency), as expected by the known behavior of the lumped model of the proposed level sensor. Although the level sensor designed based on second geometry shows higher shifts compared to the first one, its behavior becomes non-linear.
Figure 10 shows the estimated characterization curve of the developed sensor, based on the two simulated geometries. It indicates the phase shift,
, in degrees as a function of increasing the level of liquid (water) in mm. For the first geometry, the phase shift decreases in an almost linear manner with the increasing water level, while for the second geometry it follows a non-linear curve, with higher sensitivity at lower levels.
4. Experimental Results
The prototype used to perform the level measurements and validate the simulation results is shown in
Figure 11. The experimental setup was duplicated for the prototype including UTP and magnet wires. A typical UTP-CAT5 cable was utilized as the twisted pair. The conductor had a diameter of 0.5 mm and was made of solid copper of 24 AWG (American wire gauge). The insulation was made of high-density polyethylene (HD-PE), which has a dielectric constant of about 2.3. The conductors were spaced 0.86 mm from one another. Magnet wire, also known as enamelled wire, is used in the construction of transformers and several other applications where tight coils of insulated wire are required. In general, magnet wire is a copper–aluminium wire that is coated with a very thin layer of insulation. Here, the magnet wire was a single-core copper conductor, with a diameter of 0.09 mm, covered by a thin enamel insulation layer approximately 5 µm thick and a dielectric constant of ~3.2. The spacing between parallel wires was 0.2 mm in the assembled probe. The prototype included a data acquisition card (model Analog discovery2 (AD2)) that managed the signal generation and acquisition. The data elaboration and analysis were performed using LabVIEW from National Instrument. The AD2 is a versatile instrument that integrates both ADCs and DACs for signal acquisition and generation. The ADC has a 14-bit resolution and maximum sampling rate of 100 MS/s, allowing precise measurements of analog signals with minimal quantization error. It features two differential input channels with a bandwidth of 30 MHz and an adjustable voltage range of ±25 V.
The DAC in AD2 provides a 14-bit resolution with a 100 MS/s update rate, capable of generating analog signals across two output channels with a voltage range of ±5 V and a bandwidth up to 12 MHz. It is used to generate a 7.5 MHz sinusoidal excitation signal with a peak-to-peak voltage of 4 V, which is applied to the sensor electrodes under impedance matching conditions. In order to reduce the number of synchronous samplers, relays are used to share the second ADC, instead of using three ADCs to acquire signals at three different points. The relays are driven by digital I/O implemented in AD2, to select the measurement of capacitance variations or TOF values. The ADCs simultaneously acquire both the excitation signal and the sensor’s output signal, ensuring precise phase shift detection. The state machine (
Figure 4) manages the cyclic measurements of both the capacitance and TOF, to detect the level simultaneously. In the elaboration cycle, using digital synchronous detection on 4000 points, the acquired signals are processed to extract Fourier coefficients, which are then elaborated to determine capacitance variations corresponding to liquid level changes.
To perform measurement campaigns, a custom-designed capacitive touch probe with a comb-like geometry was developed as the reference instrument to detect liquid contact events with high sensitivity. The probe consists of vertically oriented interdigitated electrodes patterned on an FR4 substrate, forming a sensitive area of 10 mm in height and 20 mm in width, with 1 mm spacing between fingers. The entire structure is mounted on a linear actuator driven by a stepper motor with 50 µm resolution per step. The probe is vertically actuated inside a cylindrical glass tank (50 cm in height, 9 L capacity), while its capacitance is continuously monitored. The control system automatically drives the probe downward and records the capacitance as a function of the depth. Two key positions are extracted: (1) the point where the capacitance begins to increase, indicating initial liquid contact with the fingers; (2) the point beyond which the capacitance no longer increases, meaning the sensitive zone is fully immersed. The liquid level is estimated as the midpoint between these two positions, with further correction possible based on the known offset between the actuator zero and the sensitive area. The system achieves femtofarad resolution, in such a way that the level resolution is only limited by the stepper motor to 50 µm.
In the presented measurement campaign, the phase shift was measured by increasing the level of the water and test liquid up to 220 mm in steps of 20 mm, for both UTP and magnet wires. For a fair comparison, all experimental conditions—such as the liquid type, immersion depth, signal source, and measurement setup—remained the same for both the UTP and magnet wires. A comparison between the simulated and measured phase shifts versus the water levels, for both geometries, is shown in
Figure 12. Geometry 1, where UTP cables were used as bi-wires, shows a nearly linear phase shift reduction with the water level, with the measured values closely following the simulation. The magnet wire instead exhibits a more non-linear pattern, with the measured values following the simulation trend but with some deviations. This indicates that the insulator thickness is probably somewhere slightly higher than the nominal value. We preferred to show the simulation results corresponding to nominal values instead of finding the best fit, considering also that the real insulator thickness is not perfectly uniform along the wire (the diameter variation is up to 20%).
Figure 13 shows simulation and measured values of the phase shift as a function of the liquid level, in the case of a liquid with a dielectric constant of
[
28].
While the UTP-based sensor’s response was less pronounced, it aligned closely with the simulation for ε = 2.11. As expected from the simulation results, a stronger interaction with the medium and more pronounced changes in δΦ were obtained from the sensor developed with magnet wire. As shown in
Figure 13, the measured data (both for the UTP and magnet wires) fall within the expected range for the liquid dielectric constant, confirming the correctness of the simulated models. When working with low dielectric constant liquids, magnet wire provides enhanced sensitivity, improved model alignment, and reduced measurement noise, rendering it a better choice for accurate level measurements. Additionally, the capability to identify even minor changes in capacitance is vital for measuring liquids with very low dielectric constants (
< 3), such as organic solvents, oils, and some industrial chemicals, as conventional sensors might not work effectively due to insufficient permittivity differences.
5. Conclusions
A new liquid level measurement technique has recently been proposed [
22]. The liquid level is estimated via radio-frequency phase shift measurements, through two different determination methods, which concern the measurement of the overall capacitance and propagation time of the electromagnetic radiation in a bi-wire partially immersed in liquid. In this study, we investigated how the system sensitivity depends on the bi-wire geometry, proposing two examples of common wires: unshielded twisted-pair (geometry 1) and magnetic (geometry 2) wires. The performances of the level sensors were simulated in COMSOL Multiphysics and experimentally validated for both types of wire. The simulation results showed that the magnet wire produced significantly higher electric field intensity and polarization magnitude values, leading to increased sensitivity. Additionally, the numerical simulations evaluated the capacitance per unit length for different surrounding mediums, including air, water, and a test liquid with a low dielectric constant. For water, geometry 1 reached 1.59 × 10
−10 F/m, while geometry 2 reached 7.61 × 10
−10 F/m, a substantial increase that confirms its effectiveness for high-sensitivity level measurements. These capacitance differences directly impact the sensor’s performance, as a higher capacitance variation leads to greater phase shift changes, ultimately improving the resolution and accuracy during liquid level detection. To confirm the numerical findings, an experimental setup was developed using both UTP-CAT5 and magnet wires as the sensing elements. The measured phase shifts confirmed the numerical predictions, with the magnet wire showing a significant improvement in sensor performance. This study paves the way for the realization of a sensor with high resolutions even for liquids with low dielectric constants, such as fuels. While the results presented in this paper confirm the promising performance of the proposed guided-wave level sensor under controlled laboratory conditions, several practical challenges remain to be addressed. First, the impact of temperature on the sensor’s functionality, specifically its influence on the dielectric constant of the liquid being measured and the propagation speed, has not been experimentally examined in this research, although the compensation of temperature effects is based on well-known techniques. For example, for limited temperature variations it is possible to apply a simple correction function, as is done for fuel level gauges [
29]. Another very effective approach could be to keep a known path always submerged as a calibration reference. Our upcoming efforts will concentrate on temperature compensation approaches and multi-frequency excitation techniques to identify and adjust for temperature-induced variations. Moreover, assessing the long-term performance continues to be an unresolved issue. Extended soaking, thermal cycling, and accelerated aging tests will be considered in future research studies to examine these effects. These actions are essential for converting the exhibited laboratory results into dependable and strong industrial applications, while exploring new transmission line shapes and materials, to enhance the equilibrium between sensitivity, linearity, and stability.


