1. Introduction
Accuracy measurements of inductance are usually made against non-computable reactance in the form of compact, stable reference standards of inductance or capacitance. Accurate inductance values can be determined by comparing the reactance of the inductor with that of a standard capacitor or stable inductor using appropriate bridges [
1]. To achieve optimum measurement accuracy with any AC bridge, it is necessary to consider the residual effects, techniques to reduce these effects, and the correction terms [
2,
3]. Various inductor calibration methods and bridges have been developed in National Metrology Institutes (NMIs). Most of the developed methods are based on the following principles: the substitution comparison principle [
4,
5,
6,
7], the Maxwell–Wien bridge [
1,
8,
9,
10], and the Wye-Delta bridge [
11].
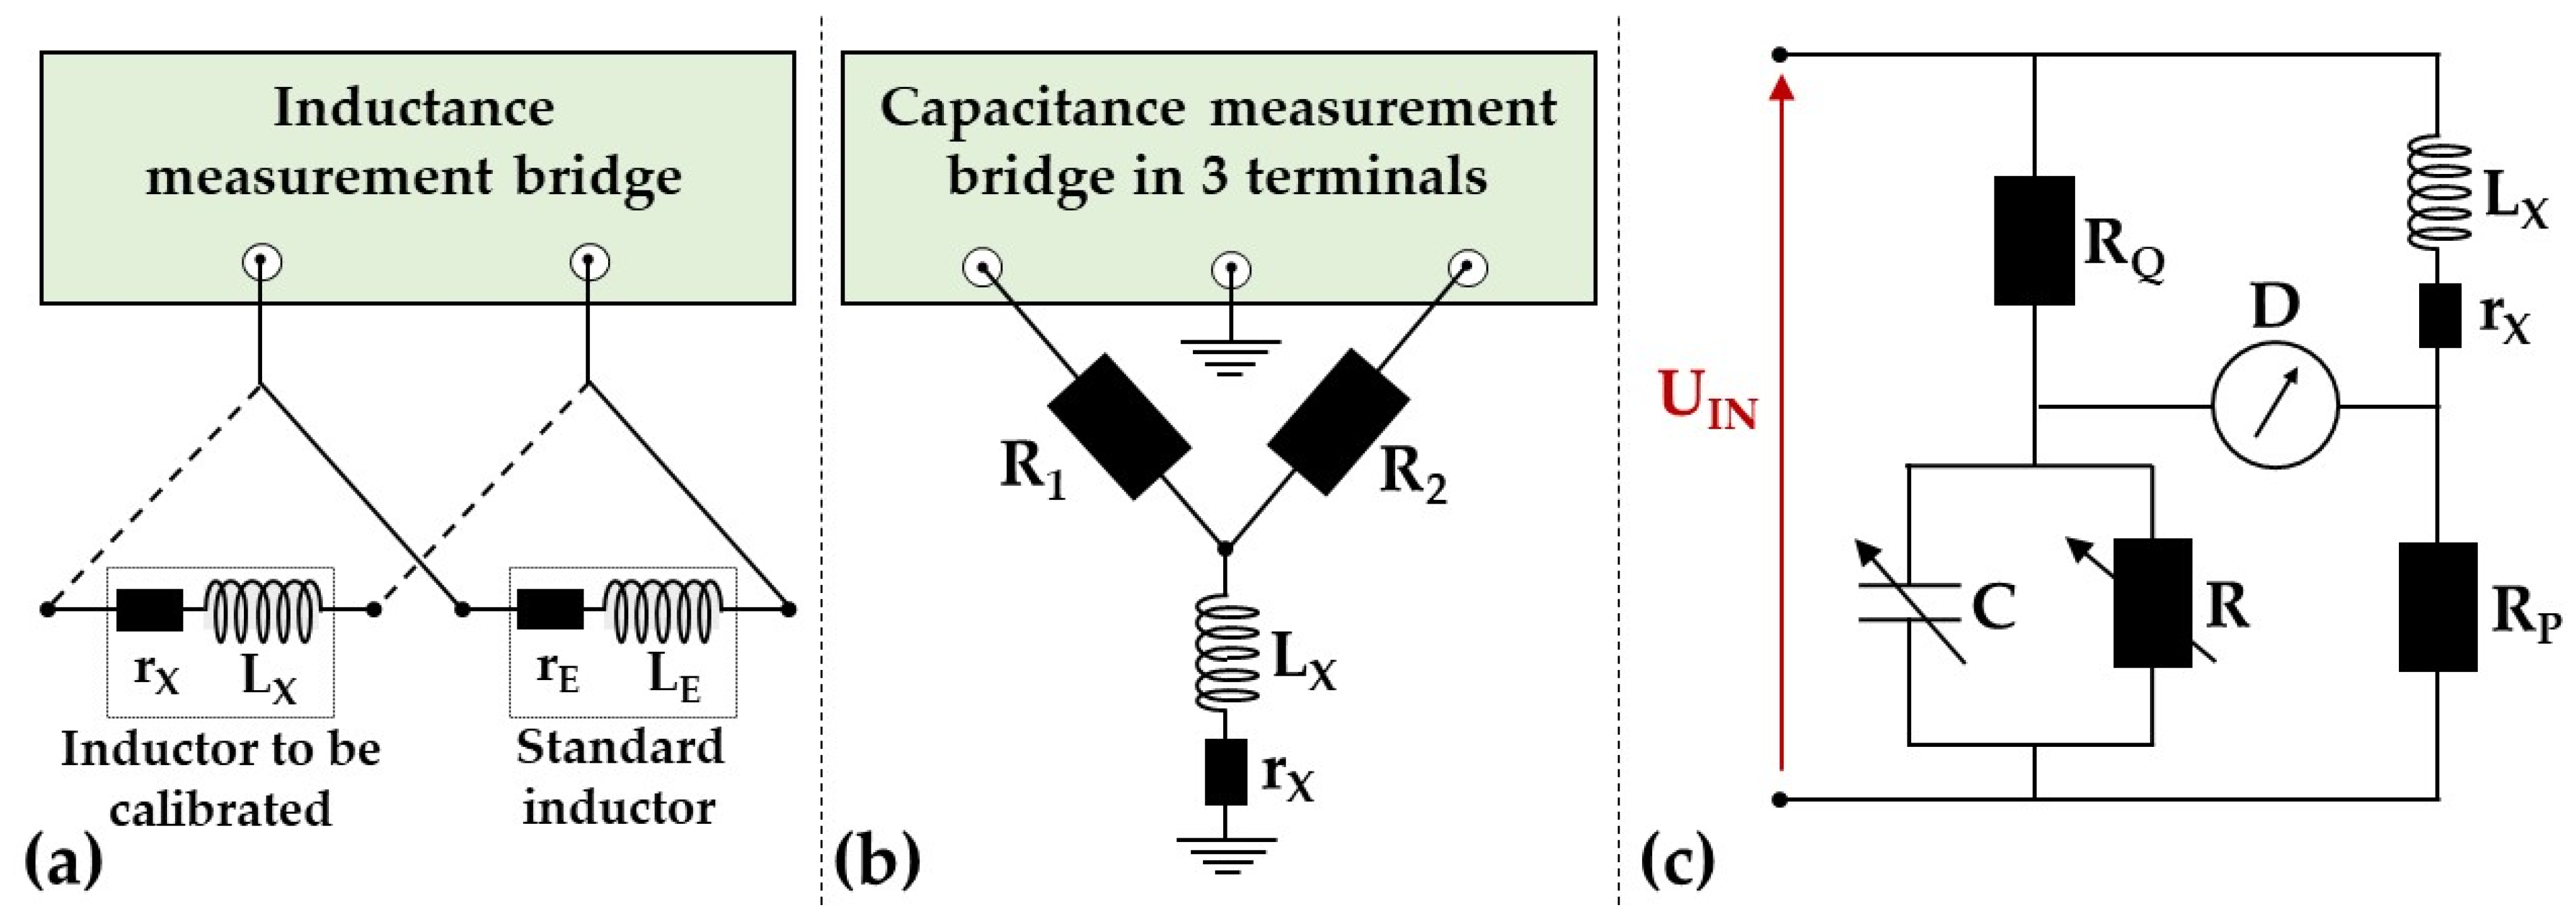
The substitution comparison method is based on a comparison between two inductors (standard and to be calibrated), using an inductance measurement bridge as a transfer standard [
4]. Inductances can be defined as two or three terminals. The principle of measurement is shown in
Figure 1a. This method is limited to punctual values corresponding to the nominal values of the standard inductors. This bridge is used in the LNE calibration chain to calibrate most of the customer inductors. Another approach to this principle is to use fully digital electronic impedance bridges, such as PXI modules, which have been developed considerably in recent years [
12]. These bridges are based on the measurement of digitized signals using high-precision AC voltmeters or on a direct comparison between the inductance to be calibrated and a standard capacitor (or resistor), where the phase difference is determined using the high-precision electronic waveform synthesizers. These digital bridge systems are relatively simple to set up and allow full automation. However, the frequency and amplitude ranges are limited by the electronic instruments used. In addition, the level of possible uncertainties is limited (a few 1 × 10
−3% of the inductance) compared to other calibration principles, described below. These limitations are mainly due to the calibration of the digital instruments used [
12].
The Maxwell–Wien bridge is a modification of the Wheatstone bridge, used for traceable inductance measurements [
1]. This bridge has the advantage of operating over a wide frequency range, as the first-order bridge equation is independent of the measurement frequency. The principle of the bridge is shown in
Figure 1c. At the LNE, the first version of this bridge was used to calibrate inductors from 1 mH to 10 H and frequencies from 60 Hz to 10 kHz. It is based on a standard voltage source and an inverter circuit to supply the bridge. The bridge was limited to fixed frequencies up to 10 kHz due to the drift of the voltage source and the system used to ensure the balances required for the metrological configuration of the bridge. Although Maxwell–Wien bridges for inductance calibration are accurate to better than 10
−6, they are difficult to set up and configure. They require specific expertise and qualifications, as well as long measurement times. The main existing bridges are manual, which limits their frequency of use [
8]. The use of PXI digital modules with bridge automation allows fast and traceable measurements with relatively improved uncertainties compared to digital bridges.
The Wye-Delta (or Y/Δ) bridge is based on the use of a capacitance bridge and two standard resistors. The inductance to be calibrated is connected to the two standard resistors in a Wye-Delta configuration (see
Figure 1b). The impedance between the high and low terminals of the bridge is a capacitance due to the transformation of the wye (or Y) network into a delta (or Δ) network. The inductance value is then determined as a function of the measured capacitance and the standard resistors used. At the LNE, this bridge is used to calibrate low values of three terminals’ standard inductances, typically from 100 nH to 1 mH in a frequency range from 60 Hz to 10 kHz. In general, this principle is used to calibrate very low values of inductance (typically less than 100 µH), which are difficult to calibrate using other calibration methods either because of the very low voltage levels across the inductance in digital bridges or the unavailable high values of standard capacitors in Maxwell–Wien bridges.
At the LNE, standard inductors are calibrated every 5 years. Depending on the value of the inductance, the measurement method used is either the conventional Maxwell–Wien bridge for inductances from 1 mH to 10 H at frequencies from 60 Hz to 10 kHz or the Wye-Delta bridge for inductances from 100 nH to 1 mH at frequencies from 60 Hz to 10 kHz. This paper presents the improvement of the Maxwell–Wien bridge for the calibration of standard inductors from 100 µH to 10 H with frequencies from 20 Hz to 20 kHz. The parasitic effects of leakage impedance, parasitic capacitance, and parasitic mutual inductance are taken into consideration and minimized. These improvements allow us to extend the inductance range from 100 µH (instead of 1 mH), to extend the frequency range, and also to semi-automate the bridge. The equation and uncertainty budget are also detailed in this paper.
Compared with existing calibration bridges, the Maxwell–Wien bridge improved in this article is a combination of the advantages of the digital bridges most widely used currently for their easily automated measurements and the advantages of conventional Maxwell–Wien bridges that offer low uncertainty levels. These improvements have been achieved over a large scale of inductance values (100 µH to 10 H) and frequencies (20 Hz to 20 kHz).
2. Presentation of the LNE Improved Maxwell–Wien Bridge
The Maxwell–Wien bridge allows us to calibrate an inductor by comparison with a variable standard capacitor, in parallel association with a standard resistor, on the bridge modified by the Wagner artifice. The inductor to be calibrated is represented as the series form of the complex impedance (jLx.ω + rx). The frequency range covered depends on the value of the inductor to be calibrated. The frequency limit is mainly due to the resonance frequency f0 of standard inductors, which decreases with increasing inductance value (e.g., f0 = 79 kHz for 10 mH and f0 = 5.1 kHz for 10 H).
For inductances typically less than 5 mH, the equivalent impedance of the inductor to be calibrated and the bridge impedance ZP (for RP) defined in four-terminal-pair (4TP) configuration is less than 400 Ω up to 20 kHz. However, to ensure balance with variable standard capacitor and resistor values for low uncertainties, the impedance ZQ (for RQ) is defined in a two-terminal pair (2TP) configuration with values typically above 400 Ω. The use of high-impedance differential stages between the two bridge sections is necessary to ensure bridge balance.
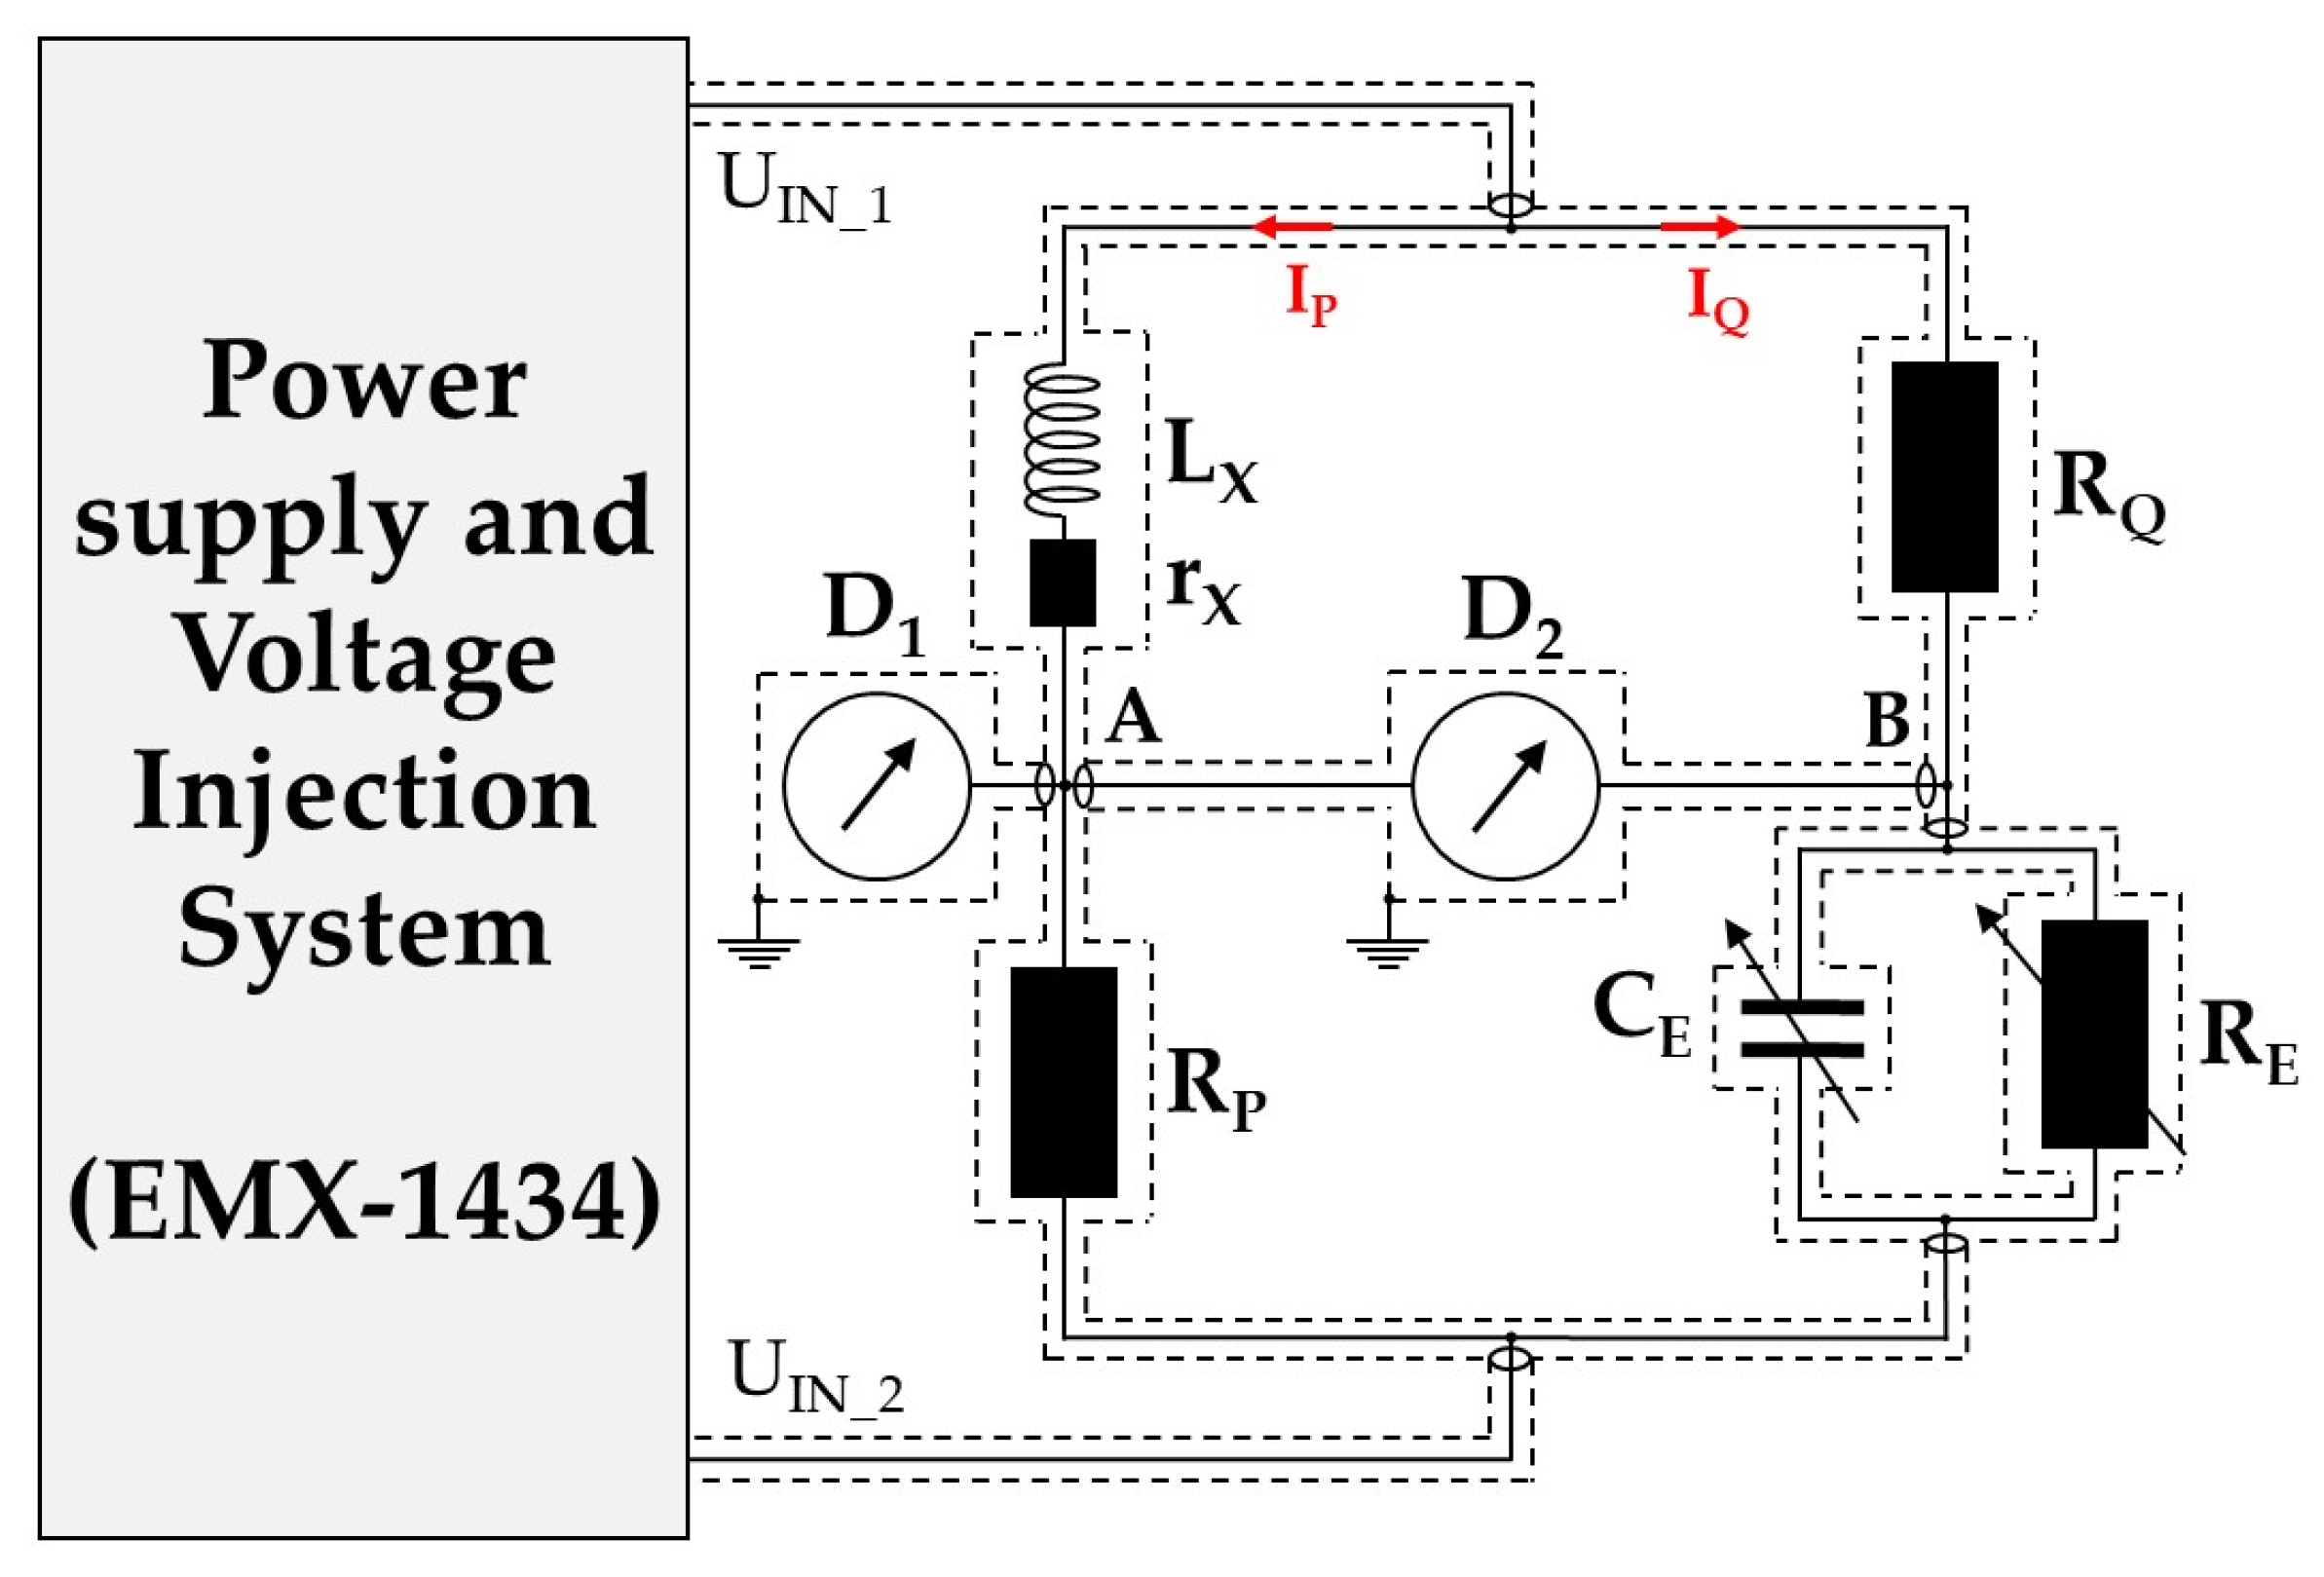
Two setups have been developed and adapted according to the inductance to be calibrated: a Maxwell–Wien bridge for inductances from 5 mH to 10 H (see
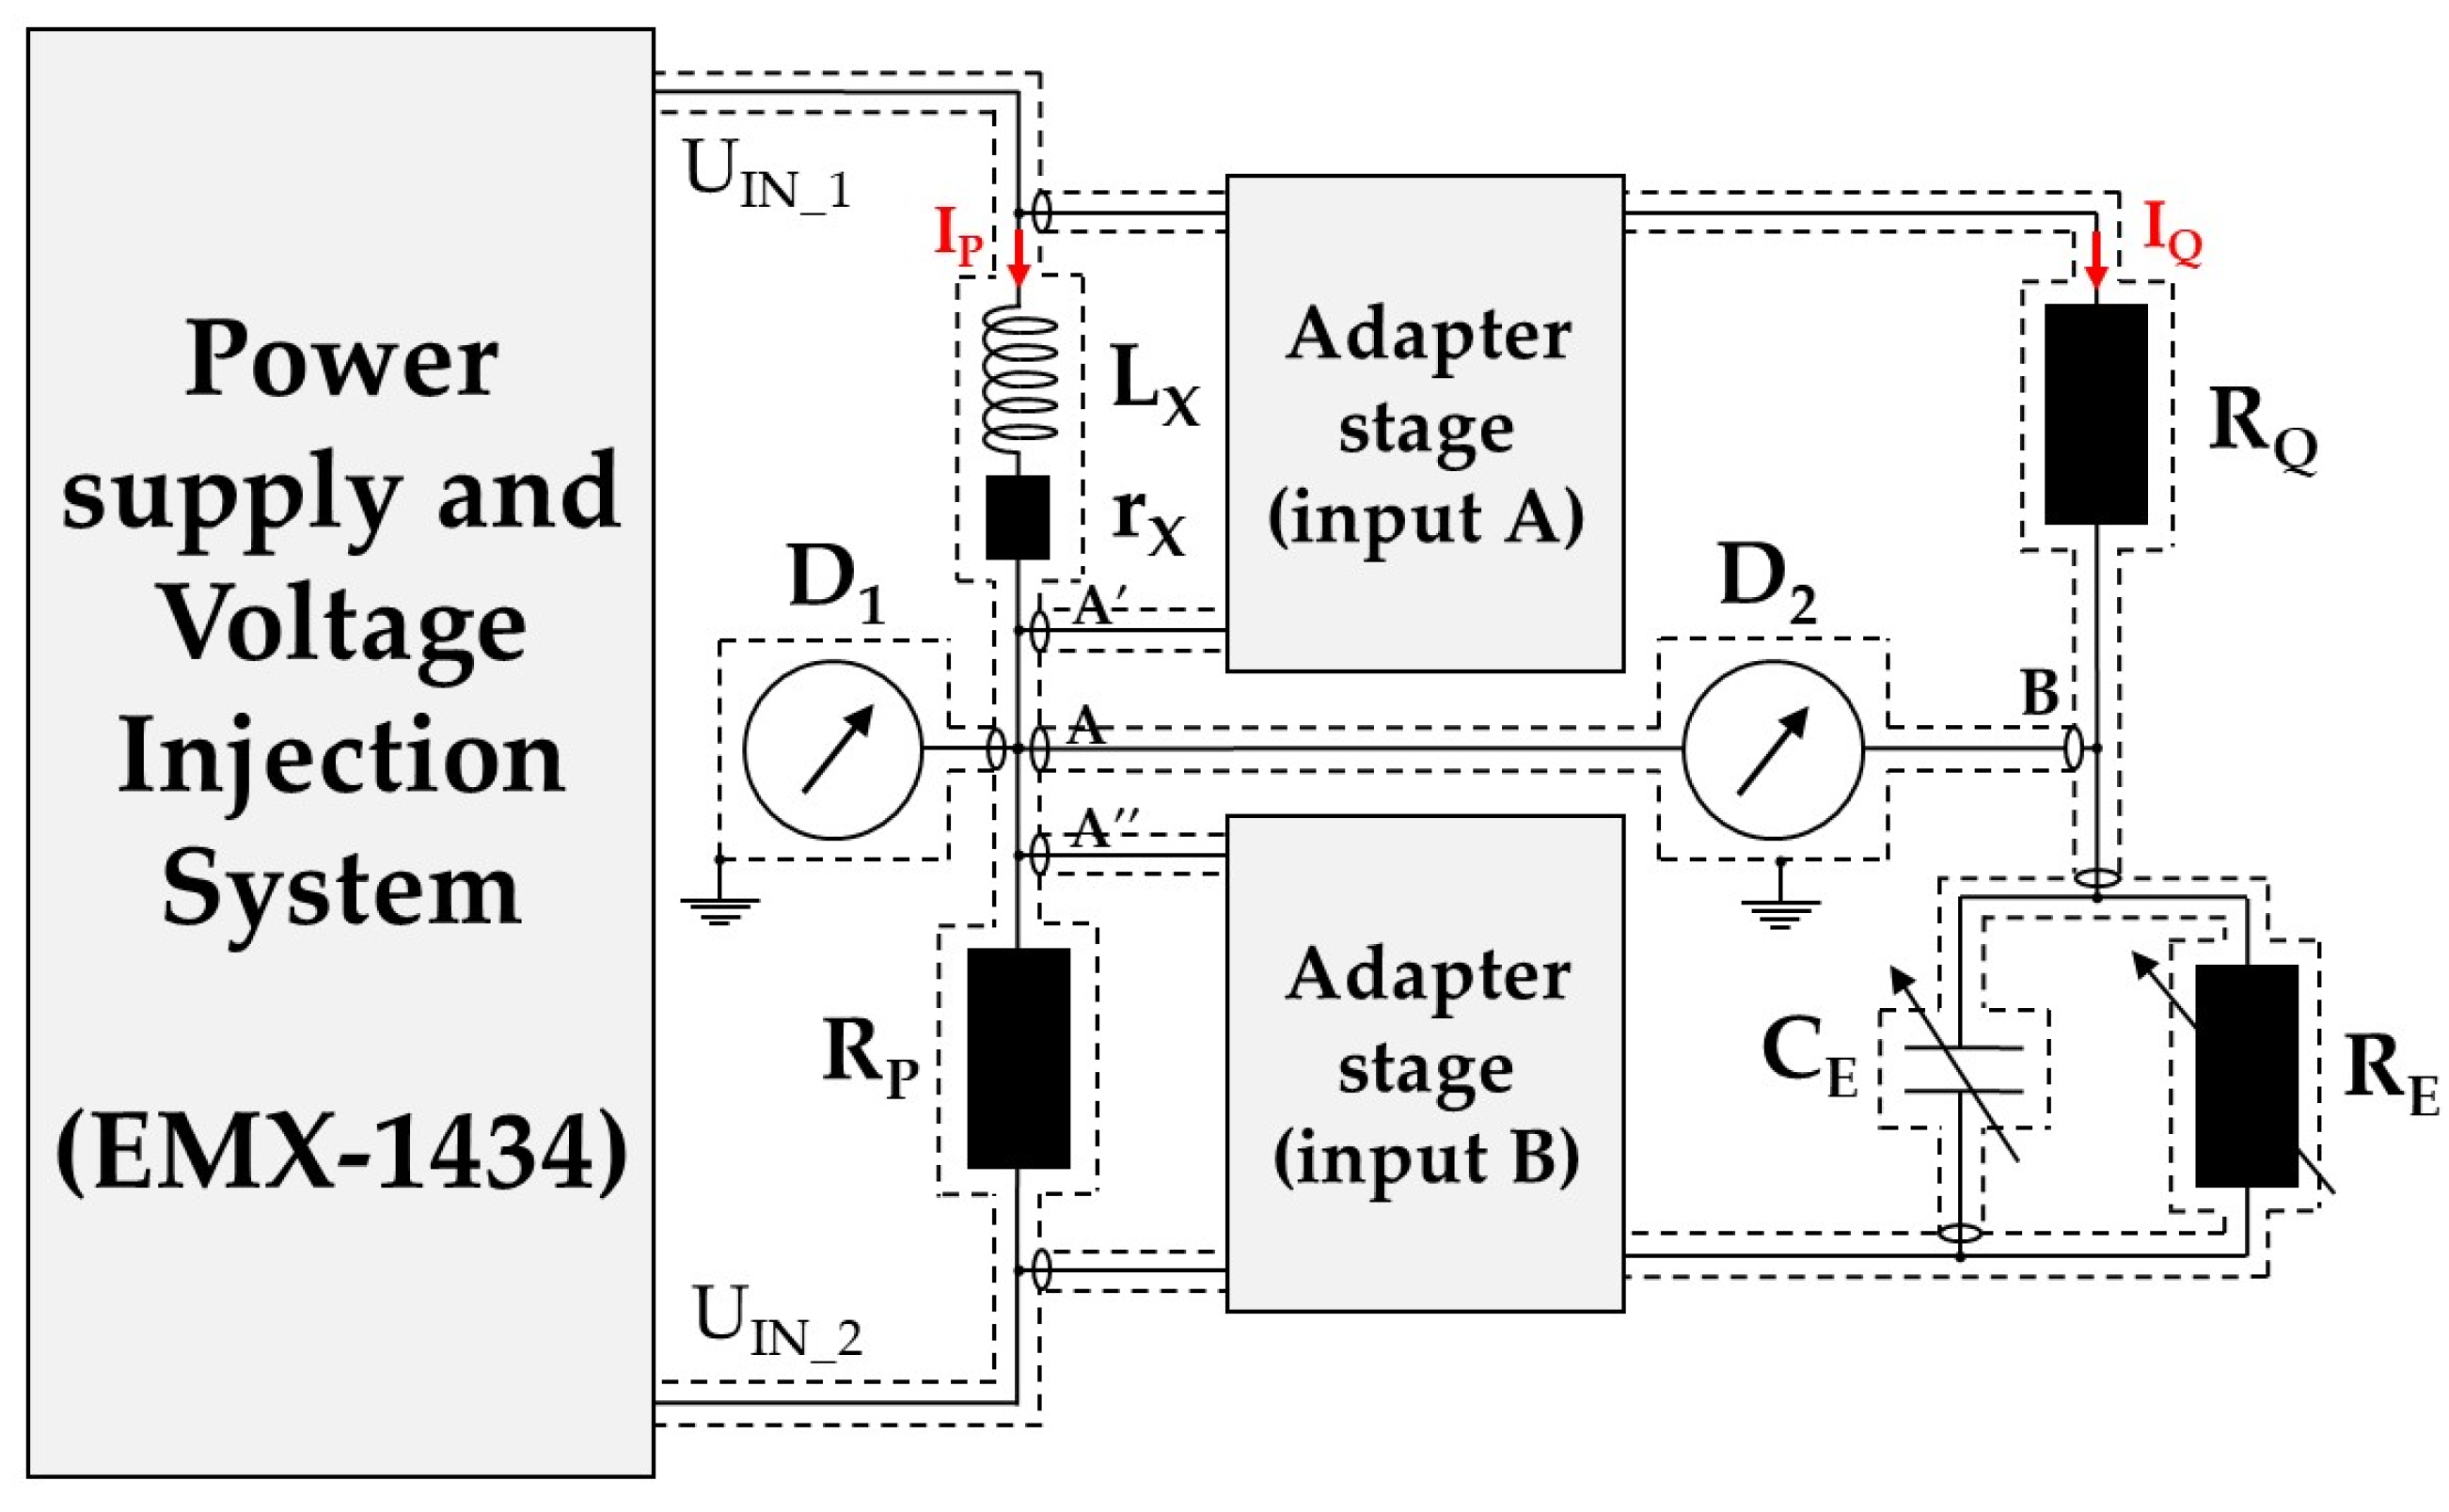
Figure 2) and a Maxwell–Wien bridge with high-impedance stages for inductances from 100 µH to 5 mH (see
Figure 3). The high-impedance differential stages (adapter stages A and B) are the main difference between the two bridges used for inductance calibration. These stages eliminate the influence of voltage losses between the nodes A A′ and A A′′. The connection lengths between these nodes have been minimized. The adapter stages are designed with triaxial input connectors to limit internal leakage (internal guard) [
13].
Digital null detectors
D1 and
D2 are used to ensure bridge balances. The detector used is a lock-in amplifier with an 8-bit programmable digital output port for system control. It is characterized by a frequency range of 1 mHz to 120 kHz and a voltage sensitivity of 20 nV to 1 V full-scale. The supply voltages
UIN_1 and
UIN_2 are generated by PXI EMX-1434 modules [
14]. These modules allow independent control of the amplitude and phase of the generated voltages, permitting two supply voltages to be generated with a 180° phase shift. The generated voltage values are corrected for the DC residual. The bridge has two balances: the first to ensure the metrological configuration of the bridge impedances by obtaining zero potentials at node A (equalization of the currents flowing in the central conductor and in the bridge impedance shield), its balance is detected on null detector
D1. The second is to ensure the main balance of the bridge by adjusting standard variable resistance
RE and standard variable capacitance
CE, whose balance is detected on null detector
D2. The capacitance
CE and resistance
RE are calibrated after the bridge balance using a commercial impedance meter from 20 Hz to 50 Hz and the commercial capacitance bridge AH 2700A from 50 Hz to 20 kHz.
In order to ensure an optimal balance of the bridge, leakage impedances to ground at nodes A and B and all sources of mutual parasitic inductance variations are minimized during calibration. The bridge is implemented using short cables between nodes A or B and the null detectors, ensuring that the effects of capacitance and inductance are negligible per cable length. The bridge is coaxial, with a current equalization between the central conductor and the shield to protect the circuit from electromagnetic interferences and ensure metrological impedance configuration. An adapter was used to switch from inductor terminals to BNC coaxial connectors. It was developed using an enclosed box to define its electromagnetic environment. It reduces the influence of any capacitance variation between the inductance terminals on its calibration.
3. Inductor Calibration
In this paper, the calibration equations to determine the inductance
LX and internal resistance
rX are detailed for inductors between 5 mH and 10 H, using the Maxwell–Wien bridge shown in
Figure 2. Using Ohm’s law and Kirchhoff’s law at bridge balance, the complex voltages of the impedances
ZX (=
rX +
jLX ω),
ZP (for
RP),
ZQ (for
RQ), and
ZE (for
CE in parallel with
RE) are given by the following:
where
IP is the calibration current flowing through impedances
ZX and
ZP, and
IQ is the current flowing through impedances
ZQ and
ZE, as shown in
Figure 2.
UIN_1 and
UIN_2 are the bridge supply voltages.
The currents
IP and
IQ are given at the bridge balance by the following:
The impedance
ZE is a parallel association between capacitance
CE and resistance
RE(
f), given by the following:
where
ω is the pulsation (=2π
f).
Using Equations (2) and (3), the inductance to be calibrated is given by the following:
The resistors
ZP and
ZQ are complex impedances (
Z) that can be expressed as follows:
where
RDC is the DC resistance, Δ
s(
f) is the series variation in the impedance at the measurement frequency
f, and
τ(
f) is the time constant at the measurement frequency
f.
Replacing
ZP and
ZQ by their complex expressions in Equation (4) and neglecting the second-order terms, the parameters of the inductor to be calibrated are defined by the following:
For inductors between 100 µH and 5 mH (see
Figure 3), the electrical voltages using Ohm’s law and Kirchhoff’s law in the bridge balance are given by the following:
where
GA and
GB are the complex gains of the high-impedance stages of inputs A and B, respectively. The nominal values of the gains are equal to 1.
The calibration current
IP is then given for the first bridge using Equation (2). The current
IQ is given as a function of the gains of the high-impedance stages by the following:
The errors of the high impedance stages were found to be less than 40 μV/V for gain and 26 μrad for phase shift up to 20 kHz. These corrections were checked and validated before the adapter stages were used. These values allow us to neglect the corrections associated with the GA/GB gain ratios in the inductance calibration. This hypothesis then allows us to define the equations for the inductor parameters to be calibrated as in Equation (6).
4. Uncertainty Budget
The uncertainty components described in this section are compatible with the observations made during the calibration. The values considered are maximized, i.e., equal to 3σ (empirical rule). The main uncertainty components considered, and summarized in
Table 1, are as follows:
Calibration uncertainty of the standard resistors
RP and
RQ in DC (UR1): The bridge standard resistors are used as references for inductance measurements with the developed bridge. These resistors are calibrated in DC using a comparison bridge with standard resistors compared to the LNE quantum Hall effect standards [
15]. The uncertainty on the DC resistance is equal to 1 µΩ/Ω (k = 1).
Calibration uncertainty of the standard resistors
RP and
RQ in AC (UR2): The standard resistors are also calibrated in AC up to 20 kHz using a semi-automatic Wheatstone bridge for resistors defined in two- and four-terminal pairs (2TP and 4TP) [
13,
16]. The frequency uncertainties are negligible. For a 1 kΩ resistor, the uncertainties on the relative variation ∆
s of the series resistance and the phase
ωt are less than 1 µΩ/Ω (k = 1) and 0.94 µrad (k = 1), respectively, up to 20 kHz.
Calibration uncertainty of the standard capacitance CE (UR3): The nominal values of the bridge elements are chosen to obtain a capacitance CE of less than 10 nF. This choice ensures low uncertainties in the capacitance measurement of CE. The standard capacitor is calibrated using a commercial impedance meter from 20 Hz to 50 Hz and the commercial capacitance bridge AH 2700A from 50 Hz to 20 kHz. For capacitances between 1 nF and 10 nF, the expanded relative uncertainties are less than 1 × 10⁻³% from 20 Hz to 50 Hz and 2.5 × 10⁻³% from 50 Hz to 20 kHz.
Calibration uncertainty of the standard resistance RE (UR4): The resistance RE is determined by measuring the equivalent conductance using the same bridges as the capacitance CE. The expanded relative uncertainties are less than 2.7 × 10⁻⁴% from 20 Hz to 20 kHz.
Calibration uncertainty of the voltage source supply (UR5): The EMX-1434 modules are calibrated prior to inductance measurements by checking the voltage levels and phases. They are calibrated using an automated comparator based on the AC-DC transfer [
17]. The uncertainties of the generated voltage are less than 1.6 µV (k = 1) up to 20 kHz.
Uncertainty related to the drift of the capacitance bridge between two calibrations:
- -
For capacitance CE (BLC1): The drift of the AH 2700A bridge and the commercial impedance meter is negligible compared to the measurement resolution for the different capacitance values measured. Therefore, this component is considered negligible.
- -
For resistance RE (BLR1): The bridge drift for resistance measurement does not exceed 1 × 10⁻³% between two successive calibrations. Considering a uniform probability distribution, the estimated relative uncertainty (k = 1) is 5.8 × 10⁻⁴%.
Uncertainty related to resolution, stability and sensitivity of the capacitance bridge:
- -
For capacitance CE (BLC2): The errors related to the resolution, sensitivity and stability of the AH 2700A bridge and the commercial impedance meter have been estimated for the various capacitance values. Using a uniform probability distribution, the relative uncertainties considered (k = 1) are 2 × 10⁻⁵% for capacitances below 0.5 nF, 1 × 10⁻⁴% for capacitances from 0.5 nF to 1 nF, 6 × 10⁻⁵% for capacitances from 1 nF to 2 nF, 2 × 10⁻⁴% for capacitances from 2 nF to 5 nF, and 1 × 10⁻⁴% for capacitances above 5 nF.
- -
For resistance RE (BLR2): This component has been estimated under measurement conditions, and its value is negligible for this uncertainty budget.
Uncertainty related to the temperature effect on the capacitance bridge:
- -
For capacitance CE (BLC3): The inductance is measured at an ambient temperature of 23.0 ± 0.5 °C. The temperature coefficient of the bridge is estimated to be less than 10 ppm/°C. The relative uncertainty value considered for the temperature effect is equal to 35 × 10−5% (k = 1).
- -
For resistance RE (BLR3): Based on the same measurement conditions, the error related to the variation of resistance as a function of temperature is estimated to be 5 × 10⁻⁵%. Considering a “U” probability distribution in the temperature range, the estimated relative uncertainty is 35 × 10−6% (k = 1).
Uncertainty related to the leakage impedance sensitivity of the capacitance bridge:
- -
For capacitance CE (BLC4): The effect of leakage impedance is estimated during capacitance measurements. This error is estimated to be 0.01 pF for a measured capacitance of 500 pF and 0.015 pF for measured capacitances of 1000 pF and 2000 pF. For capacitance values above 2000 pF, the resulting effect cannot be dissociated from the display stability of the AH 2700A bridge and commercial impedance meter. The relative uncertainty considered is 1 × 10⁻³% (k = 1).
- -
For resistance RE (BLR4): This component is negligible in this uncertainty budget.
Uncertainty related to the effect of neglected second-order terms in calculation equations (BL1): This component is related to equation modeling. Neglecting the second-order terms introduces a frequency correction to the product of ZP and ZQ impedances. During measurements, this component is negligible compared to the calibration components of the calibration standard resistor for inductances less than 1 H. This component is less than 12 × 10−6% (k = 1) for inductances between 1 and 10 H.
Uncertainty related to the parallel capacitance effect of the terminal connector of the inductor to be calibrated (BL2): The use of a specific connector (4TP–2T adapter) minimizes the increase in parallel parasitic capacitance across the inductance to be calibrated. The effect of this parasitic capacitance (less than 0.01 pF) is considered insignificant compared to the measurement uncertainty. Therefore, the correction of its effect on the inductance value is difficult. However, the reproducibility of this capacitance (in the order of 0.02 pF) is considered a component of the uncertainty. The parasitic capacitance will affect the measured inductance; its estimated uncertainty is less than 6 × 10⁻⁴% (k = 1).
Effect of high impedance stages (BL3): This error relates to the calibration and adjustment of the differential inputs of the high impedance stages for inductances from 100 µH to 5 mH. The associated series variation uncertainty Δs can be increased by a component of 1 μV/V (k = 1) up to 20 kHz. For phase shift measurements, considering a rectangular probability distribution, the estimated uncertainty is less than 4.1 μrad (k = 1) up to 20 kHz.
Table 1.
Uncertainty budget for inductance calibration from 20 Hz to 20 kHz with the developed bridge.
Table 1.
Uncertainty budget for inductance calibration from 20 Hz to 20 kHz with the developed bridge.
| Uncertainty Component | Symbol | Uncertainty Value (k = 1) |
|---|
| Calibration uncertainty of the standard resistors RP and RQ in DC | UR1 | 1 × 10⁻⁴% |
| Calibration uncertainty of the standard resistors RP and RQ in AC | UR2 | Refer to the calibration certificate for each resistor |
| Calibration uncertainty of the standard capacitance CE | UR3 | 25 × 10−4% |
| Calibration uncertainty of the standard resistance RE | UR4 | 27 × 10−5% |
| Calibration uncertainty of the voltage source supply | UR5 | ≤1.6 µV |
| Uncertainty related to the drift of the capacitance bridge between 2 calibrations | BLC1 | ≈0 |
| BLR1 | 58 × 10−5% |
| Uncertainty related to resolution, stability, and sensitivity of the capacitance bridge | BLC2 | 2 × 10⁻⁴% |
| BLR2 | ≈0 |
| Uncertainty related to the temperature effect on the capacitance bridge | BLC3 | 35 × 10−5% |
| BLR3 | 35 × 10−6% |
| Uncertainty related to the leakage impedance sensitivity of the capacitance bridge | BLC4 | 1 × 10⁻³% |
| BLR4 | ≈0 |
| Uncertainty related to the effect of neglected second-order terms in calculation equations | BL1 | 12 × 10−6% for the inductance 1 H < LX < 10 H |
| Uncertainty related to the parallel capacitance effect of the terminal connector of the inductor to be calibrated | BL2 | 6 × 10⁻⁴% for the inductance LX |
| Influence of high-impedance stages | BL3 | ≤1 μV/V and ≤4.1 μrad |
All the parameters used to determine the characteristic parameters of the inductance to be calibrated (the values of the inductance
LX and the resistance
rX) are independent. The uncertainties of these parameters are determined using the law of propagation of uncertainties [
18].
5. Experimental Validation
Inductance calibration from 100 µH to 10 H for frequencies from 20 Hz to 20 kHz is performed with the developed bridge and presented in this paper. The measurements are performed in a laboratory controlled for temperature (23 ± 0.5 °C) and humidity (45 ± 5%). The measured reference inductors have a low drift (less than 2% for values ranging from 100 µH to 10 H) and a low frequency dependence (less than 8% for the same inductance ranges, up to 20 kHz). Prior to the improvements described in this paper, the values of inductance Lx and internal resistance rx, for the frequencies 20 Hz to 60 Hz and 10 kHz to 20 kHz, were obtained by interpolation. Comparison of the interpolated results with those obtained with the new improved bridge validates the results in this frequency range.
Measurements are made at the following frequencies: 20 Hz, 60 Hz, 120 Hz, 400 Hz, 1 kHz, 2 kHz, 5 kHz, 10 kHz and 20 kHz. The standard inductor of 100 mH is measured by two different operators on different days to assess the reproducibility of the measurements. The difference between the two measurements is negligible considering the uncertainties. The resistors
RP and
RQ are adjusted for each inductor to obtain the required calibration current and also to ensure a capacitance
CE of less than 10 nF, thus ensuring lower uncertainties.
Table 2 shows the nominal calibration current and the nominal values of the bridge elements for the calibrated standard inductors.
The calibration results are compared with those obtained in 2018. The calibration results for the inductors of 100 mH and 10 H are given in
Table 3 and
Table 4, respectively. For the inductor of 10 H, the measurements are limited to 1 kHz due to the significant variation of the equivalent impedance at frequencies above 1 kHz and its resonance frequency
f0 (
f0 = 5.1 kHz).
These experimental results validate the developed bridge and ensure the traceability of the standard inductors. The same results were confirmed for other calibrated inductors. The relative expanded uncertainties of the inductance and internal resistance are less than 0.02% and 0.2%, respectively, from 20 Hz to 20 kHz.
The inductor of 100 µH is measured by two methods: the developed bridge and the Wye-Delta bridge. The calibration results, for measurements in 2024, of the two measurement methods are compared, including the uncertainty of each method. The results of the comparison are shown in
Table 5.
Figure 4 shows the absolute values of the normalized error ratios (NER) of the value of inductance
LX and internal resistance
rX obtained by the bridge presented here compared with the calibration results for 2018. The NER obtained is less than 1 for all the measured inductances. These results confirm the validation of the developed bridge and also show the consistency between the uncertainties of the Wye-Delta bridge and those of the Maxwell–Wien bridge.
6. Discussion
The proposed calibration method improves the accuracy of inductance measurements at the LNE. The method is mainly intended for the calibration of standard inductances. The most important uncertainty components in the uncertainty budget for the determination of the inductance
LX are those related to the standard capacitance
CE, the phase of the standard resistors
RP and
RQ, and the quadrature injected voltage. However, the uncertainty of the internal resistance
rX is mainly influenced by the standard resistor
RE, the series variation in the standard resistors
RP and
RQ and the in-phase injected voltage. The improved uncertainties of the standard resistances
RP and
RQ, using the bridge from [
16], mainly improved the uncertainties of the internal resistance
rX compared with the previous bridge (by at least a factor of 5).
The time required to balance the bridge manually limits its use for the calibration of customer inductances. It is then planned to fully automate the bridge in order to use it to calibrate customers’ inductances. This approach can be achieved by replacing the variable capacitor
CE and variable resistor
RE with fixed-value standards and a voltage injection system based on PXI modules, as shown in
Figure 5a. The capacitor and resistor values are chosen to ensure nominal balance of the bridge. A set of standards will be used to calibrate mainly the inductance standards of the LNE. The injection system automatically ensures the balance of the bridge, which is indicated on the null detector
D2. It consists of two PXI generators for the in-phase and quadrature components and an injection transformer with a ratio of 100. However, the use of an injection system increases the inductance calibration uncertainties. This increase is mainly due to the influence of the relative uncertainties on the voltage injected with the
CE and
RE standards, which becomes more important (less than 7 × 10
−3% up to 20 kHz) than the influence of the calibration of the
CE and
RE standards in the semi-automatic bridge (less than 2 × 10
−3% up to 20 kHz). Therefore, the semi-automated bridge is mainly used for standard inductance calibration, while the fully automated bridge is used for routine calibration, which at LNE will replace the direct comparison bridge based on the substitution comparison method.
The PXI modules used are high-performance 24-bit arbitrary source modular boards. These modules can generate sine waves in both continuous and burst modes, with frequencies from sub-1 Hz to 93 kHz. However, the commercial capacitance bridge AH 2700A used to ensure traceability of the standard capacitor
CE and standard resistor
RE measurements is characterized by an operating frequency range of 50 Hz to 20 kHz, which limits the frequency range of the bridge developed and presented in this paper. To extend the frequency range beyond 20 kHz, there are two possible approaches: either a resonance method or a comparison method. The resonance method is based on the principle of a Maxwell–Wien bridge [
9] but requires prior characterization of standards at frequencies above 20 kHz. The second method is based on a comparison between the inductance to be calibrated and a standard resistor (see
Figure 5b). The voltages across the inductor
LX and the standard resistor
RE are measured by sampling using standard digitizers. The use of the latest generation of precision digitizers ensures calibration up to 1 MHz.
7. Conclusions
In this paper, an improvement of the Maxwell–Wien bridge used at the LNE to calibrate inductors between 100 µH and 10 H at frequencies between 20 Hz and 20 kHz is presented. The bridge developed is based on the use of PXI modules that combine the advantages of digital bridges, which facilitate measurement automation, with those of conventional Maxwell–Wien bridges, which provide the lowest levels of uncertainty. The principle and methodology of ensuring measurement traceability and the uncertainty budget, including the main uncertainty components, are detailed in this paper. In order to confirm the validations presented in this paper by complementary measurements, interlaboratory comparisons will be carried out in the same frequency ranges.
A comparison between the calibrations performed in 2018 and the measurements obtained validates the bridge. A comparison study with the method based on the Wye-Delta bridge has been performed, and the differences observed are negligible. The bridge is currently used to calibrate standard inductors. The relative uncertainties are less than 0.02% of the measured inductance and 0.2% of the internal resistance from 20 Hz to 20 kHz. These improvements allow a Maxwell–Wien bridge upgrade with lower uncertainties than existing bridges over the full frequency range from 20 Hz to 20 kHz.
The methodology applied and proposed in this paper, based on the use of PXI modules, facilitates the semi-automatic control of the bridge, in particular to ensure the metrological configuration of the bridge. Uncertainty is reduced by minimizing the parallel capacitance effect of the terminal connector through the use of a ground plane and shielded cables that are as short as possible. Future improvements to this method are scheduled to fully automate the measurements and balance determination, using a set of pre-calibrated capacitor and resistor standards (fixed values) and a voltage injection system based on PXI modules. This automation will mainly be used to calibrate customer inductors. In addition, a perspective was also presented for extending the frequency range up to 1 MHz. The frequency extension method is based on the comparison of the inductance to be calibrated with a standard resistor in a complex phase-shifted plane and using standard digitizers for voltage measurements.
Author Contributions
Conceptualization, M.O. and E.P.; methodology, M.O.; software, M.O.; validation, M.O. and E.P.; formal analysis, M.O.; investigation, M.O.; resources, M.O. and E.P.; data curation, M.O.; writing—original draft preparation, M.O.; writing—review and editing, M.O.; visualization, M.O.; supervision, E.P.; project administration, M.O.; funding acquisition, M.O. All authors have read and agreed to the published version of the manuscript.
Funding
This research received no external funding.
Data Availability Statement
The data presented in this study are available on request from the corresponding author. The data are not publicly available due to ethical restrictions.
Conflicts of Interest
The authors declare no conflicts of interest.
References
- Zapf, T. Calibration of Inductance Standards in the Maxwell-Wien Bridge Circuit. J. Res. Natl. Bur. Stand. Sect. C Eng. Instrum. 1961, 65C, 183. [Google Scholar] [CrossRef]
- Dewi Mohd, K.; Dan Bee, K.; Wan-Seop, K. Influence of Adaptor on the Calibration of Inductance Standards. In Proceedings of the 21st IMEKO TC4 International Symposium and 19th International Workshop on ADC Modelling and Testing Understanding the World through Electrical and Electronic Measurement, Budapest, Hungary, 7–9 September 2016. [Google Scholar]
- Lin, J.; Chen-Joe, F.; Wu, A. Error Analysis of Scanner in Automated Inductance Calibration System. In Proceedings of the Conference on Precision Electromagnetic Measurements, Ottawa, ON, Canada, 11–14 June 1990; pp. 360–361. [Google Scholar]
- Overney, F.; Jeanneret, B. Realization of an Inductance Scale Traceable to the Quantum Hall Effect Using an Automated Synchronous Sampling System. Metrologia 2010, 47, 690. [Google Scholar] [CrossRef]
- Bee Kim, D.; Su Shin, S.; Kim, W.-S.; Kucera, J. Realization of Inductance Scale Using Digital Bridges at Low Frequencies. IEEE Trans. Instrum. Meas. 2024, 73, 1005207. [Google Scholar] [CrossRef]
- Waltrip, B.; Seifert, F. A Programmable Capacitor for Inductance Measurements. IEEE Trans. Instrum. Meas. 2017, 66, 1572–1578. [Google Scholar] [CrossRef]
- Yonenaga, A.; Nakamura, Y. Inductance Calibration Method Using a Commercial LCR Meter. In Proceedings of the 2004 Conference on Precision Electromagnetic Measurements, London, UK, 27 June–2 July 2004; pp. 597–598. [Google Scholar]
- Hanke, R.; Kolling, A.; Melcher, J. Inductance Calibration in the Frequency Range from 50 Hz to 1 MHz at PTB. In Proceedings of the Conference Digest Conference on Precision Electromagnetic Measurements, Ottawa, ON, Canada, 16–21 June 2002; pp. 186–187. [Google Scholar]
- Skubis, T.; Met, A.; Kampik, M. A Bridge for Maintenance of Inductance Standard. IEEE Trans. Instrum. Meas. 1999, 48, 1161–1165. [Google Scholar] [CrossRef]
- Muciek, A. A System for Calibration of Inductance Standards Based on a Simple Unbalanced Transformer Bridge. IEEE Trans. Instrum. Meas. 1996, 45, 306–309. [Google Scholar] [CrossRef]
- Shah, C.; Rao, I.R. Wye-Delta and Delta-Wye Transformations of Proximally-Coupled Inductor Triads. In Proceedings of the 2021 International Conference on Intelligent Technologies (CONIT), Hubli, India, 25–27 June 2021; pp. 1–6. [Google Scholar]
- Marzano, M.; D’Elia, V.; Ortolano, M.; Callegaro, L. Primary Realization of Inductance and Capacitance Scales with a Fully Digital Bridge. IEEE Trans. Instrum. Meas. 2022, 71, 1503008. [Google Scholar] [CrossRef]
- Ouameur, M.; Vasconcellos, R.; Agazar, M. Digital Impedance Bridge for Four-Terminal-Pair AC Resistor Calibration up to 20 kHz. Metrology 2024, 4, 1–14. [Google Scholar] [CrossRef]
- EMX-1434. Available online: https://www.vtiinstruments.com/Products/Functional%20Test/EMX%20Series/EMX-1434 (accessed on 19 February 2024).
- Brun-Picard, J. A New Generation of Quantum Standard Based on the Quantum Hall Effect. Ph.D. Thesis, Université Paris Saclay (COmUE), Paris, France, 2018. [Google Scholar]
- Ouameur, M.; Vasconcellos, R.; Agazar, M.; Thévenot, O.; Patois, E. New Impedance Bridge at LNE for the Two Terminal-Pair AC Resistor Calibration up to 20 kHz. Metrologia 2022, 59, 055005. [Google Scholar] [CrossRef]
- Poletaeff, A. Automated Comparator for Accurate AC-DC Difference Measurements at the BNM-LCIE. IEEE Trans. Instrum. Meas. 1999, 48, 412–414. [Google Scholar] [CrossRef]
- JCGM 100:2008(E); Evaluation of Measurement Data—Guide to the Expression of Uncertainty in Measurement. JCGM: Sèvres, France, 2008.
| Disclaimer/Publisher’s Note: The statements, opinions and data contained in all publications are solely those of the individual author(s) and contributor(s) and not of MDPI and/or the editor(s). MDPI and/or the editor(s) disclaim responsibility for any injury to people or property resulting from any ideas, methods, instructions or products referred to in the content. |
© 2025 by the authors. Licensee MDPI, Basel, Switzerland. This article is an open access article distributed under the terms and conditions of the Creative Commons Attribution (CC BY) license (https://creativecommons.org/licenses/by/4.0/).


