Communication

Improving Experimental Design through Uncertainty Analysis

Idaho National Laboratory, Idaho Falls, ID 83415, USA
*
Author to whom correspondence should be addressed.
These authors contributed equally to this work.
Metrology 2023, 3(3), 246-253; https://doi.org/10.3390/metrology3030014
Submission received: 24 April 2023 / Revised: 9 June 2023 / Accepted: 16 June 2023 / Published: 28 June 2023
(This article belongs to the Collection Measurement Uncertainty)

Abstract

:
In this paper, the development of a fission-gas collecting and physical-analysis-enabling instrument was proposed for small-volume determination. Analysis specifications require a design capable of accurately and repeatably determining volumes in the range of 0.07–2.5 mL. This system relies on a series of gas expansions originating from a cylinder with known internal volume. The combined gas law is used to derive the unknown volumes from these expansions. Initial system designs included one of two known volumes, 11.85 ± 0.34 mL and 5.807 ± 0.078 mL, with a manifold volume of 32 mL. Results obtained from modeling this system’s operation showed that 0.07 mL can be determined with a relative expanded uncertainty greater than 300% (k = 2) for a single replicate, which was unacceptable for the proposed experimental design. Initial modeling showed that the volume connecting the known volume and rodlet, i.e., the manifold volume, and the sensitivity of the pressure sensor were key contributors to the expanded uncertainty of the measured rodlet volume. The system’s design limited the available options for pressure sensors, so emphasis was placed on the design of the manifold volume. The final system design reduced the manifold volume to 17 mL. These changes in design, combined with replicate analysis, were able to reduce the relative expanded uncertainty by ±12% (k = 2) for the 0.07 mL volume.

1. Introduction

The Small-scale Advanced Testing Gas Assessment System (SATGAS) shown in Figure 1 is being developed for the purpose of sampling fission gasses from spent-fuel rodlets and is expected to be coupled to the Gas Assay, Sample and Recharge (GASR) system in the Hot Fuel Examination Facility (HFEF) at the Idaho National Laboratory (INL). Traditionally, a complete fuel rod is punctured, and the plenum volume is analyzed using the GASR while the sample gas is collected in a sample-collection vessel [1,2,3]. Rodlets have a significantly smaller plenum volume and diameter than a typical fuel rod and require a specialized manifold for the accurate assessment of various experimental parameters. The rodlet plenum volumes are expected to be between 0.07 and 2.5 mL. By identifying the factors impacting uncertainty prior to manufacturing, efforts can be made to minimize the contribution from each. The uncertainty on the measured rodlet volume is expressed as an expanded uncertainty to more adequately represent the accuracy of the value through the inclusion of a coverage factor. Through this analysis, theoretical minimum uncertainties can be determined. The manipulation of system volumes, rodlet volumes, and the number of times the expansion was performed can lead to experimental modifications that allow for a reduction in the expanded uncertainty of the rodlet–volume determination [4].
In order to accurately model the system using the ideal gas law, Equation (1)—where P is pressure, V is volume, n is the number of moles of gas, R is the gas constant, and T is temperature—must adequately describe gas interactions [5].
P V = n R T
This means that the system pressure and temperature must be in ranges at which the interactions between atoms are negligible. The system volume was assumed to be constant throughout the experiment because the temperature change over the course of the experiment is zero, and the pressure range over which the data is modeled should not impact the dimensions of the material of construction. Without a physical system to test, the estimation of gas loss is difficult. To simplify the model, gas loss was assumed to be negligible.
With the assumption that the number of gas moles remains constant, the ideal gas law can be rearranged into the combined gas law, see Equation (2)—where PSTD, PX, TSTD, and TX are the measured pressure and temperature. The initial volume, VSTD, is a portion of the system with a known volume, and VX is the total system volume to be measured. The subscripts STD, define the values in the standard, and X defines the expanded values for the first or second expansion.
P S T D V S T D T S T D = P X V X T X
The volume can be determined using multiple methods [6,7,8]. Due to the accuracy requirements and handling restrictions for irradiated materials, the gas-expansion method was chosen. The simplest experiment one can use to facilitate this process involves expanding gas directly from a known volume into the rodlet volume while measuring the P and T of the gas. However, the known volume and rodlet volume must be connected via a manifold. Because this method of determination is indirect, the evaluation of uncertainty becomes more complicated. To perform volume measurements using this method, the volume defined at VSTD is first pressurized with gas, then isolated. The pressure, PSTD, and temperature, TSTD, of the gas are measured. Then, the remaining system volume is evacuated so that gas is only inside the known volume. The gas in the known volume is then expanded into the portion of the system that connects the known and rodlet volumes (defined as the manifold volume). The temperature, T1, and pressure, P1, are measured for the first expansion. The combined volume of the known and manifold volumes is then determined using Equation (2), where X = 1. A second expansion of the gas is then performed into the rodlet volume, and the temperature, T2, and pressure, P2, are measured. The total system volume can then be determined using Equation (2), where X = 2. The rodlet volume, VRodlet, is then calculated using Equation (3).
VRodlet = V2V1
A temperature of 298.15 K was used throughout the model. This simplifies the calculations. The inclusion of temperature in the calculation accounts for its contribution to the expanded uncertainty. It is important to note that the absolute temperature is irrelevant for the determination of the unknown volume. However, the relative change in the temperature over the course of a single expansion is important. Here, the temperature was assumed to remain constant over the timeframe of a single expansion. Based on the historical performance of the GASR system, this assumption is accurate.

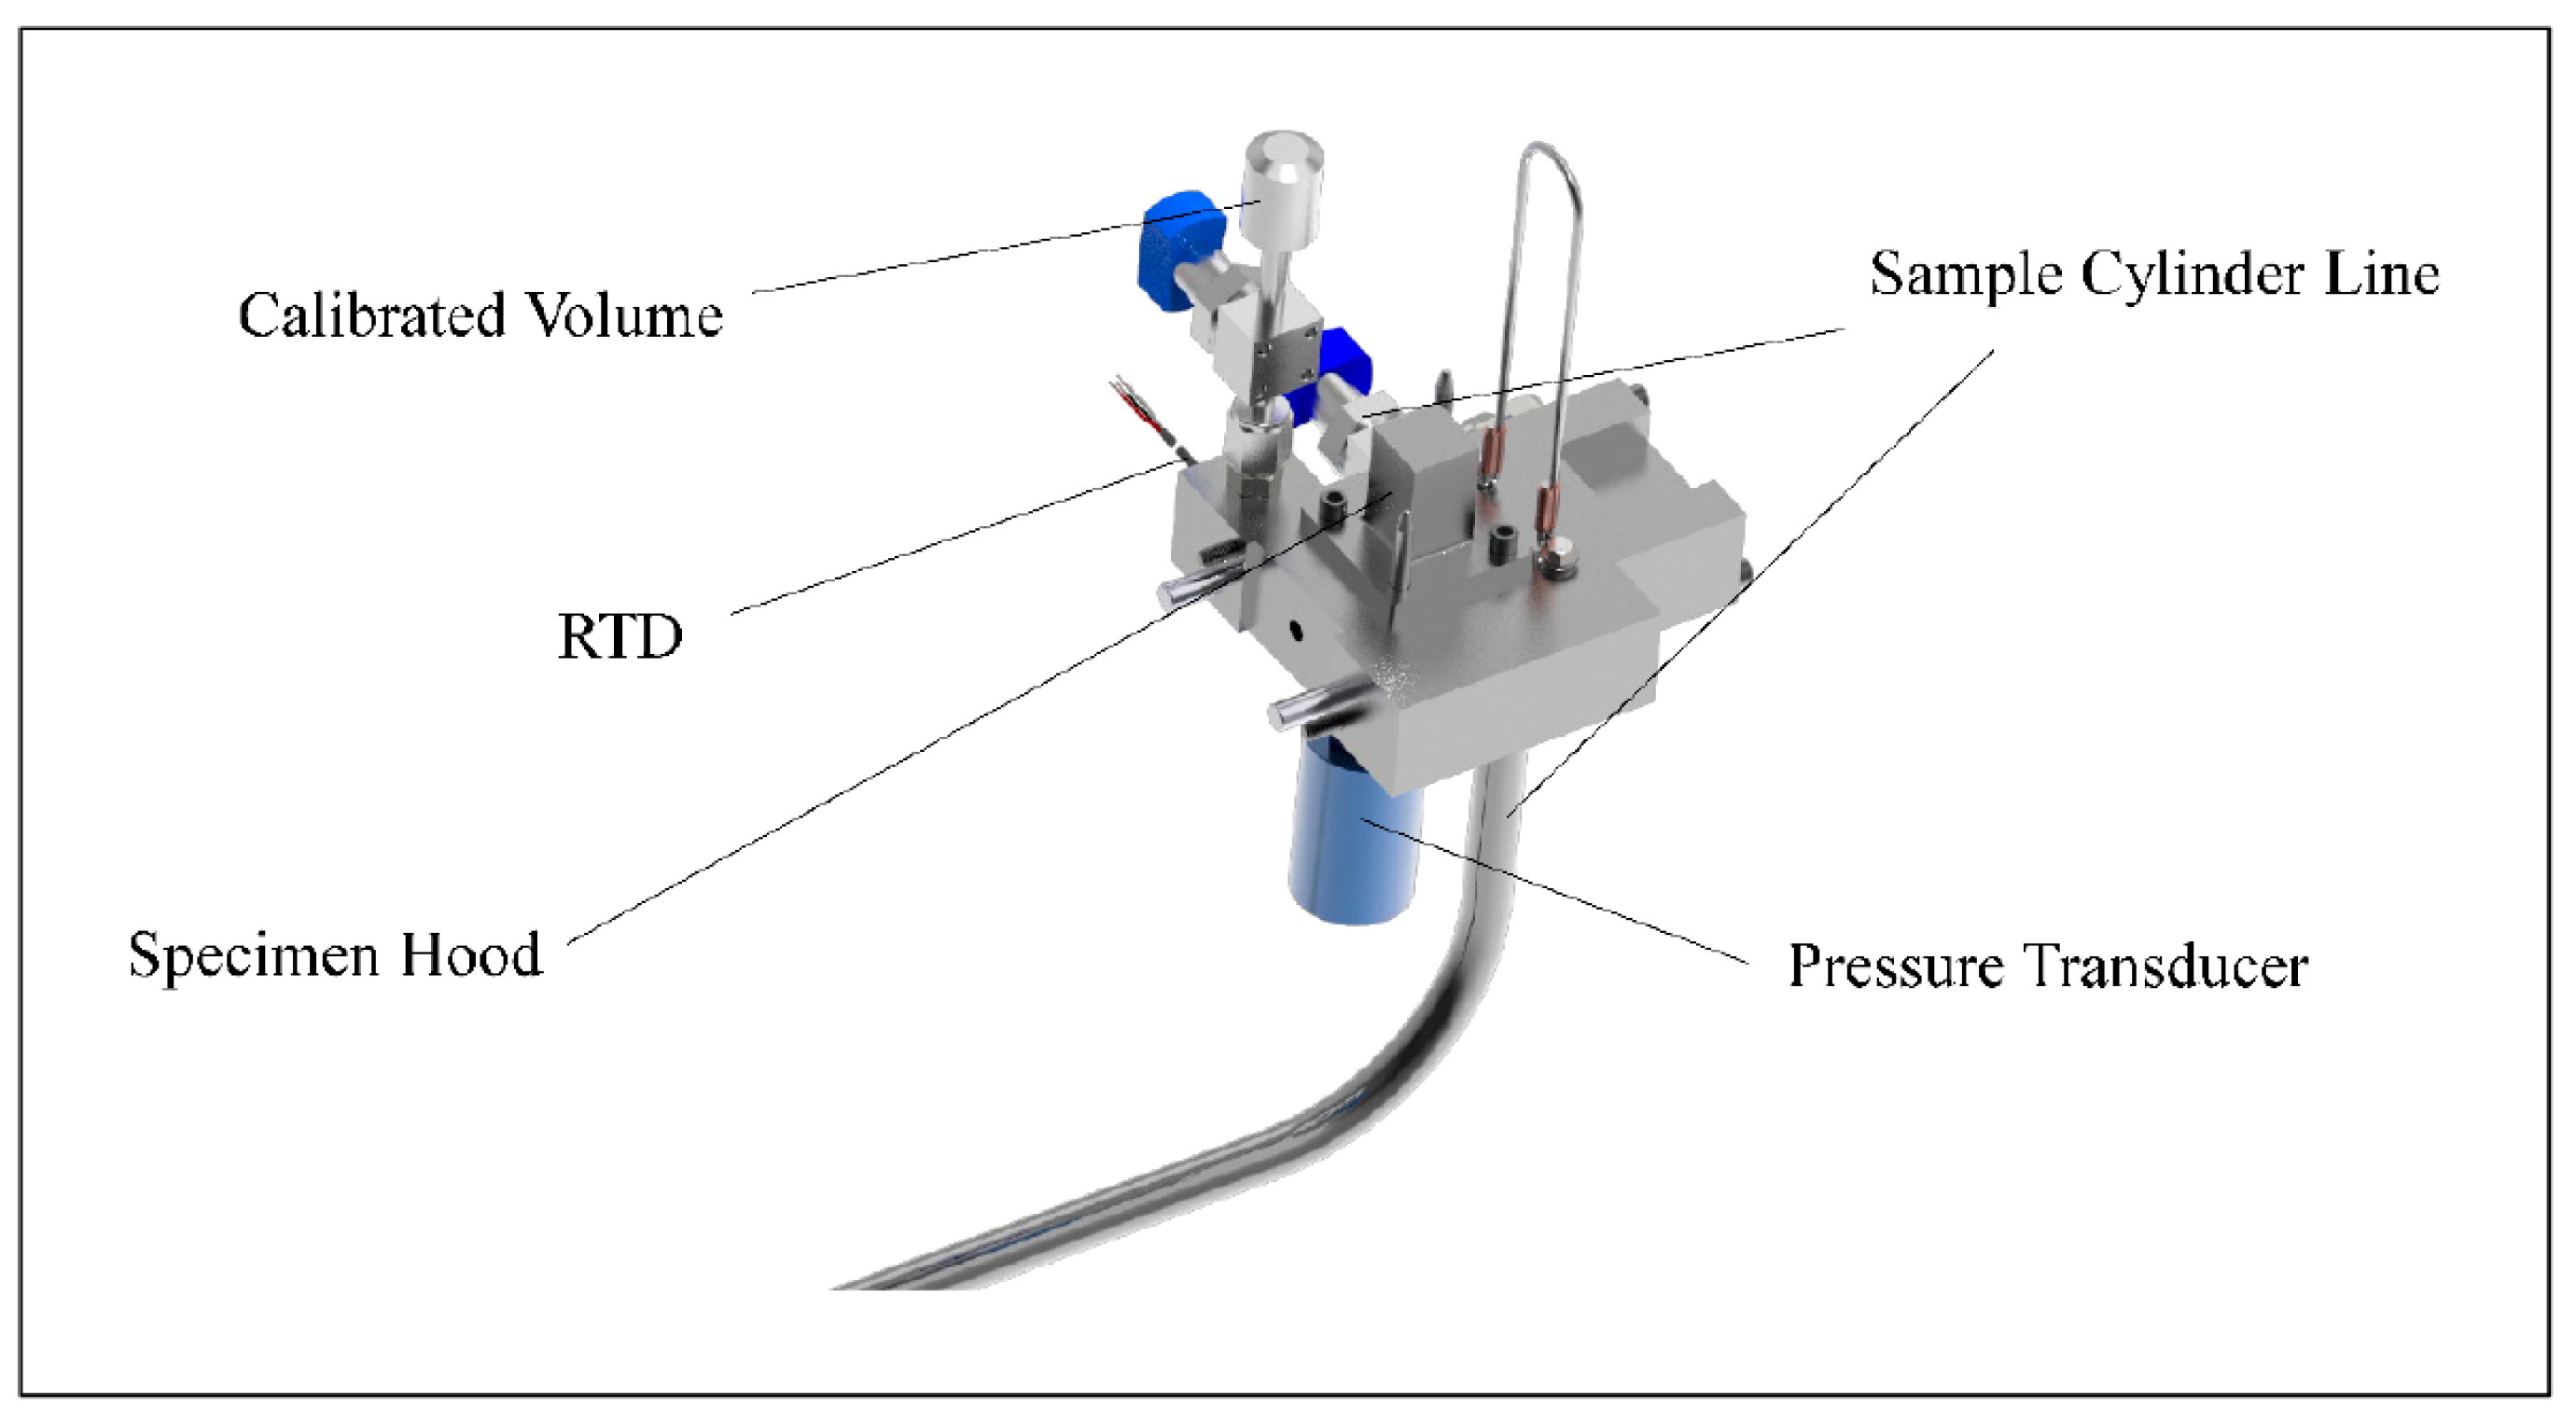
2. Materials and Methods

SATGAS Instrumentation. Initial design of the SATGAS module, as shown in Figure 1, was complete prior to modeling. The design included calibrated temperature and pressure sensors, a vessel of known internal volume, a specimen hood for connection of the rodlet, and a manifold to connect everything. A Pyromation RTD, R5T185L283-005(3/4)-8B03(3/4)-4, with a standard uncertainty of ±0.2 K, was used for temperature measurements. Pressure was measured using a Honeywell Ultra Precision Pressure Transducer, Model Super TJE 0–103 kPa, part number AP112BJ,1A,2U,5B,6B,9A, with a standard uncertainty of ±0.05% full scale (±0.0517 kPa). One of two interchangeable vessels was used as the known volume. The known volume vessels were made from commercially purchased parts and assembled at INL. After assembly, the known volumes were then calibrated by the Primary Standards Labora-tory at Sandia National Laboratory and assigned volumes of 11.85 ± 0.34 and 5.807 ± 0.078 mL, respectively. The manifold will be a combination of custom-manufactured and commercially available parts, assembled at INL. The volume of this manifold was treated as a variable in the model, along with variations in internal volume. Design of the manifold internal volume was modified to fit the calculated internal manifold volume predicted by the model.
Modeling. The proposed SATGAS design has not been manufactured. Thus, a model of the expansions was generated to simulate the experiments that will be performed once the system is manufactured and the rodlets are punctured. The model was generated in Microsoft Excel, and the initial pressure in the known volume was set. Random variations in the initial pressure were included as a source of random error. The variation in the initial pressure was generated using an Excel function producing random numbers bounded by the gas-delivery system capabilities of the GASR, and was determined to be 68.3 ± 0.3 kPa (k = 1) with a normal/Gaussian distribution.
Because all values are directly calculated from the above equations, it does not encompass the random error observed when taking real world measurements. Manifold and system pressures, P1 and P2, are based on the initial pressure, PSTD, and calculated using the combined gas law. V2 remained constant throughout all the modeled data; however, once constructed, some degree of variation in the manifold volume can be observed due to rodlet orientation in the SATGAS specimen hood or defects in the rodlet’s construction. The simulated final pressure changes directly with respect to the rodlet volume being analyzed. Four distinct rodlet volumes—0.07, 0.123, 0.25, and 2.5 mL—were analyzed, in combination with two manifold volumes and two standard volumes, for a total of 16 configurations.
Once calculated, all resulting values were input into a software package, GUM Workbench Pro v 2.4.1.406, and the Guide to the expression of Uncertainty in Measurement (GUM) was applied to calculate the expanded uncertainty of the rodlet volume [4,9]. The expanded uncertainty was derived using the method described above, and models for Equations (2–3) were entered into the program. The software derived a Taylor expansion from the input equations to calculate the expanded uncertainty [10]. The software also produced a budget, in which each factor influencing the uncertainty was weighted by its contribution to the expanded uncertainty [11]. Using the budget, adjustments to modeled experimental parameters can be made to minimize uncertainty source contributions based on which sources have the largest contribution to the expanded uncertainty [12]. For better comprehension of this process, refer to the data, equations, and GUM calculation included in the Supplementary Materials.

3. Results and Discussion

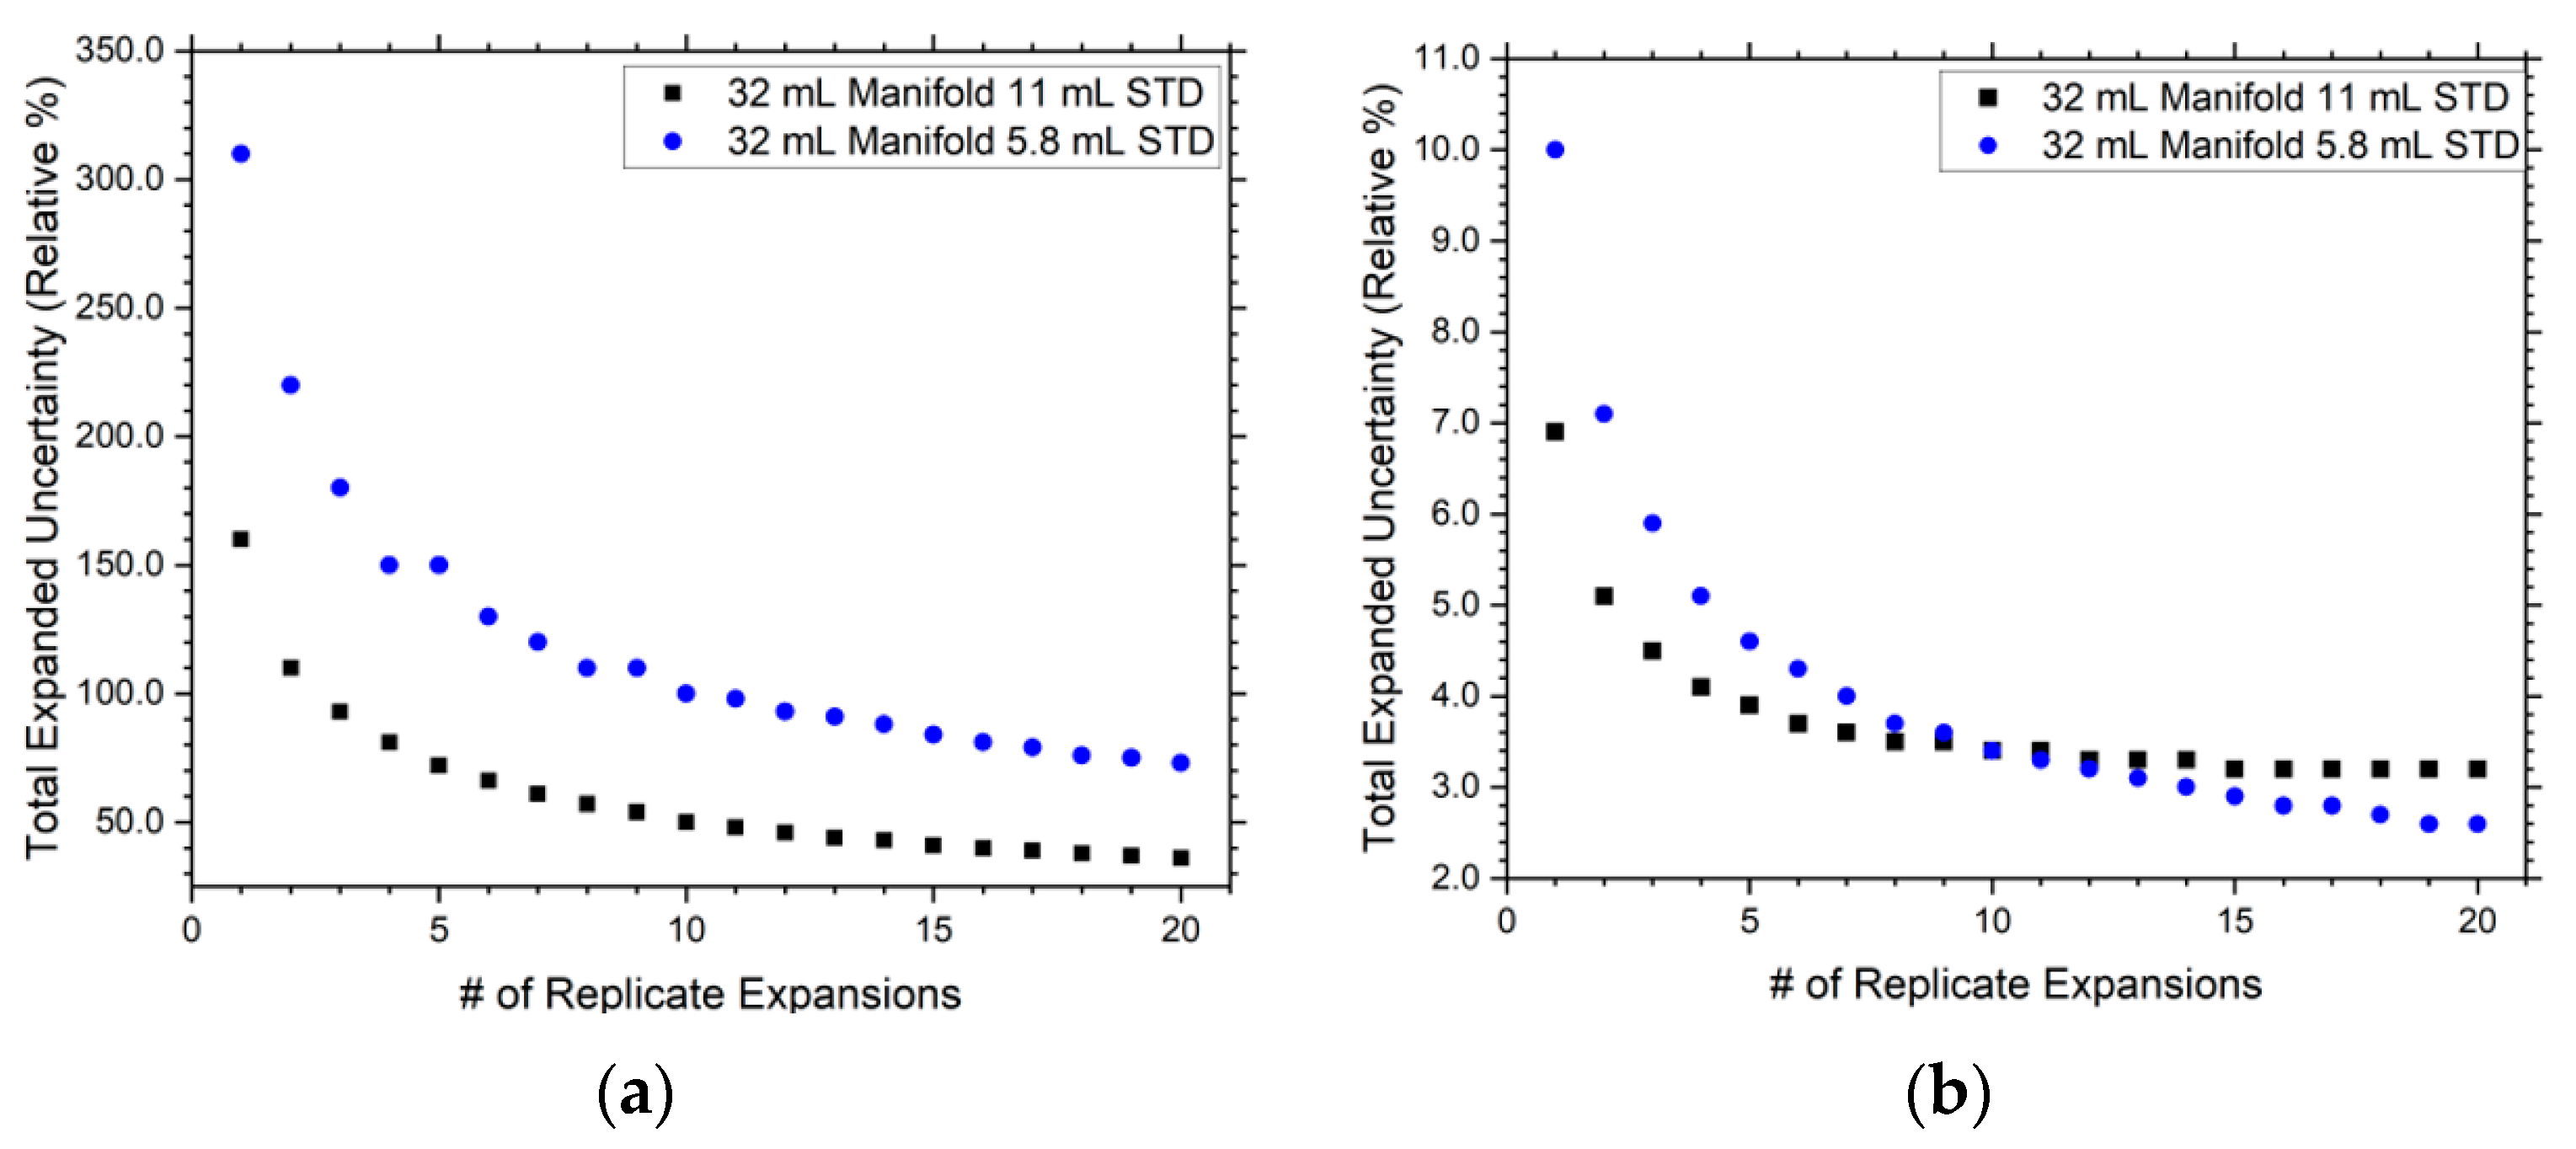
3.1. 32 mL Manifold Design

Four rodlet volumes were calculated, using Equations (2) and (3), for models incorporating the original system design, with a manifold volume of 32 mL. A comparison of the results’ expanded uncertainty using different-sized volume standards can be seen in Table 1.
The expanded uncertainty for the rodlet volume is dependent on many factors that are part of a complex relationship. As the volume of the rodlet decreases, the relative contribution from the standard volume uncertainty to the expanded uncertainty becomes less significant. This is due to a comparative decrease in pressure change as the gas is expanded into a smaller rodlet volume. As the magnitude of the change in pressure approaches and goes below the uncertainty of the pressure transducer, the relative contribution from the pressure measurements to the expanded uncertainty increases. The uncertainty of the pressure measurement being absolute causes its contribution to become increasingly significant as the pressure change decreases.
As the rodlet volume decreases, the relative expanded uncertainty increases. This is due to the direct relationship between the rodlet volume and the pressure change observed during the final expansion. For Rodlet volumes less than 0.123 mL, the pressure change regarding the final expansion is not distinguishable from instrument noise. In comparison, varying the standard volume results in an apparent mixed relationship. Decreasing the standard volume reduces the quantity of gas in the system, directly influencing the absolute pressure change during the expansion process. The decrease in gas quantity results in smaller pressure values that eventually become lower than the uncertainty in the pressure measurement, decreasing the standard volume. Thus, the moles of gas can no longer be used to decrease the expanded uncertainty.
In addition to the previously discussed expanded uncertainty contributions, replicating the experiment can provide more accurate results by minimizing expanded uncertainty due to random error. The experiment was modeled using 20 different starting pressures, as described in Section 2. These experiments were used to determine the rodlet volume. The maximum number of modeled replicate gas expansions, 20, was established based on limitations of personnel and costs for operating the purposed instrumentation. Results for the models were averaged, and its expanded uncertainty calculated. Compared to a single expansion, averaging the results from multiple expansions shows a significant reduction in the expanded uncertainty. The impact of increasing the number of replicates on the expanded uncertainty for each rodlet’s averaged volume is presented graphically, for the bounding pin volumes, in Figure 2. This methodology evaluated eight different configurations to determine the expanded uncertainty based on varying factors. Additional graphs are supplied in the Supplementary Materials.
Illustrates the relationship between the number of replicates used to calculate the average rodlet volume and that volume’s expanded uncertainty. As anticipated, the minimum achievable expanded uncertainty for many of the modeled systems did not require 20 replicates and, in some cases, could be achieved with significantly fewer. The data are best fit using an exponential decay curve, and the derived equation can be used to estimate the number of replicates required to reach the theoretical minimum expanded uncertainty for each modeled system.
Figure 2. The expanded uncertainty in relative percent vs. the number (#) of replicate expansions used to calculate the averaged volume for (a) 0.07 mL and (b) 2.5 mL rodlet volumes. Data from the 11.85 mL volume standard and the 5.807 mL volume standard are graphed together to illustrate the change in expanded uncertainty.
Metrology 03 00014 g002
Using an exponential decay function, as shown in Equation (4), to fit the modeled data for the rodlets shows good correlation between the number of replicate expansions and the average rodlet volume’s expanded uncertainty for the 2.5 mL rodlet models
y = A · exp x t 1
Correlation becomes more divergent as the rodlet volume is decreased. Divergence from the best-fit line can be shown mathematically by calculating the chi-squared value for the best-fit line, as shown in Equation (5), where O is the observed value and E is the expected value [13].
χ 2 = O i E i 2 E i
The calculated chi-squared values for the derived exponential equation vs. the graphed data are reported in Table 2. As described earlier, the divergence is due to the minimization of the standard volume’s contribution to the expanded uncertainty. Additionally, the index values for the standard volume’s contribution to each rodlet’s expanded uncertainty are shown in Table 2. The index value is a representation of the percentage of the expanded uncertainty that each source contributes [12].
While comparing the eight modeled systems’ expanded uncertainties (see in Figure 2), it is apparent that rodlet volumes below 0.25 mL cannot be accurately measured. For a single measurement at this volume, the rodlet volume’s expanded uncertainty was ±56% (k = 2). The modeling of 20 distinct replicate expansions showed that the average rodlet volume’s expanded uncertainty is ±12%. This reduction shows the significance of random error during the analysis of smaller volumes. The source of this random error can be attributed to the pressure measurement. At this volume, the uncertainty in the pressure measurement starts to exceed the pressure change observed upon the expansion of gas into the rodlet.
Due to the calculated volume’s high expanded uncertainty, a change in the experimental design was proposed. The GUM software was used to quickly determine the parameters with the largest contribution to the expanded uncertainty, as shown by their index values. An Excel model was used to determine the maximum manifold volume at which a gas expansion into the 0.07 mL rodlet-plenum volume would be distinguishable from the noise of the instrument. This was found to be 19 mL. Based on this, the manifold was redesigned to be 17 mL, and new models were generated for the eight systems using the proposed manifold volume.

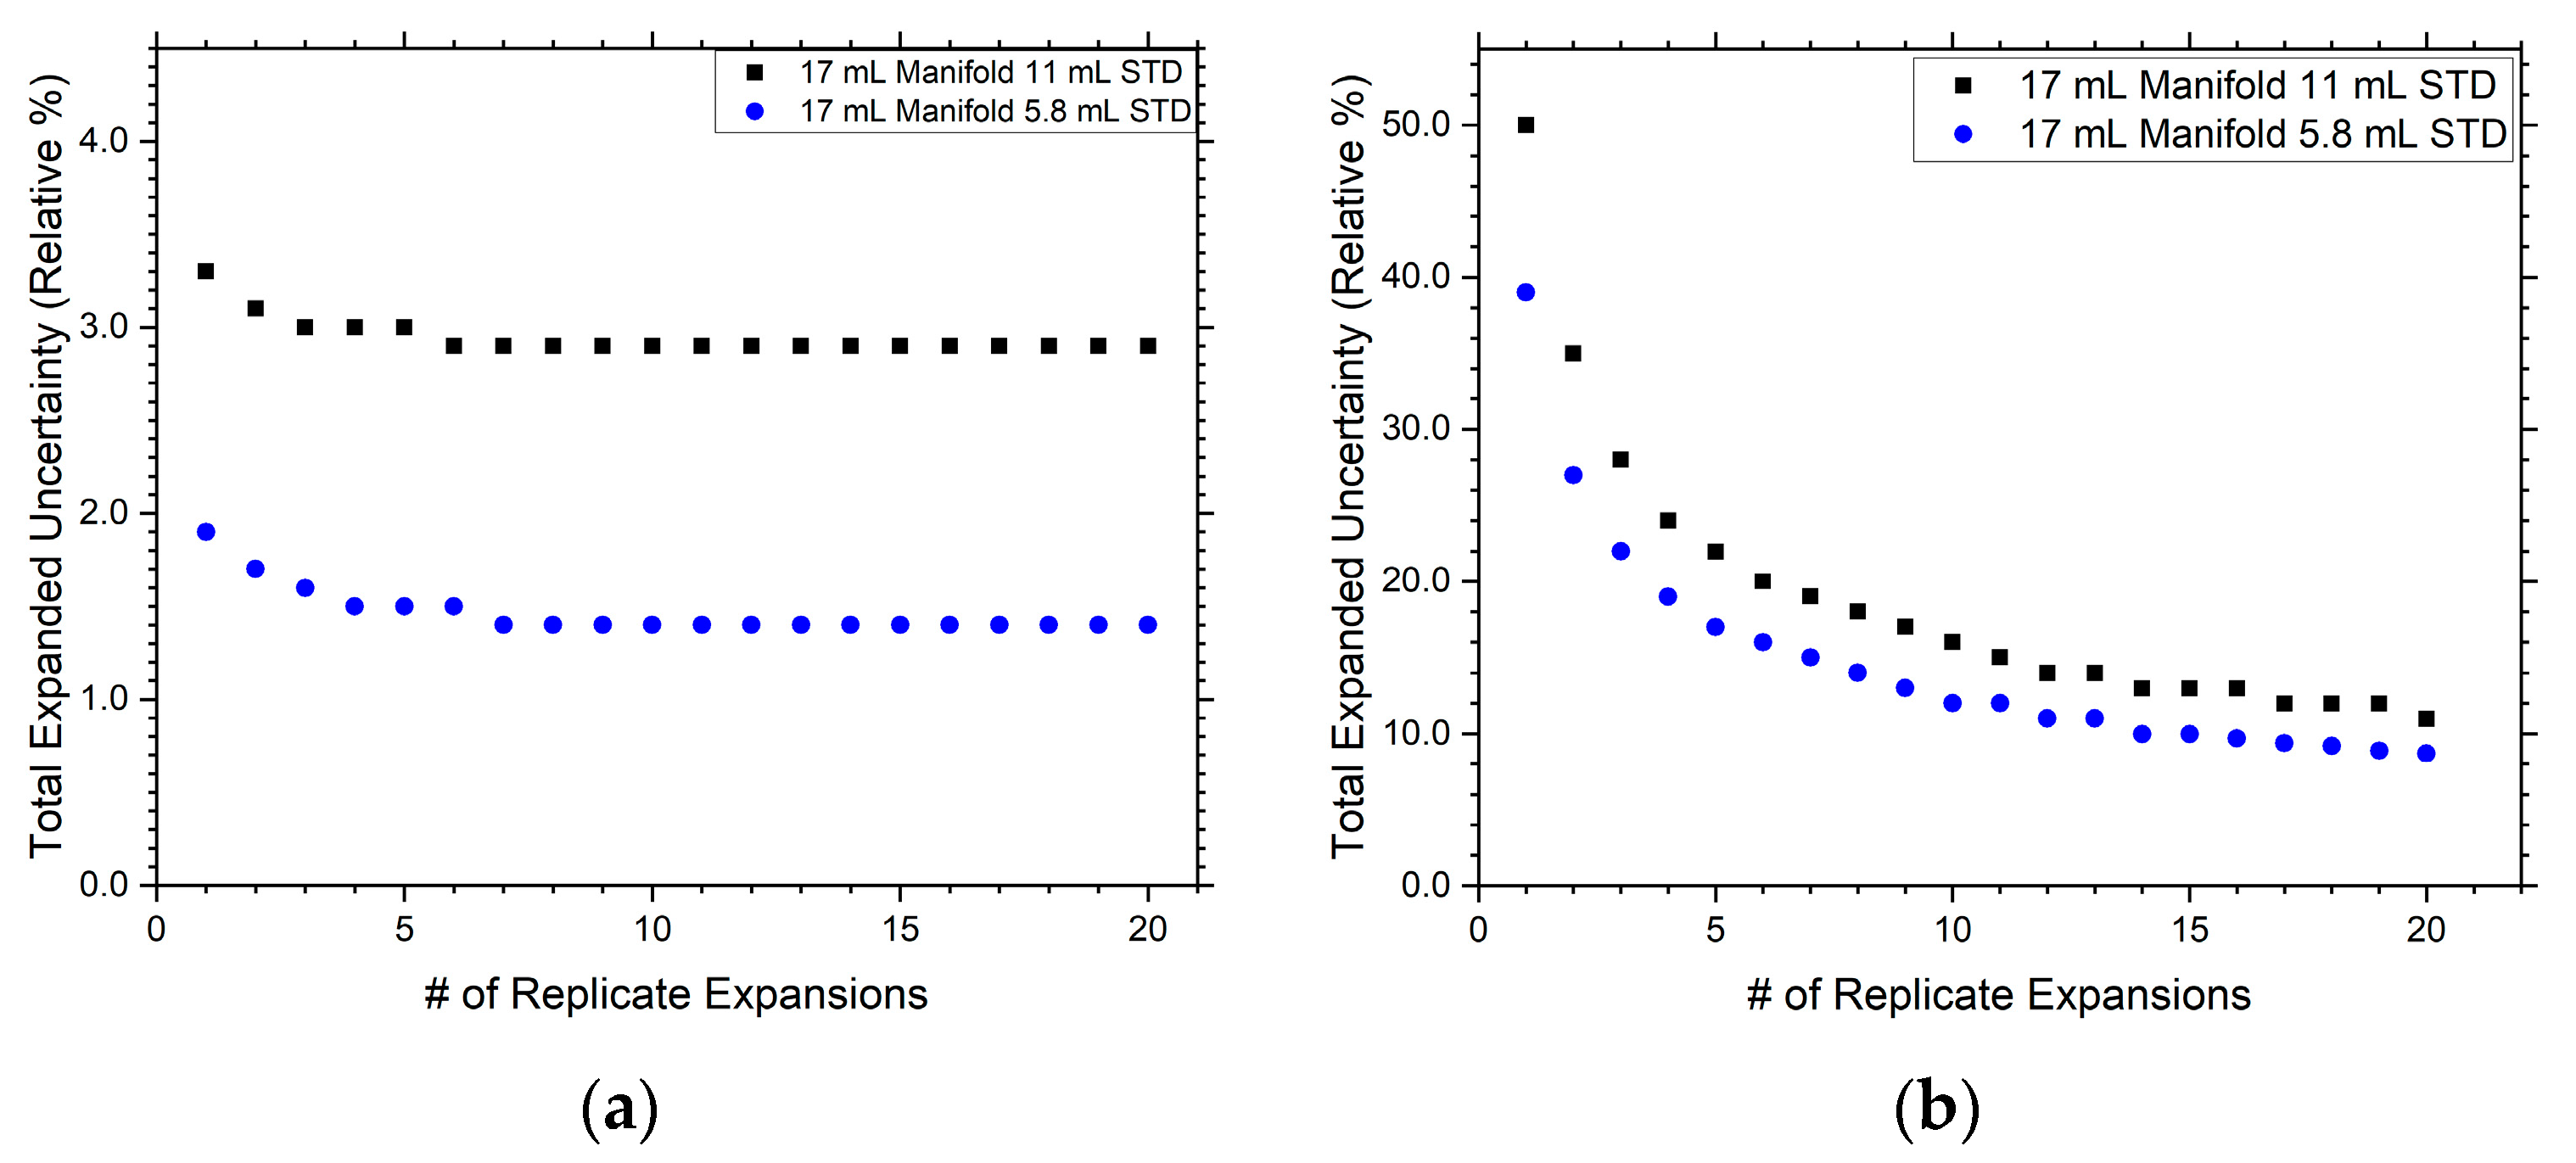
3.2. 17 mL Manifold Design

The modified manifold, 17 mL, was designed to be smaller than the calculated maximum manifold volume, 19 mL, to provide a buffer in the manufacturing and assembly of equipment. Using the new manifold volume, the expansions were modeled for all rodlet and volume-standard combinations and put into the GUM software for uncertainty evaluation. The same process described in Section 3.1 was used to examine the effect of replicate gas expansions for volume determinations using the redesigned manifold. Results from the process are summarized in Table 3.
Repetition of the process for the 2.5 mL rodlet volume reduces the expanded uncertainty from 3.3% for each individual expansion down to a minimum value of 2.9% for the average of six replicates. This trend in the minimization of random error was unaffected by the volume standard used in the model, as is illustrated in Figure 3. However, in the case of the 0.07 mL rodlet, the expanded uncertainty did not plateau, even at 20 replicate expansions.

4. Conclusions

It was determined that manifold volume greater than 19 mL would not allow for the determination of the 0.07 mL rodlet volume. This is due to the magnitude of the pressure change being less than the uncertainty of the transducer as the gas is expanded into the rodlet from the manifold. This can be overcome by decreasing the manifold volume so that the pressure change observed during the gas expansion becomes larger than the uncertainty of the transducer. Alternatively, a pressure transducer with a lower uncertainty could achieve similar results.
The expanded uncertainty for the rodlet volume was found to be dependent on three main factors for the modeled systems: (1) the manifold volume, (2) the volume standard used and its associated uncertainty, and (3) the random error resulting from pressure measurements. This is best represented by the data shown in Figure 2 and Figure 3, which illustrate the effect these factors have on the expanded uncertainty of the averaged rodlet volume. The impact on the expanded uncertainty from each of these factors can be reduced. Minimization of the manifold volume would produce an ideal experiment. Engineering limitations necessitate the use of a manifold and set a lower bound for its volume. This bound is due, in large part, to the internal volume of the pressure transducer but is also affected by connections for the volume standard, temperature probe, and rodlet. The standard volumes should also be matched to the rodlet volume. The same considerations used in the manifold design apply to the standard. In addition to the standard volume, its uncertainty should also be minimized, as, in some cases it is the major contributor to the averaged rodlet volume expanded uncertainty. The impact of random error observed in the pressure measurements can be reduced through replication and result averaging. In the case of the 2.5 mL rodlet, only six replicate expansions were required to reach a minimized expanded uncertainty when the system was optimized. Modeling also showed that more than 20 replicates would be required to minimize the expanded uncertainty for rodlet volumes less than 0.25 mL. No attempt was made to determine a minimum expanded uncertainty value in these cases because physically carrying out additional expansions would be prohibitive in the laboratory environment.

Supplementary Materials

The Following supporting information can be downloaded at: https://www.mdpi.com/article/10.3390/metrology3030014/s1, File S1: 0.07 cc Rodlet Volume for 16 cc Manifold, File S2: 0.07 cc Rodlet Volume for 16 cc Manifold_5.8 mL_STD_Replicate_20, File S3: 0.07 cc Rodlet Volume_35 cc Manifold, File S4: 0.07 cc Rodlet Volume_35 cc Manidold_5cc_STD, File S5: 0.25 cc Rodlet Volume for 16 cc Manifold, File S6: 0.25 cc Rodlet Volume_16cc Manidold_5.8 mL_STD_Replicate_20, File S7: 0.25 cc Rodlet Volume_35 cc Manifold, File S8: 0.25 cc Rodlet Volume_35 cc Manifold_5cc_STD, File S9: 0.123 cc rodlet volume, File S10: 0.123 cc Rodlet Volume_16 cc Manifold, File S11: 0.123 cc Rodlet Volume_16 mL Manifold_5.8mL_STD_Replicate_20, File S12: 0.123 cc Rodlet Volume 35 cc Manifold_5cc_STD, File S13: 2.5 cc Rodlet Volume for 16.595 cc Manifold, File S14: 2.5 cc Rodlet Volume for 16.595 cc Manifold_5mL_STD, File S15: 2.5 cc Rodlet Volume_35 cc Manifold, File S16; 2.5 cc Rodlet Volume_35cc_Manifold_cc_STD, File S17 Uncertainty Analysis.

Author Contributions

Conceptualization, I.M.H. and J.A.C.; methodology, I.M.H.; validation, I.M.H. and J.A.C.; formal analysis, I.M.H. and J.A.C.; investigation, I.M.H. and J.A.C.; resources, T.L.J.; data curation, I.M.H. and J.A.C.; writing—original draft preparation, I.M.H.; writing—review and editing, I.M.H. and J.A.C.; funding acquisition, T.L.J. All authors have read and agreed to the published version of the manuscript.

Funding

This research was funded by DOE under the National Spent Nuclear Fuel Program.

Data Availability Statement

All data has been made available in the supplemental information.

Conflicts of Interest

The authors declare no conflict of interest.

References

  1. Carmack, W.; Chichester, H.; Porter, D.; Wootan, D. Metallography and fuel cladding chemical interaction in fast flux test facility irradiated metallic U-10Zr MFF-3 and MFF-5 fuel pins. J. Nucl. Mater. 2016, 473, 167–177. [Google Scholar] [CrossRef]
  2. Porter, D.; Tsai, H. Full-length U–xPu–10Zr (x = 0, 8, 19wt.) FFTF. J. Nucl. Mater. 2012, 427, 46–57. [Google Scholar] [CrossRef]
  3. Wachs, D.M.; Capriotti, L.; Porter, D. Behavior of metallic fast reactor fuels during an overpower transient. J. Nucl. Mater. 2021, 557, 153304. [Google Scholar] [CrossRef]
  4. Guide to the Expression of Uncertainty in Measurement; Technical Report; BIPM: Sèvres, France; IEC: Geneva, Switzerland; IFCC: Portland, Oregon; ISO: Geneva, Switzerland; IUPAC: Zürich, Switzerland; IUPAP: Italy, France; OML: Oklahoma City, OK, USA, 1995.
  5. Laugier, A.; Garai, J. Derivation of the Ideal Gas Law. J. Chem. Educ. 2007, 84, 1832. [Google Scholar] [CrossRef]
  6. Winkler, A. A new accurate calibration method for thermal desorption spectra. J. Vac. Sci. Technol. A 1984, 2, 1393–1394. [Google Scholar] [CrossRef]
  7. Dobrozemsky, R. Calibration of vacuum systems by gas quantities. Vacuum 1990, 41, 2109–2111. [Google Scholar] [CrossRef]
  8. Wuthrich, C.; Coulibaly, M. The determination of volume ratios by gas depletion through multiple expansions. Vacuum 2006, 81, 453–458. [Google Scholar] [CrossRef]
  9. Arri, E.; Cabiati, F.; D’Emilio, S.; Gonella, L. On the application of the guide to the expression of uncertainty in measurement to measuring instruments. Measurement 1995, 16, 51–57. [Google Scholar] [CrossRef]
  10. Kacker, R.; Sommer, K.D.; Kessel, R. Evolution of modern approaches to express uncertainty in measurement. Metrologia 2007, 44, 513–529. [Google Scholar] [CrossRef]
  11. Kessel, R.; Berglund, M.; Wellum, R. Application of consistency checking to evaluation of uncertainty in multiple replicate measurements. Accredit. Qual. Assur. 2008, 13, 293–298. [Google Scholar] [CrossRef]
  12. Kessel, R.; Kacker, R.; Berglund, M. Coefficient of contribution to the combined standard uncertainty. Metrologia 2006, 43, S189–S195. [Google Scholar] [CrossRef]
  13. Pearson, K. On the criterion that a given system of deviations from the probable in the case of a correlated system of variables is such that it can be reasonably supposed to have arisen from random sampling. Lond. Edinb. Dublin Philos. Mag. J. Sci. 1900, 50, 157–175. [Google Scholar] [CrossRef]
Figure 1. Concept drawing of the SATGAS module.
Metrology 03 00014 g001
Figure 3. (a) The expanded uncertainty in relative percent vs. the number (#) of replicate expansions used to calculate the expanded uncertainty for a 2.5 mL rodlet-volume determination. (b) The expanded uncertainty in relative percent vs. the number of replicate expansions used to calculate the expanded uncertainty for a 0.07 mL rodlet volume determination. An exponential function was fit to each dataset to determine the number of replicates required to minimize the expanded uncertainty of the average rodlet volume.
Metrology 03 00014 g003
Table 1. Relative expanded uncertainty of the average rodlet volume for 20 replicate gas expansions, modeled with the 11.85 mL and 5.807 mL volume standard.
Rodlet Volume (mL)11.85 mL
Volume Standard
5.81 mL
Volume Standard
2.503.2%2.6%
0.2512%21%
0.1221%42%
0.0736%73%
Table 2. Percent contribution to the total expanded uncertainty from the volume standard vs. the correlation of the fit to the data relating to the 32 mL manifold modeled data.
Rodlet Volume (mL)11.85 mL Volume Standard5.81 mL Volume Standard
Indexχ2Indexχ2
2.5082.9%1.5 × 10−626.9%7.2 × 10⁻⁶
0.2505.3%7.1 × 10−40.4%6.6 × 10⁻⁴
0.12311.9%4.8 × 10−40.1%9.1 × 10⁻³
0.0700.6%2.3 × 10−30.0%9.1 × 10⁻³
Table 3. Relative expanded uncertainty (k = 2) for rodlet volumes determined using the 17 mL manifold.
Rodlet Volume
(mL)
Volume STD
5.81 mL
Volume STD
11.85 mL
2.501.4%2.9%
0.2502.8%4.2%
0.1235.1%6.9%
0.0708.7%11%
Disclaimer/Publisher’s Note: The statements, opinions and data contained in all publications are solely those of the individual author(s) and contributor(s) and not of MDPI and/or the editor(s). MDPI and/or the editor(s) disclaim responsibility for any injury to people or property resulting from any ideas, methods, instructions or products referred to in the content.

