1. Introduction
We examine the nature of the experimental investigations in this paper. Therefore, we should start with some definitions. Every experiment begins with conceptualization. The model of the experiment should be prepared. After this stage, we implement this model in the experimental set-up and in the relations for obtaining physical quantities from the primarily measured data. The important step is an evaluation of uncertainties of physical quantities applying the error propagation law to the uncertainties of primary measured quantities.
Each experiment can contain a Systematic Distortion Factor (SDF). The SDF [
1] changes experimental results and should be treated as a real physical effect. Therefore, it is very important to analyze and to compare the results of all experiments. If we can understand the nature of SDF, one can calculate the corrections, and corrected data can be used in the evaluation. If the data set contains substantial SDF leading to extremely outlaying data and they cannot be corrected, these data should be removed from the evaluation procedure. In some cases, the SDF can be estimated from the comparison of experimental results with the results of a Monte Carlo (MC) simulation of the experiment. MC simulation allows us to calculate or justify the introduced corrections.
However, the best approach for SDF identification is the comparison of experimental results obtained in different measurements. Some examples of the SDF existence in Prompt Fission Neutron Spectrum (PFNS) measurements, measurements of fission cross sections used as standards and in Maxwellian Average Cross Section (MACS) measurements for astrophysical applications are demonstrated in this paper.
The present approach to the nuclear data evaluation for neutron cross section standards, which a priori can contain the SDF, are the following [
2]:
- -
The use of model-independent fits and fits with highly credible physical models (e.g., R-matrix model),
- -
Combined Generalized Least Square (GLSQ) evaluation of many multivariate experimental data sets for different reactions obtained by different methods of measurements, with different energy resolution and at different energies,
- -
The use of experimental and evaluated covariance matrices with one standard deviation for uncertainty presentation,
- -
The use of systematic uncertainties for fully or partially correlated components of total uncertainty according to the model of the experiment for measured observables (sample mass, detector efficiency, room return correction, etc.),
- -
The determination of outlaying data and work with their uncertainties.
To obtain realistically evaluated uncertainties consistent with a spread of experimental data relative to the evaluated values, the component of the Unrecognized Source of Uncertainty (USU) could be added to the covariance matrix of evaluated data. We examine the nature of the experimental investigations in this paper also. The following notations are used in this text: E0 is the neutron incident energy, and E is the energy of outgoing neutrons.
2. SDF in the 235U(n,f) PFNS Measurements
2.1. Time Resolution and Bin Correction
The PFNS is usually measured with Time of Flight (TOF) in Direct Beam (DB) experiments or in Pulsed Beam (PB) experiments. The DB means that these experiments were realized with a direct neutron beam, and a “stop” signal was produced from fission fragments. The PB experiments used a pulsed neutron beam for TOF.
The primary experimental data (counts registered by neutron detector) are collected at the time interval between the “start” event of a neutron detector and the “stop” event of a Fission Fragment (FF) detector. The PFNS is obtained after the transformation of a number of events from the time scale to the energy scale.
Several parameters and the accuracy of their determination are important for this type of experiment. We should examine additional measurements of the flight path, the time channel width, the neutron detector efficiency, possible shift of the timing position as a function of the neutron energy, the efficiency of the FF detector. In the case of the DB or the spontaneous fission measurements, the measured spectra should be corrected for the random coincidence of FF and neutron registration events.
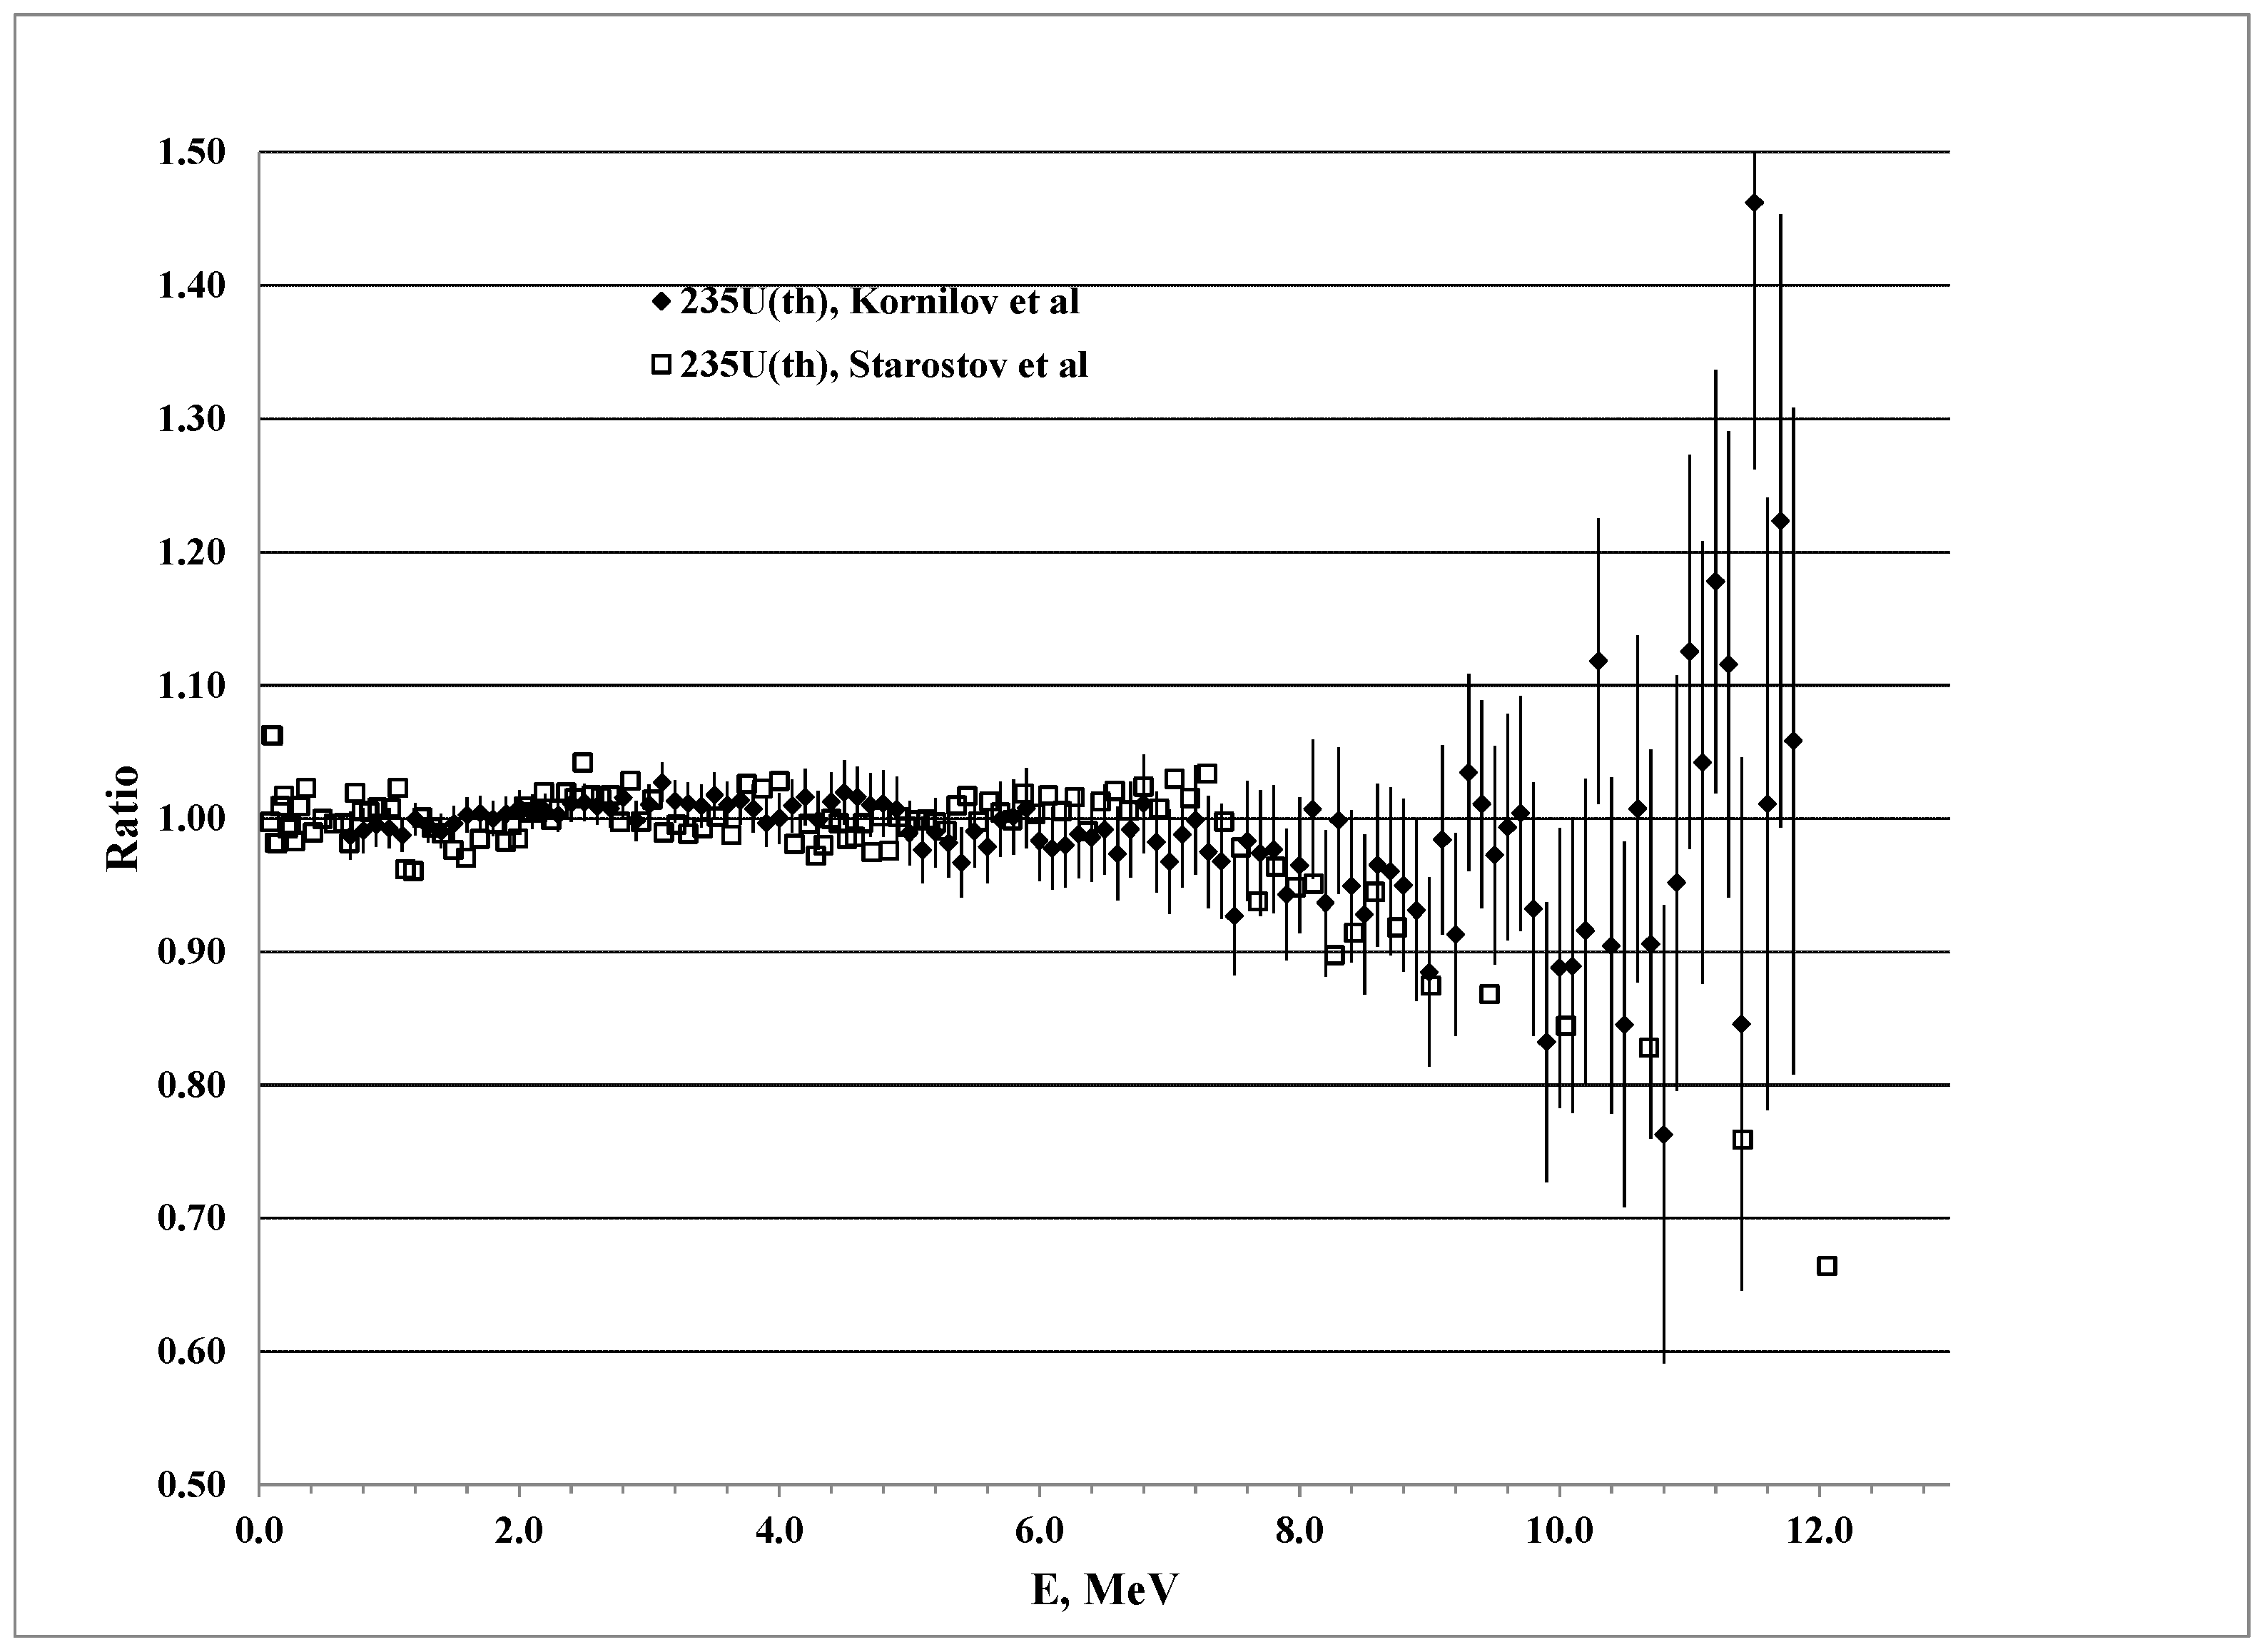
We compare two experiments for PFNS measurements at
235U fission by thermal neutrons performed about 25 years apart. The most important parameters of the old DB experiment (1983) [
3,
4] and the new experiment (2008) [
5,
6] are presented in
Table 1. The
252Cf(sf) PFNS was used as the standard for the determination of neutron detector efficiency in both cases.
The better time resolution for
235U in the experiment [
5,
6] is explained by a larger distance between the cathode and anode in the uranium section of the chamber (fission fragment detector) and, as a result, a higher amplitude of the FF pulse.
The uncertainties for channel width and flight path are similar, about 0.1%. In the 1983 experiment, the time resolution was better by a factor of about 2. Correction at finite time resolution and channel width (bin) was achieved using the Maxwellian shape of the spectrum and parameters from
Table 1 (1983 data). The influence of these corrections at the PFNS was simulated with Monte Carlo calculations.
The PFNS for 252Cf(SCf(E)) and 235U(SU(E)) were measured together in the same experiment. The influence of these corrections at the measured ratio of PFNS R(E) = SCf(E)/SU(E) is very small, and we can conclude that we do not have any SDF connected with this part of data reduction if we measure relative to the 252Cf standard.
The analyses in [
7] confirm this conclusion. Average energies of
235U PFNS estimated for these two experiments are very close <E> = 1.976 ± 0.002 MeV [
3,
4], <E> = 1.982 ± 0.004 MeV [
5,
6]. The comparison of spectra shown in
Figure 1 is given as ratios to the spectrum predicted by the Scale Method [
7]. The small difference of 0.006 MeV may be related to the SDF in the neutron angular-energy distribution relative to FF, which will be discussed in the following sections.
2.2. Neutron Scattering in Fission Chamber
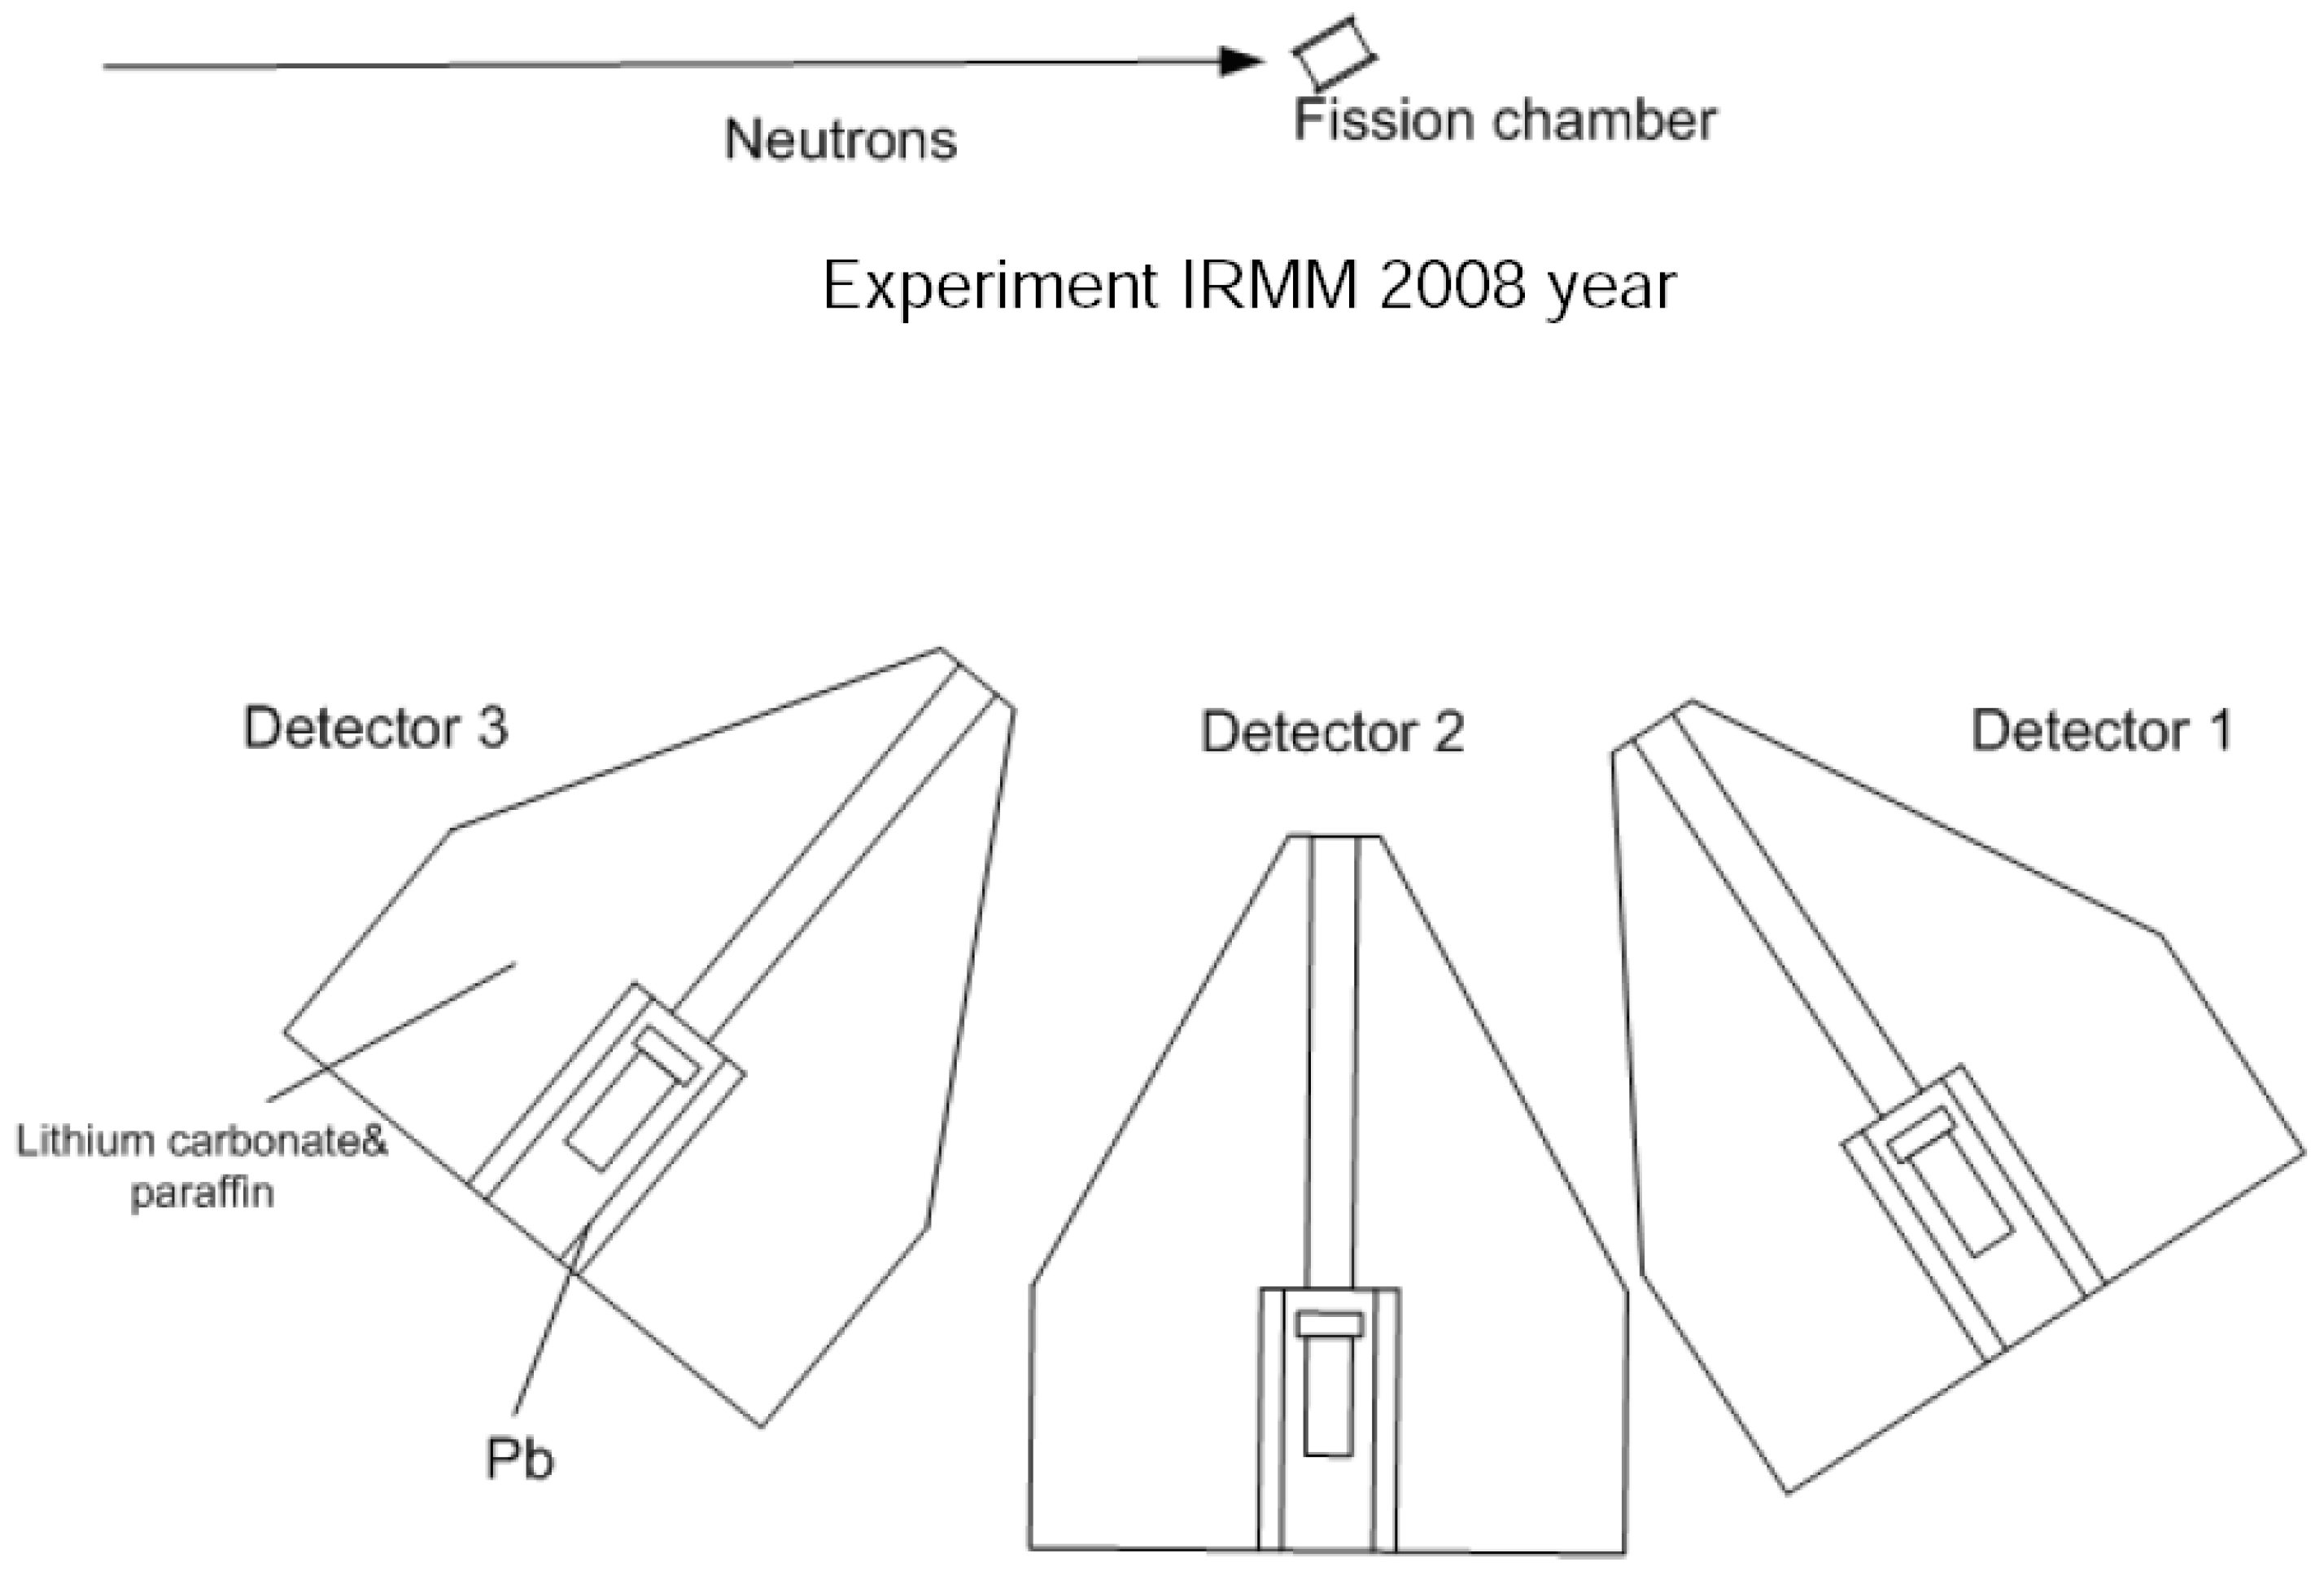
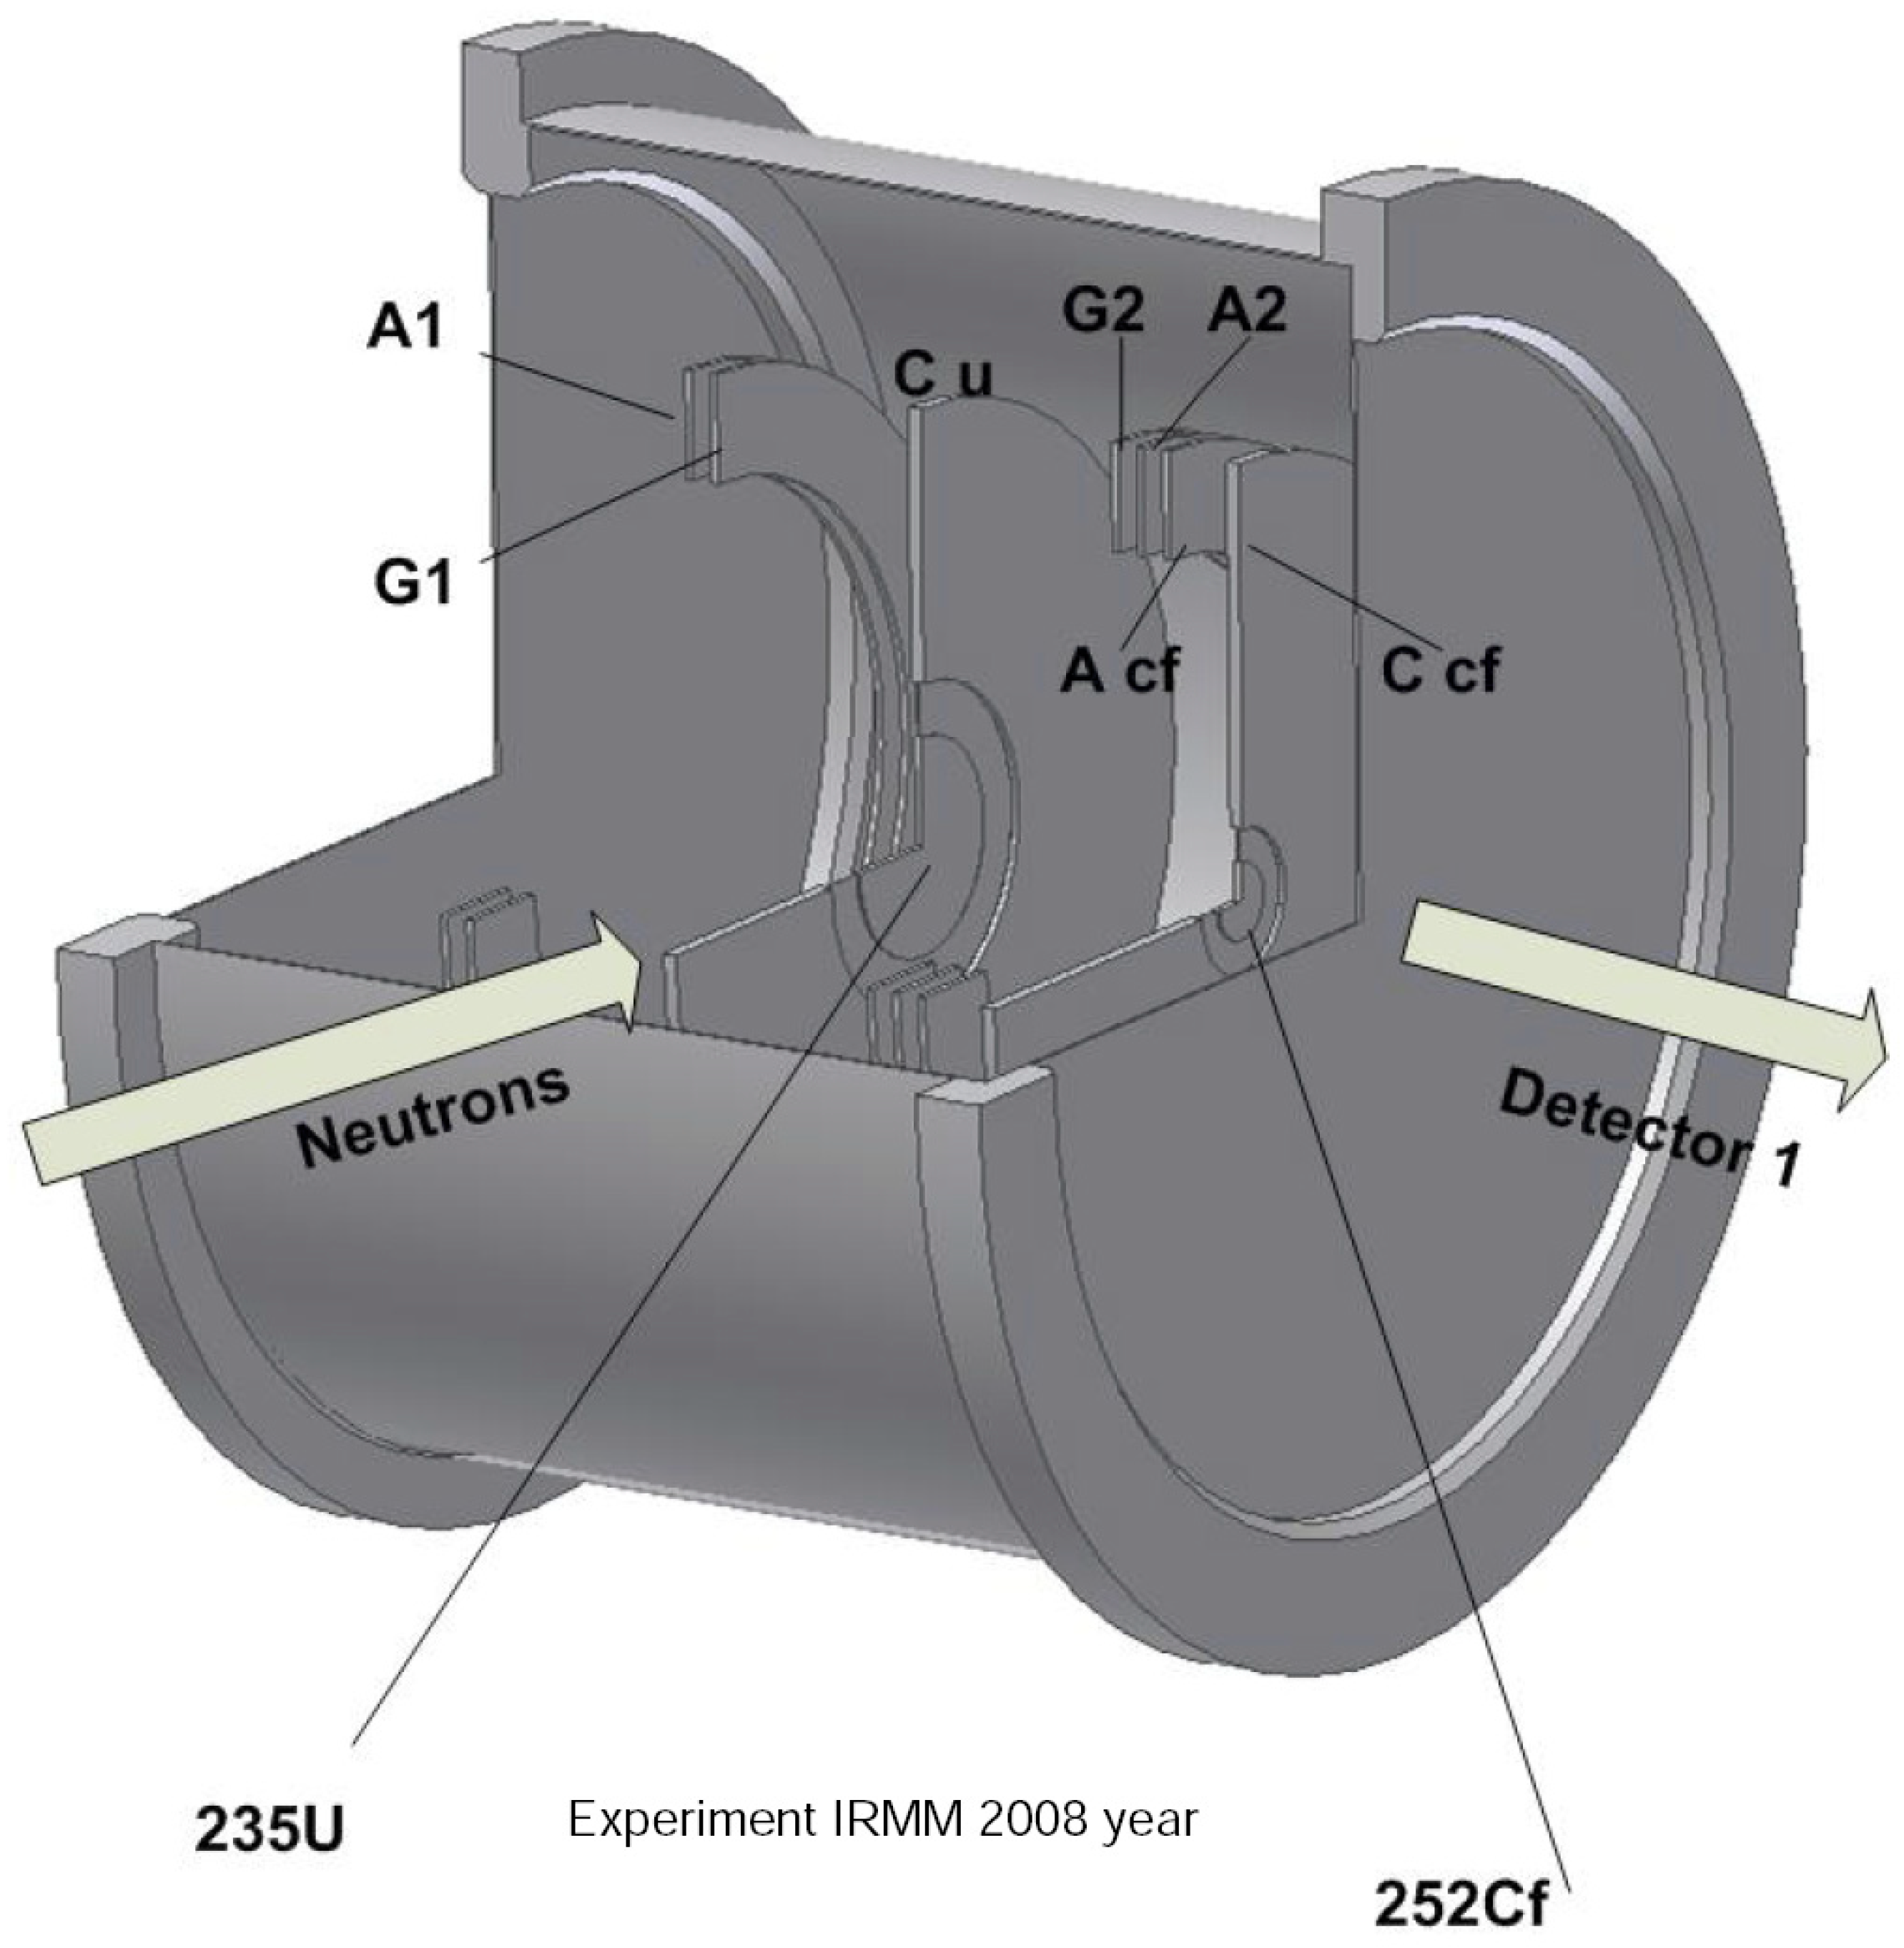
Three neutron detectors were applied in the experiment [
5] (
Figure 2). The ionization chamber used for FF counting is shown in
Figure 3. Both fissile materials
252Cf and
235U were placed in the same chamber.
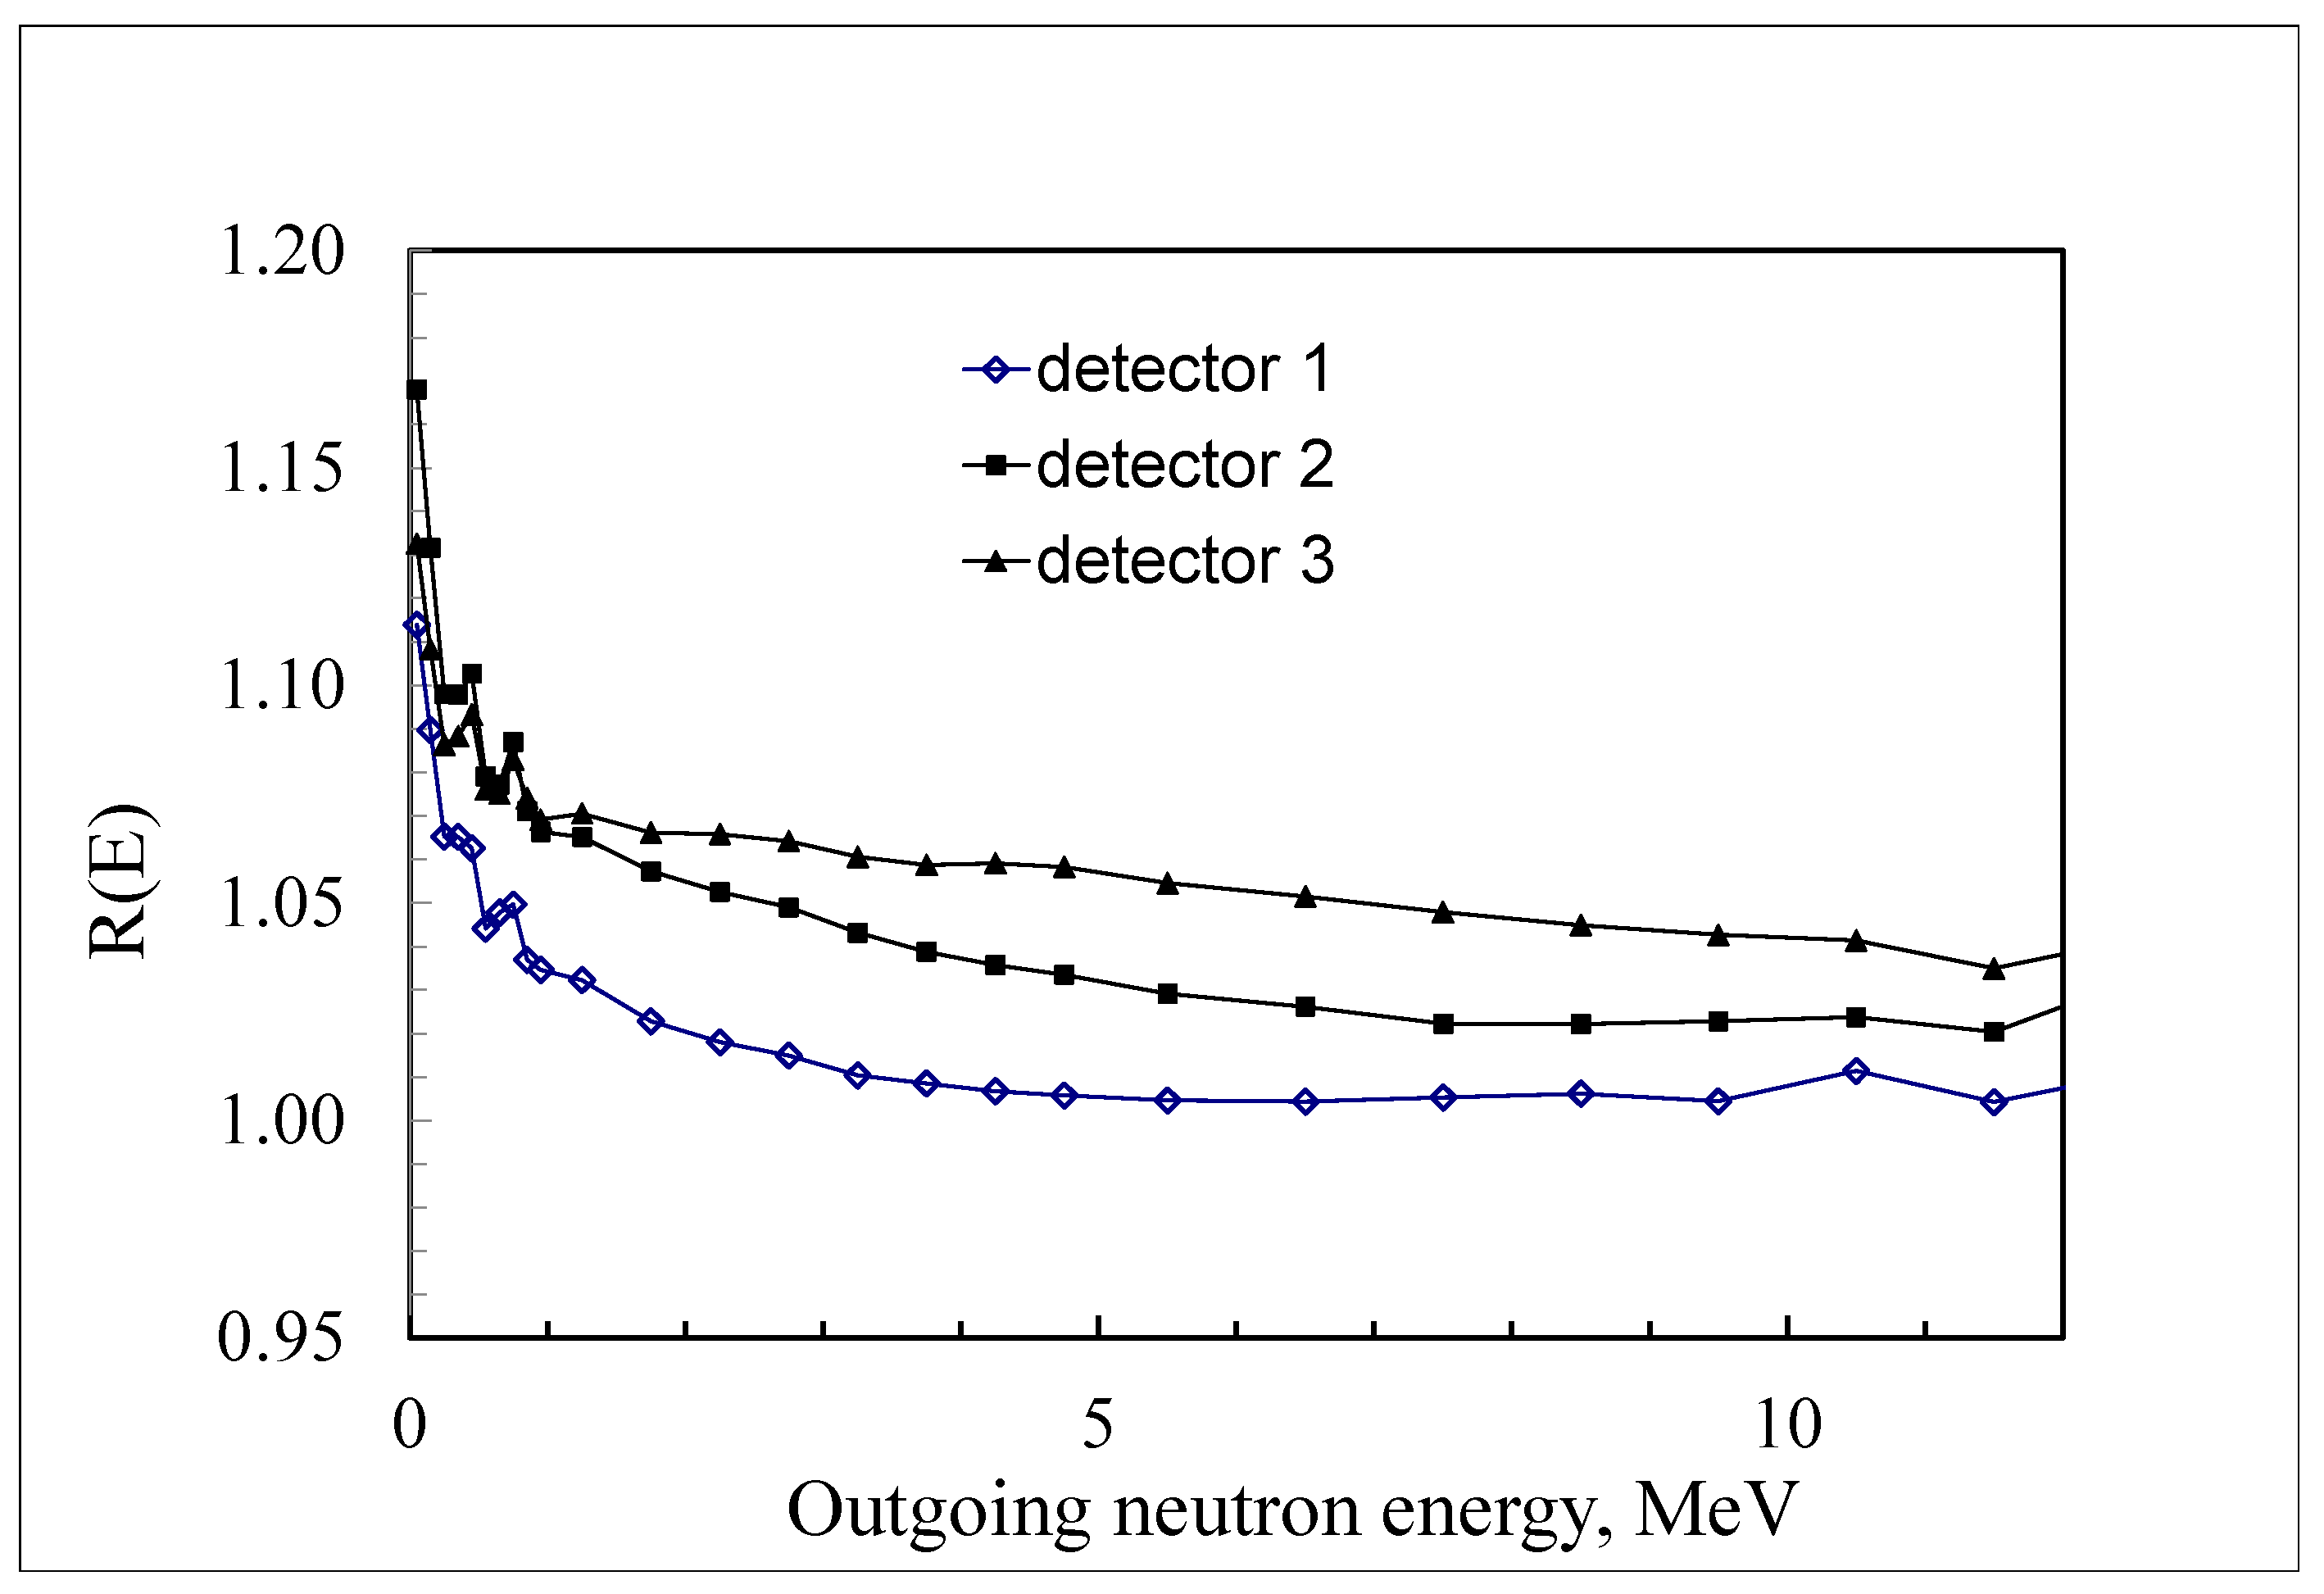
The MCNP code was used for the simulation of neutron scattering in the environment. Preliminary data analysis of the experimental results had shown that the experimental PFNS has very strong angular-energy dependence. At the same time, the MCNP simulation calculates an isotropic angular distribution. More careful analysis of the model used in the calculations had shown that the simplification was achieved in the geometry; namely, 235U and 252Cf samples were placed in the same position in the center of the fission chamber.
After the correction of the MCNP input data, the angular effect appeared in the MCNP results (
Figure 4) and disappeared in the corrected PFNS measured by detectors placed under different angles. The experimental spectra for different angles are in good agreement (inside experimental uncertainties (
Figure 5)). This case demonstrates that the use of a simplified model of the experimental set-up (construction) may produce SDF. However, the accurate model of the experiment may remove this SDF.
2.3. The Energy-Angular Distribution of Neutrons Relative to FF Flight Direction
Fission neutrons have a very strong energy-angular correlation in the Laboratory System (LS) of coordinate relative to the FF flight direction. This is a well-known experimental fact, which has a simple theoretical justification: if most neutrons are emitted after full acceleration of the FF by the Coulomb field, they should have high translational velocity of FF in the LS. However, evaluated data libraries and all practical applications are based on the trivial assumption, “during the fission, neutrons with the same spectrum as the angular integrated spectrum are emitted”. This is an incorrect simplification, which may stimulate strong SDF during the construction of the experimental set-up. This problem was discussed in several papers [
8,
9,
10]. We would like to remind the reader of some results from [
8].
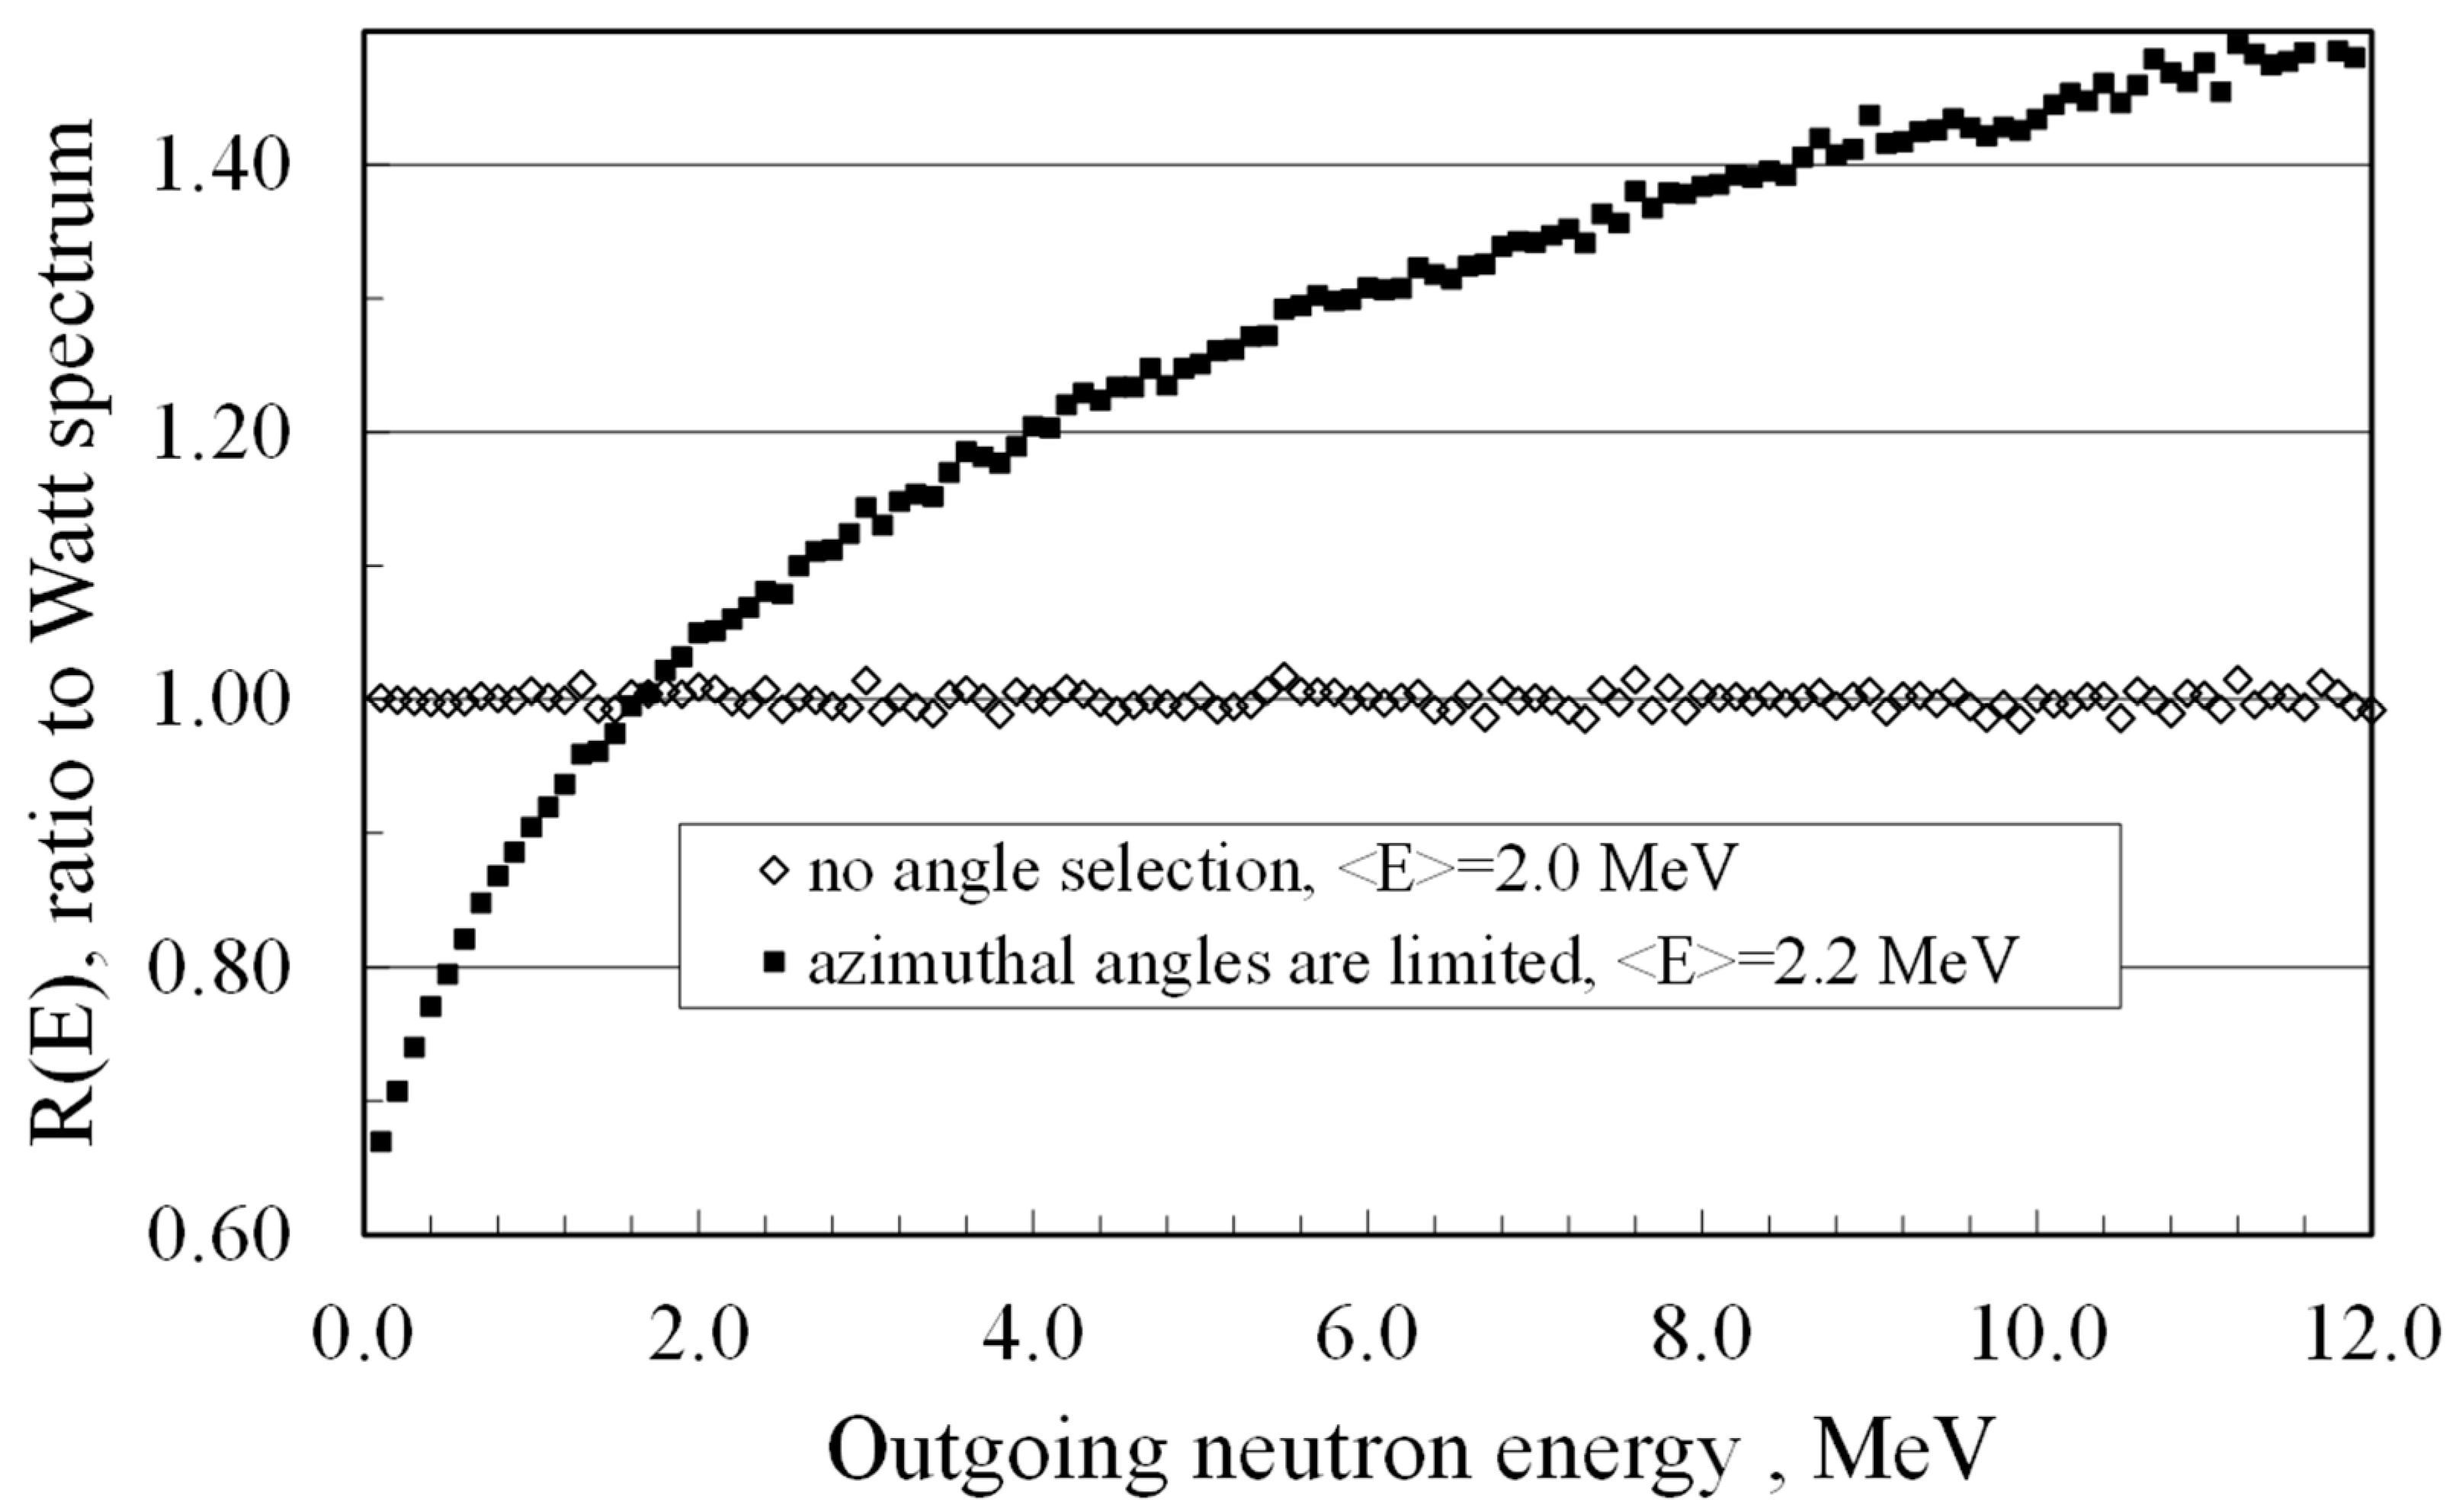
The novel measurements of PFNS with registration of the angle between the flight direction of the fission fragment and neutron were performed at the PINP [
11]. The registration of FF was performed in flat 2π geometry, with the azimuth angle fixed by “the belt” of FF counters and registration of neutrons by two neutron detectors located at the same plane.
This flat geometry was included in MC simulations. It was assumed that fission neutrons are emitted from fixed FF (single fragment) with Center of Mass (CM) energy E
v. The Maxwellian neutron spectrum for CM was used for calculation. Therefore, if we apply full integration (total 4π angle range), we should obtain the Watt distribution in the LS. The ratio of simulated spectra for flat geometry to the Watt distribution is shown in
Figure 6. We see that the SDF for this geometry of measurements can be very strong. It increases the high energy part of the spectrum and average energy. In this simulation, we did not use the FF yields with their mass and kinetic energy distributions; therefore, this result cannot be used as the correction at the SDF. However, it demonstrates clearly that the limitation in the geometry of the measurements of neutron angular distributions relative to the FF flight direction may lead to the appearance of the SDF.
2.4. SDF and Evaluation Procedure
The SDF can be created by the model used in the evaluation. The only way to find the SDF caused by the evaluation procedure is a comparison of the evaluations based on the same experimental data. The understanding of the influence of the selected data set is also important. The different sets of experimental data for
235U(n
th,f) PFNS in fission induced by thermal neutrons were evaluated using the GMA (Gauss–Markov–Aitken approach) code. Because all measurements were undertaken relative to the
252Cf(sf) PFNS standard, the shape of the ratio
252Cf(sf) to
235U(n
th,f) and Mannhart’s standard for absolute
252Cf(sf) spontaneous PFNS with covariances was used in the evaluation. Using the shape-of-ratio experimental data in the fit excludes large components of uncertainties contributing to absolute measurements. The normalization constraint was applied in the fit with an uncertainty close to the uncertainty of the evaluated average number of prompt neutrons for
235U. The evaluated PFNS properly extrapolated to 0 and to 20 MeV on the energy of emitted neutrons was used for calculation of average neutron energy <E> of the spectrum. The data used in GMA evaluation were also used for <E> calculation with the scale method [
7] fitting procedure. The 2% uncertainty at each point from GMA was applied in the SM analysis. It was applied for scaling of the PFNS shape. The results are presented in
Table 2.
We can reach the same conclusion as before. The inclusion of the experimental data as they are given in [
11] increases the <E> outside the estimated uncertainties. Therefore, there is no evidence that the procedure of the evaluation itself contains the SDF.
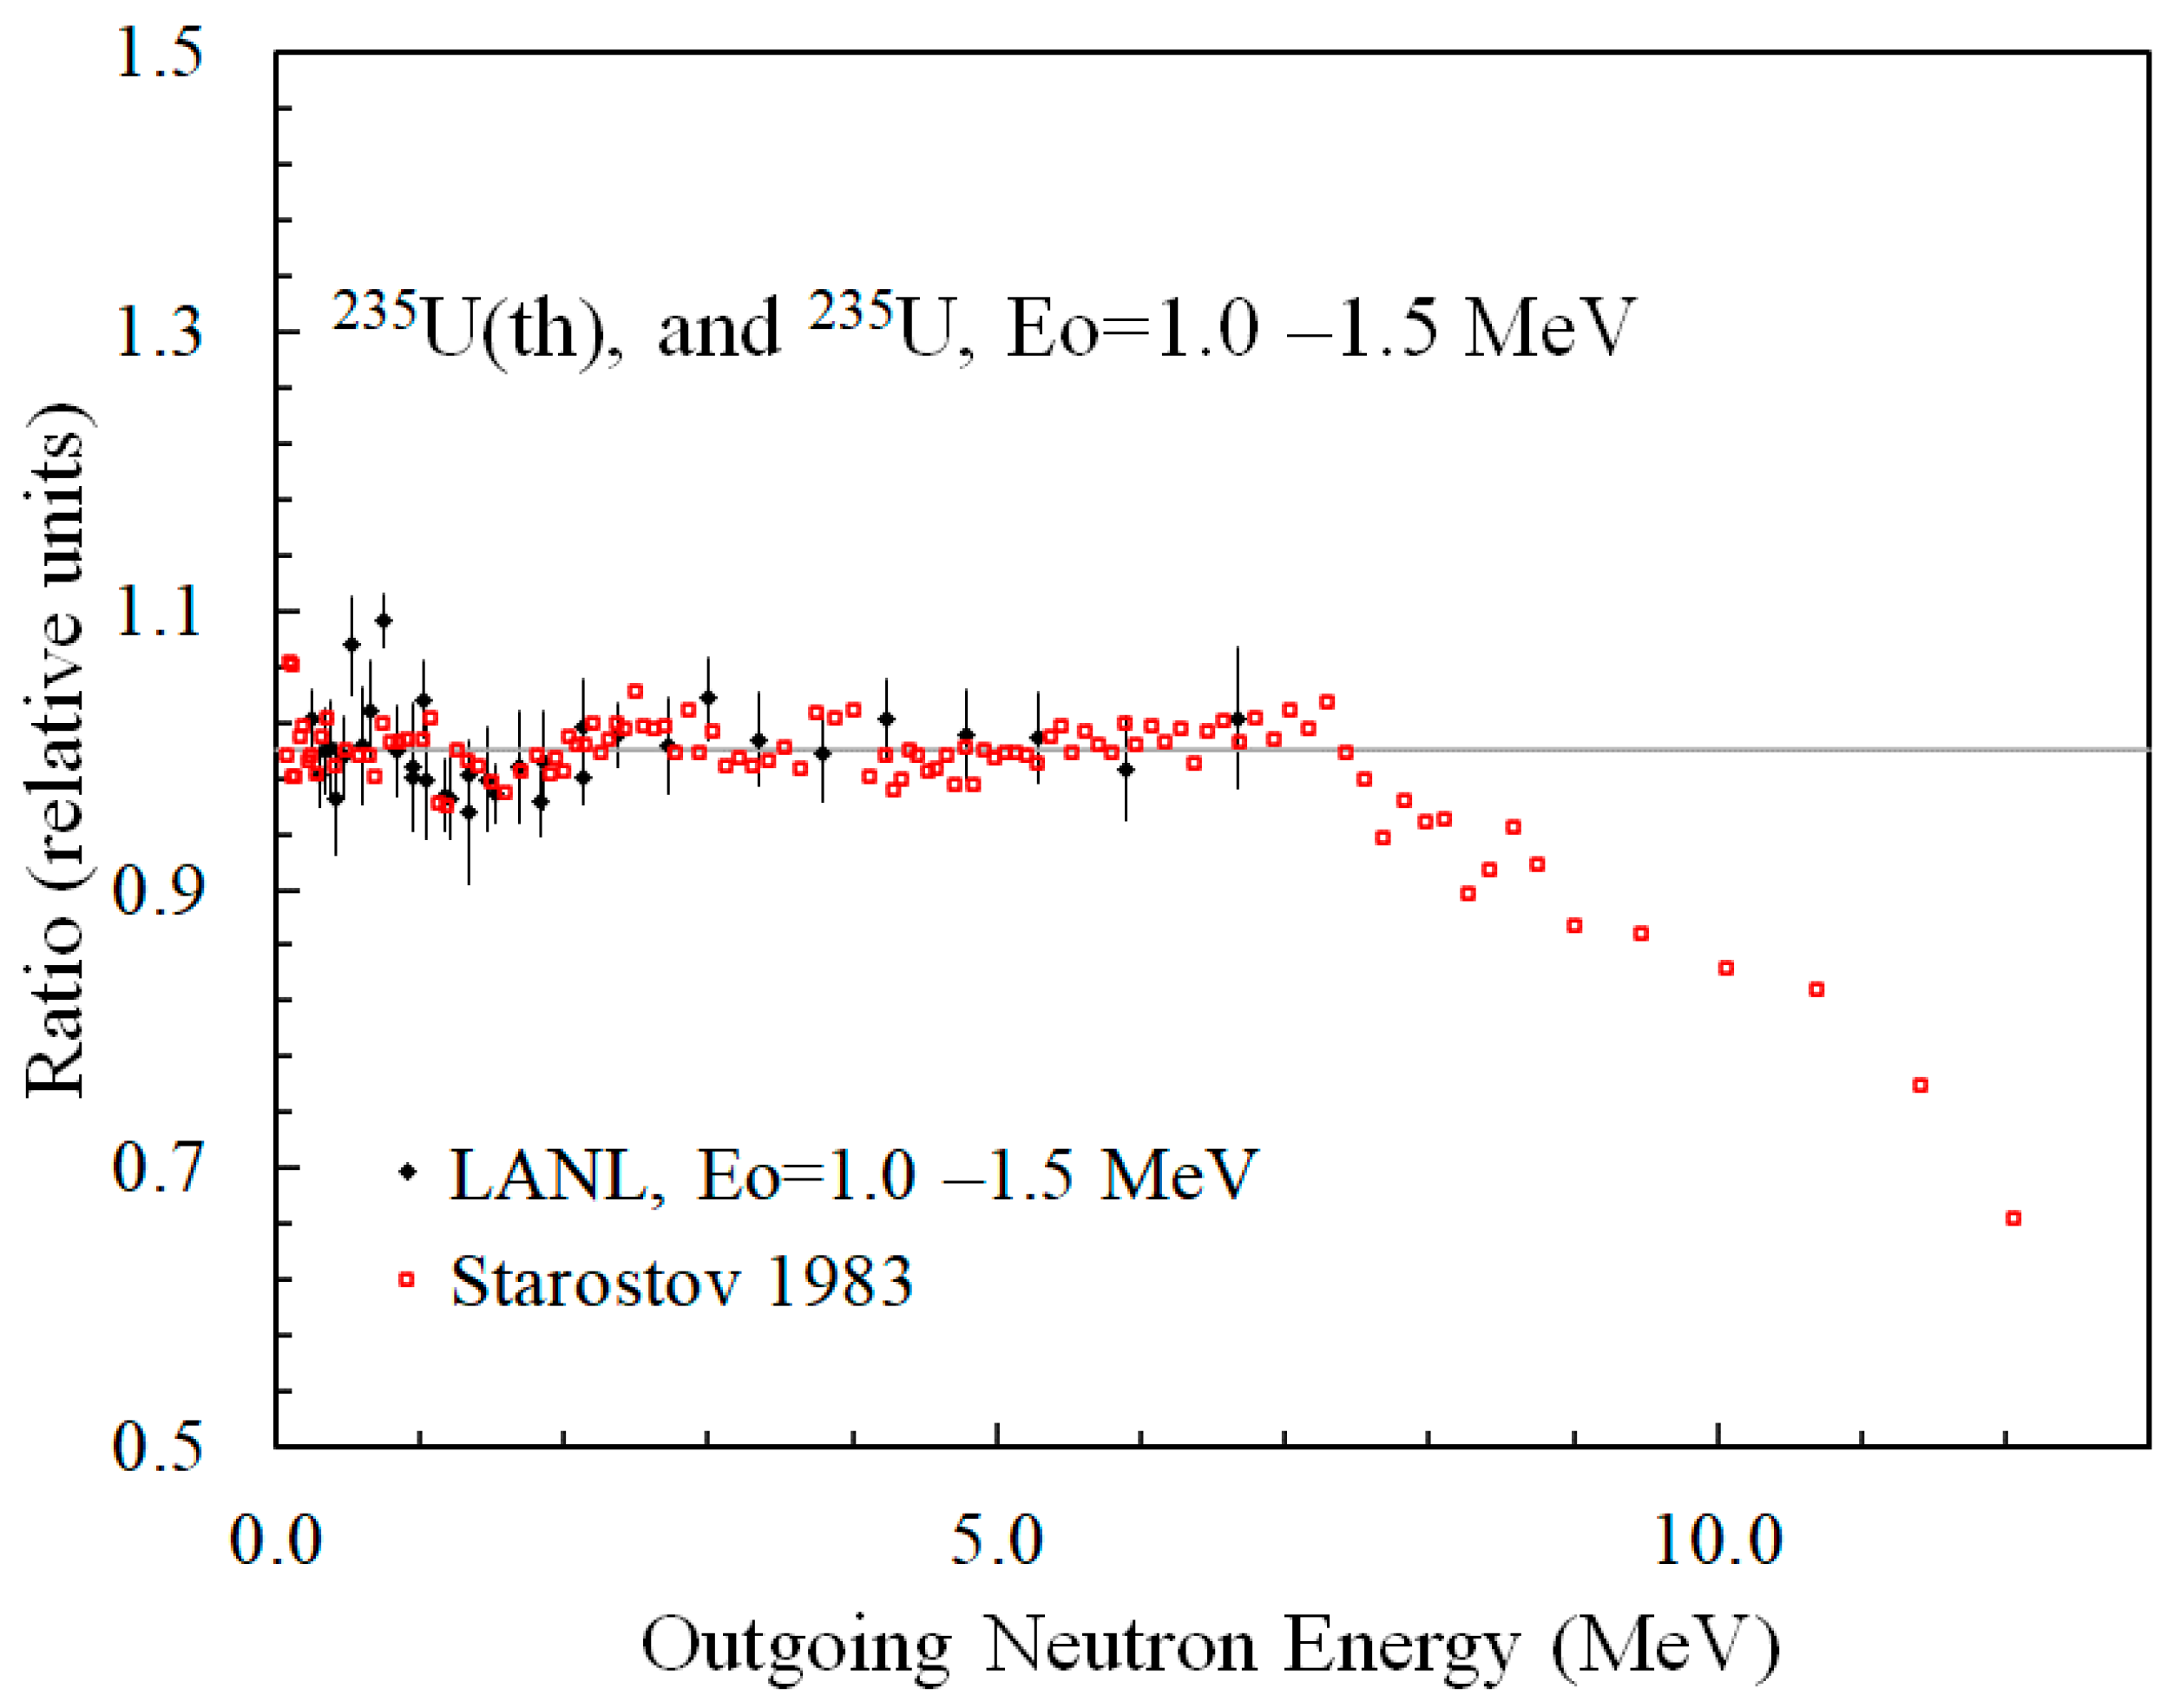
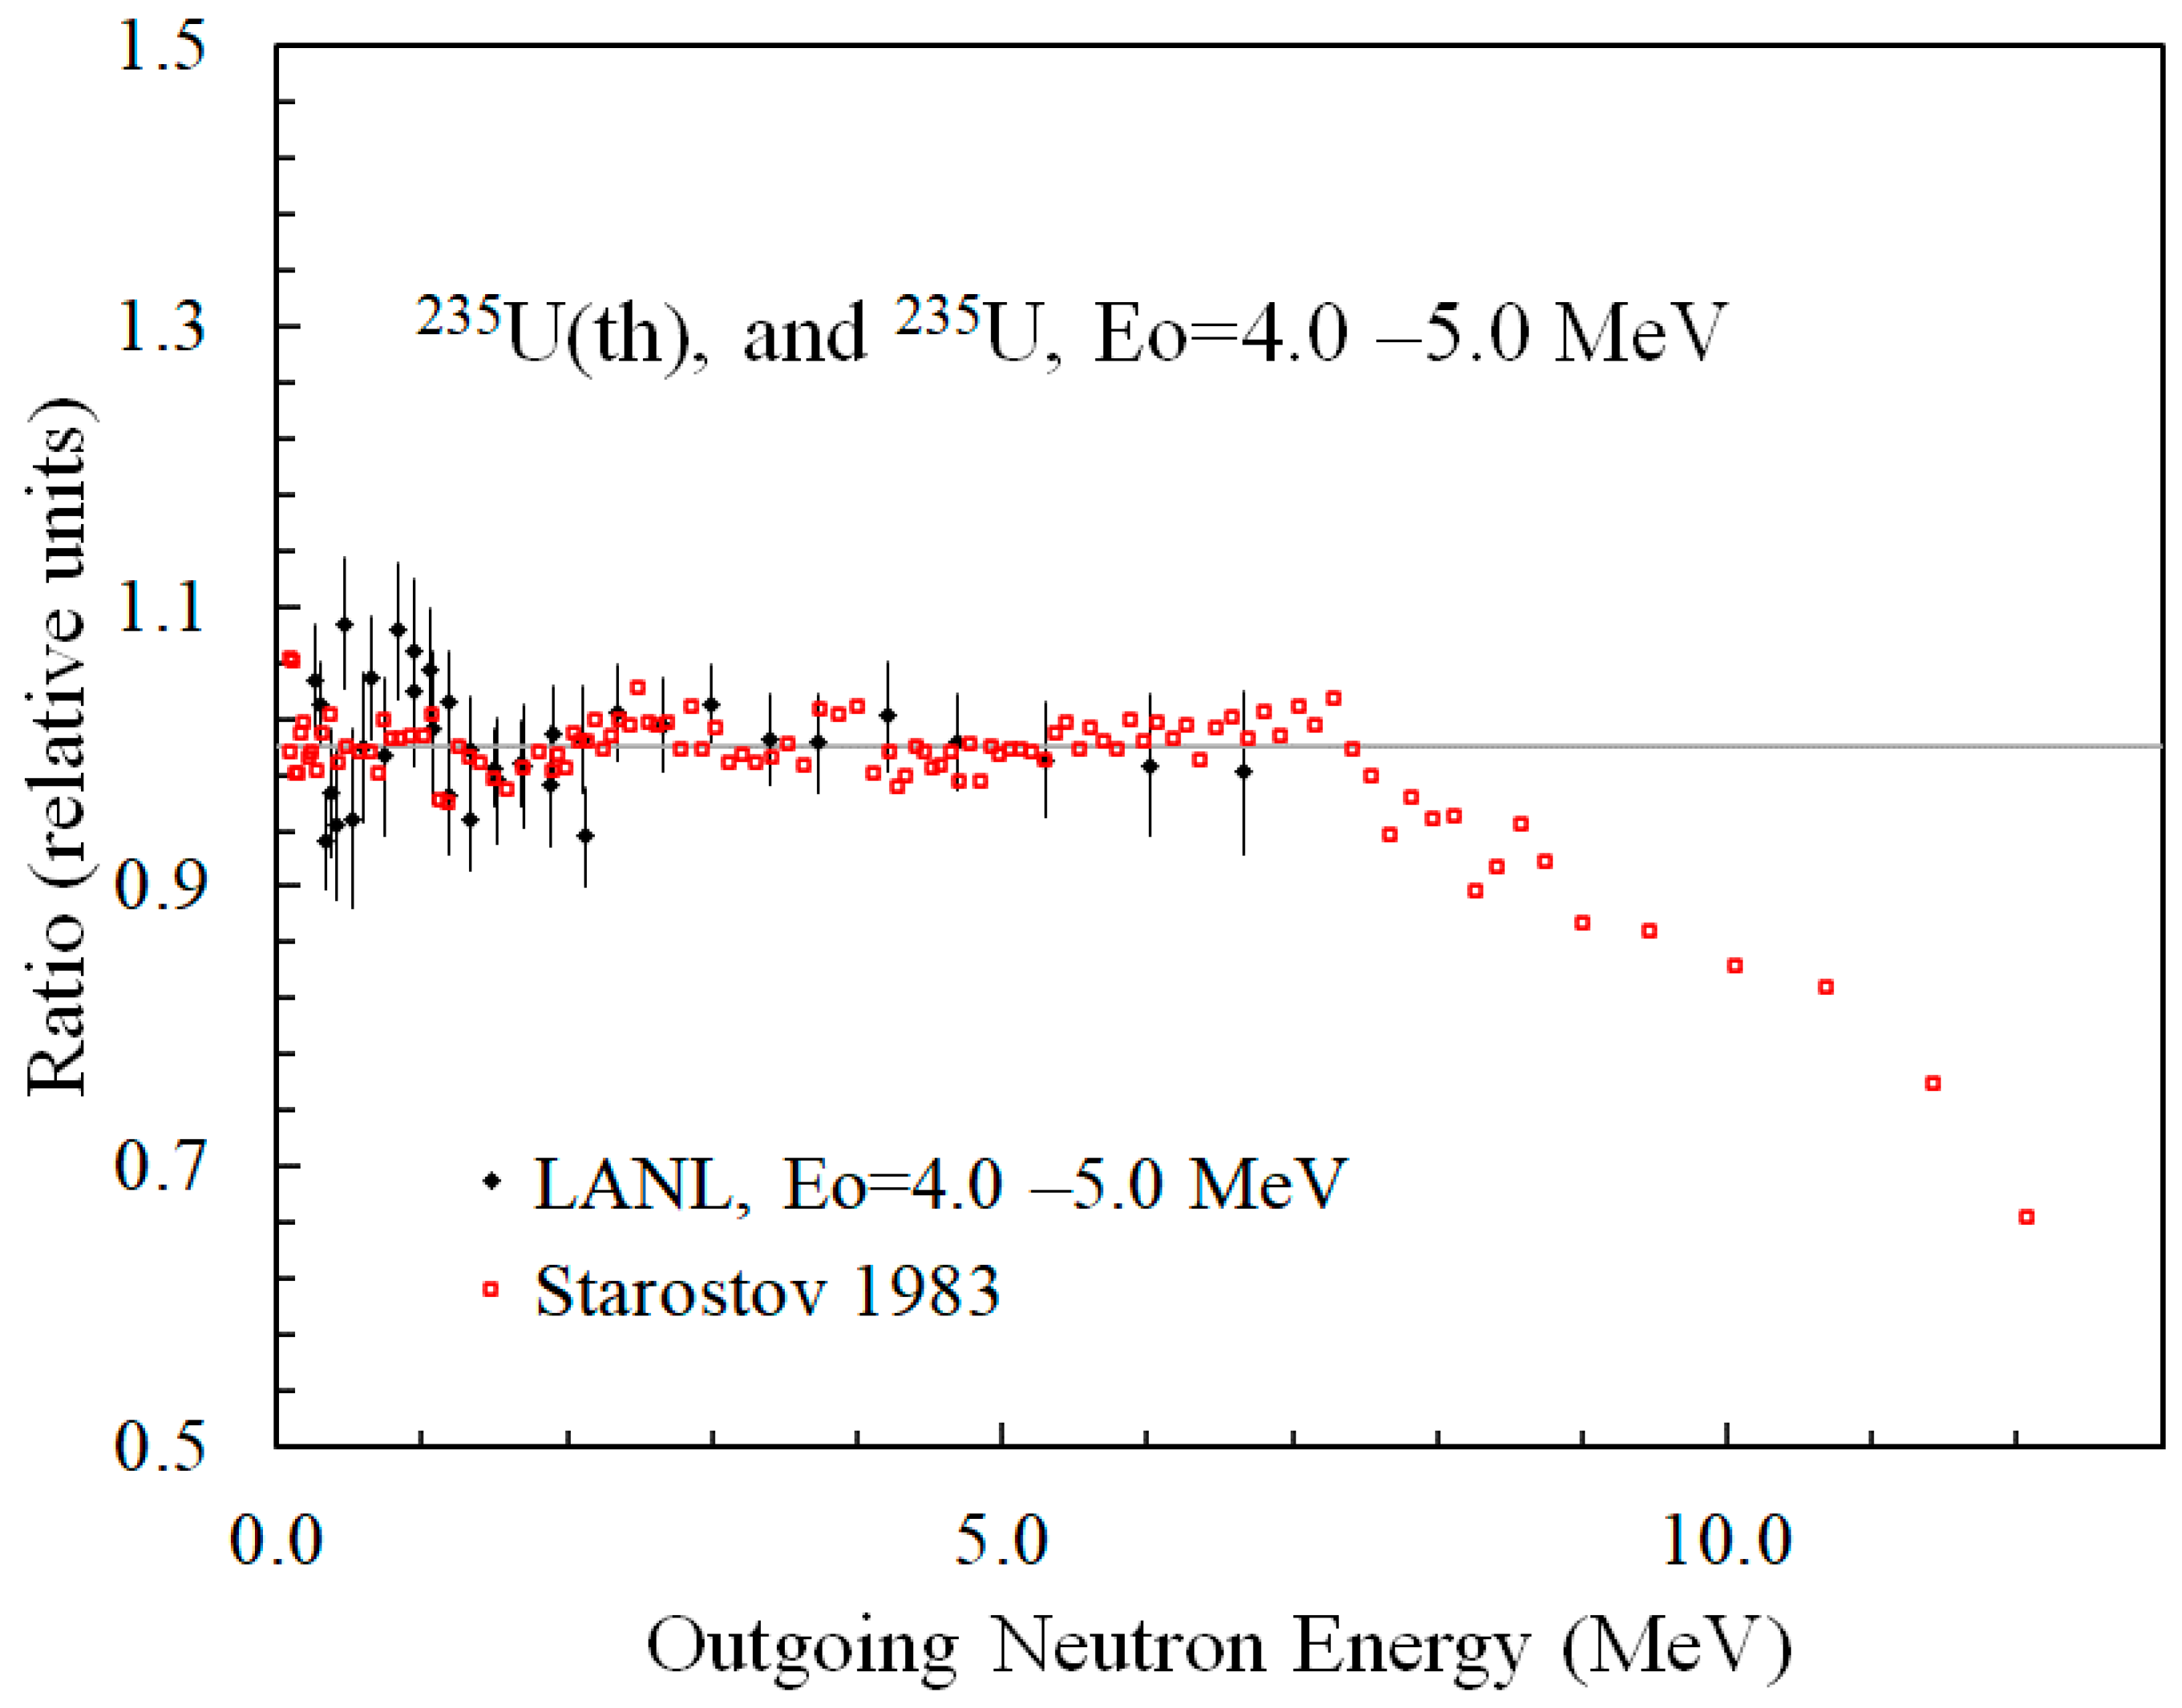
2.5. The Evidence of the SDF in LANL Double TOF Experiment
The final experimental data obtained at LANL are still not available. The values for analysis in this paper were obtained by digitalizing the data from figures presented in [
13,
14]. The uncertainty of this digitalization is small. The data were analyzed with the SM. The experimental PFNS as a ratio to the SM functions is shown in
Figure 7 and
Figure 8. Data were analyzed in the energy range of the emitted neutrons 0.25 < E < 7 MeV. The parameters of the SM fit were used for PFNS calculation in the energy range of emitted neutrons above 0.25 MeV. The data below 0.25 MeV were excluded from the analysis due to possible problems with neutron registration by
6Li-glass detectors near 0.244 MeV
6Li resonance. One should keep in mind that only three points are available in the range 7–10 MeV for the LANL experiment. The average energy for thermal point and LANL data are different. After the correction due to different <E> (ratio to SM fit,
Figure 7 and
Figure 8), the shape of LANL PFNS is in reasonable agreement (inside uncertainties) with old data.
Parameters of the SM (the normalization and <E>) are given in
Table 3. The same parameters with numerical integration of data are given for comparison.
The analysis with SM demonstrated very interesting peculiarities:
The SM approach describes LANL data within the experimental uncertainties (χ2/N of order 1). The numerical integration provides the same normalization, but <E> is lower. It can be related to the LANL spectra behavior below 0.25 MeV. The numerical integration with Maxwellian spectrum gave ~20 keV difference for <E> calculated in the 0–10 and 0–20 MeV ranges.
Experimental PFNS shown in the figures in [
7,
8] were not normalized to unity. SM and numerical integration are in reasonable agreement.
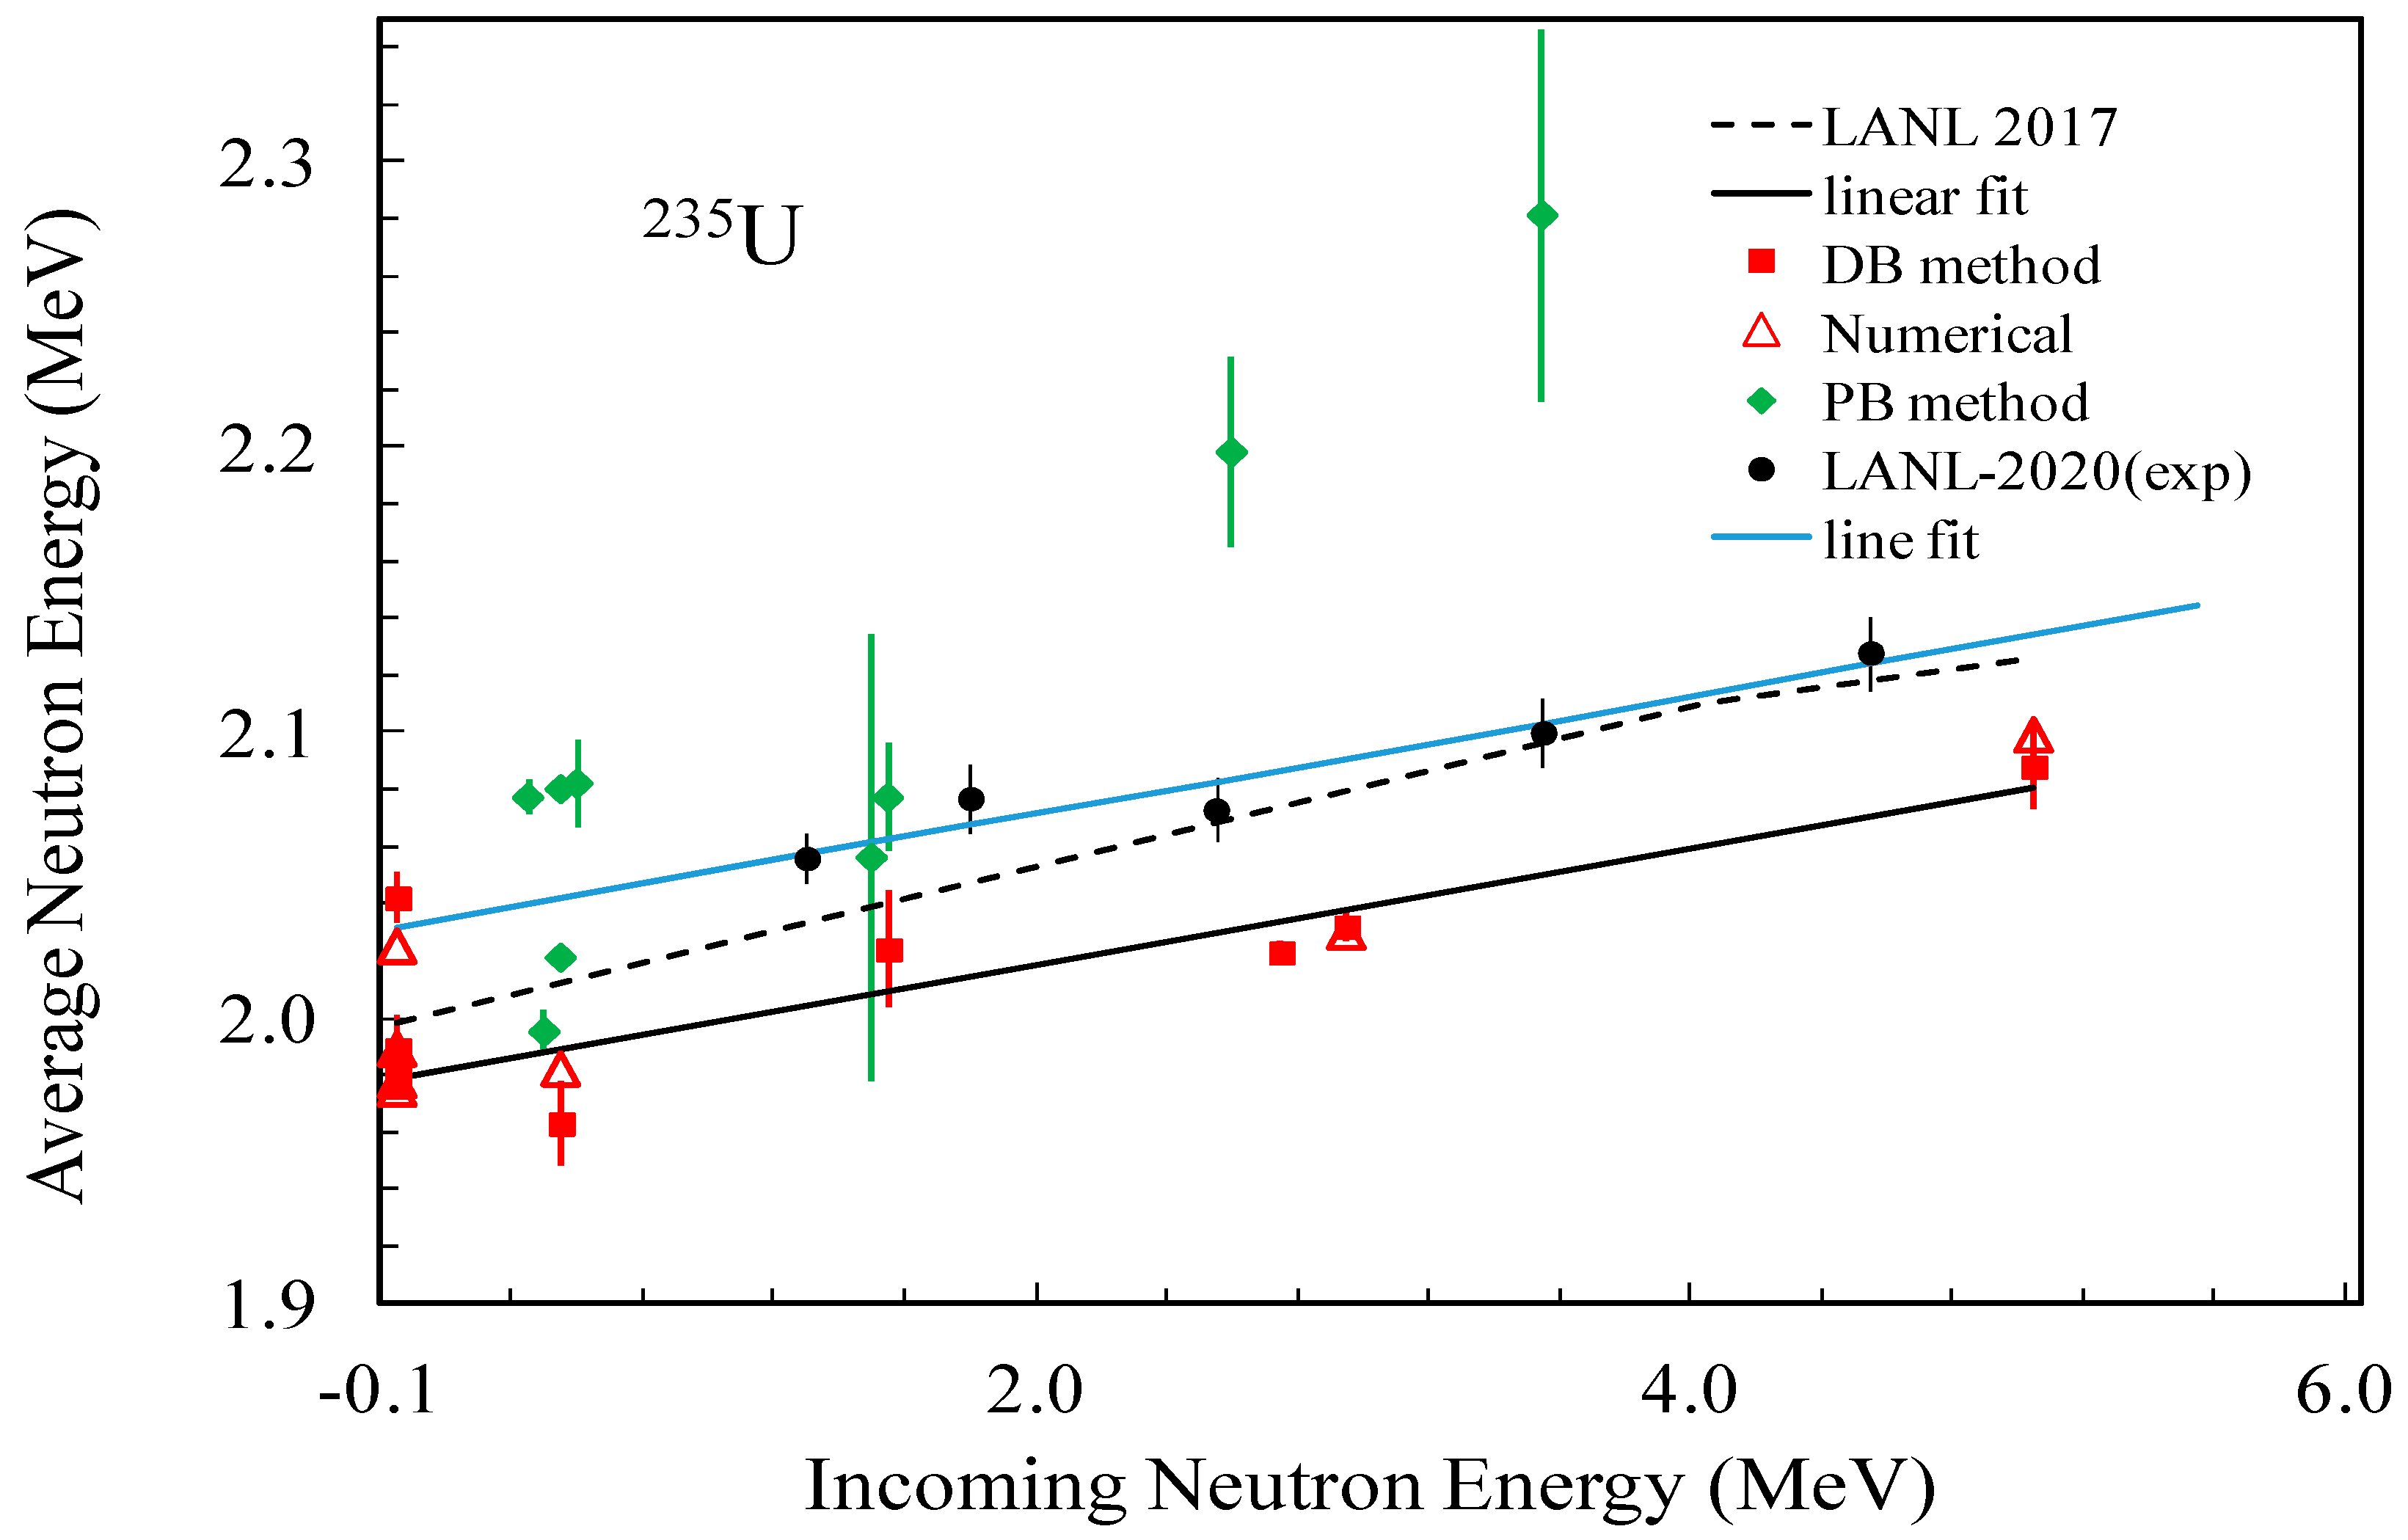
Average energies estimated from LANL data contradict the majority of previous measurement results (see
Table 3 and
Figure 9). The energy dependence obtained from the fit of the results of the old measurements is <E> = 1.978 + 0.020 × E
0, MeV [
7]. The fit to LANL data (only) gives <E> = 2.032 + 0.020 × E
0, MeV. There is a clear shift in more than 30 keV for <E> between LANL and DB measurements.
The LANL results are supported only by the data from [
11], which were not included in the fitting procedure and discussed above in this paper. The conclusion was that this experiment most probably contains the SDF. It is interesting that if [
11] used multi-detector registration of fission fragments, LANL used multi-detector neutron registration.
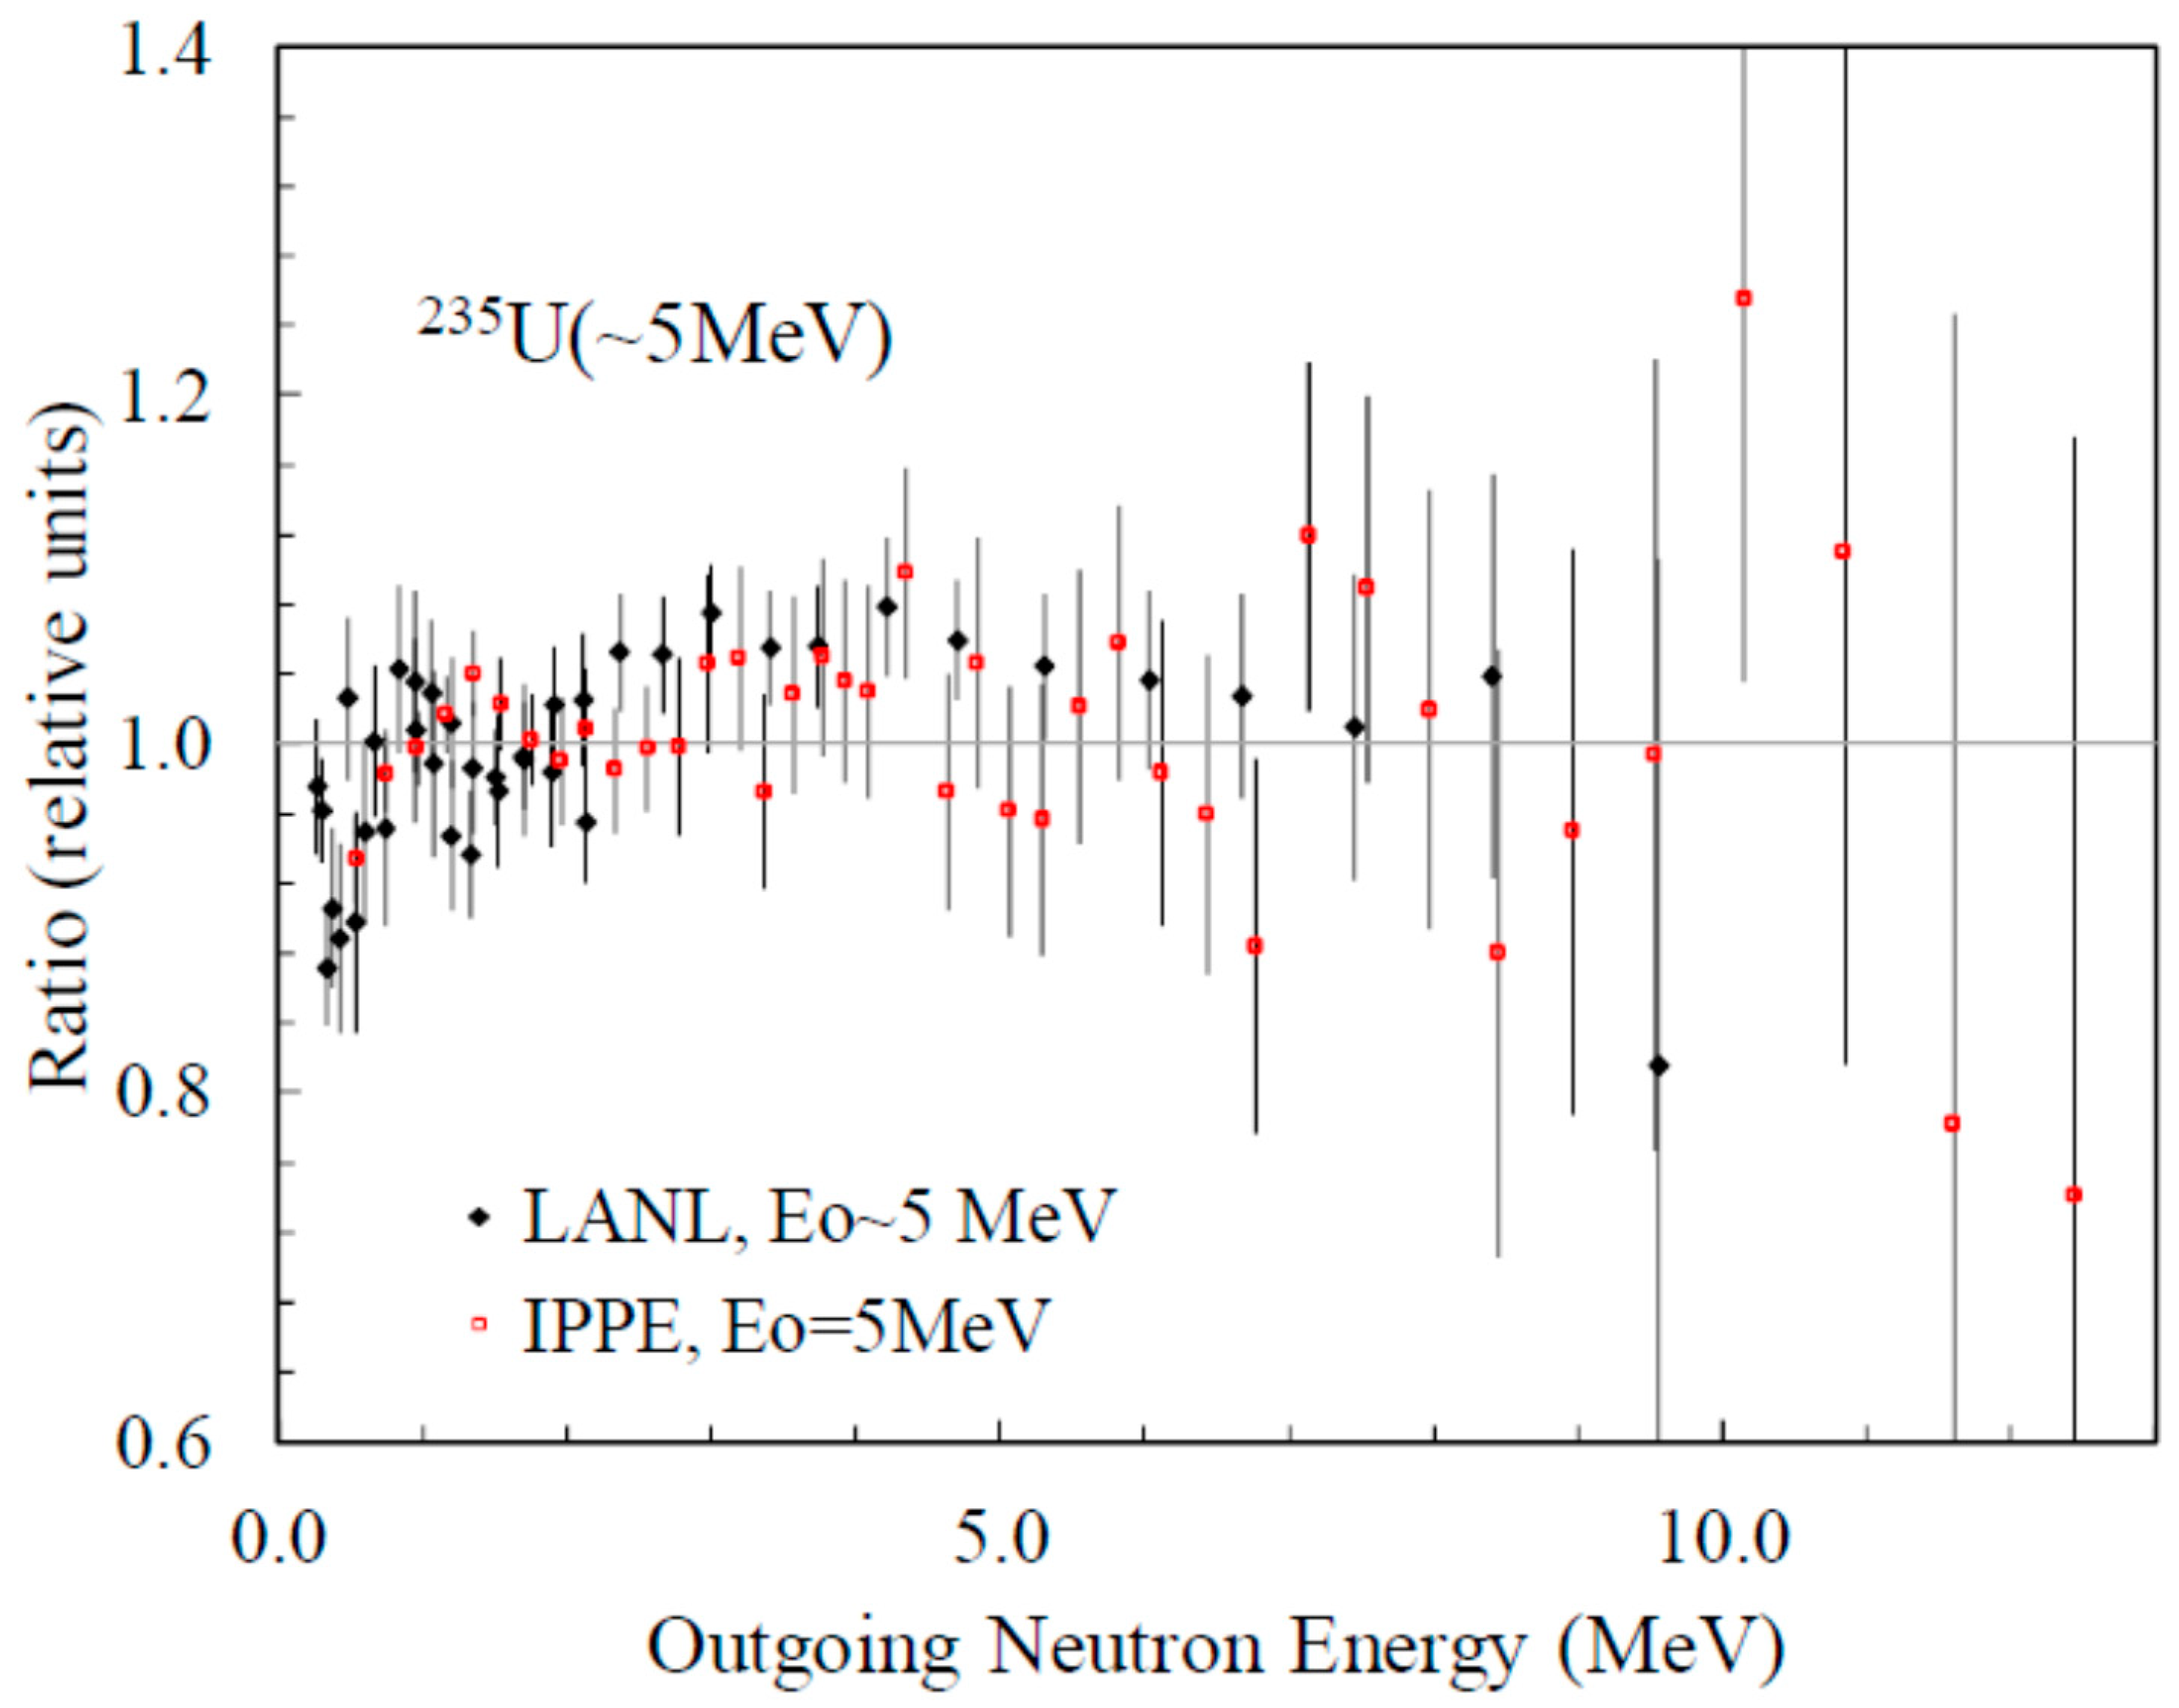
The ratio of LANL data at 4.5 MeV to the Maxwellian spectrum with kT = 1.379 MeV was compared in
Figure 10 with the ratio of IPPE data [
15] at 5 MeV to the Maxwellian spectrum with kT = 1.385 MeV. The agreement is good. PFNS spectra demonstrate a rather broad “bump” in the energy range 2–6 MeV with the average ratios 1.045 (LANL) and 1.015 (IPPE). Uncertainties of the PFNS are large enough to make the conclusion clear about the SDF presence. However, the difference in the spectrum average energies of 3% between LANL and other data (
Figure 9) evaluated with the SM with low uncertainties (0.5–1%) shows that LANL result may contain the SDF.
One may assume that the origin of the SDF in double TOF LANL results can be some unaccounted background neutrons. These neutrons reached the chamber at the same time interval due to a longer flight path. These background neutrons cause fission at higher neutron energy, and as a consequence, they contribute to a higher average neutron energy of PFNS.
SDF connected with the time structure of the proton beam or other causes of SDFs are also possible.
One may assume that LANL results consistent with the results in [
11] are accurate and that other measurements performed in the years 1983 to 2018 contain the SDF. This seems a doubtful assumption, at least concerning the results [
11]. As discussed in
Section 2.3, the results of the measurements [
11] contain rather strong SDF, and this should be accounted for in the PFNS evaluation procedure.
3. SDF in Fission cross Section Ratio Measurements
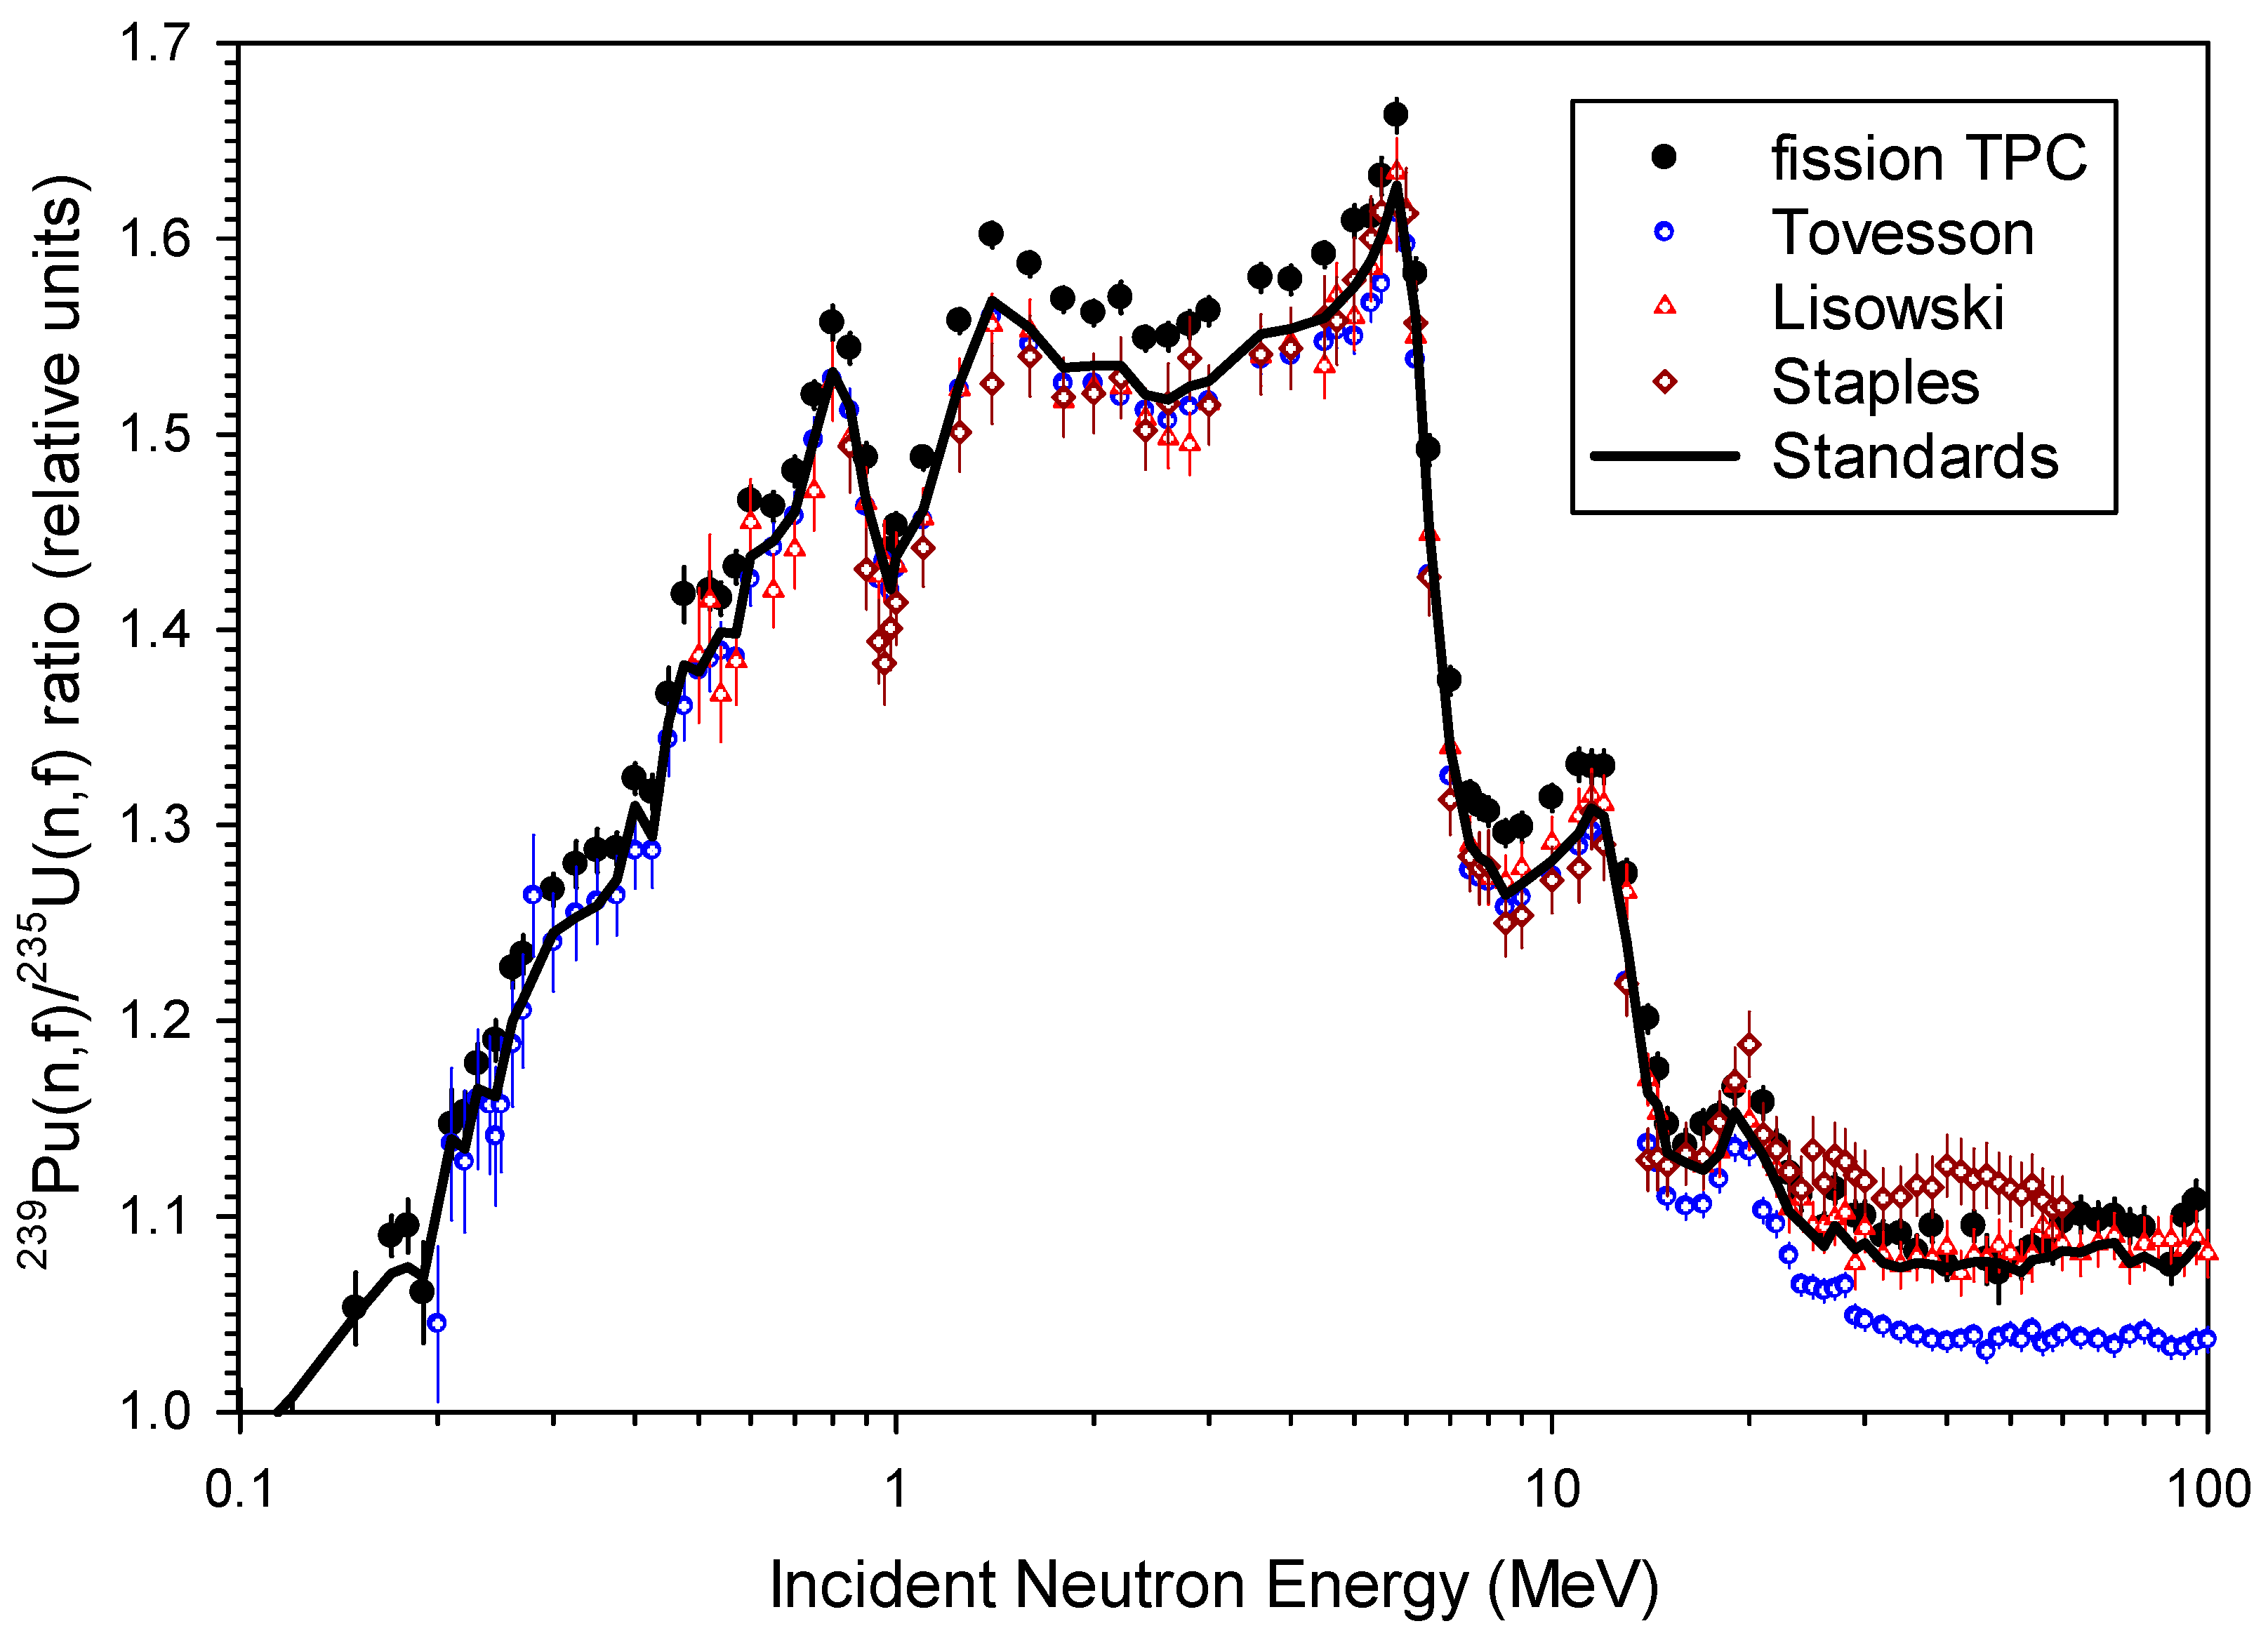
A new experiment using the Time Projection Chamber (TPC) for registration of FF was implemented in Los Alamos National Laboratory (LANL) by a team from different universities and laboratories (NIFFTE collaboration). The results of the absolute ratio of
239Pu(n,f) to
235U(n,f) cross section measurements are shown in
Figure 11. The data were taken from [
16].
The constant bias at about 2% is clearly visible in the energy range 0.2–15 MeV and has an even larger spread above 15 MeV. The authors of [
16] provided a very detailed and deep analysis of the modeling of their experiment (experimental details, data reduction procedure, uncertainties of different parameters and so on) but at present could not explain the existing bias, which can be treated as SDF. From our point of view, it is premature to assign the SDF to this measurement, especially taking into account that the reaction rate ratios measured in clean benchmarks show better consistency with the NIFFTE results.
The authors of [
16] came to the conclusion that the difference in 2% absolute normalization with the ENDF/B-VIII.0 [
20] evaluation based on its turn on neutron standards evaluation [
2] is too large to be ignored. The large non-uniformity and mass value of the
239Pu sample, which can degrade with time, are the largest concern. Although the TPC results with multi-parametric data allow an estimate of many sources of systematic uncertainties (or potential SDF by other words), the present decision is to repeat the measurements with a newly prepared
239Pu sample. At the same time, we should admit that the results of the reaction rate measurements obtained as benchmarks with fast neutron spectrum and Mannhart’s evaluations [
21] of
252Cf PFNS-averaged cross sections endorse the data obtained with the TPC.
4. SDF in Maxwellian Averaged cross Sections (MACS) for Astrophysical Application
MACS for neutron capture are used in astrophysics to model the stellar nucleosynthesis of elements. The range of needed neutron temperatures (kT) is varied from a few keV to 100 keV. The novel method of direct MACS measurement for kT = 25–30 keV was proposed by Beer and Kaeppeler [
22]. It is based on the kinematics of
7Li(p,n) reaction at a proton energy of 1912 keV. As it was shown experimentally and through modeling, the neutrons in this case are emitted in the forward cone with the spectrum integrated on the angles close to the Maxwellian spectrum with kT between 25 and 30 keV.
Ratinsky and Kaeppeler recorded the accurate activation MACS measurements [
23] for
197Au(n,γ) (582 ± 9 mb at kT = 30 keV, stellar definition), which were used as the standard for measurements of other nuclides by this method. Slightly renormalized results of Macklin’s
197Au(n,γ) microscopic cross section, which provided this MACS value, were used in calculations for extrapolation of calculated MACS to lower and higher kT. These values were inconsistent with MACS calculated for the evaluation of
197Au(n,γ) standards [
22] based on a combined fit of 62 measurements of captured cross sections and their ratios to other standard reactions. MACS calculated for standard cross section evaluation in the energy range 5 keV–2.8 MeV, supplemented by the ENDF/B-VII.0 evaluation below and above this energy range, was 614 mb at kT = 30 keV. The ENDF/B-VII.0 evaluation had missed resonances at the upper end of the resolved resonance range. The correction at the missed resonances increases the MACS value to 619 mb [
24].
This controversy and new results of nTOF [
25] and GELINA [
26] measurements of microscopic capture cross sections, consistent with the standards evaluation, led to a new cycle of measurements and analysis of the MACS. To resolve the discrepancy, PINO [
27] and SimLiT [
28] Monte Carlo codes were developed for modeling the neutron source. GEANT4 code was used for modeling the neutron transport. There have been a number of publications, but the latest review of the Spectrum Averaged Cross Section (SACS) measurements and re-evaluation is published in [
29]. Two major sources that may cause bias in the MACS values were discussed [
29]: attenuation of the neutron flux at the copper backing of the
7Li target, and the difference between the measured neutron spectrum and “true” neutron spectrum incident at the gold sample following a reduction in the measured value to the MACS value at kT = 30 keV.
Simulation of the neutron source had shown [
29] that backing of the
7Li target with copper of 1 mm thickness requires the introduction of neutron scattering correction between 6.4 and 7.1% depending on the nuclear data library used in simulation calculations. The comparison with experimental data obtained for different thicknesses of backings and size of deposited
7Li targets shows [
29] that the large part of the discrepancy with MACS obtained with the standards evaluation and calculated with the latest experimental data [
25,
26] may be explained by an improper account of backing in the activation measurements. The authors of [
29] were unable to introduce corrections in the results [
23] at the base of their simulation because of the inconsistencies between experimental data [
23] after introducing corrections based at the simulation.
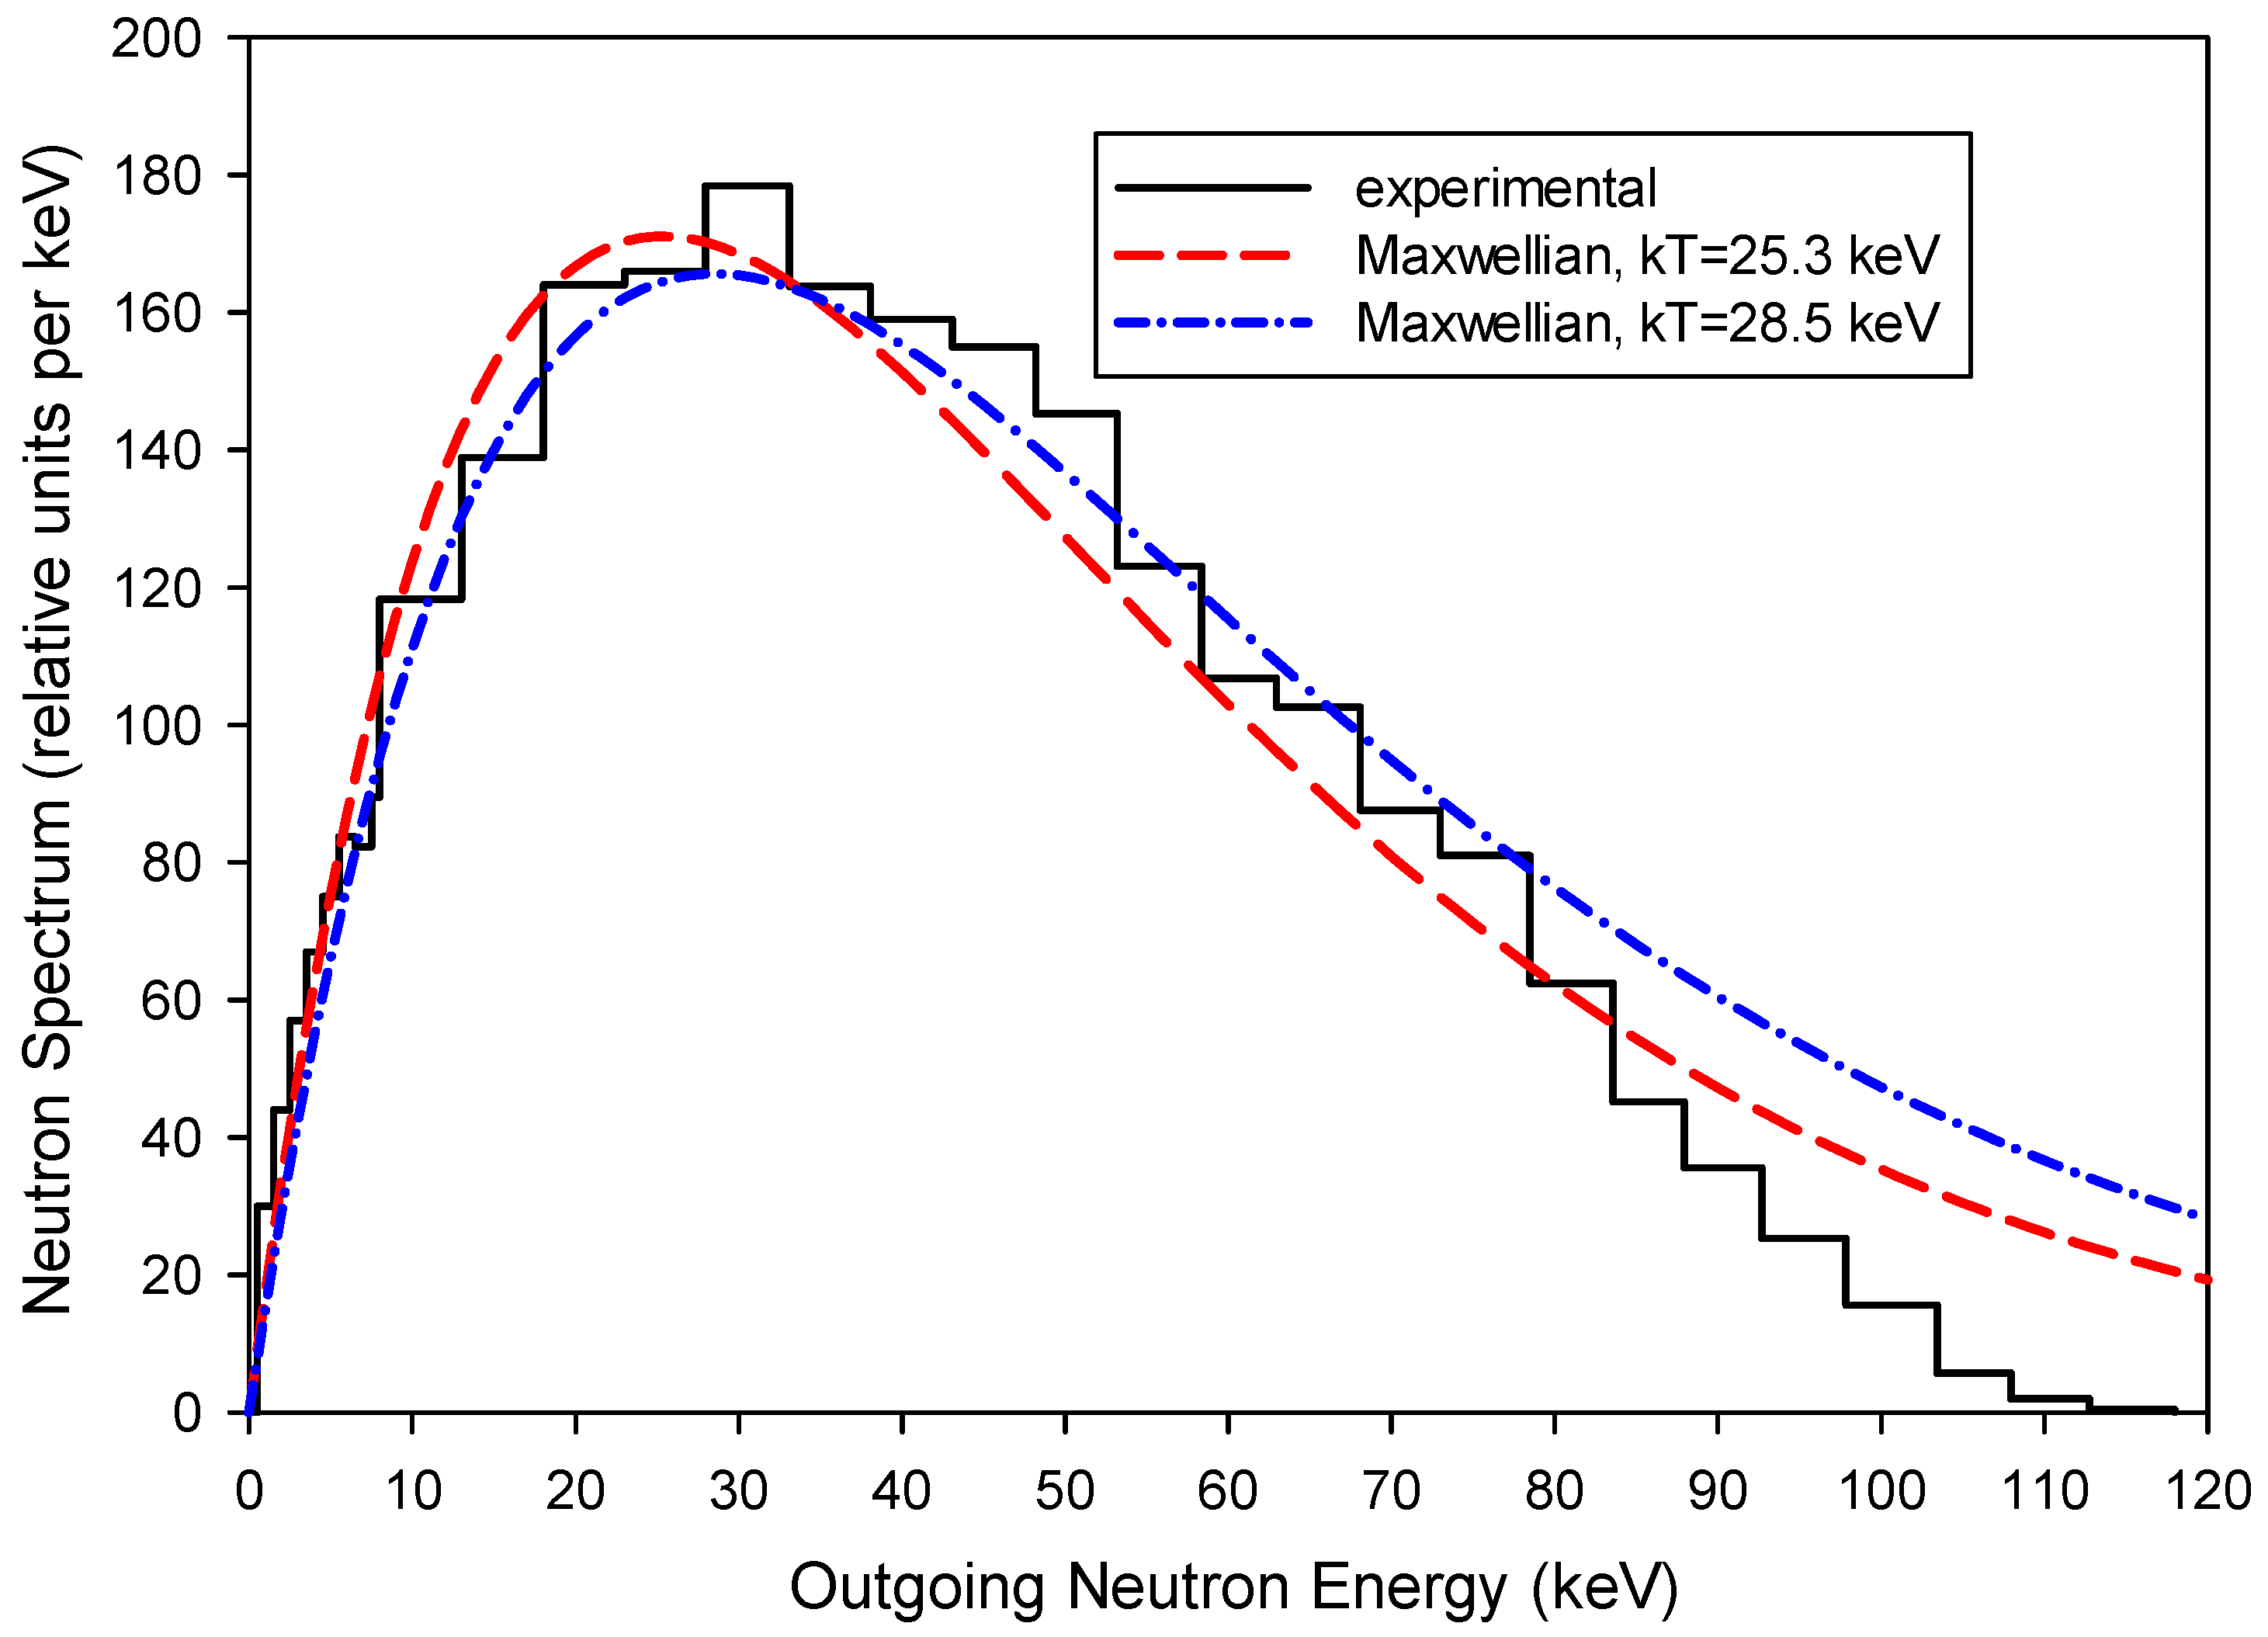
The measured neutron spectrum induced by 1912 keV protons and integrated on the angles is similar to the 25.3 keV Maxwellian neutron spectrum [
23] but shows a clear lack of neutrons above 80 keV. The neutron temperature, which should be best assigned to the measured MACS values, has rather large uncertainty. The comparison of the measured spectrum [
23] with Maxwellian spectra at kT = 25.3 (best fitted to the experimental simulated spectrum [
23]) and kT = 28.5 keV (obtained from calculated mean energy of the experimental simulated spectrum [
24]) is shown in
Figure 12. It was estimated [
24] that, depending on the procedure of the reduction to the true Maxwellian spectrum, the difference between the measured value [
23] at the best assigned temperature and the calculated value may reach 2.5%. A similar difference (1.7%) is shown in [
29] between recommended values obtained from the latest measurements of SACS and SACS calculated for the true Maxwellian spectrum at the same temperatures.
A series of new measurements of MACS with a
7Li(p,n) reaction for different thicknesses of lithium target and spectrum of protons incident on the target supported by modeling of the experiment had allowed obtaining the best simulation of the Maxwellian-like spectra for different temperatures [
29]. A new version of the neutron cross section standards [
2] took into account the results of the new measurements [
29] of
197Au(n,γ) cross sections. MACS at kT = 30 keV calculated for the standard evaluation in the energy range 3 keV–2.8 MeV embedded in the ENDF/B-VIII.0 evaluation provides the new recommended value of 611.4 ± 4.2 mb with the uncertainty increasing to 11.2 mb when USU is accounted for. This value has excellent consistency with the new value 612 ± 6 mb [
29] recommended for use by the astrophysical community.
We may conclude that the modeling of the neutron source, including the energy angular correlation and attenuation of neutrons in lithium target backing excludes the bias (~5%) caused by SDF from the results of SACS measurements. The proof of this is the consistency between results derived from simulated SACS measurements and calculated from the evaluated cross sections obtained in the independent microscopic cross section measurements.
5. Unrecognized Sources of Uncertainty (USU) in the Data Evaluation
5.1. Small Uncertainties Problem in Neutron Cross Section Standards Evaluation and USU
In 1991, the Cross Section Evaluation Working Group (CSEWG) concluded that the uncertainties of the evaluated neutron cross section standards [
30] are strongly underestimated. The standards were obtained in the combined model-independent statistical fit of about 400 data sets for 10 reactions and their combinations. The relative uncertainties obtained from variances of the covariance matrix of the evaluated standards were two to three times lower than the spread of the experimental data estimated for the same broad energy groups.
The spread of the experimental data can be best characterized by the variances of the evaluation obtained with the use of the sample statistics. For this, the model-independent least square fit of the data in the energy groups can be performed without consideration of the uncertainties assigned to the data. The uncertainty of integral data calculated with an account of the evaluated covariance matrices (such as SACS for 197Au(n,γ) reaction discussed above) was also considered as too small. This can be partly explained by an incomplete budget of uncertainty sources for some measurements and absence or not a full account of cross-correlations between the same components of uncertainties in different measurements, which use the same sample or detector, or even method. This conclusion remains generally true with the revision of the outlaying experimental data uncertainties.
The difference in the data values obtained in different experiments, which cannot be explained by uncertainties assigned to them, indicates the presence of the USU [
31]. In the case when better consistency cannot be achieved through the revision or introduction of the corrections based on the Monte Carlo modeling of the experiments (SDF removing), the additional uncertainty can be introduced in the evaluated covariance matrix, making the evaluated uncertainties more realistic.
This approach can be applied to the neutron cross section standards evaluation [
2]. The GMA code [
32] for model-independent evaluation of the standards uses the GLSQ method for a simultaneous fit of the cross sections and integral parameters with an iterative approach. Starting from the second iteration, a posterior evaluation for data values with an uninformative covariance matrix is used as a new prior. Usually, three iterations are needed to obtain full convergence when the last posterior data evaluation is practically indistinguishable from the last prior evaluation. All experimental data are reduced in the model-independent fit to a common grid of energy nodes.
The covariance matrix for each experimental data set is constructed from statistical, fully correlated systematical and medium energy range correlated to systematical components of uncertainties. The correlations between the same components of the uncertainties in different measurements can be accounted for.
5.2. Sample Method for Determination of USU Covariance Matrices
A sample method can be adapted for construction of the USU component of the evaluated covariance matrix using the biases between the evaluated and experimental data with an account of recognized (known) uncertainties. A sample method for the uncertainty evaluation in the measurements is usually formulated for a set of repeated measurements of multivariate (vector) data [
33].
For independent random vectors
Xi (i = 1, …,
I) of dimension n and with a zero mean, the sample covariance matrix (without discloser of the nodes indices) is:
The closeness of the sample covariance matrix to the actual covariance matrix depending on vector dimension
(n) and number of samples
(I) was studied in [
34]. Sample covariances for the USU component can be constructed in the framework of an ad hoc procedure based on the biases between evaluated and experimental data reduced by known (and accounted for in the evaluation) systematic uncertainties.
The sample vector
δi for the USU component can be written as:
where
yi is a vector of
i-the experimental data set,
µ is a vector of evaluated data (best approximation to the true value),
(yi −
µ) is a vector of biases between experimental and evaluated data,
ui = is a vector of total uncertainty of experimental data,
εi is a vector of the statistical component of the uncertainty, and
ηi is a vector of the systematic component of the uncertainty, which consists of two components: assigned to the analysis of experimental uncertainty
ηi,exp and assigned to the outlaying data
ηi,out:
There is an established procedure for obtaining the evaluated values with GMA. It includes:
- −
Analysis and correction of the experimental data, assigning of all components of uncertainties given or not given by the authors, introducing of the correlations between the components of the uncertainties in different experiments;
- −
Data reduction to the same nodes on neutron energy;
- −
GLSQ combined fit of all data;
- −
Adding the component of the uncertainty to the outlaying data making them consistent with the evaluation;
- −
New fit to obtain new posterior evaluation, redetermination of the outlaying data and repeating the fit up to the convergence when no redetermination of the outlaying data is needed.
This work with outlaying data allows avoiding big local discrepancies and reducing the general chi-square per degree of freedom for standard evaluation from the initial 3.4 to a value close to 1 without strong local discrepancies.
The main differences to the classic sampling method are the following:
- −
Data in some sets can be missed at some nodes and cover different energy ranges;
- −
The sample vector in the node may have not a random distribution relative evaluated value;
- −
The number of data in some nodes can be too small to be statistically significant;
- −
Some data are non-normalized shape type data, which will require the additional procedure of their normalization for determination of a sample vector;
Covariances for the USU component can be written with the discloser of the node indices
m and
n for vectors as
In our case, not all data sets contribute at the energy node
m or
n, and
Kmn is a number of non-zero terms in the sum. The total covariances of evaluated data (
) can be written as a sum of covariances obtained in the GMA fit with the ad hoc increase in the uncertainties for the outlaying data (
) and covariance estimated for the USU component (
).
The covariance matrix for the USU component (2) may turn out to be semi-positive definite, and because of this, the total covariances (3) may lose its semi-positive definite. This introduction of USU covariances can be considered as a rather crude approach to the estimation of the realistic uncertainties of the evaluated data, but it is definitely a better approach than expert estimation [
30]. If we increase the uncertainties of the outlaying data using stricter ad hoc requirements to the data consistency, we will reduce the USU covariances, or even exclude them. Then we have a strong connection between the treatment of the outliers and USU uncertainties, with a clear distinction that uncertainties for outliers are introduced into the experimental data iteratively in the fit, and USU uncertainties as additional components to the evaluated data.
The work with the GMA database of experimental data has shown that outliers are often the “poor” data with large uncertainties. Increasing the uncertainty of these outliers with the procedure described above reduces the chi-square per degree of freedom, changes the evaluated (mean) values, and to a lower extent, changes the covariances. The “smallness” of the evaluated uncertainties is determined mainly by the “good” experimental data with small uncertainties.
5.3. Numerical Example of USU Covariance Matrix Construction
This approach for determination of USU was applied for testing of
238U(n,f) to the
235U(n,f) cross section ratio evaluated with the GMA for the model case of 11 cross section ratio measurements taken as absolute in 11 nodes (
Figure 13). The outliers were determined, and their uncertainties were increased.
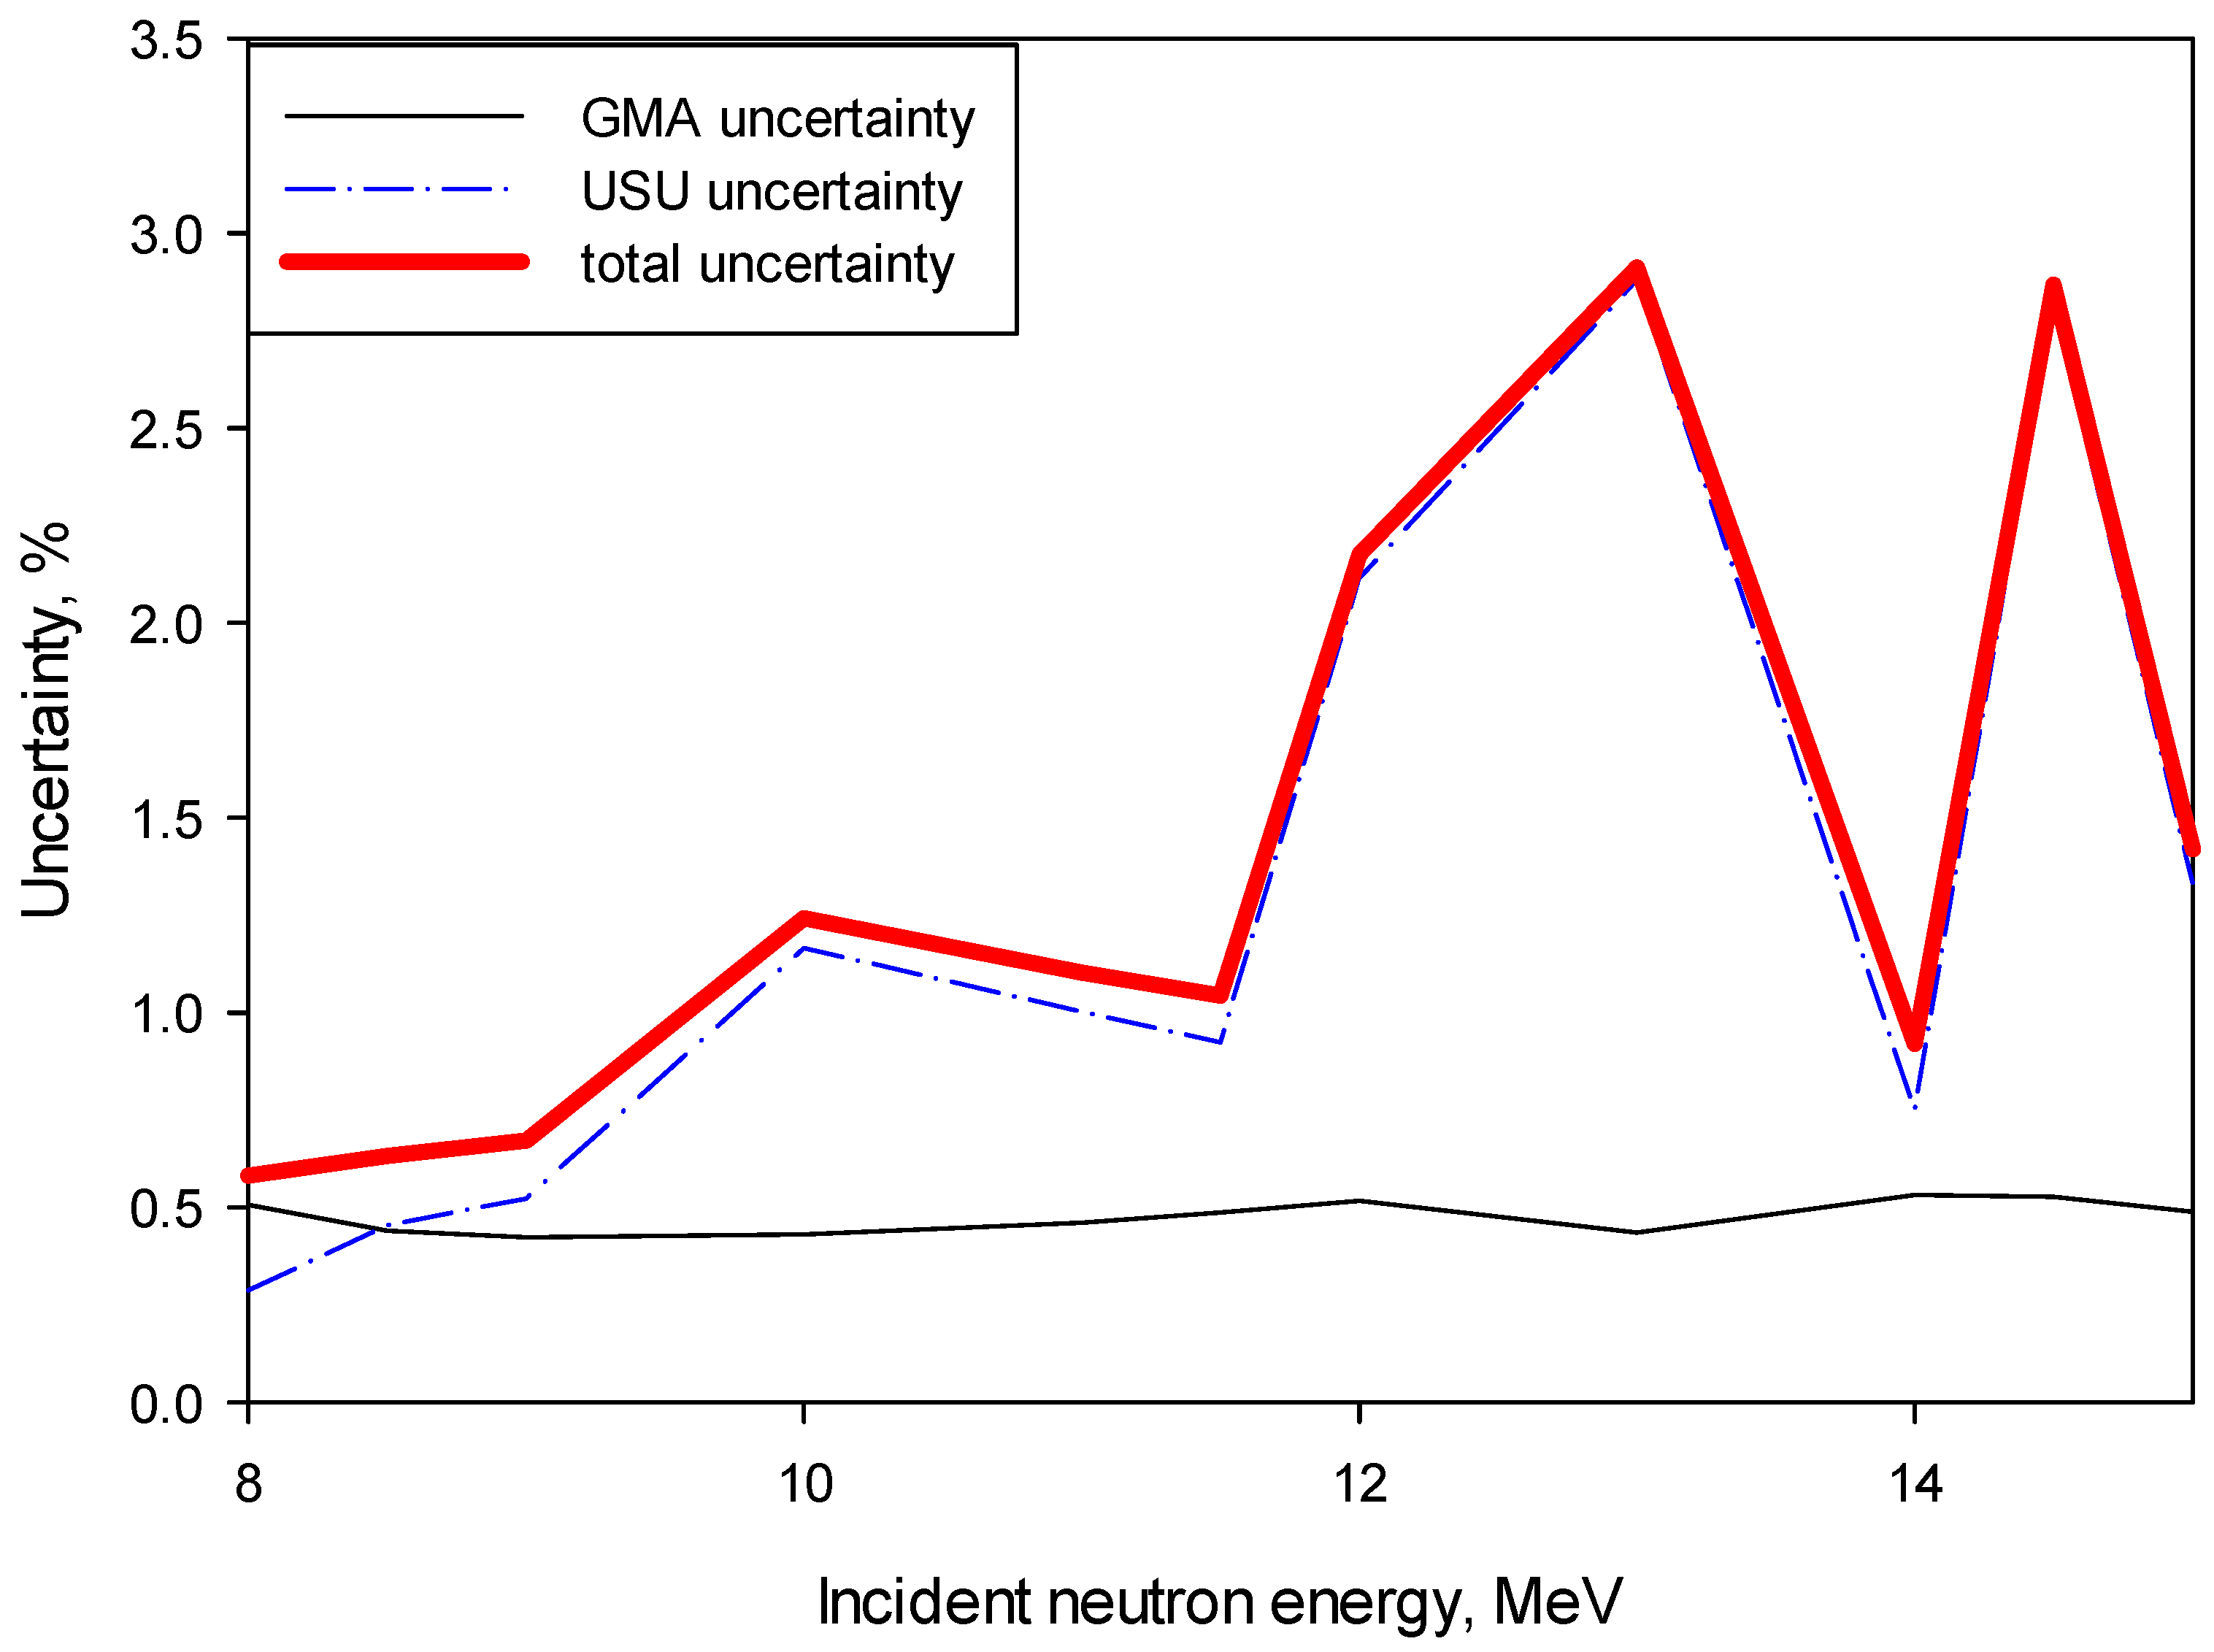
The results shown in
Figure 14 demonstrate an increase in total percent uncertainty of up to 4–5 times in a few nodes where the spread of the data was large. The covariance matrix for the USU component has rather large positive correlations, which shows that most experimental data have normalization problems.


