1. Introduction
The national and international infrastructures that disseminate critical measurement information throughout society are due for renovation. Designed to be operated and supervised by skilled people, there is now a call to digitalize these essentially paper-based systems. The best way to proceed is by no means clear. However, a coordinated international effort will be needed to reap real benefits from digitalization. A recent paper reviewed work performed so far to develop a common digital format for reporting measurement data, which is generically referred to as a “digital calibration certificate” (DCC) [
1]. The DCC will be a fundamental component of digital measurement infrastructures, but many decisions still need to be made about its structure. Among these is how best to represent measurement uncertainty.
The International Committee for Weights and Measures (CIPM), which directs metrological activities carried out by parties to the Metre Convention [
2], recognized the need to coordinate digitalization of the international measurement system and has established a CIPM Task Group on the Digital SI (CIPM-TG-DSI) [
3], supported by a team of experts. In early 2021, this team made a public request for use cases to identify situations where the digitalization of existing metrological infrastructure might improve outcomes or address difficulties. This paper presents a preliminary analysis of one of those use cases.
The study relates to the analysis and linking of international measurement comparisons. Although comparison analysis is a specialized topic, the limitations of current reporting in calibration certificates become clear in this context, and so, the benefits of digitalization are easily recognized. Comparison linking is an interesting case, because correlations in the data can significantly affect the results. Handling the correlations complicates data analysis, especially the evaluation of uncertainty. Our study shows that digitalization can help; it can enhance the information available in the final results while hiding and largely automating the more laborious aspects of processing data. The challenge posed by correlated data arises in many other measurement scenarios as well, so the representation of measurement uncertainty described in this work would offer advantages in other digital systems.
1.1. Measurement Comparisons in the CIPM MRA
The CIPM Mutual Recognition Arrangement (MRA) [
4] is a framework used to establish the equivalence of measurement standards in different economies. Specific calibration and measurement capability (CMC) claims are approved by expert Consultative Committees of the CIPM and then published in a database by the International Bureau of Weights and Measures (BIPM). To maintain or extend CMC entries, national metrology institutes (NMIs) must provide evidence in support of their claims. This evidence is often obtained by participating in international measurement comparisons [
5].
Our case study involves two kinds of comparison: a CIPM key comparison and a subsequent RMO key comparison (organized by a regional metrology organization). In a CIPM comparison, a group of NMIs submit measurements of a particular quantity associated with an artifact. The data are used to determine a comparison reference value, and then, for each participant, a degree of equivalence (DoE) is calculated, which characterizes the difference between the participant’s result and the comparison reference value.
After an initial CIPM comparison has been completed, a number of other RMO comparisons may be carried out. This provides a way to assess the equivalence of NMIs that did not participate in the initial comparison. The results of an RMO comparison must be linked to those of the initial CIPM comparison, which means that several participants from the initial comparison must participate again in the RMO comparison.
A DoE is considered to reflect the level of consistency of one participant’s measurement standard with those of other participants. An uncertainty is evaluated for each DoE, which allows the significance of each result to be assessed: if the magnitude of a DoE is greater than its expanded uncertainty (typically at a 95% level of confidence), then the evidence for equivalence is considered weak. DoEs evaluated during an RMO comparison have equal standing to DoEs obtained from the initial CIPM comparison.
1.2. CCPR Comparison Analysis
Measurement comparisons in the CIPM MRA follow strict rules and are guided by the policies of the Consultative Committee responsible for a particular technical area [
5]. Our case study deals with the photometric quantity regular spectral transmittance, which falls under the Consultative Committee for Photometry and Radiometry (CCPR). A detailed description of the analysis recommended for CCPR comparisons was given in [
6], where expressions for the uncertainty in DoE values were obtained according to the law of the propagation of uncertainty (LPU) [
7]. In practice, these expressions have many terms, which can make data processing quite daunting.
1.3. A Case Study of Comparison Linking
The intention of this case study is to look for possible benefits from digitalization of the reporting and analysis of data. A future scenario is envisaged, where participants submit results in a digital format that contains more information than today’s calibration certificates. This allows data processing to be handled more directly and in a straightforward and intuitive manner. The scenario offers a glimpse into the future where, once the digitalization of the international measurement system is complete, digital reporting (DCCs) will be ubiquitous.
The study applies the methodology prescribed in [
6], but a digital format called an “uncertain number” is used to represent the data [
8]. An uncertain number is a data type that encapsulates information about the measured value of a quantity and the components of uncertainty in that value. Software supporting uncertain numbers greatly simplifies data processing, because calculations simultaneously evaluate the value and the components of uncertainty. Mathematical operations are expressed in terms of a value calculation, but the results include a complete uncertainty budget. Furthermore, uncertain-number results are transferable, which is extremely important in this work. (The
Guide to the expression of uncertainty in measurement (GUM) identifies transferability and internal consistency as the desirable properties of an ideal method of expressing uncertainty ([
7], §0.4). Although we refer here only to transferability for simplicity, uncertain numbers provide both transferability and internal consistency.) An uncertain number obtained as the result of some calculation may be used immediately as an argument in further calculations (exactly as one can do with numerical results). When this happens, the components of uncertainty are rigorously propagated, from one intermediate result to the next, according to the LPU. Transferability in this case study allows the CIPM and RMO comparisons, with linking, to be processed as a single, staged, measurement (the importance of adequately linking the stages of a metrological traceability chain was discussed in [
9,
10]). It is this aspect of digitalization that delivers the benefits we describe below.
A software tool called the GUM Tree Calculator (GTC) that implements the uncertain-number approach was used. GTC is an open-source Python package [
11,
12]. A recent publication described GTC and its design in some detail [
13]. A dataset containing the data and code used in the current study is available [
14]. The snippets of code shown below are extracts from this dataset.
1.4. Digital Records
To create digital records for the participant and pilot measurements in this study, a small subset of data was taken from a CIPM comparison of transmittance and a subsequent RMO comparison [
15,
16]. In
Section 2 and
Section 3, we describe the structure of these comparisons. Participants were required to submit an uncertainty budget for each measurement and to identify the systematic and random influence factors in that budget. The systematic factors are considered constant. For NMIs that participated in both CIPM and RMO comparisons, the systematic factors do not change. They are characterized as components of uncertainty, because the actual values of residual error are not known. The random factors are considered to be unpredictable effects that arise independently in each measurement. The nature of the components of uncertainty—systematic or random—must be known in order to account for correlations in the data.
We used the uncertainty budgets reported by participants to construct digital records for this study. In doing so, some assumptions were made about the data and some of the data were changed to resolve minor inconsistencies, so we do not identify actual participants with these records. The intention here is to present a future scenario where DCC formats have been widely adopted. The assumption was made that these formats are self-contained, with more detailed information than is available in today’s calibration certificates, so there is no longer a need to request additional data for the comparison analysis. Were such a future to become reality, the processes leading to the production of DCCs would not resemble the steps taken here to artificially create the scenario. Therefore, the detail of how digital records were assembled for this study is not discussed.
1.5. Mathematical Notation
Mathematical expressions use the notation adopted in [
6]. Most details are explained when the notation first appears in the text. However, the reader should note that we distinguish between quantities and estimates of quantities with upper and lower case symbols, respectively. For instance, the uncertainty in a value
y, obtained by measuring a quantity
Y, will be expressed as
—the standard uncertainty of
y as an estimate of
Y. When GTC code is used to implement mathematical expressions, uncertain-numbers are associated with quantity terms (upper case terms). The corresponding estimates and uncertainties are the properties of these uncertain-number objects.
2. A CIPM Key Comparison
In the initial CIPM key comparison, there were eleven participants (identified here by the letters A, B, ..., K) and a pilot laboratory (Q). Each participant measured a particular artifact, while the pilot measured all eleven artifacts. The comparison was carried out in five stages: first, the pilot measured the artifacts; second, each participant reported a measurement; third, the pilot measured the artifacts again; fourth, each participant made a second measurement; and fifth, the pilot made one last measurement of all the artifacts (Two participants submitted only the second measurement, so these data were processed with pilot results from only Stages 1 and 3).
Listing 1 displays information about the first measurement by Participant A (Stage 2). The measured transmittance appears at the top, with the combined standard uncertainty in parentheses. Two uncertainty budgets follow: first, the individual components of uncertainty; second, the net systematic and random effects components. Component labeling uses a capital letter to identify the participant (A, B, etc.). If a component of uncertainty contributed only to a specific stage, then a stage number (1, 2, 3, 4, or 5) is appended in parentheses. A colon then precedes the participant’s name for the influence quantity, and finally, the component is classified as random or systematic ((rnd) or (sys)). For example, there are both random and systematic contributions to uncertainty in the wavelength, so Listing 1 includes two terms: A:Wavelength (sys) is a systematic component that contributes to uncertainty at every stage, and A(2):Wavelength (ran) is a random component that contributes at Stage 2 (another independent component A(4):Wavelength (ran) appears in the budget at Stage 4). It is important to understand that the information shown in Listing 1 was all obtained from a single entity representing the measurement result—a single uncertain number. In the scenario we considered, this was submitted by the participant in a digital record.
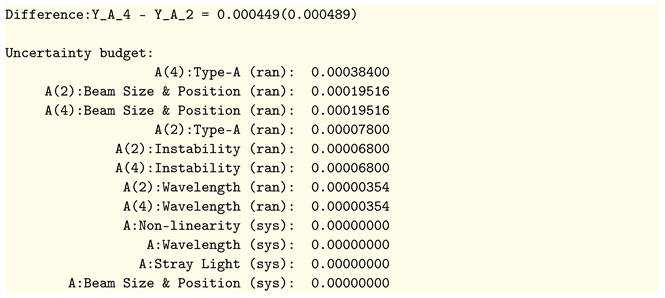
When mathematical operations are applied to uncertain numbers, the components of uncertainty are handled according to the LPU. To illustrate this, we compared the results submitted by Participant A at Stages 2 and 4 by subtracting the corresponding uncertain numbers. With Y_A_2 and Y_A_4 for the results, we display the uncertain-number difference in Listing 2. Notice that the only non-zero terms in the uncertainty budget are now associated with random effects at each stage. The systematic terms from the budget of Listing 1 (the non-linearity, wavelength, stray light, and the beam size and position) contribute nothing to the combined uncertainty in the difference. This is to be expected, because each systematic term contributes a fixed (albeit unknown) amount to the combined measurement error. The influence of these constant terms on the difference is zero. Uncertain-number calculations arrive at the correct result by strictly implementing the LPU. In order to do that, information about all uncertainty components must be encapsulated in the uncertain-number data.
| Listing 1. Data from Participant A for the Stage-2 measurement. The measured value is shown at the top, with the combined standard uncertainty in parentheses. Two uncertainty budgets follow. The first shows the individual components of uncertainty reported by the participant. The second shows total systematic and random components. |
![Metrology 01 00011 i001]() |
| Listing 2. The difference between Participant A’s results at Stage 2 and Stage 4. The difference is shown at the top, with the combined standard uncertainty in parentheses. The uncertainty budget follows. Note that all systematic components are now zero. |
![Metrology 01 00011 i002]() |
2.1. Evaluating DoEs
The calculation of DoEs can be expressed succinctly (in the notation adopted in [
6]). For the pilot, identified by the letter “Q” (and with a superscript “∗” to indicate a CIPM comparison), the DoE,
, is a weighted sum over all participants ([
6], Equation (18)) (the weighting factors
are explained in
Appendix A and the notation
is the mean of measurements of the artifact associated with participant
j):
For any other participant
i, the DoE is ([
6], Equation (19)):
The bar in these expressions indicates the simple weighted mean of a series of measurements for one artifact (
), obtained at different stages:
where:
and
is the standard uncertainty in the value of the
nth result,
, from participant
j. There is only one artifact per participant in this scenario, so
indicates the difference between the mean of participant
j’s measurements and the mean of the pilot’s measurements of the same artifact.
Equation (
1) was implemented in the GTC software, as shown below. This code obtains an uncertain number representing
:
![Metrology 01 00011 i003]()
The function
mean() evaluates the mean of a sequence of uncertain numbers;
r_j.lab and
r_j.pilot contain, respectively, a sequence of results from participant
j and the corresponding sequence of pilot measurements for the same artifact;
kc_results is a container of objects as
r_j for all participants;
w[l_j] represents the weighting factors. Following Equation (
2), a DoE is evaluated for each of the other comparison participants:
![Metrology 01 00011 i004]()
The results, with associated standard uncertainties, may be displayed as:
2.2. DoE Uncertainty Budgets
The DoEs are influenced by factors in the participants’ measurements, with each factor giving rise to one component of uncertainty. Because Equations (
1) and (
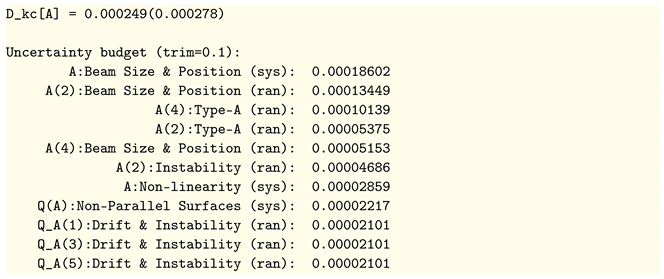
2) combine results from all participants, there is a large number (278) of components in the budget of each DoE in this scenario. Listing 3 shows the DoE for Participant A and an abridged uncertainty budget, in which the more significant components of uncertainty are shown—those with magnitudes greater than 10% of the largest component. These factors can be identified as influences from A’s own measurements and from those of the pilot on the same artifact.
| Listing 3. The DoE for Participant A is shown at the top, with the combined standard uncertainty in parentheses. An abridged uncertainty budget follows. Only the components with a magnitude greater than trim times the largest component are shown. The components are listed in decreasing order of magnitude. |
![Metrology 01 00011 i006]() |
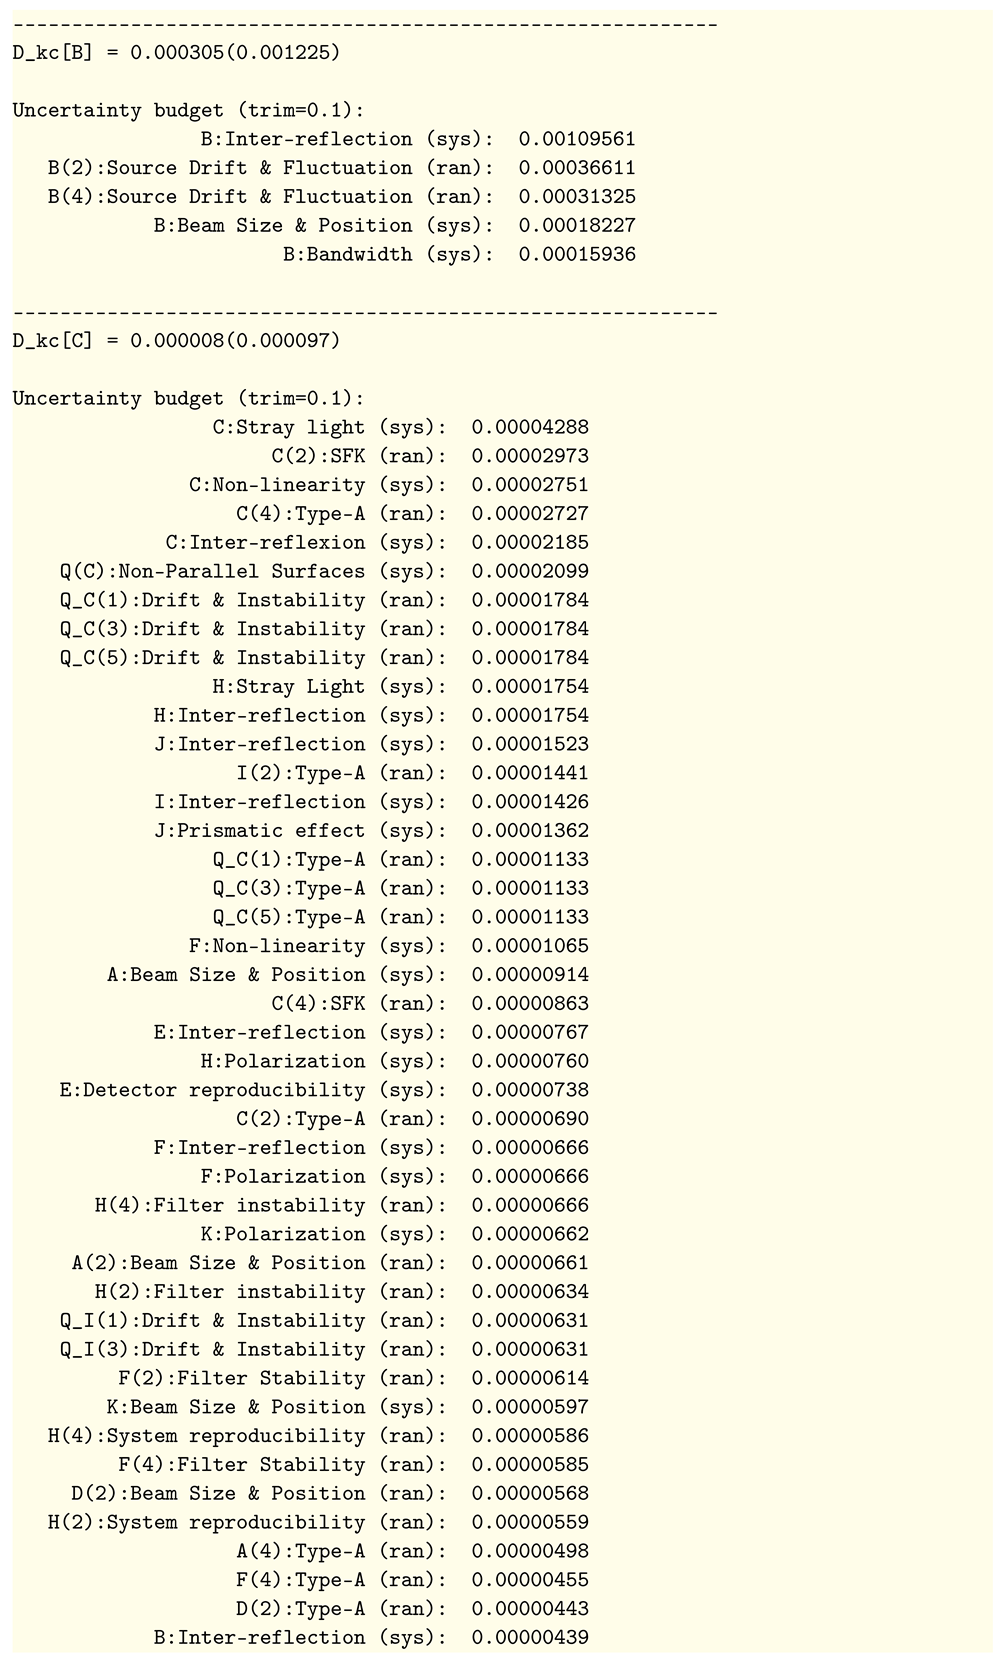
There is quite a diversity of structure in the uncertainty budgets among the different participants. Listing 4 shows the DoEs obtained for Participants B and C. Participant B’s result has a much larger combined standard uncertainty than Participant C, and the uncertainty budget is dominated by factors associated with B’s own measurements. In contrast, the DoE for Participant C has the lowest uncertainty of all participants, and the corresponding uncertainty budget has many more significant influence factors. The largest of these are from C’s own measurements and the corresponding pilot measurements. However, we also see components associated with measurements by Participants A, E, F, H, I, J, and K. These participants were weighted more heavily than B, D, and G during the DoE calculation (see
Appendix A).
| Listing 4. The DoEs for Participants B and C. See the caption to Listing 3 for further details. |
![Metrology 01 00011 i007]() |
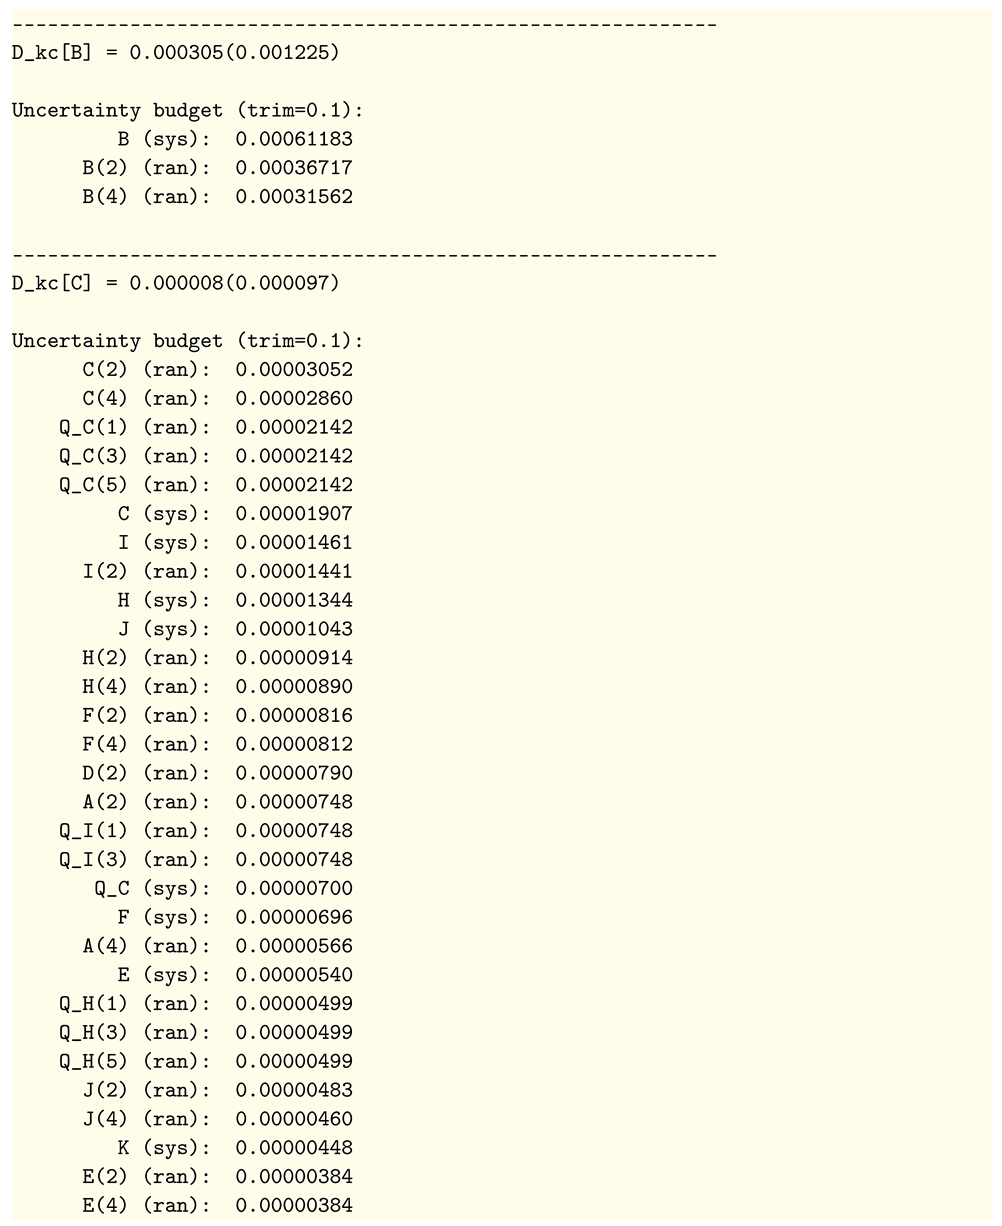
The detail about individual influence factors shown in the listings above is more than the minimum required to analyze and link comparisons. Only the net systematic and random components are needed for that purpose. This is what is used at present, and the reduction in complexity makes the analysis tractable without digitalization. However, the physical origins of influence factors are obscured. For example, Listing 5 shows the budgets of Participants B and C in terms of systematic and random components. Compared to the information shown Listing 4, this offers little insight into the origins beyond participant and stage.
| Listing 5. The DoEs for Participants B and C showing the total systematic and random effects as components of uncertainty. These budgets are equivalent to those in Listing 4; however, only the net random and systematic contributions at each stage are shown. |
![Metrology 01 00011 i008]() |
3. The RMO Key Comparison
Seven NMIs participated in the subsequent RMO key comparison (identified by the letters T, U, V ..., Z) and a pilot laboratory (P). The pilot and Participant Z had both taken part in the initial CIPM comparison, so their results were used to link the two comparisons. The participants each measured a different artifact, and the pilot measured all seven artifacts. The comparison was carried out in three stages: first, the pilot measured the artifacts; second, each participant reported a measurement; third, the pilot measured all the artifacts again.
3.1. Evaluating DoEs
The possibility of slight shifts in the scales of the linking participants since the initial CIPM comparison must be accounted for when linking. Therefore, linking participants provide information on the stability of their scales as part of their report during the RMO comparison. Formally, in the analysis, a quantity that includes a term
representing scale movement is used for the DoE of each linking participant:
can be thought of as a residual error in the scale that contributes to uncertainty in the DoE. To provide a link to the RMO comparison, we then evaluate ([
6], Equation (46)):
where
are the weight factors for linking participants (see
Appendix B). Finally, the DoEs of non-linking participants are ([
6], Equation (45)):
Our data processing uses a Python dictionary to hold the uncertain numbers for each DoE evaluated according to Equation (
5):
![Metrology 01 00011 i009]()
A link to the initial comparison is obtained, following Equation (
4), from:
![Metrology 01 00011 i010]()
where
nu_Z and
nu_P correspond to
and
, respectively, and correspond to Equations (A3) and (A4),
![Metrology 01 00011 i011]()
where
rc_results[’Z’].lab is the sequence of measurements submitted by Participant Z and
rc_results[’Z’].pilot are the corresponding pilot measurements. Following Equation (
3), the uncertain numbers
rc_doe[’Z’] and
rc_doe[’P’] were calculated by adding an uncertain number for the participant’s scale stability to the participant’s DoE obtained in the CIPM comparison (see the dataset for further details [
14]).
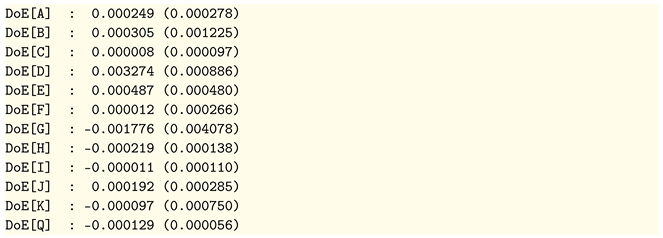
The resulting DoEs, with standard uncertainties in parentheses, are:
3.2. DoE Uncertainty Budgets
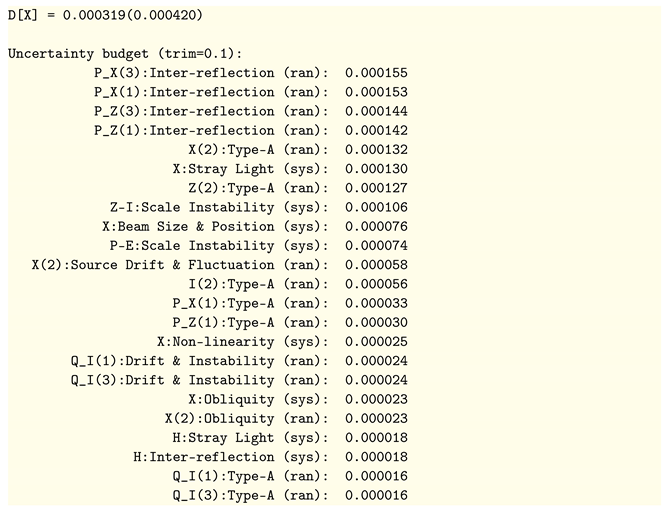
In the linked RMO comparison, the DoEs are each influenced by 302 factors (these factors were identified by participants when submitting their results and, as explained above, the influences from all participants to contribute to the uncertainty). Again, there is diversity in the uncertainty budgets of different participants. For example, the uncertainty budget in Listing 6 shows that the most important components of uncertainty for Participant Y, the participant with the largest DoE uncertainty, are all related to Y’s own measurement.
| Listing 6. The DoE for participant Y with an abridged uncertainty budget. |
![Metrology 01 00011 i013]() |
In contrast, Listing 7 shows the budget for X, the participant with the least DoE uncertainty, which is influenced most by measurements performed by others: the pilot’s measurements of the artifacts used by X and the other linking Participant Z. This budget also includes important components from some factors in the initial comparison.
| Listing 7. The DoE for Participant X with an abridged uncertainty budget. Note that Participant Z in the RMO comparison was I in the initial comparison. The component of uncertainty labeled Z-I:Scale Instability accounts for the stability of Z’s measurement scale. |
![Metrology 01 00011 i014]() |
4. Discussion
This study looked at the use of uncertain numbers as a digital format for reporting measurement data. The context of the study is a specialized area, but the underlying concern is a more general problem: the presence of fixed (systematic) influence factors at different stages of a traceability chain give rise to correlations in data that affect the uncertainty at the end of a chain, but are difficult to account for. Uncertain numbers address this issue and support a simple and intuitive form of data processing. The method is fully compliant with the recommendations in the GUM [
7].
Comparison analysis can be a rather laborious and error-prone task at present, because there is a large amount of data to be manipulated. The task could be greatly simplified if something such as the uncertain-number format were adopted. Digital records could then include information about any common factors that lead to correlations. Algorithms would use that information to streamline the data processing and produce more informative results. This is an interesting possibility in the context of the CIPM MRA, because comparison results are used to support NMI claims of competency (CMCs), which are a matter of considerable importance. Greater transparency in the composition of uncertainty budgets for degrees of equivalence would surely be welcome. For example, the largest components of uncertainty in Listing 7 are associated with influence factors for the pilot measurements, not those of Participant X. This shows that the weight of evidence provided by a DoE and its uncertainty to support a CMC claim may be limited by the performance of the pilot and/or linking participants in the comparisons.
Situations where common factors may give rise to correlations in measurement data are not infrequent, but conventional calibration certificate formats do not allow an accurate evaluation of uncertainty in such cases (as is possible in comparison analysis and comparison linking) [
9,
10]. Our study therefore draws attention to some informal decision, made decades ago, not to report information about influence factors—the uncertainty budget. This decision was surely made for pragmatic reasons, because additional effort would be required to curate uncertainty budget data in paper-based systems. However, the policy should be reviewed now as part of the digital transformation process. The currently favored DCC formats only report uncertainty intervals or expanded uncertainties [
17]. If these formats are ultimately adopted, DCCs will not contain enough information about common influences upstream to handle correlations in downstream data: the scenario envisaged in this article would not be realized.
4.1. Metrological Traceability
Metrological traceability is realized by forming a chain of calibrations that link primary realizations of the SI units to an end user of measurement data. At each stage, influence factors cause the result obtained to differ slightly from the actual quantity of interest. At present, this is usually accounted for by a single uncertainty statement in the stage report. However, influence factors at one stage can give rise to correlations at later stages, and accounting for these effects requires influences to be tracked along the chain [
9,
10]. That is why the notion of transferability, referred to in the Introduction and the GUM, is important, and comparison analysis highlights this by requiring substantial additional information from all participants, which complements the information in calibration certificates. The study showed that transferability, and hence better support for traceability, is provided by the uncertain number format. In more general terms, the approach to digitalization can keep track of influences and hence identify the
provenance of contributions to uncertainty in a result.
4.2. Measurement Comparisons in Other Fields
This case study considered CCPR comparisons, but in other areas, comparisons may have different general characteristics. For instance, degrees of freedom are usually high in CCPR comparisons and can be ignored; however, in some other areas, they need to be taken into consideration. For instance, in a CIPM key comparison of polychlorinated biphenyl (PCB) congeners in sediment [
18], some participants reported very low degrees of freedom (as low as two). The uncertain number format used in GTC also handles degrees of freedom.
The CCPR requires participants in CIPM comparisons to realize their scales independently. Therefore, the results of participants in the initial comparison were not correlated. However, in other areas, the assumption of independence at the CIPM level may not hold. In comparisons involving mass, for example, the lack of independence among participants’ scales has to be considered [
19]. In the future, if digital reporting were to adopt something equivalent to the uncertain number format, the necessary information about shared influences would be accessible in DCCs. This would once again simplify data analysis and deliver more informative results.
4.3. Unique Identifiers and Digital Records
Details about the digital storage format used by GTC are outlined in [
13]. The role of unique identifiers associated with influence quantities is of interest.
Uncertain-number algorithms must keep track of the identity of all the influence factors, which is analogous to the need for adequate notation in mathematical expressions. In the GUM, a general measurement function is represented as:
where
Y is the quantity intended to be measured and
are the quantities that influence the measurement. In the GUM notation for a component of uncertainty,
is understood to be the component of uncertainty in
y, as an estimate of
Y, due to the uncertainty in an estimate,
, of the influence quantity
. Therefore, the subscript
i may take the value of any of the
X’s subscripts in Equation (
6). Uncertain-number software and digital records must somehow keep track of all the
i’s as well. This is more complicated than it first appears, because measurements are carried out in stages that occur in different locations and at different times.
GTC uses a standard algorithm to produce universally unique 128 bit integers, which it uses to form unique digital identifiers [
13]. The format is simple, and the identifier reveals nothing about influence. Would a more sophisticated type of identifier be appropriate [
20]? For the purposes of data processing alone, there is no need to complicate matters: the only requirement is uniqueness. However, GTC does allow text labels to be associated with identifiers (used as influence quantity labels in uncertainty budgets), and a planned enhancement to GTC will allow unique identifiers to index a manifest of information about each influence quantity. A manifest could accompany the digital record of uncertain-number data, which would address needs for metadata about influence quantities without the burden of minting and configuring digital objects that give access to information on the Internet.
4.4. Comparison Analysis by Generalized Least Squares
The analysis equations used in this work take a fairly straightforward mathematical form. However, we have alluded to the complexity, due to the large number of terms, in handling the associated uncertainty calculations, and in [
6], we suggested that a more practical analysis tool is generalized least squares (GLS). GLS is a more opaque “black box” method, but software packages are available to perform the linear algebra once the required matrices have been prepared (see [
6], §4).
It is interesting to note that, in order to link an RMO comparison, GLS has been used to simultaneously process CIPM comparison data and RMO comparison data [
19]. This is another example of comparison analysis compensating for the lack of transferability in standard reporting formats.
A GLS algorithm could also be applied to uncertain-number data, in which case results such as those described here would be obtained. In the formulation of the GLS calculation (Equation (69) of [
6], §4, repeated here; note that bold Roman type is used to represent matrices):
the elements of the design matrix,
, are pure numbers, as are the elements of the covariance matrix,
, so conventional numerical routines can be used to evaluate the matrix:
Then, with uncertain-number elements in the vector of participant results,
, and in the vector of linking participant DoEs,
, the final calculation of degrees of equivalence:
obtains the vector of linking participant DoEs,
, as a linear combination of uncertain numbers. The results would, as in this work, reflect the influence of all terms contributing to participants’ measurements. This would be much more informative than the information available from the covariance matrix usually obtained as an additional calculation in GLS analysis.
5. Conclusions
This case study of comparison analysis and linking has identified benefits in a particular approach to digitalization using a digital format called an uncertain number. Because comparison participants must provide more information than is available in standard calibration certificates, the context of the study highlights deficiencies in current reporting formats. These deficiencies can be summarized as a lack of support for transferability and internal consistency in the expression of uncertainty. However, if the uncertain-number format were widely adopted, as was assumed in this case study, transferability and internal consistency would be achieved.
The study shows that more rigorous uncertainty calculations are enabled by uncertain numbers. Algorithms for data processing can be expressed in a more intuitive and streamlined manner, and it is no longer necessary to formulate separate calculations for measurement uncertainty. Because the approach keeps track of all influences, it can deliver more accurate uncertainty statements. Uncertain numbers would be advantageous to a wider range of measurement problems than just international comparisons. Adopting the format for DCCs could therefore enhance the quality of new digital infrastructures.

 The function mean() evaluates the mean of a sequence of uncertain numbers; r_j.lab and r_j.pilot contain, respectively, a sequence of results from participant j and the corresponding sequence of pilot measurements for the same artifact; kc_results is a container of objects as r_j for all participants; w[l_j] represents the weighting factors. Following Equation (2), a DoE is evaluated for each of the other comparison participants:
 The results, with associated standard uncertainties, may be displayed as:
 A link to the initial comparison is obtained, following Equation (4), from:
 where nu_Z and nu_P correspond to and , respectively, and correspond to Equations (A3) and (A4),
 where rc_results[’Z’].lab is the sequence of measurements submitted by Participant Z and rc_results[’Z’].pilot are the corresponding pilot measurements. Following Equation (3), the uncertain numbers rc_doe[’Z’] and rc_doe[’P’] were calculated by adding an uncertain number for the participant’s scale stability to the participant’s DoE obtained in the CIPM comparison (see the dataset for further details [14]).

