1. Introduction
Stroke remains among the leading causes of death and disability worldwide and requires rapid recognition, neuroimaging, and timely access to reperfusion therapies and specialized units [
1,
2]. Disruptions at any stage of this pathway may alter both admission volume and the profile of patients who ultimately reach hospital care.
COVID-19 introduced two potentially relevant sets of processes. SARS-CoV-2 infection has been associated with endothelial dysfunction, vascular inflammation, platelet activation, hypercoagulability, and thrombotic events [
3,
4,
5,
6,
7,
8,
9,
10]. At the same time, physical distancing, fear of hospital-acquired infection, service reorganization, and pressure on emergency networks altered care-seeking and access [
11,
12,
13,
14,
15,
16,
17,
18,
19,
20]. These mechanisms cannot be identified individually in aggregate administrative data but provide epidemiological context for interpreting changes in hospitalizations.
Studies during the pandemic frequently reported reductions in stroke admissions, particularly for mild or transient events. In Joinville, Brazil, stroke admissions decreased by 36.4% after the onset of restrictions, without a similar reduction in severe or hemorrhagic stroke [
21]. In São Paulo, a previous SIH-SUS study identified decreases from January through June 2020 across cerebrovascular categories [
13]. An international systematic review found reduced admissions in 84% of included studies [
19]. However, results were not uniform: a nationwide Danish analysis found broadly unchanged hospitalization rates during much of the pandemic [
22]. This heterogeneity reinforces the need to model pre-existing trends, seasonality, and count distributions rather than attributing crude differences directly to the pandemic.
This study aimed to evaluate category-specific temporal changes in Brazilian Unified Health System (Sistema Único de Saúde; SUS)-financed cerebrovascular hospitalizations in the municipality of São Paulo from 2017 through 2021. The analytical hypothesis was that the magnitude of the level and/or trend change after pandemic onset would differ among I60–I62, I63, I64, and I65–I69. The term “redistribution” is not used as a causal conclusion because compositional changes do not demonstrate transfer of individual patients between diagnostic codes.
2. Materials and Methods
2.1. Study Design and Setting
We conducted an ecological time-series study and reported it according to STROBE principles and, because SIH-SUS is a routinely collected administrative health database, the RECORD extension [
23,
24]. The temporal unit was the month, and the setting was the municipality of São Paulo from January 2017 through December 2021, yielding 60 months per diagnostic category. No sample-size calculation was performed because all available monthly observations in the prespecified period were included for all four categories.
2.2. Data Source and Reproducible Extraction
Hospitalizations were obtained from the Brazilian Unified Health System Hospital Information System (SIH-SUS), available through DATASUS/TABNET under “Morbidade Hospitalar do SUS—por local de internação—São Paulo” [
25]. The query used municipality 355030 São Paulo; Chapter IX—Diseases of the circulatory system; content “Hospitalizations”; temporal dimension “month of admission”; January 2017 through December 2021; and the ICD-10 morbidity-list categories corresponding to the four study groups. Monthly re-extraction was completed in August 2026, and the original CSV files were retained for audit and reproducibility.
Each monthly file was independently read to identify month of admission, diagnostic category, municipality, and hospitalization count. Identical duplicate files were removed. The final analytical dataset contained 240 unique month-by-category combinations (60 months × 4 categories) and is provided as
Supplementary File S1. After monthly aggregation, sums were verified against the corresponding annual totals before modeling. No months were missing.
2.3. Diagnostic Categories and Population Denominators
We included nontraumatic intracranial hemorrhage (I60–I62), cerebral infarction (I63), stroke not specified as hemorrhage or infarction (I64), and other cerebrovascular diseases (I65–I69). The data represent SUS-financed hospitalizations and not all admissions occurring in the municipality. Official IBGE population estimates were 12,106,920 (2017), 12,176,866 (2018), 12,252,023 (2019), 12,325,232 (2020), and 12,396,372 (2021); these were used to calculate rates per 100,000 inhabitants and as the log(population) offset [
26].
2.4. Study Size and Missing Data
Study size was determined by the prespecified observation interval and the complete inclusion of available aggregate SIH-SUS observations, without sampling. Sixty months were analyzed for each of four diagnostic categories, totaling 240 monthly observations. No months were missing; therefore, no imputation was performed.
2.5. Temporal Definition
The primary analysis defined March 2020 as the interruption point, corresponding to the establishment of community transmission and early healthcare reorganization. Because this disruption was neither instantaneous nor uniform, sensitivity analyses used January and April 2020 as alternative interruption dates. An additional exploratory analysis considered prespecified epidemic periods: March–September 2020, October 2020–February 2021, and March–December 2021.
2.6. Statistical Analysis
All statistical analyses were performed from the monthly CSV files comprising the analytical dataset. The reproducible analysis code used for the statistical and segmented regression analyses is provided as
Supplementary File S2. Descriptive percentage change was calculated as [(mean annual count in 2020–2021 − mean annual count in 2017–2019)/mean annual count in 2017–2019] × 100.
For each category, a Poisson model was first fitted with continuous time, a post-intervention indicator, time after intervention, and one pair of annual harmonic terms (sine and cosine; 12-month period). Overdispersion was assessed using the Pearson chi-square/degrees-of-freedom ratio and its corresponding test. Because all categories showed significant overdispersion and negative-binomial models had lower AIC values in every case, negative-binomial regression was selected as the primary model. The segmented-regression specification followed established interrupted time-series principles, including explicit estimation of pre-interruption trend, immediate level change, post-interruption trend change, seasonality, and residual temporal dependence [
27].
Segmented negative-binomial regression was specified as log(E[Yt]) = β0 + β1·time + β2·post + β3·time_post + β4·sin(2πt/12) + β5·cos(2πt/12) + log(population). Exp(β2) represents the incidence rate ratio (IRR) for the immediate level change, whereas exp(β3) represents the monthly multiplicative change in slope. IRRs, 95% confidence intervals, and p values were reported. A pooled model included diagnostic-category × time, diagnostic-category × post, and diagnostic-category × time_post interactions to formally test heterogeneity.
Seasonality was jointly tested using the annual harmonic pair. Residual autocorrelation was examined using the autocorrelation function and the Ljung–Box test at 12 lags. Influence was assessed using leave-one-month-out analyses, refitting the model after excluding each individual month. Sensitivity analyses varied the intervention date and explored epidemic periods. Tests were two-sided with α = 0.05. Interpretation explicitly distinguished description, temporal association, population-level inference, and causality.
2.7. Potential Sources of Bias
Potential classification and measurement biases related to the administrative nature of SIH-SUS were considered, including changes in primary-diagnosis coding, neuroimaging availability, admission criteria, referral pathways, and relative use of public and private sectors. These factors could not be directly measured in the aggregate dataset and were therefore treated as sources of uncertainty and interpretive limitations rather than demonstrated mechanisms. Prespecified ICD-10 groups, a constant geographic definition, and the same extraction strategy throughout the study period were used to reduce classification inconsistency.
3. Results
3.1. Data Consistency and Descriptive Results
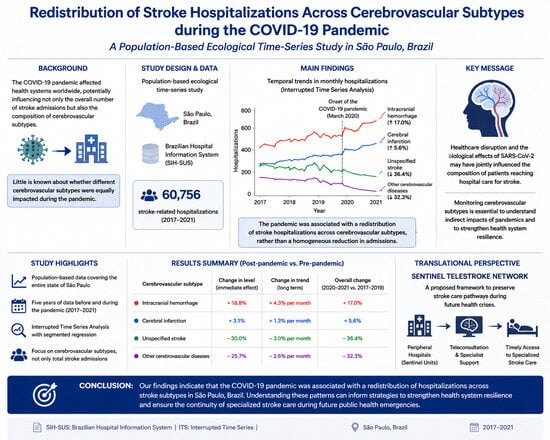
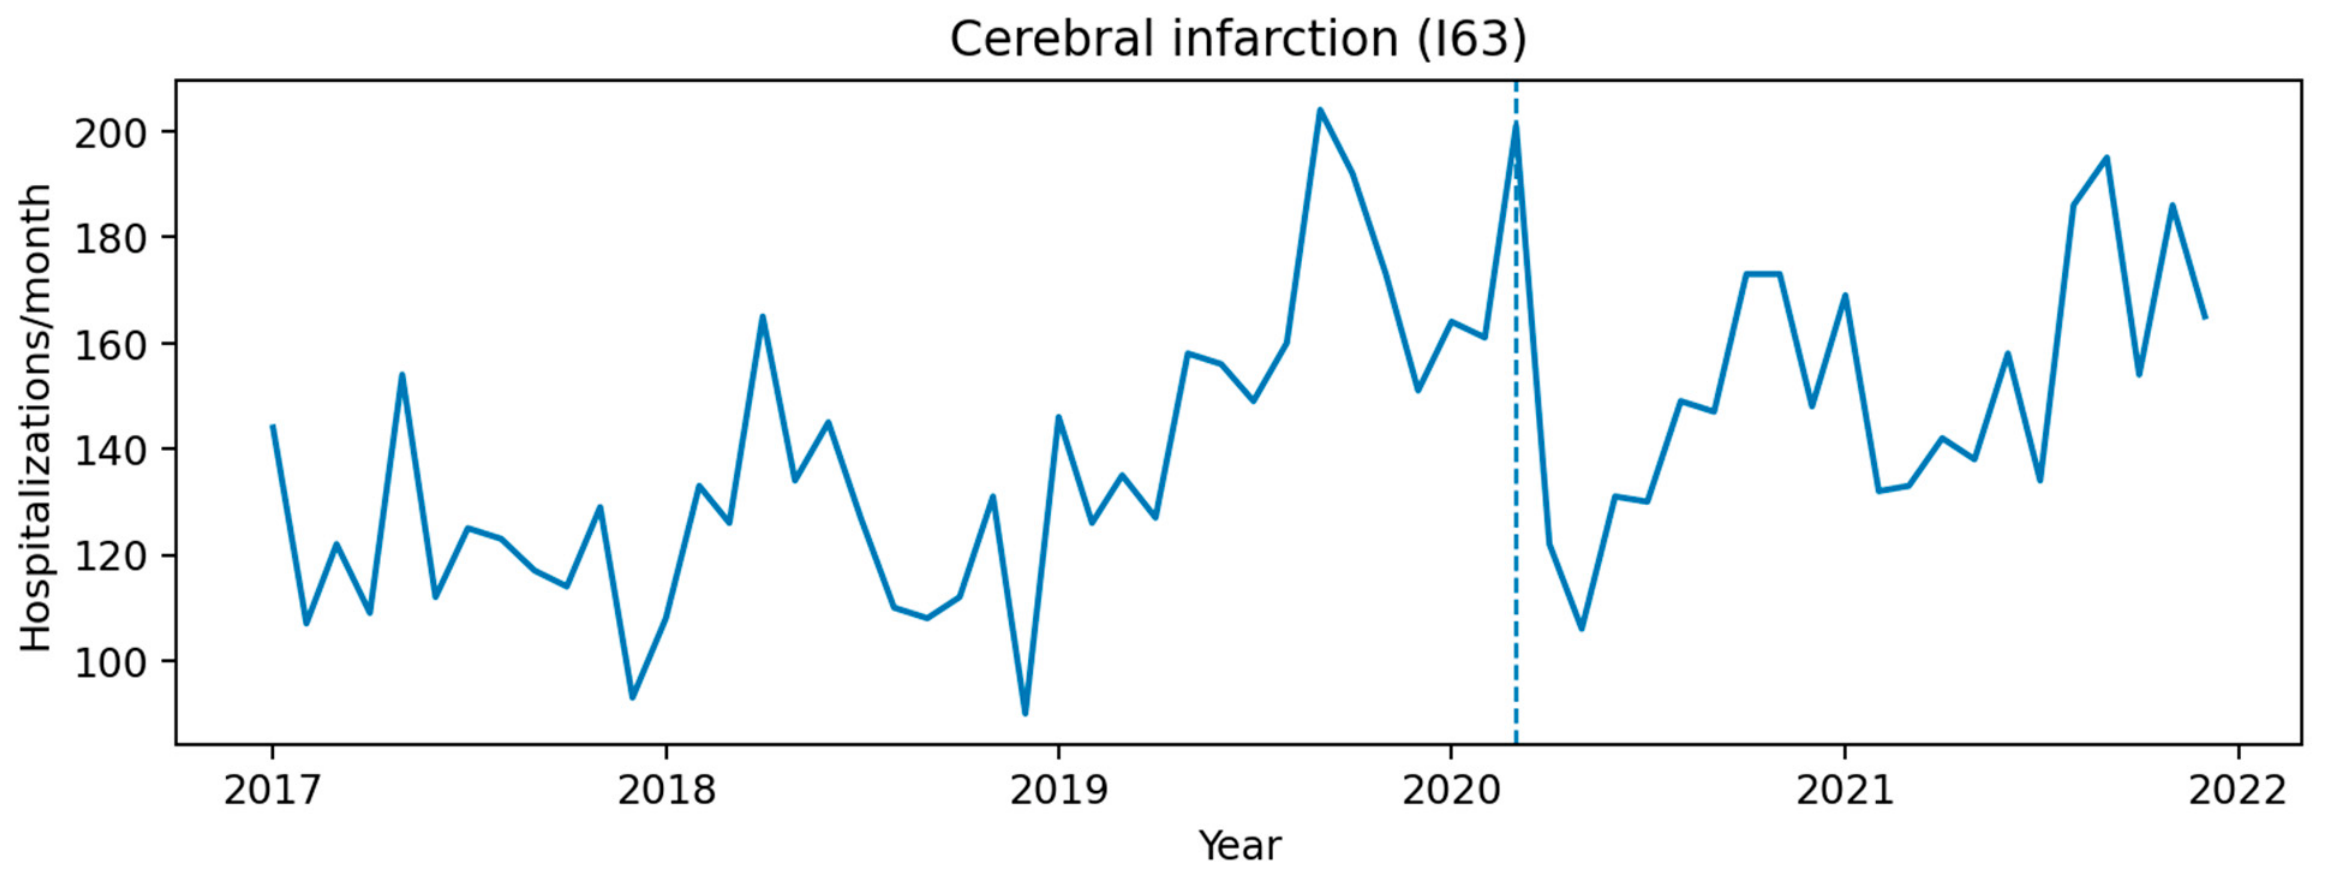
The analytical dataset included 60,756 hospitalizations, and aggregation of the monthly observations corresponded to the 20 annual totals presented in
Table 1. Annual counts and hospitalization rates per 100,000 inhabitants by cerebrovascular diagnostic category, 2017–2021. No conflicting month-by-category combinations remained after deduplication.
Table 1 presents annual counts and rates per 100,000 inhabitants.
Descriptive differences between mean annual counts in 2017–2019 and 2020–2021 were +3.7% for intracranial hemorrhage, +15.2% for cerebral infarction, −16.2% for unspecified stroke, and −27.2% for other cerebrovascular diseases.
The descriptive comparison of mean annual hospitalization counts between 2017–2019 and 2020–2021 is summarized in
Table 2.
3.2. Poisson Versus Negative-Binomial Models and Model Diagnostics
Poisson models showed significant overdispersion in every category: 2.16 for intracranial hemorrhage (p < 0.001), 3.52 for cerebral infarction (p < 0.001), 5.05 for unspecified stroke (p < 0.001), and 2.18 for other cerebrovascular diseases (p < 0.001). AIC was lower for the negative-binomial model in every category, supporting its selection as the primary model.
Model-comparison and diagnostic results are summarized in
Table 3.
Harmonic seasonality was statistically detectable only for I64 (p = 0.013), but the terms were retained in all models for consistency and temporal plausibility. After adjustment, none of the Ljung–Box tests at 12 lags was significant (p = 0.388–0.670), providing no evidence of important residual autocorrelation.
3.3. Segmented Regression/Interrupted Time Series
The primary segmented negative-binomial regression estimates are presented in
Table 4.
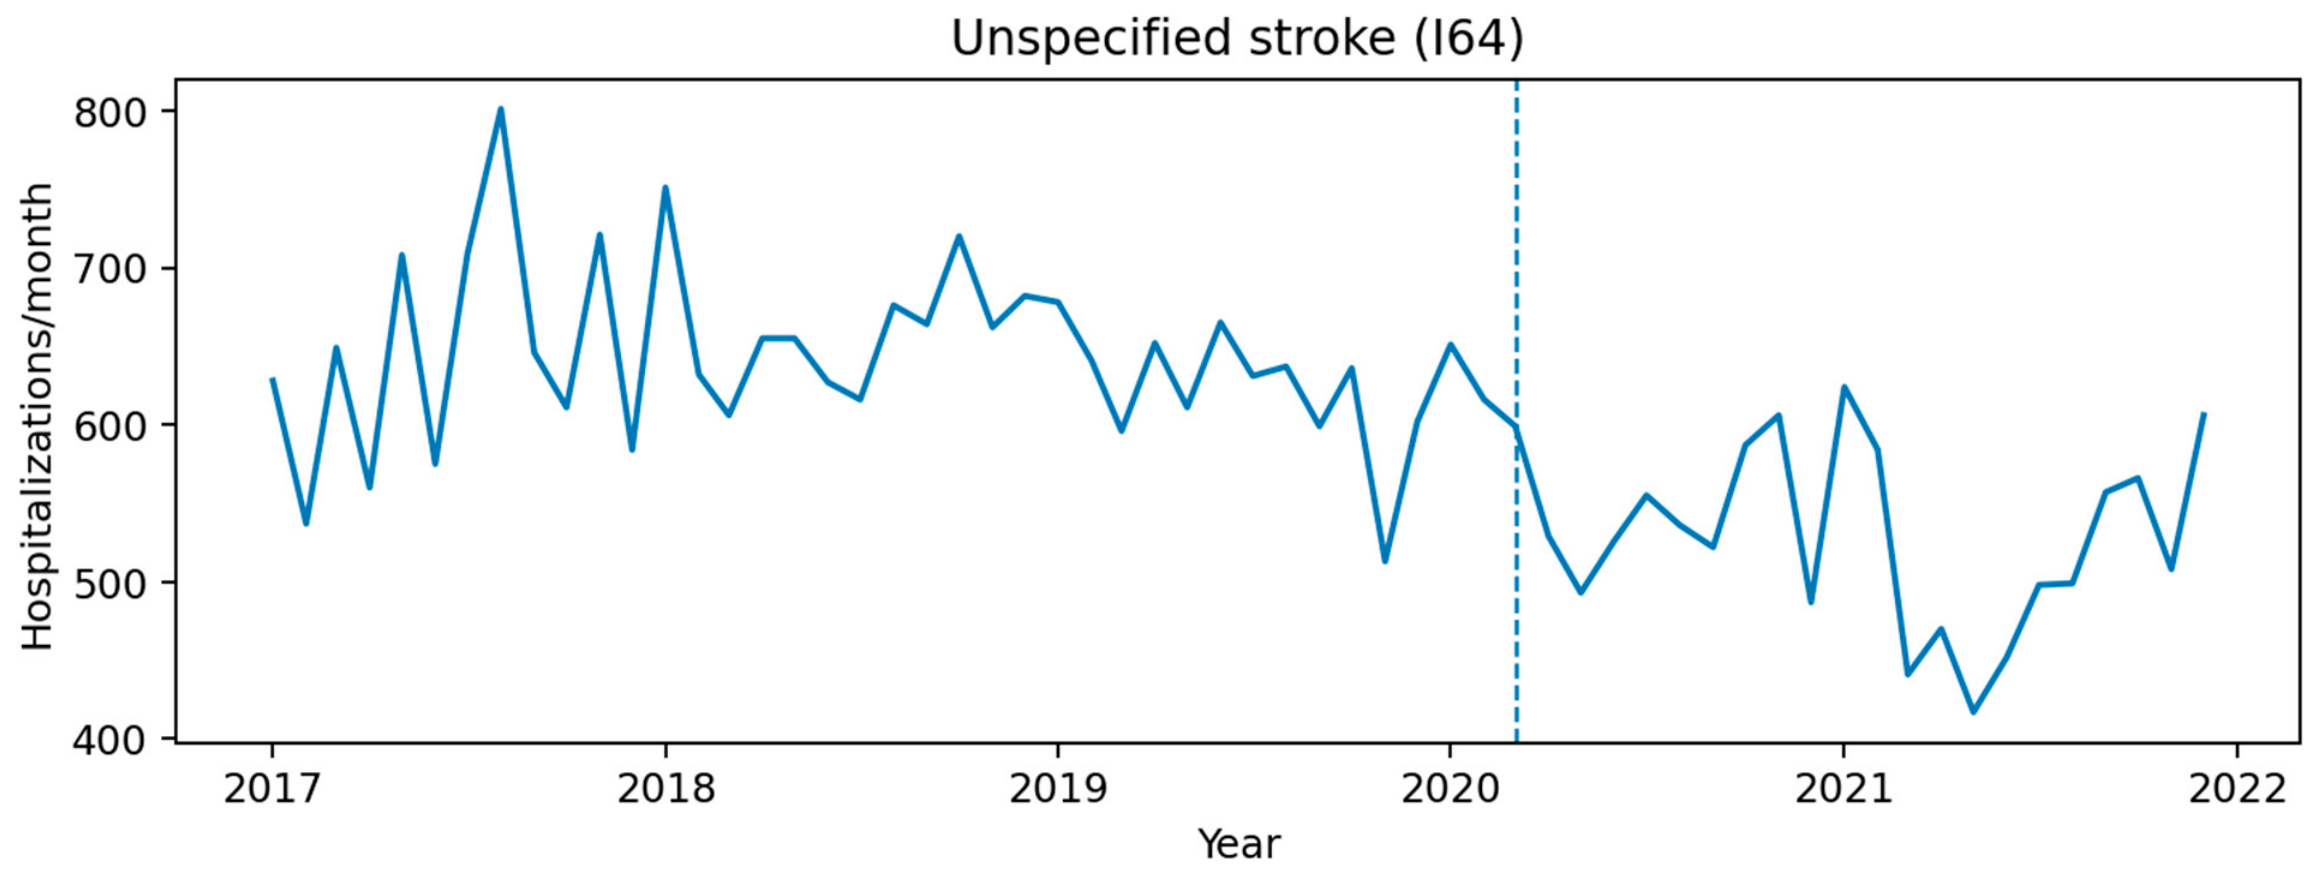
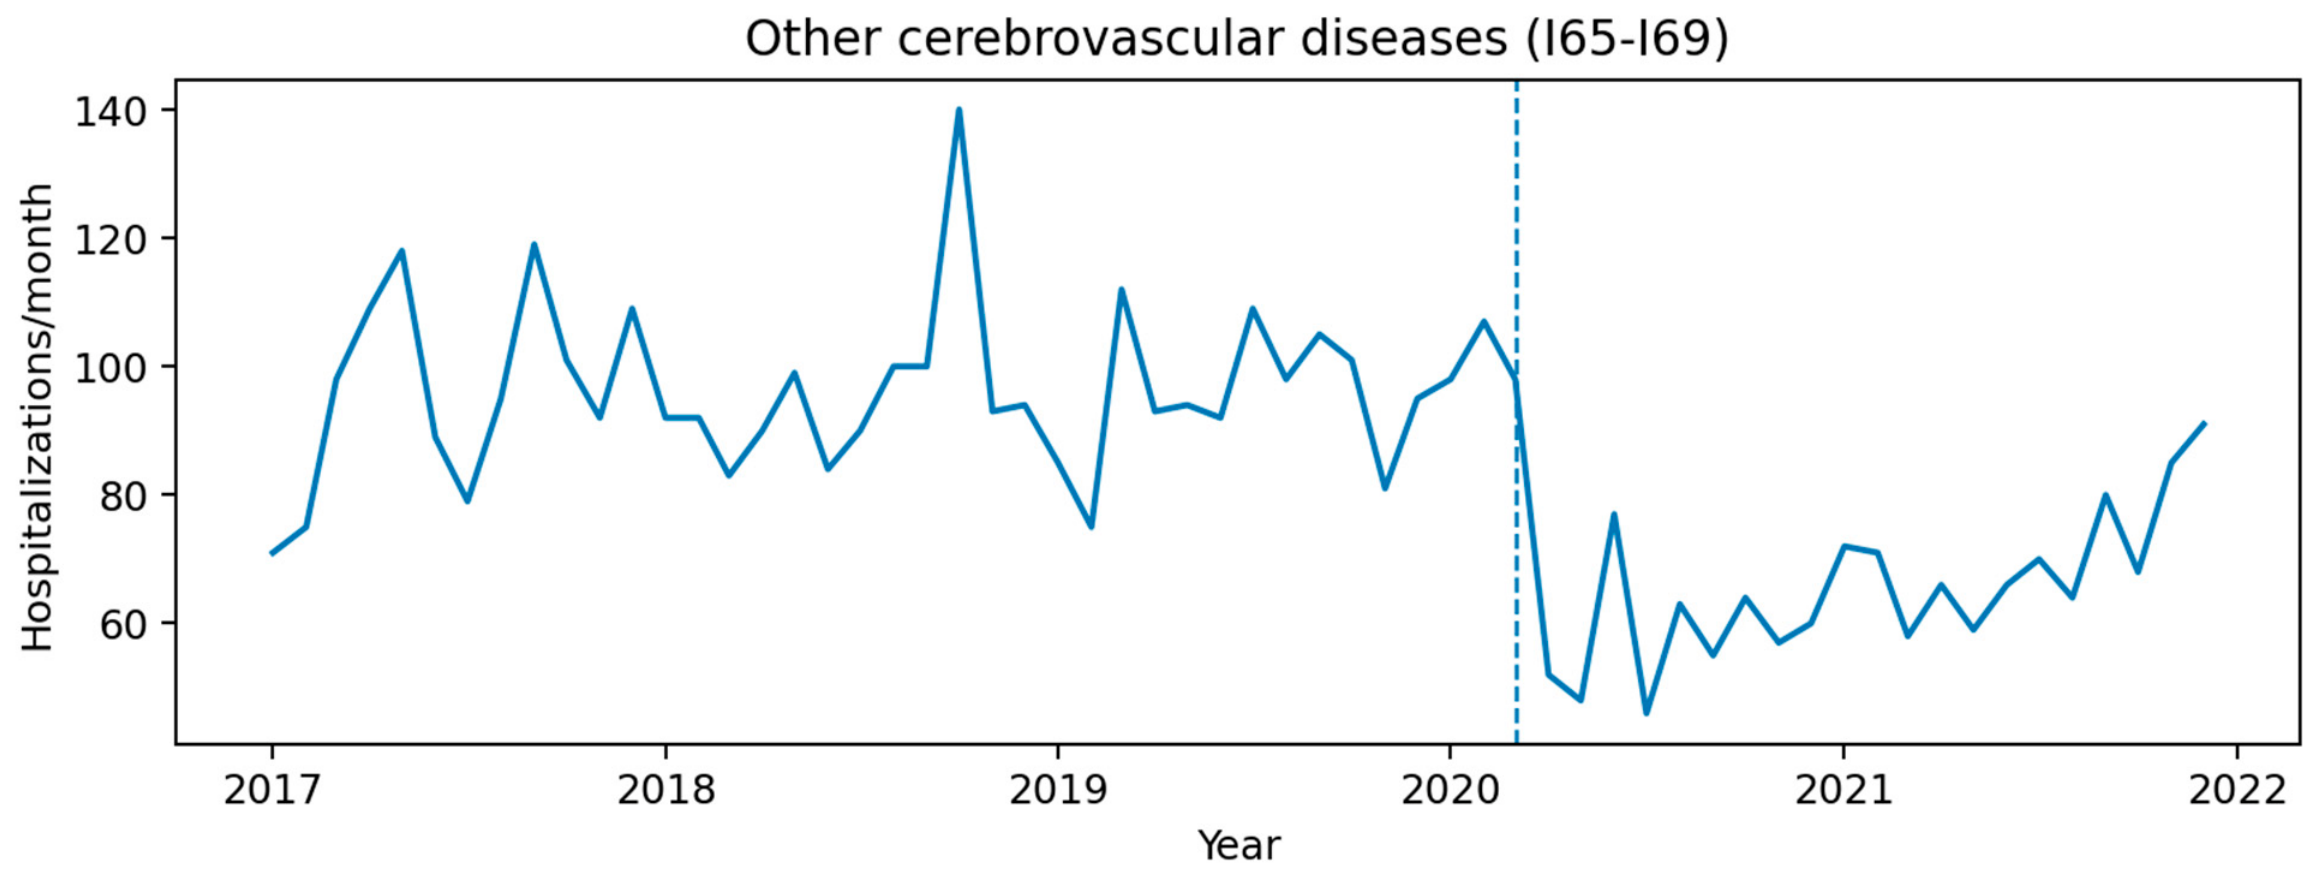
In March 2020, the estimated immediate decrease was 39.3% for I65–I69 and 10.0% for I64. I60–I62 showed no significant immediate change; for I63 the estimated reduction was 13.2%, but the 95% CI included 1 (p = 0.086). No category showed a significant post-intervention slope change in the primary model. Before the pandemic, I63 had a significant increasing monthly trend (IRR 1.009; p < 0.001), whereas the other pre-pandemic trends did not reach conventional significance.
In the pooled model, the diagnostic-category × level-change interaction was significant (Wald χ2 = 13.21; 3 df; p = 0.004), formally demonstrating that the immediate response was not uniform across categories. The diagnostic-category × slope-change interaction was not significant (p = 0.503). Thus, the data support heterogeneous temporal change but do not demonstrate “redistribution” as individual diagnostic migration.
3.4. Sensitivity and Influence Analyses
The intervention date mainly affected the magnitude of the initial change. For I65–I69, the level change remained significant using January (IRR 0.741; p = 0.002), March (IRR 0.607; p < 0.001), and April 2020 (IRR 0.533; p < 0.001). For I64, the decrease was not significant in January (IRR 0.947; p = 0.270) but was significant in March (IRR 0.900; p = 0.032) and April (IRR 0.876; p = 0.007). I60–I62 remained without a significant level change across all dates. I63 showed a significant decrease only when April was used as the interruption point (IRR 0.765; p < 0.001), consistent with an acute shock around the beginning of restrictions rather than a uniform sustained decrease.
In leave-one-month-out analyses, level-change estimates remained within narrow ranges: I60–I62, 0.973–1.046; I63, 0.784–0.901; I64, 0.877–0.915; and I65–I69, 0.526–0.630. The direction of the I64 and I65–I69 estimates was stable after removal of any single month, reducing the likelihood that the main finding depended on one extreme observation.
Exploratory epidemic-period analyses showed decreases in I65–I69 during the first period (IRR 0.639; 95% CI 0.541–0.754) and second period (IRR 0.638; 95% CI 0.527–0.772). For I63, the first period showed a decrease (IRR 0.838; 95% CI 0.715–0.983). These estimates are sensitivity analyses and not evidence of variant effects or transmission intensity because the dataset contains no individual SARS-CoV-2 infection status.
3.5. Monthly Time Series
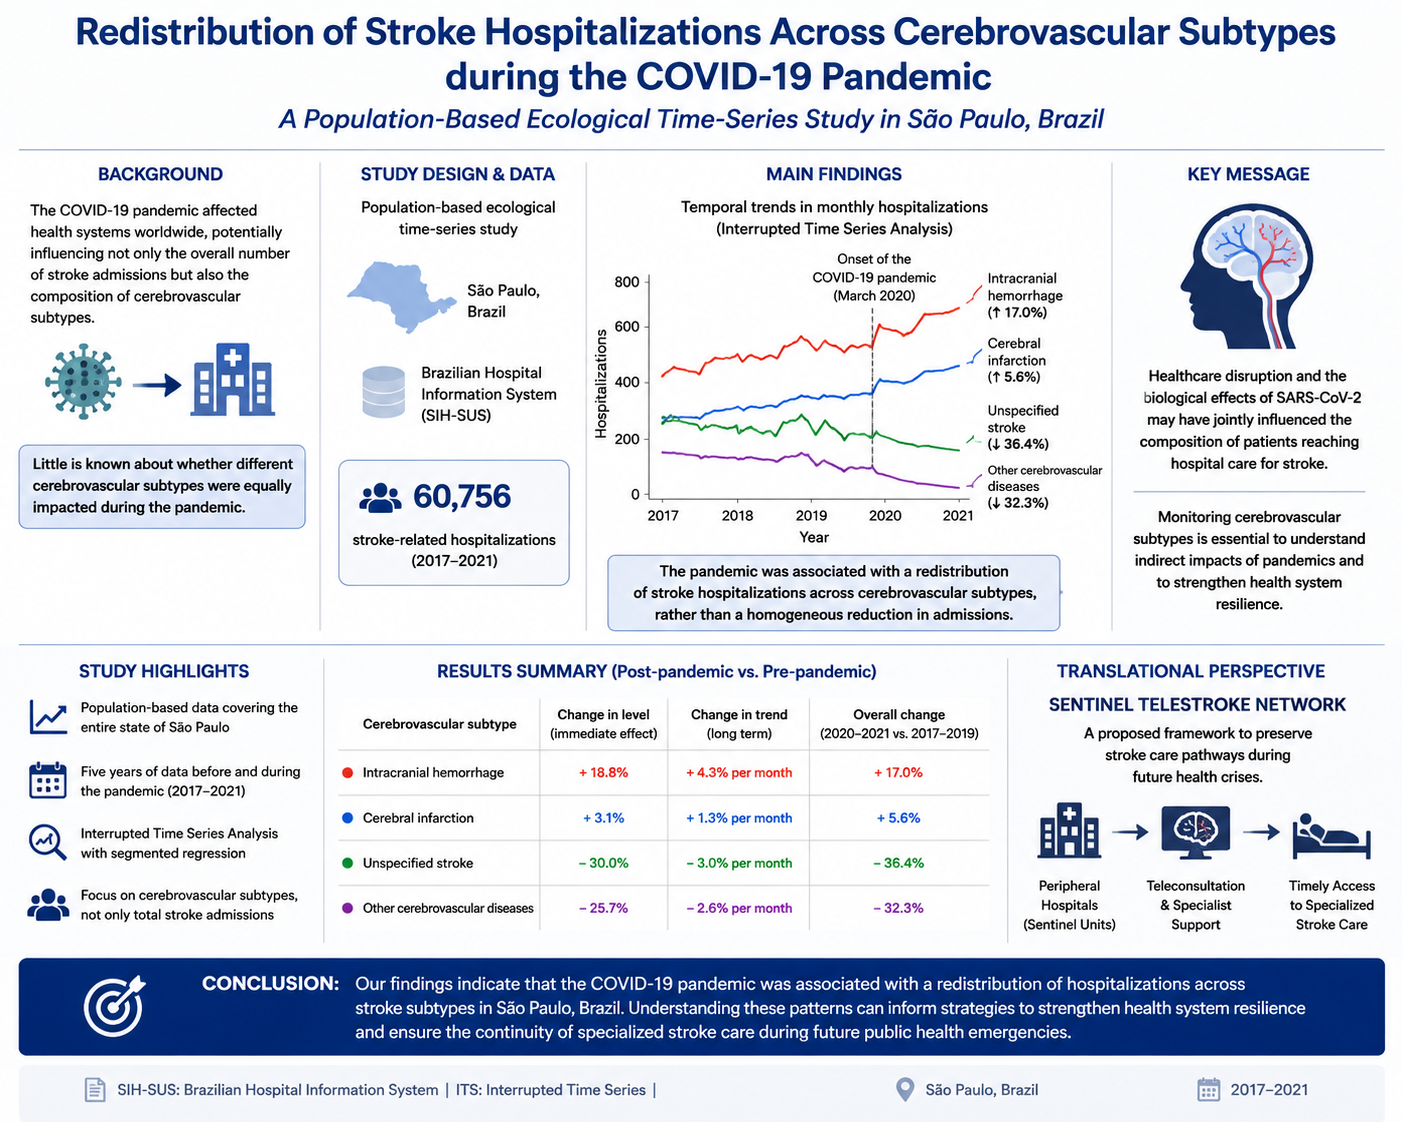
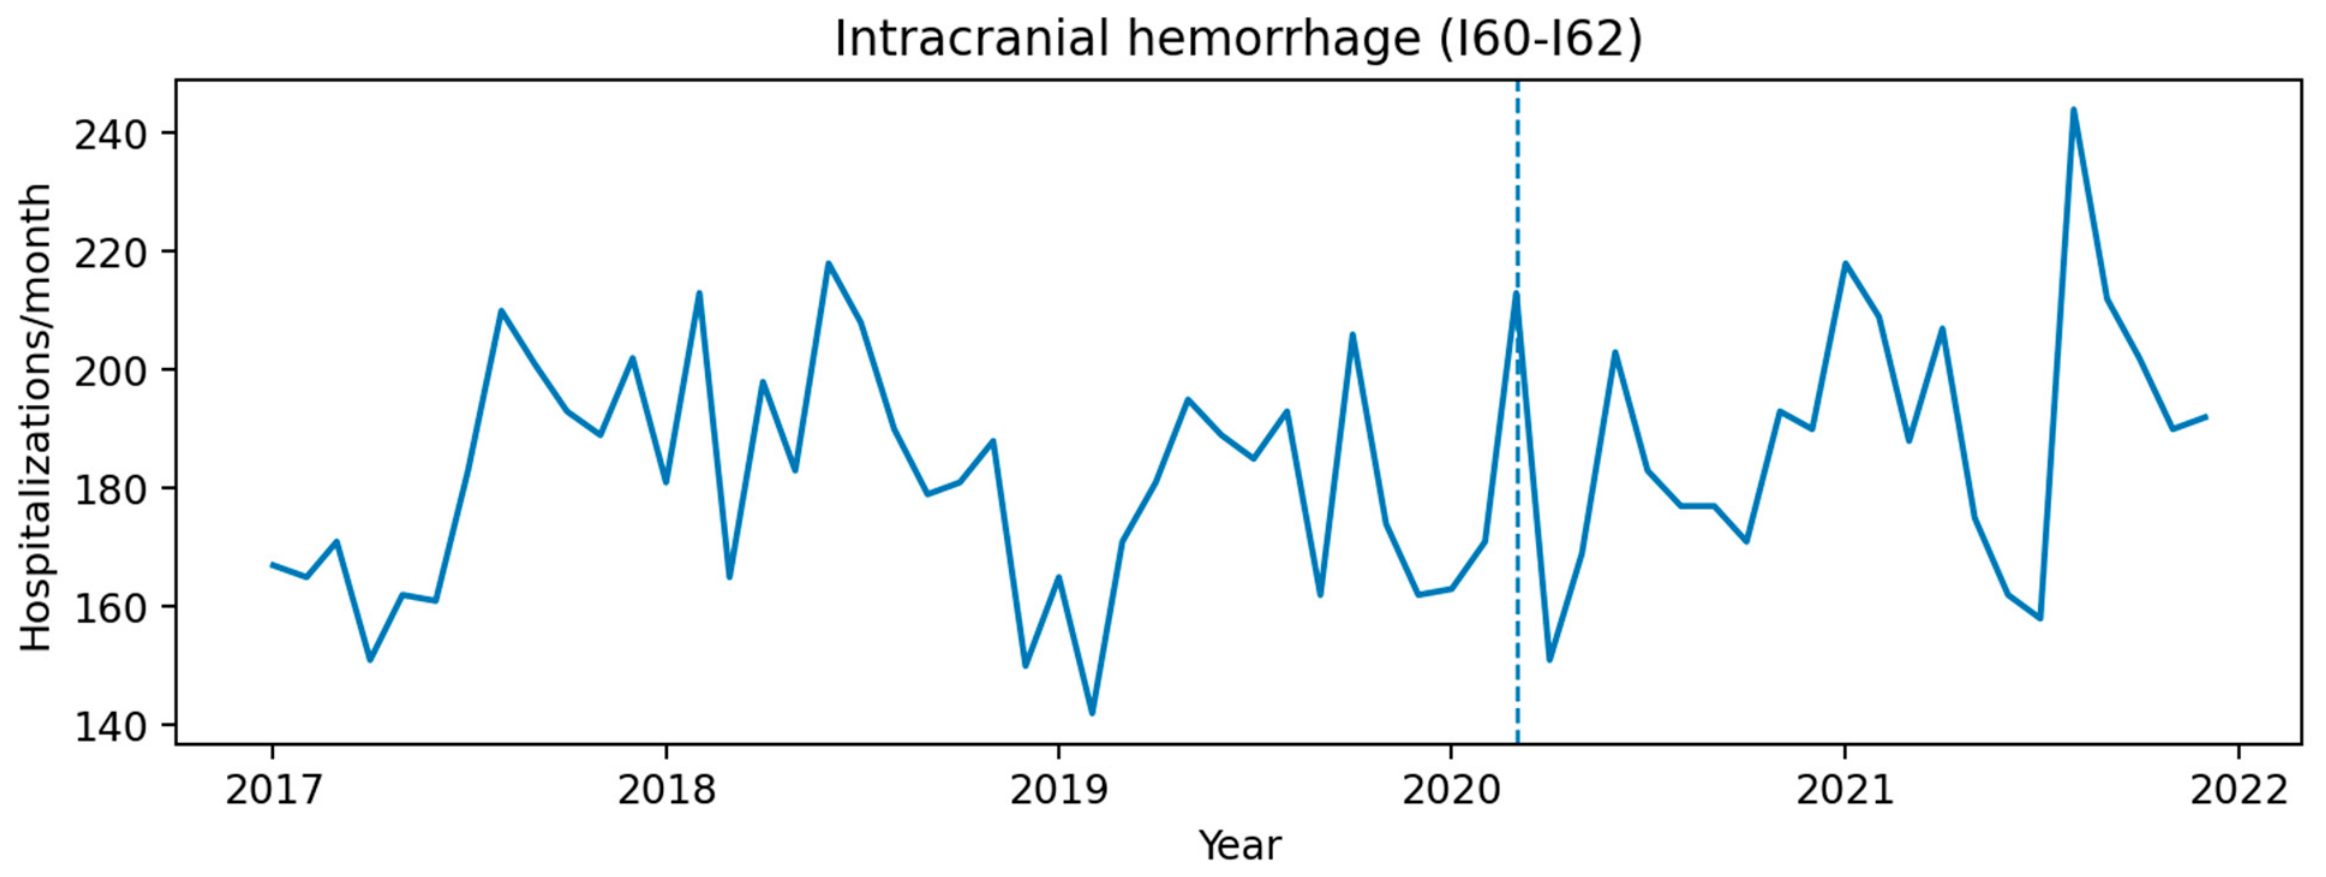
Monthly hospitalization trajectories for the four diagnostic categories are shown in
Figure 1,
Figure 2,
Figure 3 and
Figure 4; the dashed vertical line marks March 2020.
4. Discussion
4.1. Principal Finding and Strength of Inference
The findings indicate formally tested heterogeneity in immediate level changes across cerebrovascular categories, without evidence of individual diagnostic redistribution. After adjustment for trend, population, seasonality, and overdispersion, I65–I69 showed the largest immediate decrease and I64 a smaller decrease, whereas I60–I62 remained stable. I63 had an increasing pre-pandemic trend and did not show a significant level change at the primary March 2020 interruption point.
The contrast between the crude comparison (+15.2% in mean annual I63 hospitalizations) and the segmented model (level IRR 0.868; p = 0.086) illustrates the importance of accounting for secular trends: comparing pre/post means without such adjustment may suggest a pandemic-associated increase when part of that increase was already underway before 2020.
4.2. Comparison with the Literature, Including Contrasting Evidence
The I64 and I65–I69 findings are consistent with studies reporting reduced stroke admissions during early pandemic phases [
13,
19,
21]. Reductions were often more pronounced for TIA and mild/moderate stroke, whereas severe events continued to reach services [
21]. However, this pattern was not universal. Nationwide Danish data showed broadly stable admissions during much of the pandemic [
22], and other systems reported recovery after lockdown or patterns dependent on epidemic intensity. Therefore, the direction and magnitude of the phenomenon appear to depend on the health system, time period, case definition, and local organization.
4.3. Biological Mechanisms: Context, Not Demonstration
Endothelial dysfunction, immunothrombosis, hypercoagulability, and vascular inflammation associated with COVID-19 provide biological plausibility for cerebrovascular events [
6,
7,
8,
9,
10]. However, the SIH-SUS dataset contains no individual confirmation of SARS-CoV-2 infection, severity, laboratory markers, vaccination, or neuroimaging findings. Consequently, the present models do not test biological mechanisms and cannot attribute any hospitalization to infection.
4.4. Healthcare Utilization, Coding, and Neuroimaging
Changes in care-seeking, referral, admission criteria, coding, and neuroimaging access are plausible explanations for differential decreases but remain hypotheses. In particular, the reduction in I64 cannot be interpreted as evidence of improved diagnostic specificity because data on migration between codes and imaging performed are unavailable. The study also cannot distinguish a true incidence reduction from reduced access or administrative change.
4.5. Implications for Health Systems
The findings reinforce the usefulness of temporal surveillance of time-sensitive conditions during emergencies. Abrupt decreases in specific categories may signal changes in access or organization and should prompt operational investigation. Maintaining protected stroke pathways, neuroimaging, and reperfusion therapies remains supported by external guidelines and literature, but it is not an effect directly tested by this study.
4.6. Sentinel TeleStroke as an Implementation Hypothesis
The Sentinel TeleStroke Network should be understood only as a future, hypothesis-generating proposal informed by established telestroke and healthcare-surveillance principles [
28,
29,
30]. This study did not evaluate telemedicine, compare networks with and without telestroke, or demonstrate that such a strategy would prevent the observed changes. Any implementation requires independent prospective evaluation of process, effectiveness, safety, and equity.
4.7. Strengths and Limitations
Strengths include monthly resolution across 240 observations, direct verification of source files, five years of observation, population denominators, appropriate modeling for overdispersed counts, explicit control for trend and seasonality, residual diagnostics, formal category interaction, and sensitivity and influence analyses.
Important limitations remain. SIH-SUS represents SUS-financed hospitalizations rather than all admissions in the municipality. The ecological design precludes individual-level inference and is subject to ecological fallacy. Information was unavailable on neurologic severity, SARS-CoV-2 infection, vaccination, neuroimaging, treatment, mortality, care intervals, transfers, private-sector care, or individual coding changes. Population denominators are annual July 1 estimates repeated across months of each year. Classification, referral, and healthcare-utilization biases remain possible, and their direction and magnitude could not be quantified. Sixty months per category are adequate for the specified segmented regression but limit more complex seasonal models. The interruption date is an approximation of a change that occurred gradually and heterogeneously in practice.
5. Conclusions
From 2017 through 2021, SUS-financed cerebrovascular hospitalizations in the municipality of São Paulo followed distinct trajectories. After controlling for pre-existing trend, population, seasonality, and overdispersion, March 2020 was associated with immediate decreases in unspecified stroke and, more prominently, other cerebrovascular diseases; there was no evidence of an immediate decrease in intracranial hemorrhage, and the cerebral-infarction estimate was sensitive to the intervention date. The interaction between diagnostic category and level change demonstrated temporal heterogeneity across categories.
These results are associational and ecological. They do not demonstrate causality from COVID-19, migration between diagnostic codes, or mechanisms related to infection, imaging, or care-seeking behavior. The most defensible interpretation is category-specific temporal change in public-system hospitalizations during the pandemic, potentially influenced by multiple biological, healthcare, and administrative processes that were not directly measured.
Supplementary Materials
The following supporting information can be downloaded at:
https://www.mdpi.com/article/10.3390/covid6090153/s1, consolidated monthly analytical dataset (240 month-by-category observations) and reproducible script used for the statistical and segmented regression analyses. File S1: Analytical_Dataset_FINAL; File S2: Reproducible_Analysis_Code_FINAL.
Author Contributions
Conceptualization, C.B.; methodology, C.B. and L.V.d.A.S.; formal analysis, C.B.; investigation, C.B.; data curation, C.B.; writing—original draft preparation, C.B.; writing—review and editing, C.B. and L.V.d.A.S.; visualization, C.B.; supervision, L.V.d.A.S.; validation, L.V.d.A.S.; project administration, C.B. All authors have read and agreed to the published version of the manuscript.
Funding
This research received no external funding.
Institutional Review Board Statement
Ethical review and approval were waived because the study used only publicly available, aggregate, and de-identified secondary data from DATASUS, in accordance with Resolution No. 510/2016 of the Brazilian National Health Council.
Informed Consent Statement
Not applicable.
Data Availability Statement
Aggregate hospitalization data are publicly available from the Brazilian Ministry of Health through SIH-SUS/DATASUS and can be re-extracted using the TABNET strategy described in Methods, with “month of admission” as the temporal dimension. The consolidated 240-observation monthly analytical dataset and the reproducible script used for the statistical and segmented regression analyses are provided as
Supplementary Material. During preparation of this manuscript, generative artificial intelligence tools were used solely to support language editing, editorial organization, and formatting. The authors critically reviewed, edited, and validated all scientific content and assume full responsibility for the final version.
Acknowledgments
This manuscript was developed from the first author’s master’s dissertation at Centro Universitário FMABC.
Conflicts of Interest
The authors declare no conflicts of interest.
References
- Campbell, B.C.V.; Khatri, P. Stroke. Lancet 2020, 396, 129–142. [Google Scholar] [CrossRef] [Scilit] [PubMed]
- Katan, M.; Luft, A. Global burden of stroke. Semin. Neurol. 2018, 38, 208–211. [Google Scholar] [CrossRef] [Scilit] [PubMed]
- Li, H.; Xue, Q.; Xu, X. Involvement of the nervous system in SARS-CoV-2 infection. Neurotox. Res. 2020, 38, 1–7. [Google Scholar] [CrossRef] [Scilit] [PubMed]
- Pleasure, S.J.; Green, A.J.; Josephson, S.A. The spectrum of neurologic disease in the severe acute respiratory syndrome coronavirus 2 pandemic. JAMA Neurol. 2020, 77, 679–680. [Google Scholar] [CrossRef] [Scilit] [PubMed]
- Fotuhi, M.; Mian, A.; Meysami, S.; Raji, C.A. Neurobiology of COVID-19. J. Alzheimers Dis. 2020, 76, 3–19. [Google Scholar] [CrossRef] [Scilit] [PubMed]
- Siow, I.; Lee, K.S.; Zhang, J.J.; Saffari, S.E.; Ng, A.; Young, B. Stroke as a neurological complication of COVID-19: A systematic review and meta-analysis. J. Stroke Cerebrovasc. Dis. 2021, 30, 105549. [Google Scholar] [CrossRef] [Scilit] [PubMed]
- Nannoni, S.; de Groot, R.; Bell, S.; Markus, H.S. Stroke in COVID-19: A systematic review and meta-analysis. Int. J. Stroke 2021, 16, 137–149. [Google Scholar] [CrossRef] [Scilit] [PubMed]
- de Souza, A.M.L.B.; Araújo, E.F.; Carvas Junior, N.; Raimundo, A.C.S.; Pereira, A.C.; Meneghim, M.C. Association between SARS-CoV-2 and stroke: Perspectives from a metaumbrella-review. BMC Neurol. 2025, 25, 97. [Google Scholar] [CrossRef] [Scilit] [PubMed]
- Xu, S.W.; Ilyas, I.; Weng, J.P. Endothelial dysfunction in COVID-19: An overview of evidence, biomarkers, mechanisms and potential therapies. Acta Pharmacol. Sin. 2023, 44, 695–709. [Google Scholar] [CrossRef] [Scilit] [PubMed]
- Liu, L.; Zhou, C.; Jiang, H.; Wei, H.; Zhou, Y.; Zhou, C.; Ji, X. Epidemiology, pathogenesis, and management of coronavirus disease 2019-associated stroke. Front. Med. 2023, 17, 1047–1067. [Google Scholar] [CrossRef] [Scilit] [PubMed]
- Kapsner, L.A.; Kampf, M.O.; Seuchter, S.A.; Gruendner, J.; Gulden, C.; Mate, S.; Mang, J.M.; Schüttler, C.; Deppenwiese, N.; Krause, L.; et al. Reduced rate of inpatient hospital admissions in 18 German university hospitals during the COVID-19 lockdown. Front. Public Health 2021, 8, 594117. [Google Scholar] [CrossRef] [Scilit] [PubMed]
- Candelaresi, P.; Manzo, V.; Servillo, G.; Muto, M.; Barone, P.; Napoletano, R.; Saponiero, R.; Andreone, V.; Palma, V.; Spitaleri, D.; et al. The impact of COVID-19 lockdown on stroke admissions and treatments in Campania. J. Stroke Cerebrovasc. Dis. 2021, 30, 105448. [Google Scholar] [CrossRef] [Scilit] [PubMed]
- Tanisaka, L.S.; Paiva, L.d.S.; de Carvalho, L.E.W.; Fonseca, F.L.A.; Feder, D.; Nascimento, V.B.D.; Adami, F. Stroke hospital admissions during the COVID-19 outbreak in São Paulo, Brazil. Cerebrovasc. Dis. 2022, 51, 686–689. [Google Scholar] [CrossRef] [Scilit] [PubMed]
- Frisullo, G.; Brunetti, V.; Di Iorio, R.; Broccolini, A.; Caliandro, P.; Monforte, M.; Morosetti, R.; Piano, C.; Pilato, F.; Calabresi, P.; et al. Effect of lockdown on the management of ischemic stroke: An Italian experience from a COVID hospital. Neurol. Sci. 2020, 41, 2309–2313. [Google Scholar] [CrossRef] [Scilit] [PubMed]
- Ghoreishi, A.; Arsang-Jang, S.; Sabaa-Ayoun, Z.; Yassi, N.; Sylaja, P.; Akbari, Y.; Divani, A.A.; Biller, J.; Phan, T.; Steinwender, S.; et al. Stroke care trends during COVID-19 pandemic in Zanjan Province, Iran. J. Stroke Cerebrovasc. Dis. 2020, 29, 105321. [Google Scholar] [CrossRef] [Scilit] [PubMed]
- Risser, C.; Loc, P.T.B.; Binder-Foucard, F.; Fabacher, T.; Lefèvre, H.; Sauvage, C.; Sauleau, E.-A.; Wolff, V. COVID-19 impact on stroke admissions during France’s first epidemic peak. Cerebrovasc. Dis. 2022, 51, 663–669. [Google Scholar] [CrossRef] [Scilit] [PubMed]
- Nzwalo, H.; Logallo, N. Addressing stroke admissions during COVID-19 pandemic beyond fear and constraining health factors. J. Stroke Cerebrovasc. Dis. 2021, 30, 105693. [Google Scholar] [CrossRef] [Scilit] [PubMed]
- Akhtar, N.; Kamran, S.; Al-Jerdi, S.; Imam, Y.; Joseph, S.; Morgan, D.; Abokersh, M.; Uy, R.T.; Shuaib, A. Trends in stroke admissions before, during and post-peak of the COVID-19 pandemic: A one-year experience from the Qatar stroke database. PLoS ONE 2022, 17, e0264815. [Google Scholar] [CrossRef] [Scilit] [PubMed]
- Van Dusen, R.A.; Abernethy, K.; Chaudhary, N.; Paudyal, V.; Kurmi, O. Association of the COVID-19 pandemic on stroke admissions and treatment globally: A systematic review. BMJ Open 2023, 13, e062734. [Google Scholar] [CrossRef] [Scilit] [PubMed]
- Gunnarsson, K.; Tofiq, A.; Mathew, A.; Cao, Y.; von Euler, M.; Ström, J.O. Changes in stroke and TIA admissions during the COVID-19 pandemic: A meta-analysis. Eur. Stroke J. 2024, 9, 78–87. [Google Scholar] [CrossRef] [Scilit] [PubMed]
- Diegoli, H.; Magalhães, P.S.; Martins, S.C.; Moro, C.H.; França, P.H.; Safanelli, J.; Nagel, V.; Venancio, V.G.; Liberato, R.B.; Longo, A.L. Decrease in Hospital Admissions for Transient Ischemic Attack, Mild, and Moderate Stroke During the COVID-19 Era. Stroke 2020, 51, 2315–2321. [Google Scholar] [CrossRef] [Scilit] [PubMed]
- Simonsen, C.Z.; Blauenfeldt, R.A.; Hedegaard, J.N.; Kruuse, C.; Gaist, D.; Wienecke, T.; Modrau, B.; Johnsen, S.P.; Andersen, G. COVID-19 did not result in increased hospitalization for stroke and transient ischemic attack: A nationwide study. Eur. J. Neurol. 2022, 29, 2269–2274. [Google Scholar] [CrossRef] [Scilit] [PubMed]
- von Elm, E.; Altman, D.G.; Egger, M.; Pocock, S.J.; Gøtzsche, P.C.; Vandenbroucke, J.P.; STROBE Initiative. The Strengthening the Reporting of Observational Studies in Epidemiology (STROBE) Statement: Guidelines for Reporting Observational Studies. PLoS Med. 2007, 4, e296. [Google Scholar] [CrossRef] [Scilit] [PubMed]
- Benchimol, E.I.; Smeeth, L.; Guttmann, A.; Harron, K.; Moher, D.; Petersen, I.; Sørensen, H.T.; von Elm, E.; Langan, S.M. The REporting of studies Conducted using Observational Routinely-collected health Data (RECORD) Statement. PLoS Med. 2015, 12, e1001885. [Google Scholar] [CrossRef] [Scilit] [PubMed]
- Brazilian Ministry of Health; DATASUS. Morbidade Hospitalar do SUS (SIH/SUS): Geral, por Local de Internação. Available online: https://datasus.saude.gov.br/acesso-a-informacao/morbidade-hospitalar-do-sus-sih-sus/ (accessed on 9 August 2026).
- Brazilian Institute of Geography and Statistics; IBGE. Population Estimates: Municipal Population Estimates, Reference Date 1 July. Available online: https://www.ibge.gov.br/estatisticas/sociais/populacao/9103-estimativas-de-populacao.html (accessed on 9 August 2026).
- Bernal, J.L.; Cummins, S.; Gasparrini, A. Interrupted time series regression for the evaluation of public health interventions: A tutorial. Int. J. Epidemiol. 2017, 46, 348–355. [Google Scholar] [CrossRef] [Scilit] [PubMed]
- World Stroke Organization. Global Stroke Services Guideline and Action Plan; World Stroke Organization: Geneva, Switzerland, 2026; Available online: https://www.world-stroke.org/what-we-do/education-and-research/improving-access-to-quality-stroke-care/global-stroke-services-guideline-action-plan (accessed on 11 June 2026).
- Brazilian Ministry of Health. Stroke Care Pathway for Adults [Linha de Cuidado do Acidente Vascular Cerebral (AVC) no Adulto]; Ministry of Health: Brasília, Brazil, 2019. Available online: https://linhasdecuidado.saude.gov.br/portal/acidente-vascular-cerebral-%28AVC%29-no-adulto/ (accessed on 11 June 2026). (In Portuguese)
- Demaerschalk, B.M.; Berg, J.; Chong, B.W.; Gross, H.; Nystrom, K.; Adeoye, O.; Schwamm, L.; Wechsler, L.; Whitchurch, S. American Telemedicine Association: Telestroke Guidelines. Telemed. E-Health 2017, 23, 376–389. [Google Scholar] [CrossRef] [Scilit] [PubMed]
| Disclaimer/Publisher’s Note: The statements, opinions and data contained in all publications are solely those of the individual author(s) and contributor(s) and not of MDPI and/or the editor(s). MDPI and/or the editor(s) disclaim responsibility for any injury to people or property resulting from any ideas, methods, instructions or products referred to in the content. |