
Article

Temporal Evolution of COVID-19 Transmission Indicators in Tunisia During the First Three Years of the Pandemic: A Prospective Descriptive Study, 2020–2022


1
National Observatory of New and Emerging Diseases, Ministry of Health Tunisia, Tunis 1002, Tunisia
2
Department of Community Health and Epidemiology, Hedi Chaker University Hospital Sfax, Sfax 3029, Tunisia
3
Faculty of Medicine of Tunis, University Tunis El Manar, Tunis 1007, Tunisia
4
Department of Preventive and Community Medicine, Salah Azaiez Institute Tunis, Tunis 1006, Tunisia
*
Author to whom correspondence should be addressed.
COVID 2026, 6(8), 133; https://doi.org/10.3390/covid6080133
Submission received: 13 June 2026 / Revised: 20 July 2026 / Accepted: 22 July 2026 / Published: 24 July 2026
(This article belongs to the Section COVID Public Health and Epidemiology)

Abstract

The first case of Coronavirus Disease 2019 (COVID-19) in Tunisia was reported on 2 March 2020. This study aimed to describe the epidemiological evolution of the COVID-19 pandemic in Tunisia from March 2020 to December 2022 and to assess changes in key transmission indicators across the different phases and epidemic waves. We conducted a nationwide longitudinal descriptive study based on prospectively collected surveillance data including all laboratory-confirmed COVID-19 cases reported through the national surveillance system between March 2020 and December 2022. Descriptive analyses were performed to estimate screening rates, test positivity rates, cumulative incidence rates, and the time-varying effective reproduction number (Rt). During the three-year study period, Tunisia reported a cumulative incidence of 9562.05 cases per 100,000 inhabitants. The mean daily screening rate was 38.23 tests per 100,000 inhabitants, while the average positivity rate reached 16.03%. The mean effective reproduction number was estimated at 1.14 (95% CI: 1.11–1.17). The epidemic evolved through two distinct transmission phases. The first phase, extending from 2 March to 17 August 2020, was characterized by limited community transmission mainly associated with imported cases. The second phase was marked by sustained autochthonous community transmission and comprised five epidemic waves. Between March and May 2021, genomic surveillance identified the predominance of the Alpha Variant of Concern (VOC). The fourth wave was dominated by the Delta VOC until December 2021, whereas the fifth wave, occurring in 2022, was associated with the Omicron VOC. Continuous monitoring of transmission indicators through the national surveillance system provided timely evidence to support risk assessment, guide public health decision-making, and adapt prevention and control measures throughout the different phases of the pandemic in Tunisia.

1. Introduction

Throughout history, infectious disease outbreaks have caused major health, social, and economic impacts. Previous pandemics, including the 1918 influenza and HIV/AIDS pandemics, have highlighted the persistent threat of emerging and re-emerging pathogens. Globalization, urbanization, and increased human mobility have further facilitated the emergence and spread of novel infectious diseases.
In December 2019, SARS-CoV-2, the virus causing Coronavirus Disease 2019 (COVID-19), was first identified following an outbreak of pneumonia in Wuhan, China [1,2].
The rapid global spread of SARS-CoV-2 was driven by the lack of population immunity, pre- and asymptomatic transmission, increased mobility, population density, and delayed implementation of control measures, resulting in widespread transmission across continents within weeks [3,4].
Recognizing the growing international threat, the World Health Organization (WHO) declared the outbreak a Public Health Emergency of International Concern (PHEIC) on 30 January 2020 [5,6] and subsequently characterized COVID-19 as a pandemic on 11 March 2020 [7,8]. Since then, COVID-19 has become one of the most significant public health crises of the twenty-first century, resulting in hundreds of millions of confirmed cases and millions of deaths worldwide [9,10].
The epidemiology of COVID-19 has evolved considerably over time, particularly with the emergence of successive SARS-CoV-2 variants exhibiting differences in transmissibility, pathogenicity, and immune escape potential. Several Variants of Concern (VOCs) have driven successive epidemic waves across the world and have posed major challenges for surveillance systems and public health responses [4,9,11,12,13]. In response, all countries have strengthened their surveillance systems and put in place prevention and control measures for COVID-19 [14,15].
In Tunisia, the National Preparedness, Prevention, Response, and Resilience Plan (2P2R) for epidemic-prone diseases was activated on 18 January 2020, several weeks before the detection of the first confirmed case [16]. Since then, the National Observatory for New and Emerging Diseases (ONMNE) has coordinated epidemiological surveillance activities, outbreak investigations, risk assessment, and genomic surveillance for monitoring the emergence and circulation of SARS-CoV-2 variants.
The first laboratory-confirmed case of COVID-19 in Tunisia was reported on 2 March 2020. During the subsequent three years, the country experienced multiple epidemic waves associated with varying levels of community transmission and the successive predominance of different SARS-CoV-2 variants. Understanding the temporal evolution of the epidemic and its transmission dynamics is essential for evaluating the effectiveness of surveillance and response strategies and for strengthening preparedness for future public health emergencies.
Although several Tunisian reports have described specific aspects or phases of the COVID-19 epidemic, a comprehensive nationwide analysis of the temporal evolution of key transmission indicators throughout the first three years of the pandemic has not previously been conducted. This study is the first to provide a nationwide description of COVID-19 transmission dynamics in Tunisia from 2020 to 2022, integrating multiple epidemiological indicators across successive epidemic waves.
The primary objective of this study was to describe the epidemiological evolution of the COVID-19 pandemic in Tunisia from 2 March 2020 to 31 December 2022 through the analysis of key transmission indicators and the characterization of the different epidemic phases and waves that occurred during this period.

2. Materials and Methods

2.1. Study Design and Setting

We conducted a nationwide longitudinal descriptive study based on routinely collected COVID-19 surveillance data in Tunisia. The study covered a period of 34 months, from 2 March 2020, corresponding to the confirmation of the first COVID-19 case in Tunisia, to 31 December 2022.
Data were prospectively collected on a daily basis through the national COVID-19 surveillance system coordinated by the National Observatory for New and Emerging Diseases (ONMNE), Ministry of Health. Surveillance data included all laboratory-confirmed COVID-19 cases and SARS-CoV-2 test results reported nationwide during the study period.

2.2. Case Definition

A confirmed COVID-19 case was defined according to the national surveillance guidelines as any individual with SARS-CoV-2 infection confirmed by either a reverse transcription polymerase chain reaction (RT-PCR) assay or a SARS-CoV-2 rapid diagnostic test (RDT), regardless of clinical presentation (symptomatic or asymptomatic) [17].
All RT-PCR and RDT results reported to the ONMNE during the study period were included in the analysis. Individuals experiencing reinfection, defined as two laboratory-confirmed SARS-CoV-2 infections occurring at least 60 days apart, were considered as new cases and included accordingly.

2.3. Operational Definitions

A variant of concern (VOC) was defined according to the World Health Organization (WHO) classification as a SARS-CoV-2 variant associated with one or more epidemiological characteristics of public health significance, including increased transmissibility, increased disease severity, reduced effectiveness of public health measures, or decreased effectiveness of available diagnostics, vaccines, or therapeutics [18].
“A transmission phase” was defined as a period characterized by a relatively homogeneous level of SARS-CoV-2 transmission [19]. Two major transmission patterns were considered:
-
Limited transmission associated with imported cases and well-defined clusters;
-
Sustained community transmission involving autochthonous cases with ongoing local spread.
Epidemic Wave: An epidemic wave was defined as a period during which the national incidence rate exceeded the predefined national alert threshold of 100 new confirmed cases per 100,000 inhabitants over a 14-day period, accompanied by a sustained increase in case notifications. This threshold corresponds to the threshold adopted by the Tunisian Ministry of Health during the pandemic to characterize high community transmission and guide public health measures.

2.4. Data Management and Statistical Analysis

Data cleaning was performed using Microsoft Excel® 2019 software (Microsoft Corporation, Redmond, WA, USA). Statistical analyses were conducted using R software version 4.3.2 (R Foundation for Statistical Computing, Vienna, Austria). Data management and visualization were performed using the tidyverse package (version 2.0.0), and the effective reproduction number (Rt) was estimated using the EpiEstim package (version 2.2-4).
Transmission indicators were calculated for successive 14-day periods (ISO epidemiological weeks) and included:
-
Screening rate: number of SARS-CoV-2 tests performed per 100,000 inhabitants;
-
Positivity rate (%): proportion of positive SARS-CoV-2 tests among all tests performed;
-
Incidence rate: number of newly confirmed COVID-19 cases per 100,000 inhabitants;
-
Time-varying effective reproduction number (Rt): average number of secondary cases generated by a primary case in a population where transmission is ongoing and public health interventions are in place.
The effective reproduction number (Rt) and its 95% confidence interval (95% CI) were estimated using daily incident case data and serial interval distributions according to the method described by Talmoudi et al. [20]. This indicator corresponds to the average number of secondary infections produced by an infected case in a population in which the SARS-CoV-2 virus is already circulating and was used to monitor temporal changes in transmission intensity throughout the study period.
The four indicators were selected because together they provide complementary information on epidemic dynamics: incidence reflects disease occurrence, screening rate reflects testing effort, positivity rate reflects the intensity of viral circulation relative to testing activity, and Rt estimates the time-varying transmission potential. These indicators were routinely monitored by the national surveillance system throughout the study period.
Descriptive statistics were used to summarize the evolution of transmission indicators and to characterize the different phases and epidemic waves of the COVID-19 pandemic in Tunisia.

2.5. Ethical Considerations

The use of anonymized surveillance data for public health monitoring and research purposes during the COVID-19 pandemic was authorized by the National Authority for the Protection of Personal Data. The study protocol was reviewed and approved by the relevant Data Protection Committee. All data were anonymized prior to analysis, and confidentiality was maintained throughout all stages of data management, analysis, and reporting.

3. Results

3.1. Overall Epidemiological Evolution of the COVID-19 Epidemic in Tunisia

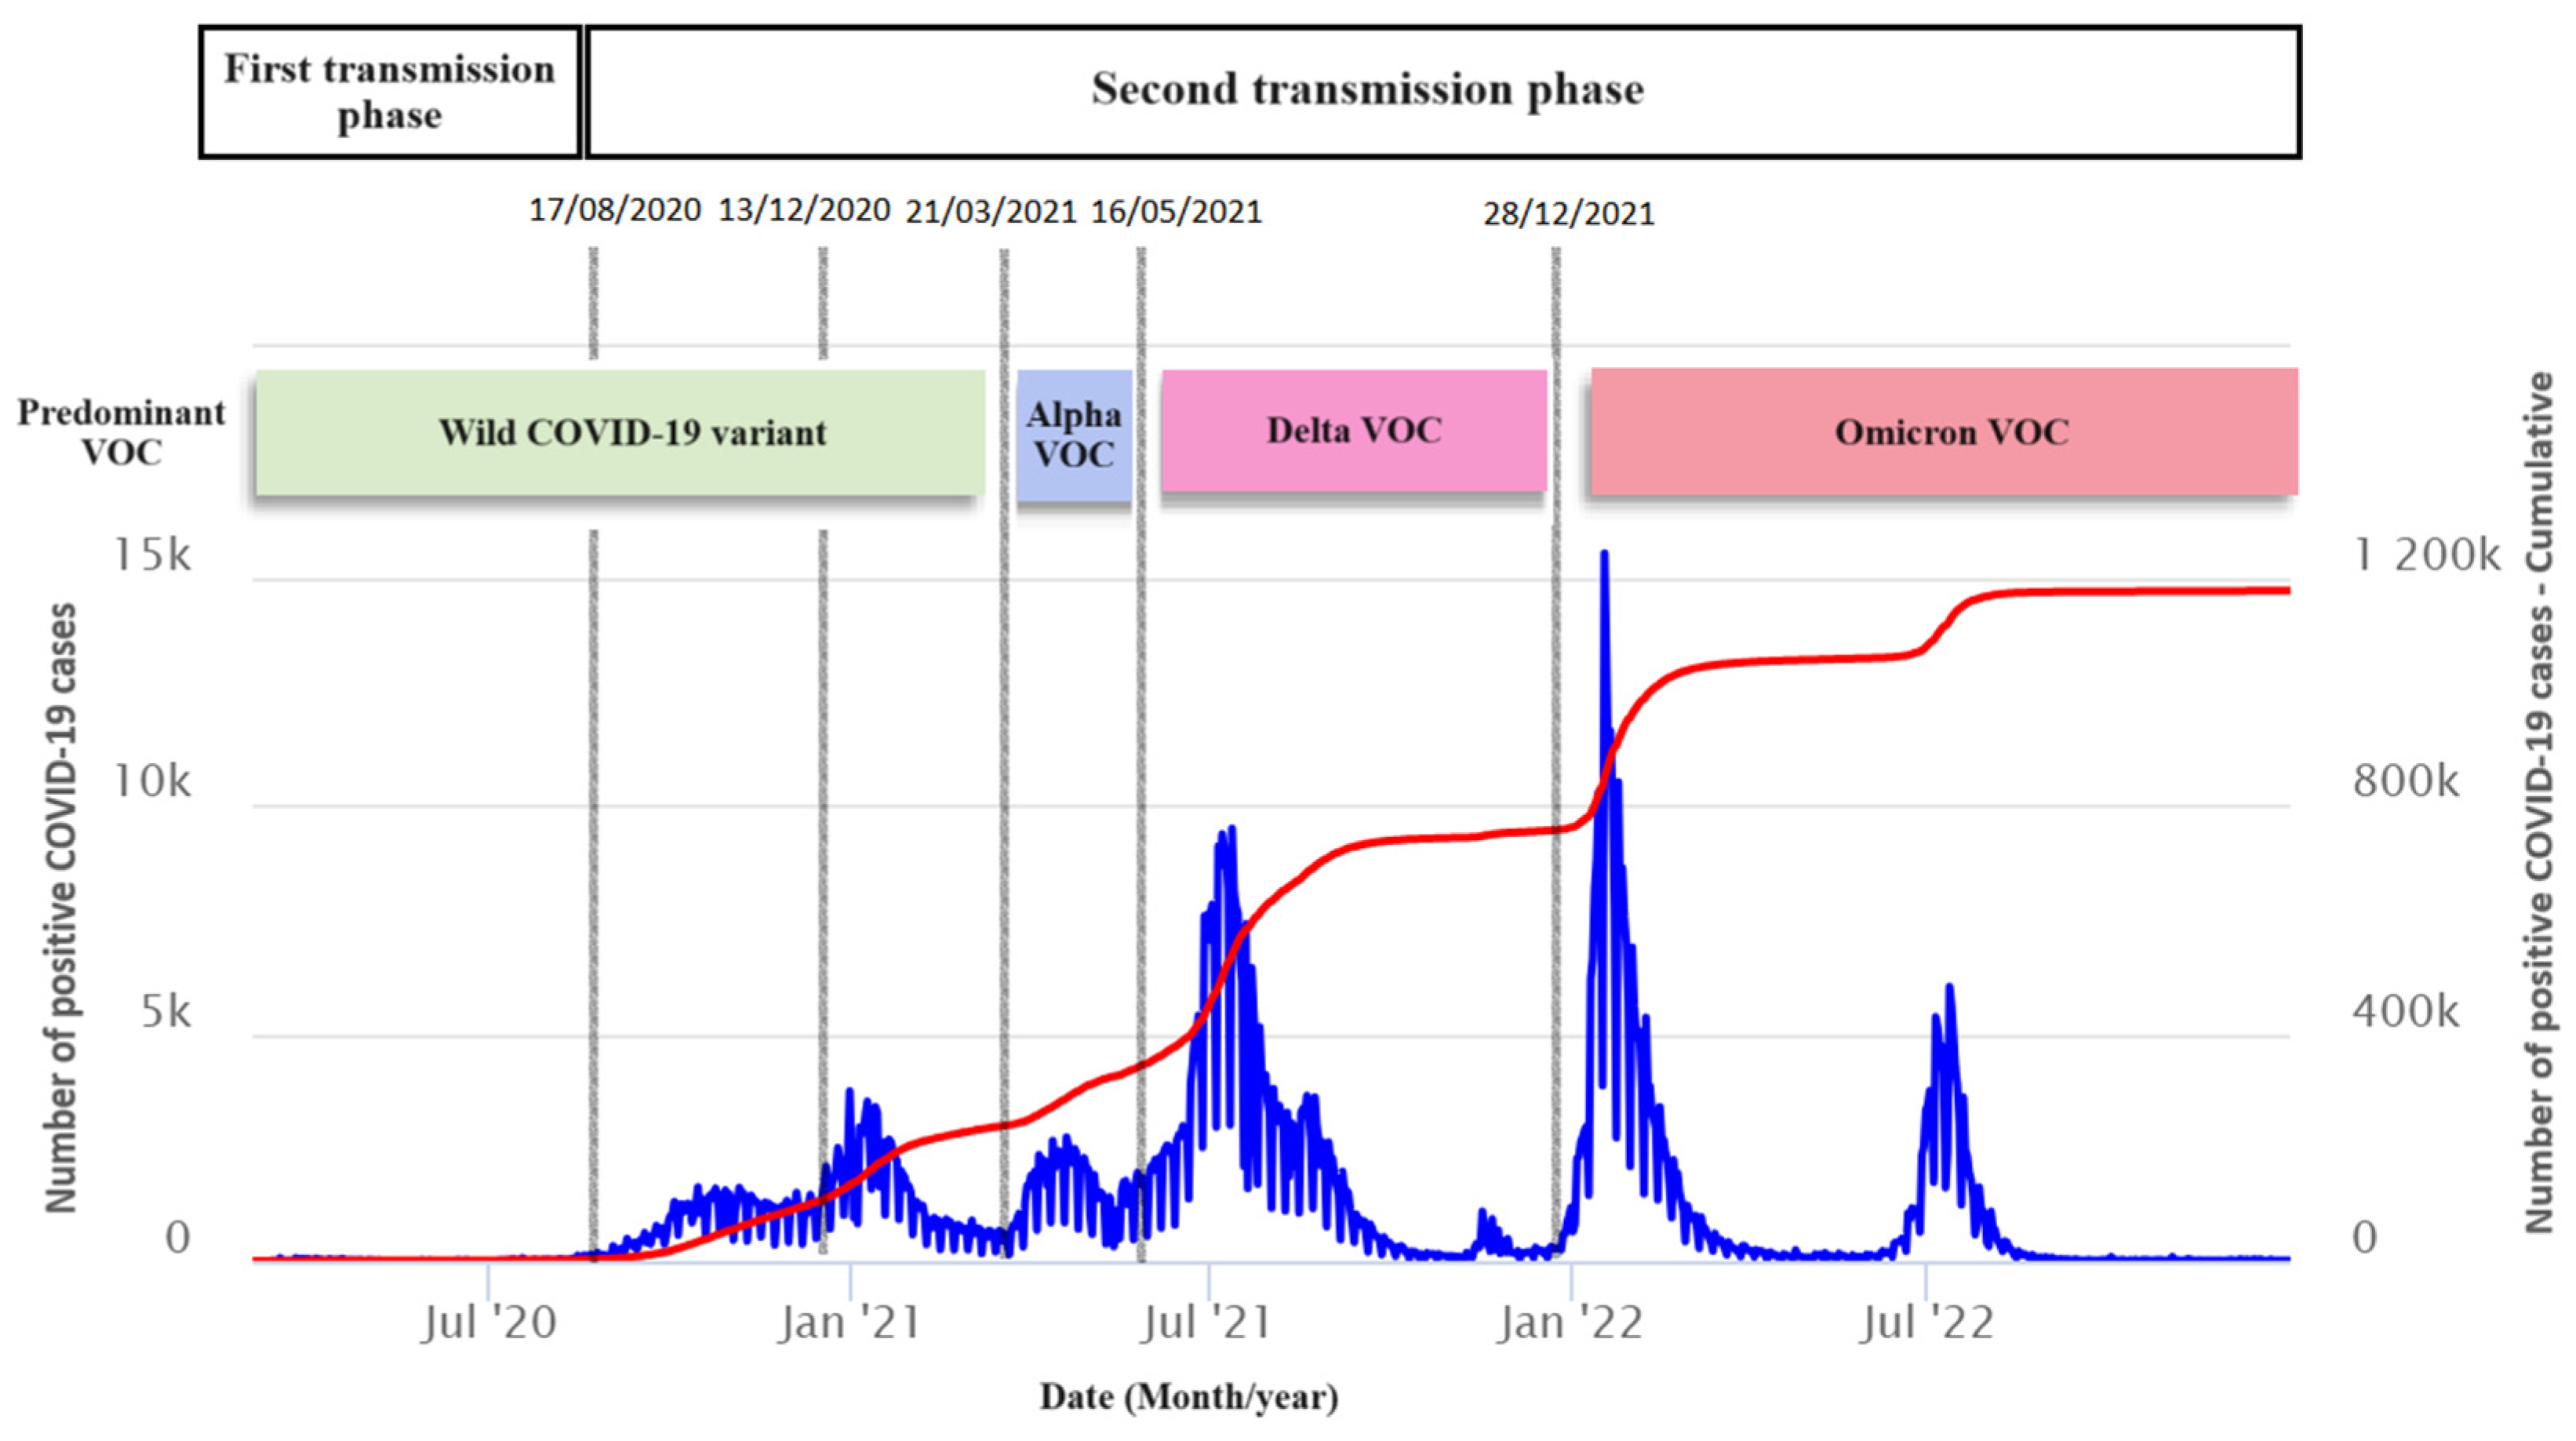
Since the declaration of the national Tunisian outbreak on 2 March 2020 in Tunisia, the country has undergone two distinct transmission phases in the evolution of the COVID-19 outbreak (Figure 1).
The first phase was between 2 March and 17 August 2020, and a level of zero new autochthonous cases was reached in July 2020. This phase was limited to cases and clusters around imported cases. 17 August 2020 marked the transition from the first to second phases of community transmission.
The second phase was marked by the reappearance of viral circulation. During this phase, five waves were observed (Figure 1):
-
The first wave lasted 17 weeks and was dominated by the circulation of the ancestral SARS-CoV-2 lineage.
-
The second wave (13 weeks) continued until 21 March 2021 (during a period dominated by pre-Alpha SARS-CoV-2 lineages, mainly the 20A (EU2) and 20E (EU1) clades).
-
This third wave ran from 21 March to 16 May 2021 (8 weeks) and was predominated by Alpha VOC.
-
From May 2021, the epidemic-curve showed a continuous recrudescence marking the fourth wave (20 weeks) dominated by the Delta VOC.
-
Since 26 December 2021, a rapid increase in the number of cases associated with Omicron VOC was recorded, with two distinct peaks. The first was on 18 January 2022 (12,698 cases), followed by another peak on 7 July 2022 (8138 cases).

3.2. Evolution of Transmission Indicators

3.2.1. Biweekly Incidence Rate of COVID-19

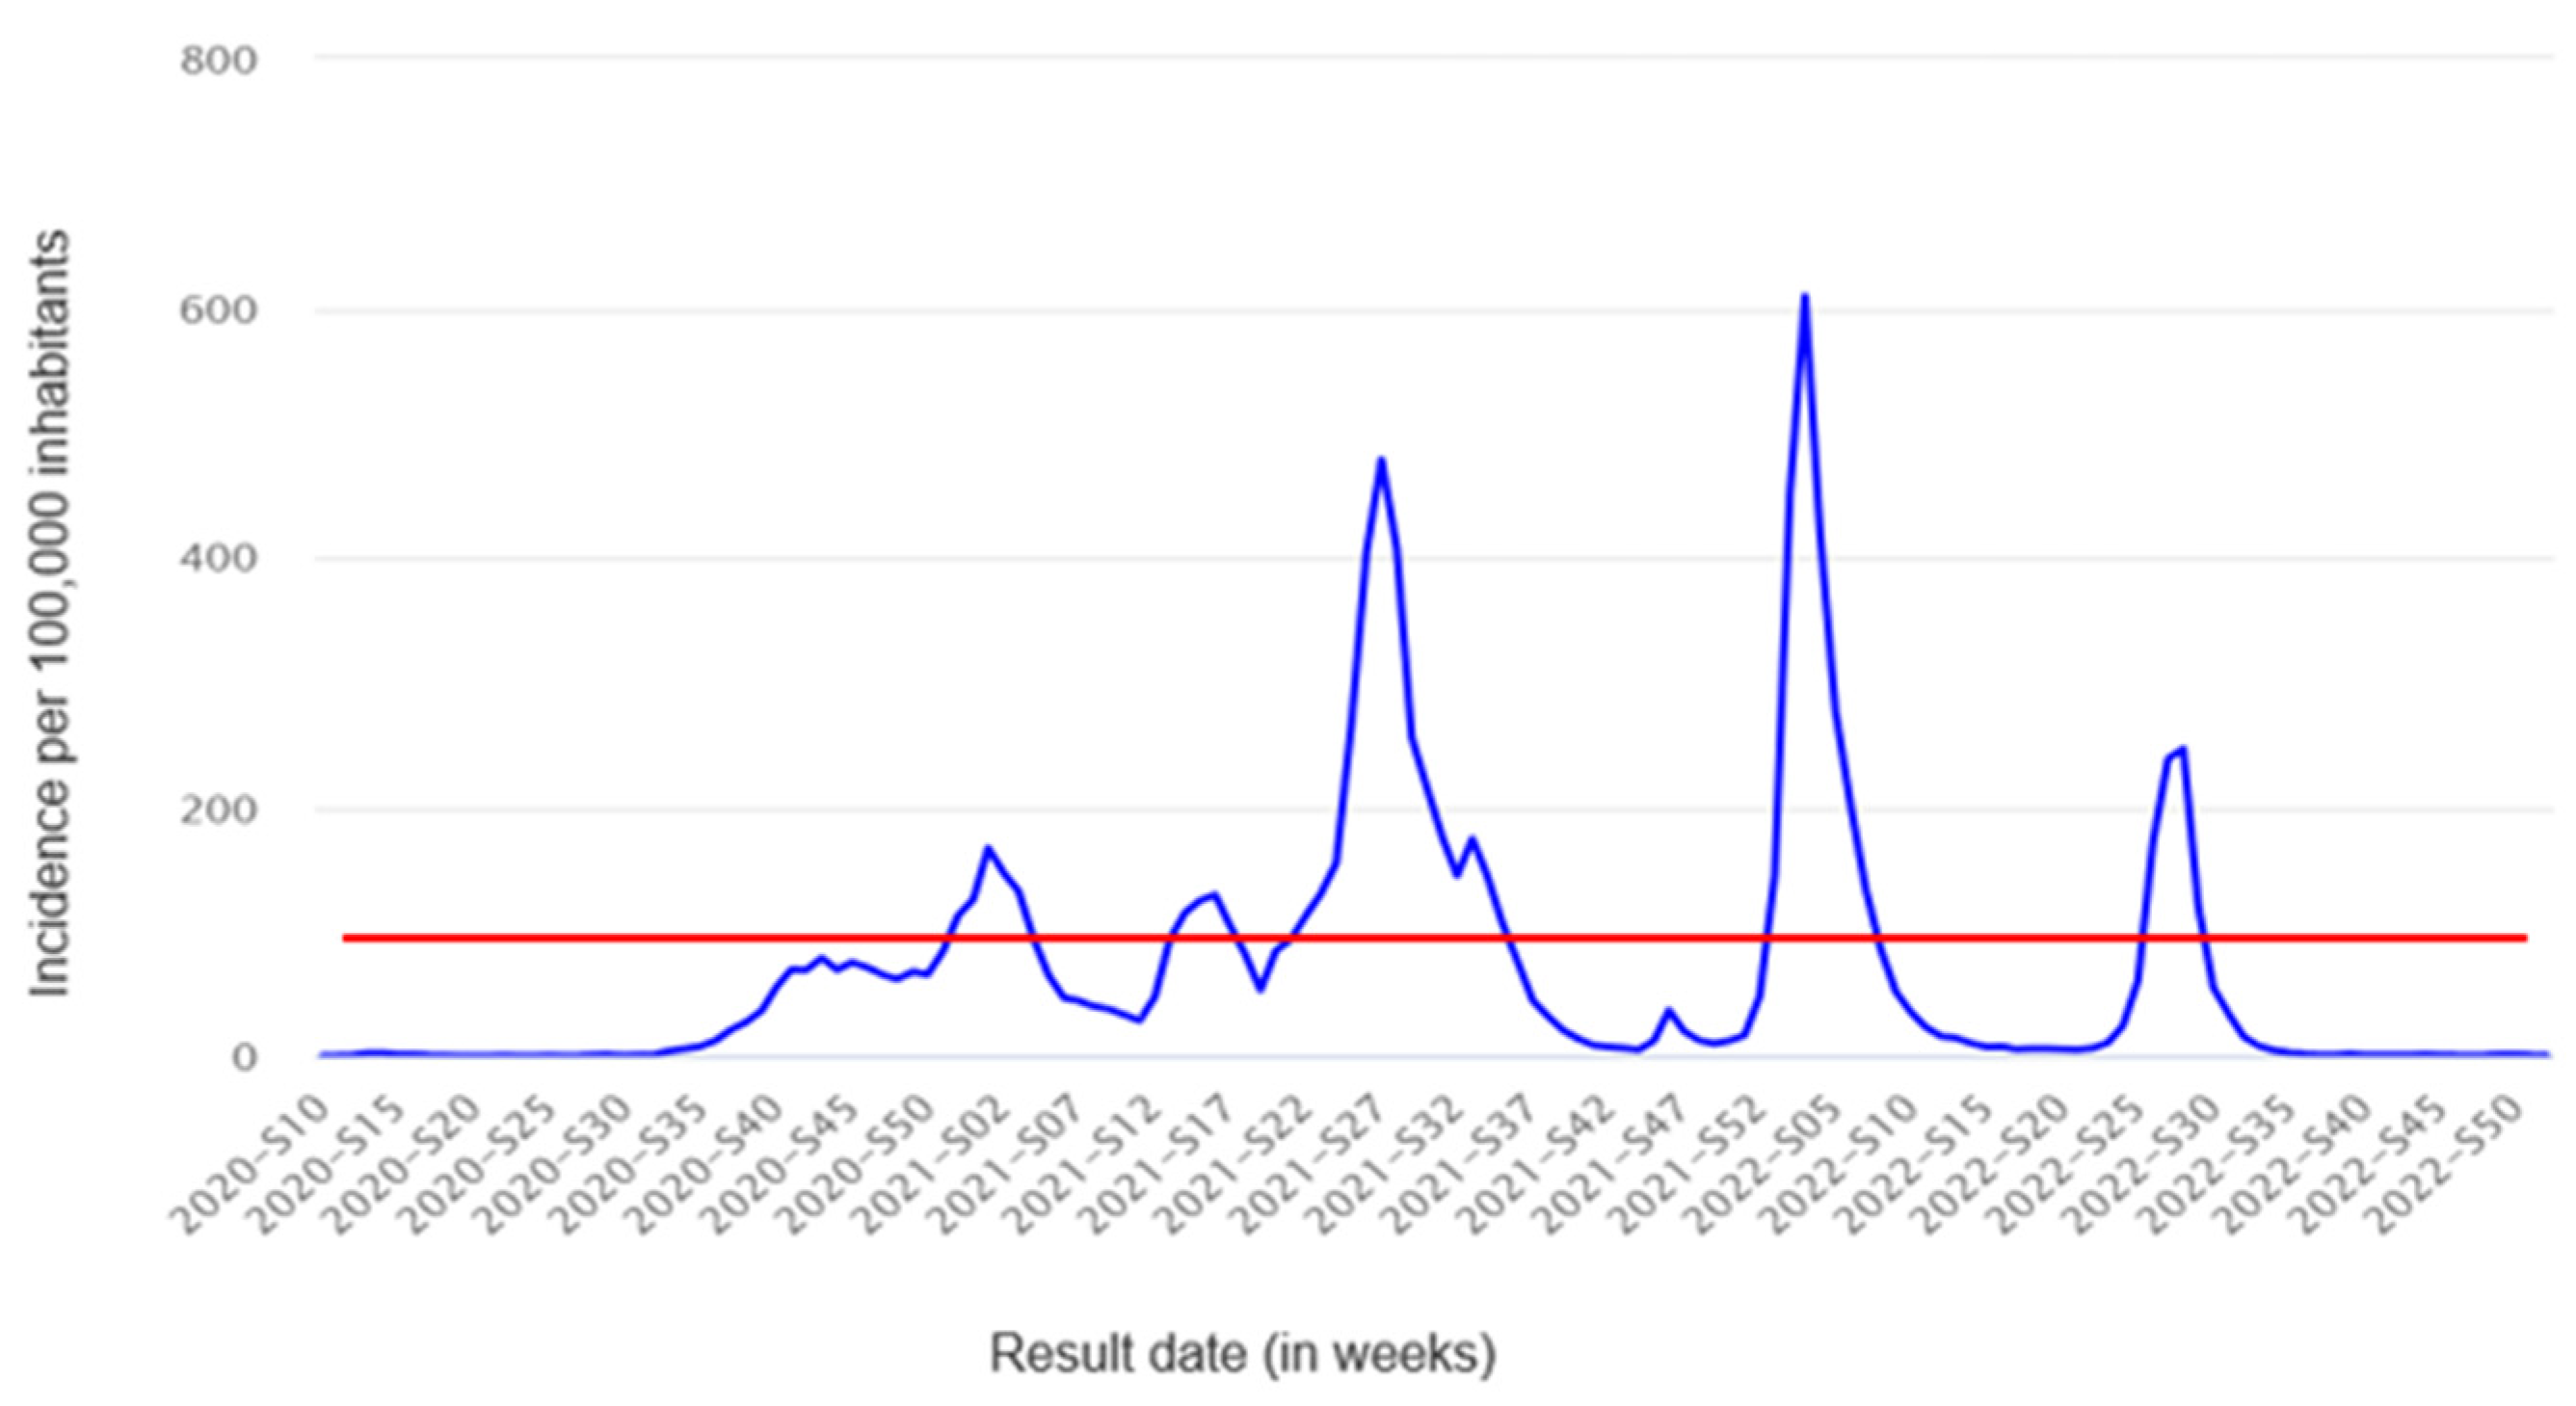
During the first phase and up to week W32/2020 (August 2020), the cumulative 2-week incidence remained consistently below 10/100,000 inhabitants. From W33-W34/2020 onwards, the incidence gradually increased, reaching 58.10/100,000 inhabitants in week W37-W38/2020, marking the start of the second phase of the pandemic in Tunisia (Figure 2).

3.2.2. Incidence Rate

The cumulative national incidence rate was 9562.05/100,000 inhabitants.

3.2.3. Global Effective Reproduction Number (Rt)

An average Rt of 1.14 (95% CI: 1.11–1.17) indicated sustained transmission, with each infected individual expected to generate approximately 1.14 secondary cases. The highest Rt value was 19.29 [95% CI 17.45–21.20] recorded on 7 March 2020.

3.2.4. Positivity and Screening Rates

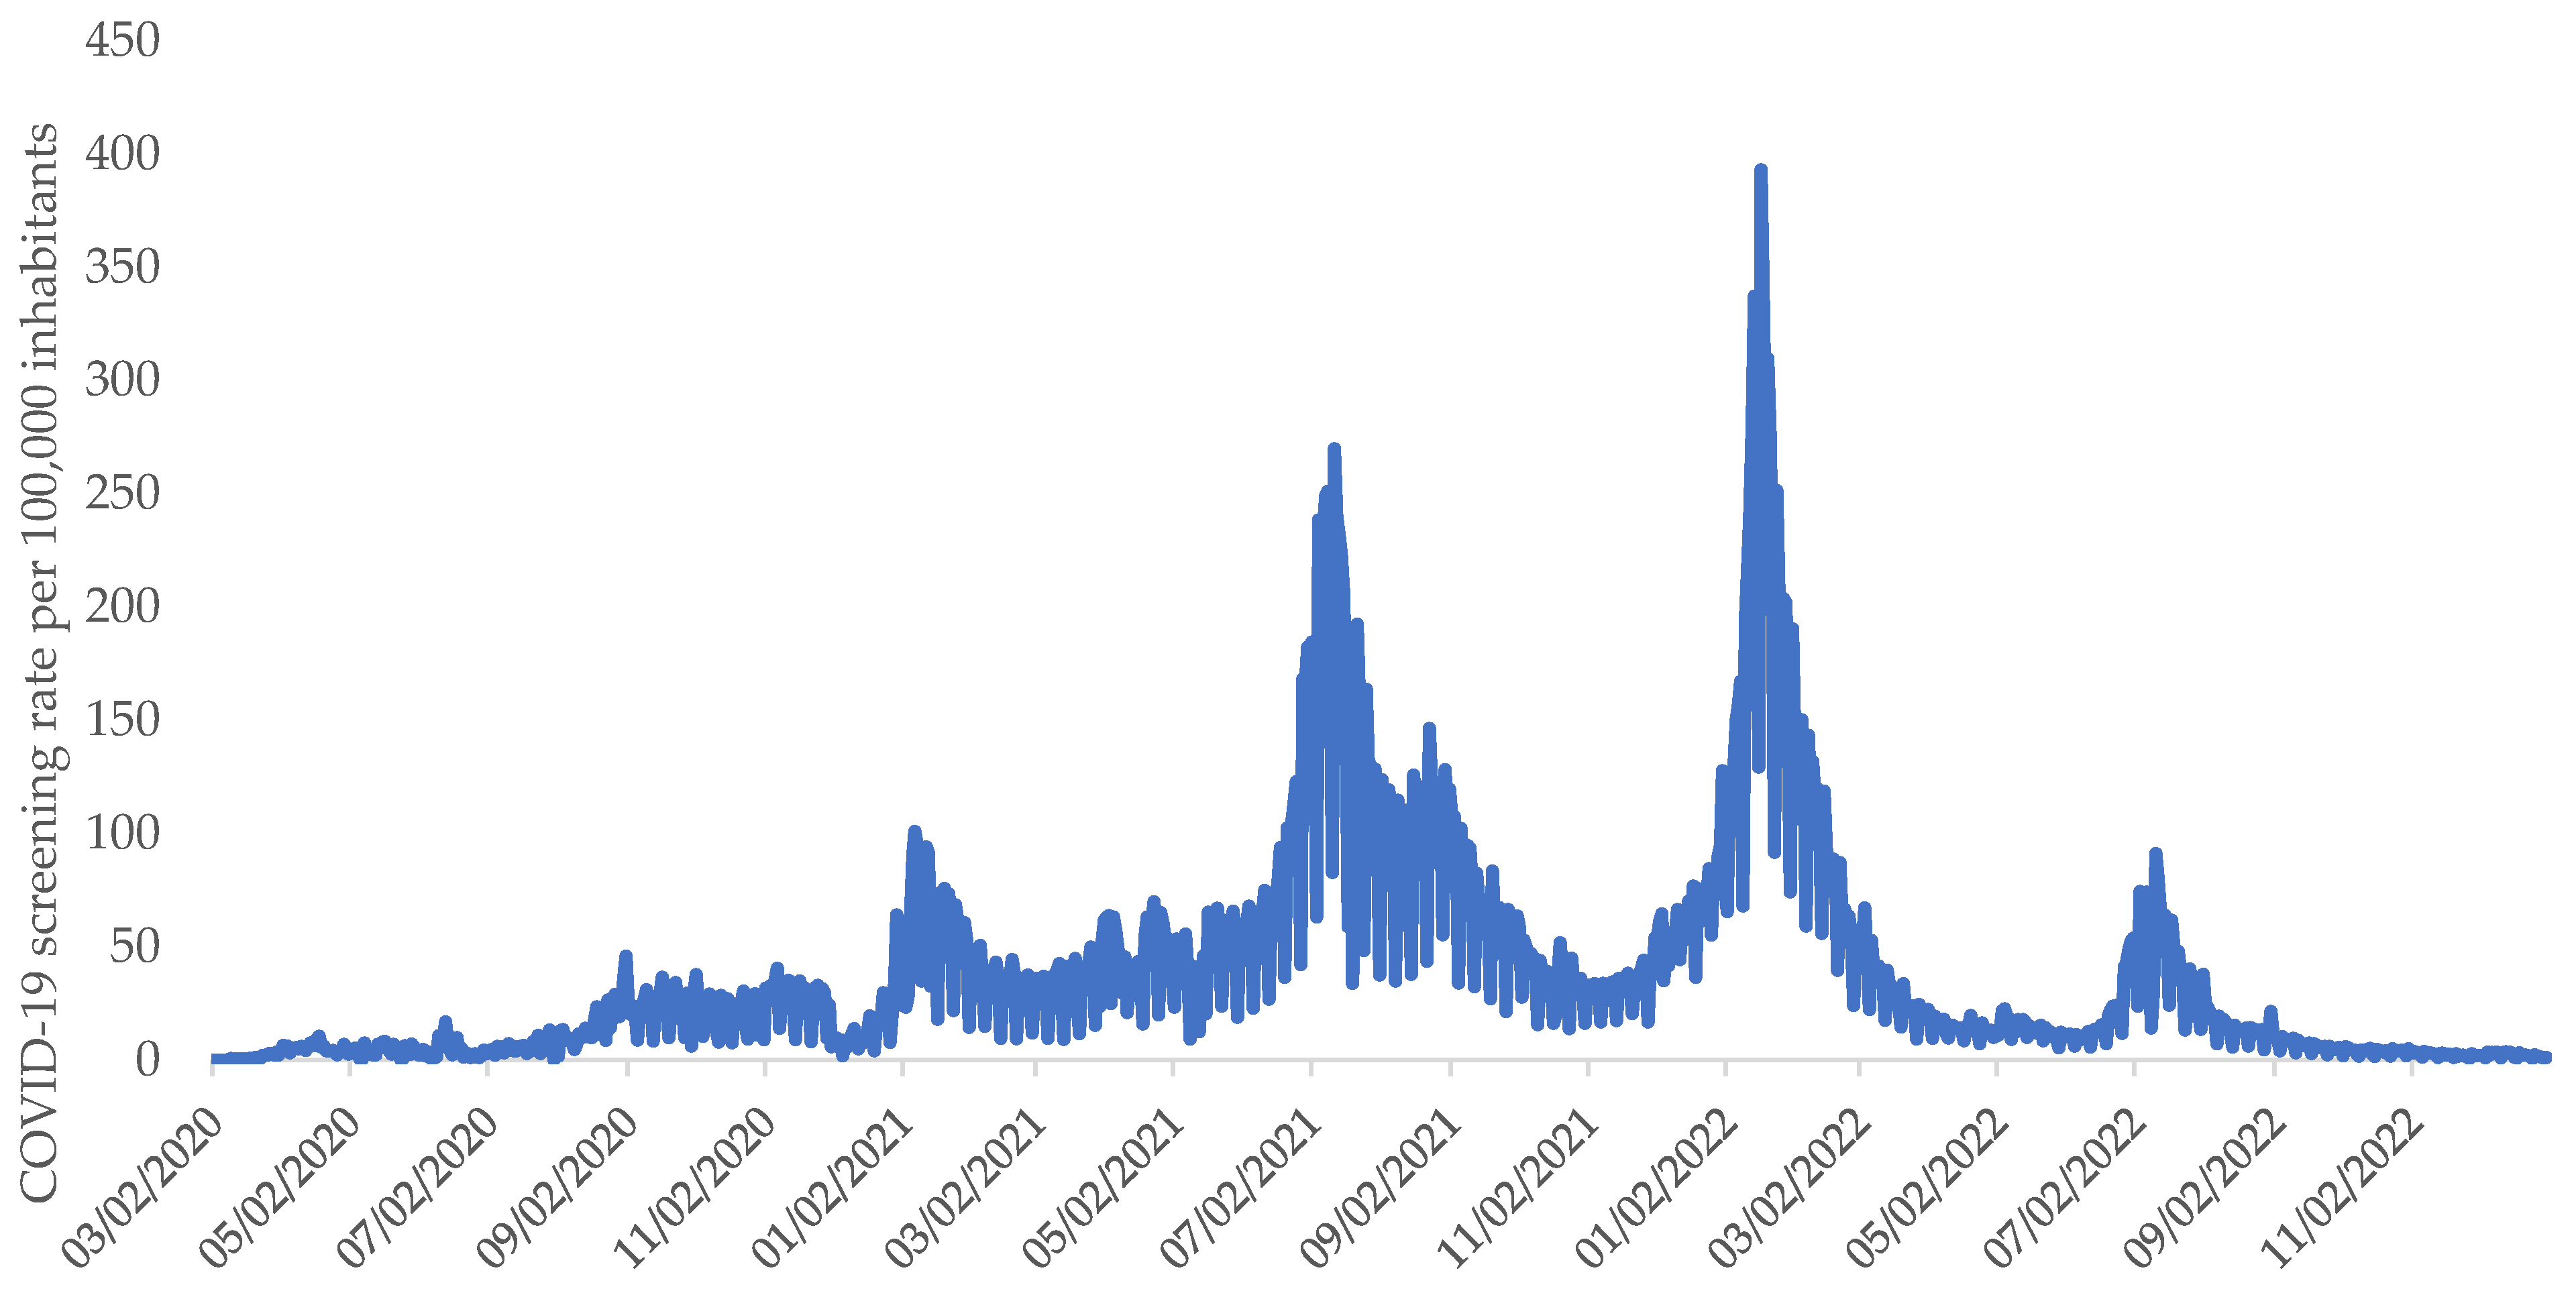
The first positive confirmed test was recorded on 2 March 2020. From that date until 31 December 2022, the total number of COVID-19 positive tests was 1,133,126 tests. The average national testing rate over the whole period was 38.23/100,000 inhabitants (Figure 3).
Table 1 shows the evolution of the average screening rate, positivity rate, incidence rate per 2-ISO-weeks and Rt by different phases and waves.

3.3. Demographic Characteristics of Confirmed Cases

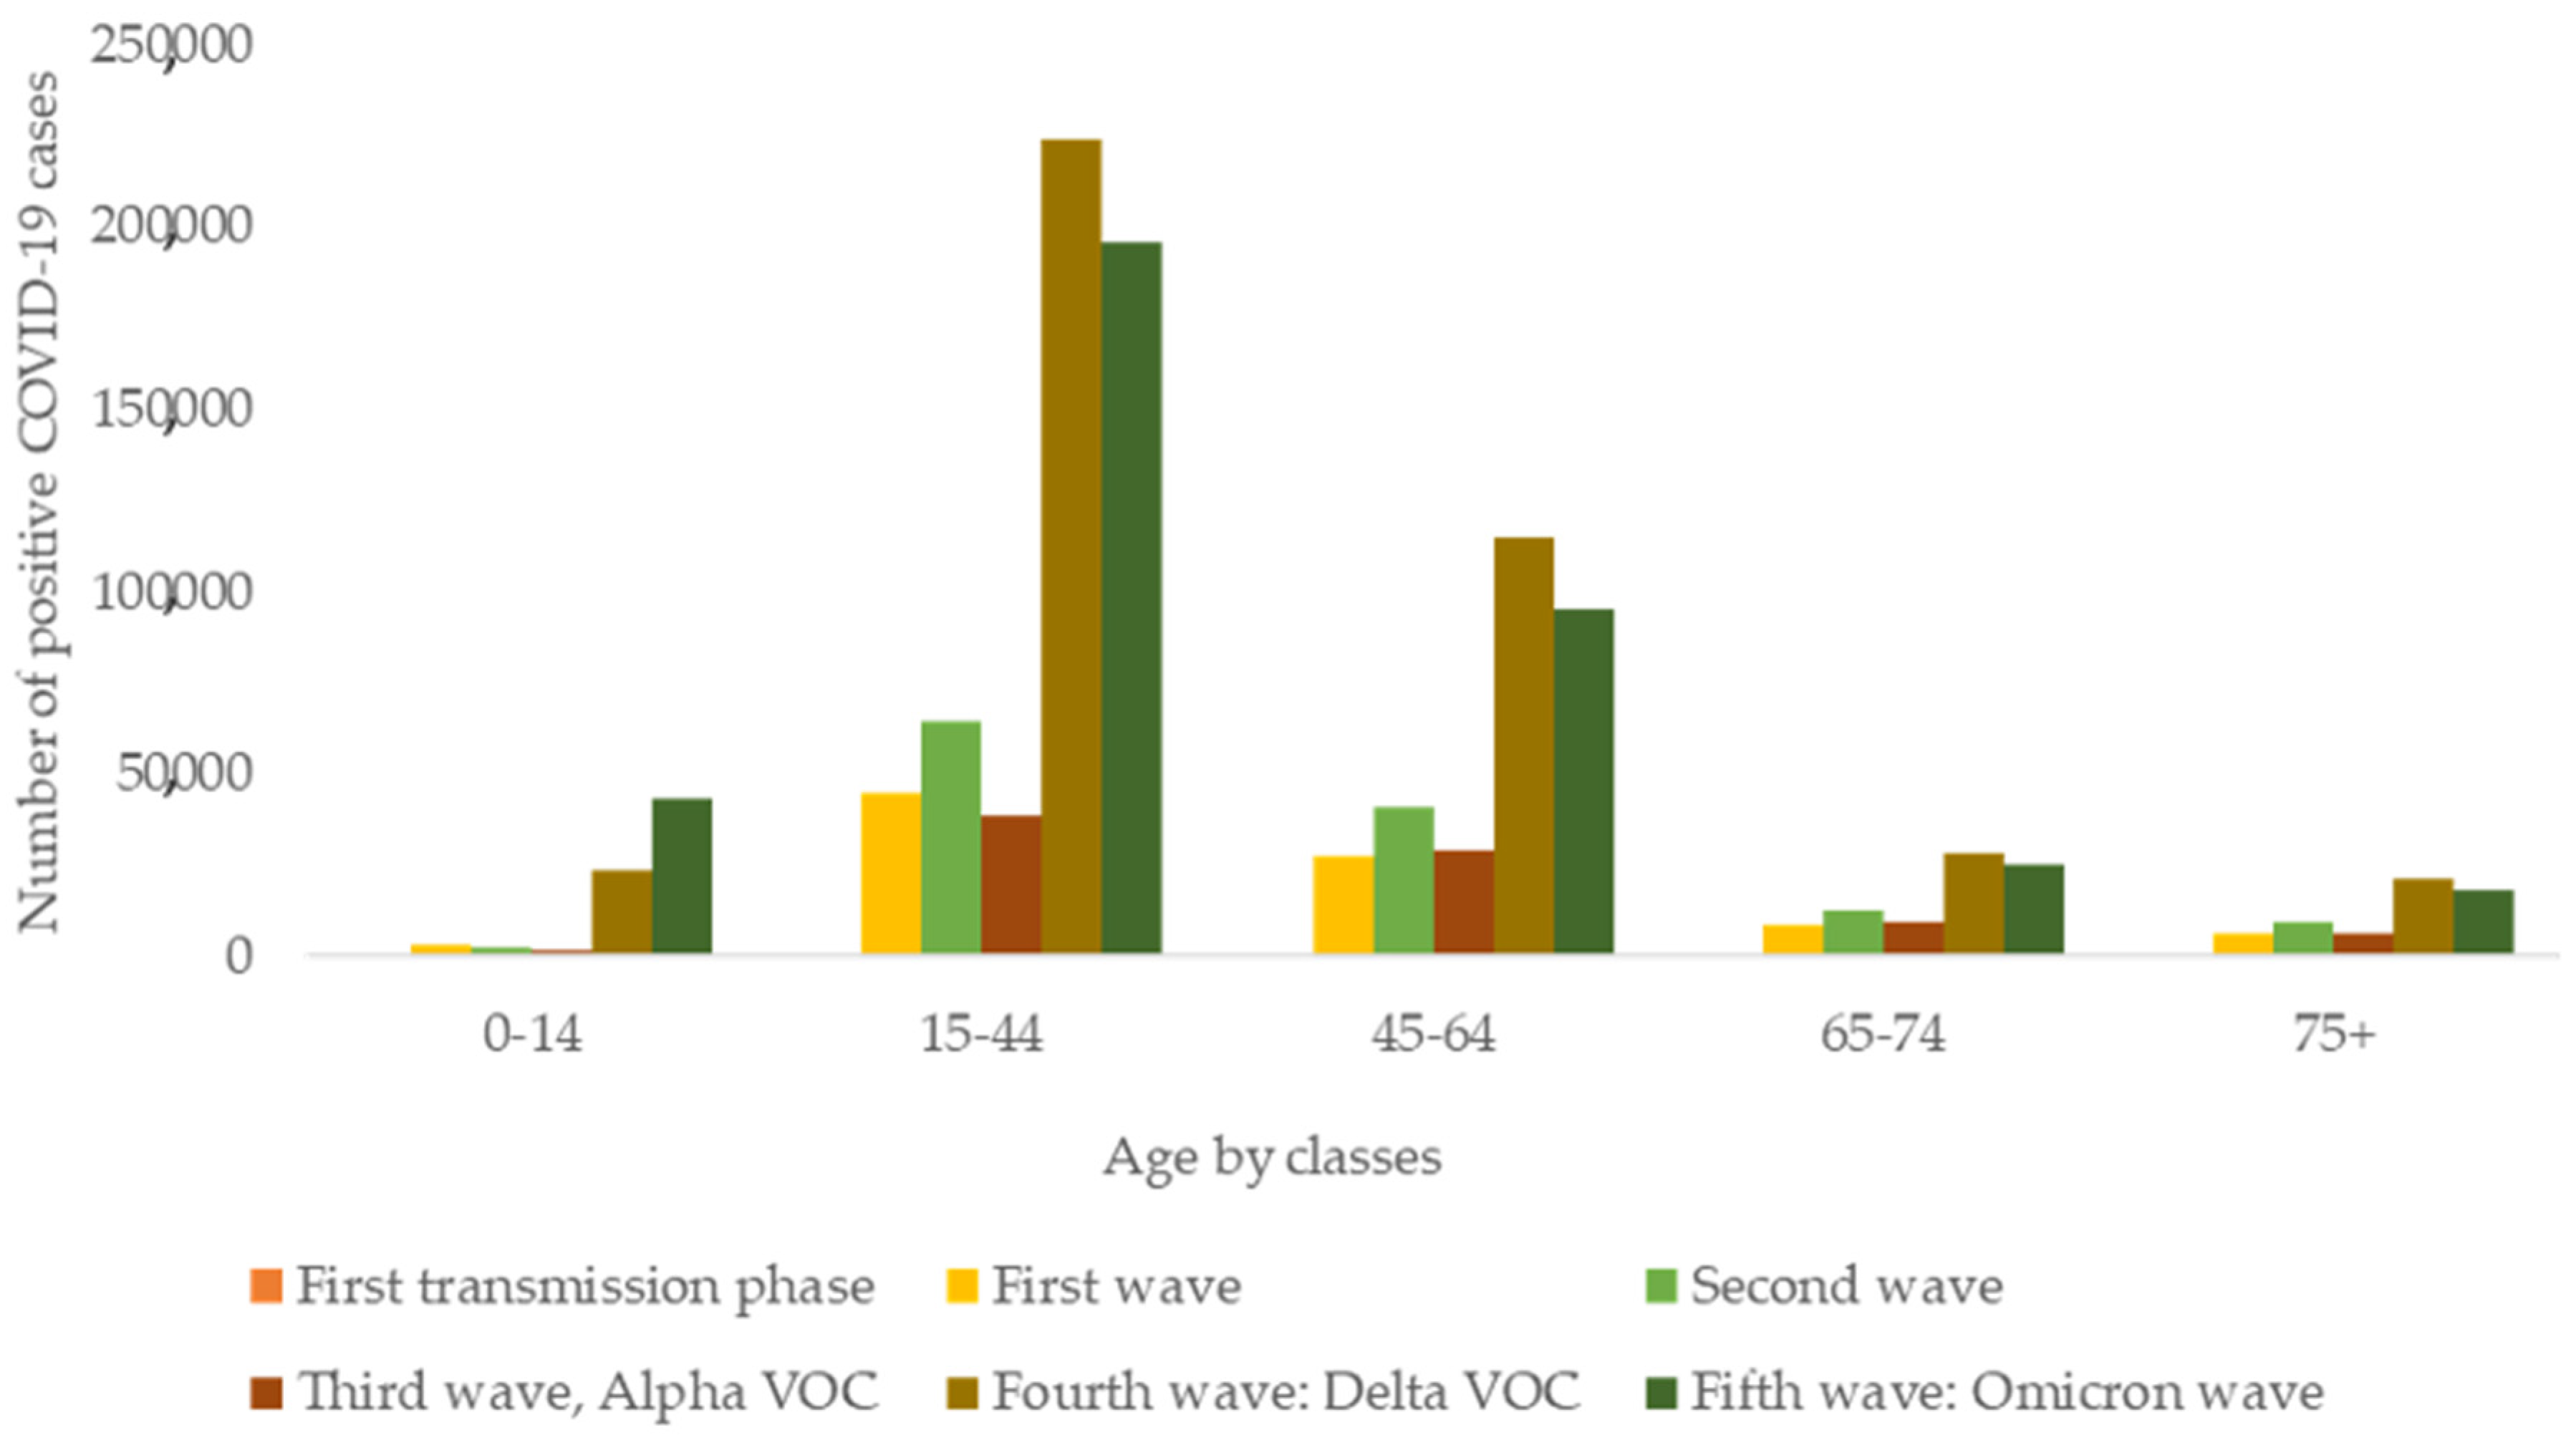
The cumulative national incidence rate was 8499.02/100,000 men and 10,333.89/100,000 women. The sex ratio (male/female) was 0.81. The most affected age group by COVID-19 (48.58%) was [15–44 years] (Figure 4). The mean age of confirmed- COVID-19 cases was 41.79 ± 18.96 years.

3.4. Temporal Dynamic of Each Epidemic Wave of the COVID-19 Outbreak in Tunisia

A.
Investigation of the fist COVID-19 transmission phase in Tunisia
From 2 March to 18 August 2020, the country experienced an initial phase of virus transmission.
During the first phase, incidence rate remained below 20/100,000 inhabitants. The weekly screening rate has varied between 0 and 16.93/100,000 inhabitants and remained below 15/100,000 inhabitants until August 2020.
Positivity rate during the first wave was 10.93% in March, reached its lowest level in June (2.32%) and then gradually increased from July (5.30%) and August (6.94%).
Rt during the first phase was the highest during the outbreak period. The mean was 1.76 [95% CI 1.67–1.86].
B.
Second phase, first wave
This wave was from 18 August to 13 December 2020. Screening rate during the first wave: increased from 106.46/100,000 inhabitants (W34/2020) to 216.43/100,000 inhabitants (W45/2020). Tunisia recorded a peak of 5367 tests carried out in one day on 1 September 2020.
After reaching its lowest levels in the first phase, the positivity rate gradually increased from July 2020 onwards, reaching 19.43% in September 2020 and 41.62% in October 2020. The rate then declined in November (35.04%) and December 2020 (20.26%).
C.
Second phase, second wave
This wave extended from 14 December 2020 (W51/2020) to 21 March 2021 (W11/2021). The incidence rate remained above 100 per 100,000 inhabitants.
The weekly screening rate increased by 6.9 times in 3 weeks. It increased from 72.03/100,000 inhabitants in W51/2020 to 498.28/100,000 inhabitants in W1/2021, reaching its highest level with a total of 58,340 tests performed in week W1/2021.
The average number of confirmed cases increased by 1.5 times between W51/2020 (20.31%) and W02/2021 (30.25%): on average, 245 confirmed cases were reported daily during W51/2020 vs. 2248 during W02/2021.
Rt exceeded 1.5 between 14 December 2020 and 6 January 2021.
D.
Second phase, third wave: national predominance of Alpha VOC
This third wave of the second phase of community transmission occurred between 22 March 2021 and 16 May 2021, marking the emergence and predominance of the new Alpha VOC (B.1.1.7). Incidence rate reached its highest level during W14-W15/2021 (239.46/100,000 inhabitants).
Screening rate during the Alpha VOC wave remained stable with an average of 34,713 tests per week. The highest number of daily tests performed reached 8185 tests on 23 April 2021.
Positivity rate increased progressively from 17.76% (W12/2021) to 27.84% (W16/2021) then decreased between W17 and W19 (21.92%).
E.
Second phase, fourth wave: national predominance of Delta VOC
This wave, lasted from 17 May 2021 to 26 December 2021. From week W39/2021, the national sequencing data showed a predominance of the Delta VOC, approaching 100%.
Incidence rates reached 881.92/100,000 inhabitants during W26-S27/2021 (July2021), then decreased from September 2021.
The screening rate peaked during week W27/2021 with 1468.51 tests/100,000 inhabitants/week. Since then, the screening rate declined by 85.76% between weeks W27 and W45/2021 (208.97/100,000 inhabitants/week).
The positivity rate reached its highest values (39.17% on 28 June 2021). The highest number of daily confirmed was 10,591 recorded on 5 July 2021.
Rt reached its highest levels (1.5) in July 2021.
F.
Second phase, fifth wave: national predominance of Omicron VOC
This wave began on 27 December 2021 (W52/2021) and its analysis continued until the study end-date with a predominance of the Omicron VOC.
In 2022, the incidence rate increased by 5.7 times, from 184.15/100,000 inhabitants (W52/2021-W01/2022) to 1060.71 (W02-W03/2022). Thereafter, the rate decreased lower than 100/100,000 inhabitants until June 2022.
The screening rate increased (from 912.30 in W01 to 1912.96/100,000 inhabitants in W03/2022).
The positivity rate peaked twice: 38.46% in W04/2022 and 53.98% in W27/2022.

4. Discussion

This study provides a comprehensive description of the evolution of the COVID-19 pandemic in Tunisia during its first three years, based on nationwide surveillance data collected prospectively between March 2020 and December 2022.
The findings highlight the existence of two distinct transmission phases and five epidemic waves associated with successive SARS-CoV-2 variants. The evolution of transmission indicators reflected both changes in viral characteristics and the implementation of public health and social measures, expansion of testing capacity, and progressive rollout of COVID-19 vaccination.
The epidemiological trajectory observed in Tunisia was broadly consistent with that reported in many countries worldwide. Following an initial phase characterized by imported cases and localized clusters, most countries subsequently experienced sustained community transmission associated with repeated epidemic waves. Similar patterns were reported in several Mediterranean and North African countries, including Morocco, Algeria, Egypt, Italy, Spain, and France, where the emergence of new variants and changes in population mobility contributed to successive increases in incidence rates and transmission intensity.
One of the major strengths of the Tunisian response was the early activation of the National Preparedness, Prevention, Response and Resilience Plan (2P2R) before the detection of the first confirmed case. This preparedness strategy facilitated the rapid implementation of surveillance, contact tracing, laboratory diagnosis, border control measures, and risk communication activities. Similar experiences have been reported in countries that rapidly implemented containment measures during the first months of the pandemic and successfully delayed widespread community transmission.
The global spread of COVID-19 has posed considerable challenges to all countries. Since then, countries have strengthened their surveillance systems and implemented measures to prevent, detect and investigate cases of SARS-CoV-2 infection [15,21,22].
The present study is, to our knowledge, the first nationwide longitudinal analysis describing the evolution of key COVID-19 transmission indicators in Tunisia over a three-year period. By relying on routinely collected surveillance data, it provides valuable insights into the temporal dynamics of SARS-CoV-2 transmission and the contribution of epidemiological surveillance to public health decision-making.
Our results described the evolution of transmission indicators over 3 years, from the first confirmed case in Tunisia to December 2022. This evolution is discussed in relation to several contributing factors, including the emergence of new variants, the impact of public health and social measures [22,23,24] and the introduction of COVD-19 vaccination [25,26].
A more complete epidemiological view of the pandemic in Tunisia would have been possible if this work had included indicators of severity such as hospitalisation rates, bed occupancy, mortality and indicators of vaccination. Other studies carried out by the national surveillance structure for COVID-19 in Tunisia have already been published on this subject [27,28].
The epidemic trajectory observed in Tunisia shared several characteristics with reports from France, Italy, and the United Kingdom, where successive epidemic waves were associated with the emergence of Alpha, Delta, and Omicron variants. However, differences in Rt evolution, positivity rates, and wave duration likely reflect country-specific testing strategies, public health measures, vaccination uptake, and sequencing capacity [16,21,24].
A.
Investigation of the fist COVID-19 transmission phase in Tunisia
During the first phase of the pandemic, Tunisia achieved its primary objective of preventing the healthcare system from becoming overwhelmed. Throughout this period, the screening rate remained relatively low due to the high cost of RT-PCR tests in private facilities and the centralisation of tests in third-line hospitals.
This screening rate was essentially based on contact tracing of the first cases. By the end of March 2020, three laboratories were equipped with RT-PCR kits (national microbiology laboratory at Charles Nicolle Hospital Tunis, virology laboratory at the Institut Pasteur Tunis and the microbiology laboratory at the Military training hospital Tunis). In May 2020, three other laboratories joined the national RT-PCR screening strategy (Habib Bourguiba Sfax University Hospital, Farhat Hached Sousse University Hospital and Fatouma Bourguiba Monastir University Hospital).
The positivity rate reached its highest levels during this initial phase (March 2020). During this period, the Tunisian government adopted a transparent communication strategy, providing regular updates through the Ministry of Health, maintaining a continuous presence in the media, and organising daily press briefings [16,29]. During this first transmission phase of the COVID-19 outbreak in Tunisia, the Tunisian government took the measures indicated in Table 2 [30].
These measures delayed the introduction of COVID-19 into Tunisia and slowed viral transmission during this initial phase. This enabled the health authorities to prepare for possible community transmission. From May 2020, these measures were scheduled to be relaxed, explaining the spread of imported cases and the increase in the number of new confirmed cases of COVID-19 between July and August 2020.
The relatively low incidence observed during the first transmission phase was comparable to the experience of several countries that implemented early border closures, mandatory quarantine measures, and strict lockdowns. Similar reductions in transmission were reported in New Zealand, Australia, and several East Asian countries, where rapid non-pharmaceutical interventions successfully delayed widespread community transmission. In contrast, countries that experienced delayed implementation of control measures reported substantially higher incidence and mortality during the first pandemic wave.
B.
Second phase, first wave
Following the summer season of 2020 and the authorisation of gatherings and public events, the country recorded a peak in positivity rates in October 2020 (41.62%). In response, a series of preventive measures were implemented, including the reinstatement of the night-time curfew (October–November 2020). These measures brought the outbreak under control and slowing viral transmission.
The government’s strategy focused on strengthening testing capacity. This was reflected by the introduction of RT-PCR testing in private laboratories in August 2020, and the involvement of the private sector in September 2020. The strategy also focused on improving laboratory capacity, active case finding and cluster investigations, and decentralizing testing services across the country.
The epidemiological evolution observed during this first epidemic wave was broadly consistent with that reported in several countries experiencing a resurgence following the relaxation of restrictions during the summer of 2020. Similar increases in incidence and positivity rates were described in France and Germany, where reopening of economic and social activities was followed by renewed viral transmission, prompting the reintroduction of public health and social measures to control the epidemic [22,29].
C.
Second phase, second wave
The number of COVID-19 tests increased from December2020 onwards, as a result of expanded laboratory capacity, the introduction of antigen rapid diagnostic tests in January2021 and the organisation of targeted screening campaigns [30,31].
Incidence rates increased due to the weakened application of measures related to “pandemic fatigue” and popular demotivation, particularly during the winter holiday season. On 12 January 2021, the Ministry of Health decided to imposed a nationwide lockdown to limit the SARS-CoV-2 spread. Following these measures, a remarkable drop in the number of daily cases was recorded from February2021 onwards, suggesting a positive impact of the reinforced control measures on viral transmission.
The increase in transmission observed during the winter of 2020–2021 was also reported across Europe and North America. Similar epidemic rebounds were observed in France, Germany, and the United Kingdom, where colder weather, increased indoor social interactions, and pandemic fatigue contributed to sustained community transmission despite ongoing control measures [22,29]. Although testing strategies differed between countries, the overall epidemic trajectory in Tunisia closely resembled the international pattern during this period.
D.
Second phase, third wave: predominance of Alpha VOC
The first mutant viral genome of COVID-19, named B.1.1.7, Alpha, had appeared in the United Kingdom since September 2020 [10,12,19]. In Tunisia, genomic surveillance began in March 2021, and retrospectively revealed a predominance of this Alpha variant between March and June 2021 [31].
Following the introduction of rapid antigen tests, the screening rate has reached high levels compared with previous waves; result of the availability of tests and public concern in response to the worldwide morbidity and mortality figures caused by the Alpha variant [9]. In addition, the requirement for travellers to undergo RT-PCR tests partly explained the increase in screening rate, particularly among asymptomatic population [29,30].
The elevated positivity rates were consistent with the widespread circulation and increased transmissibility the of the Alpha variant. In fact, asymptomatic subjects have largely contributed to the spread of the Alpha variant [10].
The start of the national COVID-19 vaccination campaign on 13 March 2021 coincided with the emergence of the Alpha VOC in Tunisia. The vaccination participated in limiting the incidence rates of SARS-CoV-2 infections associated with VOC Alpha [32].
Similar to observations in the United Kingdom and other European countries, the emergence of the Alpha variant in Tunisia was associated with a rapid replacement of previously circulating lineages and increased viral transmissibility [10,11,18]. Walker et al. reported that Alpha rapidly became dominant in the United Kingdom because of its substantial transmission advantage, a pattern that was subsequently observed in Tunisia through national genomic surveillance [10,31].
E.
Second phase, fourth wave: predominance of Delta VOC
In Tunisia the Delta VOC had rapidly become predominant in Tunisia since its emergence [31]. The screening rate was the highest due to the availability of rapid tests and the increase in demand for testing concomitant with the intensification of the virus’ circulation.
The Delta VOC demonstrated a significant transmission advantage over other SARS-CoV-2 VOCs [19,32]. A reduction in vaccine effectiveness was also reported following the emergence of delta VOC [33]. Positivity rates and the number of new confirmed cases reached their highest levels up to this point in the COVID-19 evolution. From September 2021 onwards, the acceleration of the vaccination campaign and the obligation to comply with social measures limited the viral circulation [24,25].
The Delta wave in Tunisia closely mirrored the experience reported worldwide. In India, the United Kingdom, France, and the United States, Delta rapidly displaced previously circulating variants and was associated with marked increases in transmission, incidence, and healthcare burden [18,24,33]. The sharp increase in positivity and incidence observed in Tunisia is therefore consistent with the enhanced transmissibility of the Delta variant reported internationally.
F.
Second phase, fifth wave: national predominance of Omicron VOC
Over time, SARS-CoV-2 has naturally continued to mutate, leading to the emergence of Omicron variant. By 2022, this variant and its descendant lineages were predominant worldwide and in Tunisia [31,34].
The high positivity rates raised concerns about the increased transmissibility of this VOC. However, the positivity rate could also be influenced by various factors, including testing availability and the underlying prevalence of infection in the population [35].
Despite the implementation of COVID-19 vaccination in Tunisia and the completion of the primary vaccination and booster doses the country recorded the highest levels of positivity and incidence. The vaccination strategy did not have a significant impact on viral transmissibility, but it has had a positive impact on the severity of the disease, notably by reducing hospitalisation and death rates [28].
The epidemiological characteristics of the Omicron wave in Tunisia were comparable to those described internationally. Several countries experienced unprecedented numbers of reported infections following the emergence of Omicron because of its high transmissibility and immune escape capacity [11,18,34]. Nevertheless, despite the sharp increase in incidence, many countries reported proportionally fewer severe cases and deaths than during previous waves, largely reflecting increasing population immunity through vaccination and previous infection, a pattern also observed in Tunisia [28,32,34].

4.1. Comparison of the Tunisian Epidemic Dynamic with International Experience

Overall, the epidemic trajectory observed in Tunisia was broadly consistent with that reported in many countries, with successive epidemic waves corresponding to the emergence and replacement of major SARS-CoV-2 variants, including Alpha, Delta, and Omicron [11,18,31]. Similar patterns were observed in European countries such as the United Kingdom, France, and Germany, where increased transmission periods were associated with the emergence of more transmissible variants and were followed by declines after reinforcement of public health measures and increasing population immunity [10,22,24,29]. Data-driven analyses from other settings have similarly demonstrated that government interventions, including restrictions on mobility and social interactions, contributed to reductions in SARS-CoV-2 transmission [36]. Although the timing and magnitude of epidemic waves differed between countries due to variations in testing strategies, surveillance capacity, vaccination coverage, and population behavior, Tunisia implemented response strategies comparable to those adopted internationally, including expansion of diagnostic capacity, reinforcement of non-pharmaceutical interventions, vaccination campaigns, and strengthening of genomic surveillance [22,29,30,31]. Despite differences in national contexts, the overall evolution of COVID-19 transmission in Tunisia followed the global pattern observed during the first three years of the pandemic.

4.2. Strengths and Limitations

This study has several strengths. First, it was based on nationwide surveillance data collected prospectively over nearly three years, covering all reported laboratory-confirmed COVID-19 cases in Tunisia. Second, the use of multiple transmission indicators, including incidence, positivity rate, screening rate, and effective reproduction number (Rt), allowed a comprehensive assessment of epidemic dynamics. Third, the integration of genomic surveillance data enabled the characterization of epidemic waves according to the predominant circulating variants.
Nevertheless, several limitations should be acknowledged. The findings relied on routine surveillance data and may therefore be affected by underreporting, particularly during periods of limited testing capacity and among asymptomatic individuals. Changes in testing strategies over time may have influenced observed incidence and positivity rates. In addition, this study focused primarily on transmission indicators and did not include indicators of disease severity, such as hospitalization rates, intensive care unit admissions, mortality, or vaccination coverage. Finally, the ecological nature of the analyses precludes causal inference regarding the individual effects of public health measures or vaccination on transmission dynamics.
This study has several limitations inherent to surveillance-based analyses. Reported cases may underestimate the true burden of infection due to changes in testing strategies, limited detection of asymptomatic or mild infections, and variations in access to diagnostic testing over time. In addition, reporting delays and improvements in surveillance capacity may have influenced temporal trends in the observed indicators.

4.3. Public Health Implications

The COVID-19 pandemic highlighted the critical role of epidemiological surveillance in supporting evidence-based public health decision-making. In Tunisia, continuous monitoring of transmission indicators, including incidence rates, positivity rates, testing rates, and the effective reproduction number (Rt), enabled health authorities to assess the evolving epidemiological situation and to adapt prevention and control measures according to the level of transmission and the emergence of new variants.
The findings of this study emphasize the importance of maintaining robust surveillance systems capable of integrating epidemiological, laboratory, genomic, and vaccination data in real time. The successive emergence of Alpha, Delta, and Omicron variants demonstrated the need for sustained genomic surveillance to rapidly detect changes in viral circulation and to anticipate their potential impact on transmission dynamics and healthcare services.
The pandemic also revealed several operational challenges related to data management, intersectoral coordination, and information sharing. Strengthening digital health infrastructure through the implementation of integrated and interoperable surveillance platforms would facilitate real-time data exchange, improve data quality, and enhance the timeliness of outbreak detection and response. The adoption of unique health identifiers and strengthened electronic reporting systems could further improve case tracking and epidemiological analyses during future public health emergencies.
In addition, regular evaluations of surveillance system performance should be conducted to identify strengths and gaps in preparedness and response capacities. Continued assessment of vaccine effectiveness, particularly in the context of emerging variants, remains essential for interpreting epidemiological trends and informing vaccination policies.
The lessons learned from the COVID-19 pandemic should contribute to strengthening national preparedness for future emerging and re-emerging infectious diseases [30]. Investments in workforce capacity, laboratory networks, risk communication, digital health technologies, and multisectoral coordination mechanisms will be essential to enhance the resilience of the Tunisian health system and its ability to respond rapidly to future public health threats.

5. Conclusions

This nationwide longitudinal study provides a comprehensive overview of the evolution of the COVID-19 pandemic in Tunisia during its first three years, from March 2020 to December 2022. The epidemic evolved through two major transmission phases and five successive epidemic waves associated with the emergence and predominance of different SARS-CoV-2 variants.
The analysis of key transmission indicators revealed substantial temporal variations in incidence, testing activity, positivity rates, and transmission intensity throughout the study period. These variations reflected the combined effects of viral evolution, public health and social measures, testing strategies, and the progressive implementation of COVID-19 vaccination.
The findings demonstrate the pivotal contribution of epidemiological and genomic surveillance to the monitoring of epidemic dynamics and the adaptation of public health interventions. The Tunisian experience underscores the value of integrated surveillance systems, timely risk assessment, and evidence-based decision-making in managing large-scale public health emergencies.
The lessons learned from COVID-19 should serve as a foundation for strengthening preparedness, surveillance, and response capacities for future epidemics and pandemics, thereby improving the resilience of the health system and protecting population health.

Author Contributions

Conceptualization: N.B.B.A.; Methodology: All team; Data curation: E.M., A.H., H.L., S.D. (Sonia Dhaouadi), M.S., R.M., M.O., K.T., A.Z., K.O., N.E., A.Y., L.B., S.D. (Sondes Derouiche), S.B., M.K.C. and N.B.B.A.; Formal analysis: K.T., A.Z., K.O. and A.Y.; Visualization: E.M., A.H., N.B.B.A.; Writing—original draft preparation: E.M. and A.H.; Writing—review and editing: E.M., A.H. and N.B.B.A. All authors have read and agreed to the published version of the manuscript.

Funding

This research received no external funding.

Institutional Review Board Statement

The study was conducted in accordance with the Declaration of Helsinki. The use of anonymized surveillance data for public health monitoring and research purposes during the COVID-19 pandemic was authorized by the National Authority for the Protection of Personal Data. The study protocol was reviewed and approved by the relevant Data Protection Committee (Approval Number: 20/02-5077—Approval Date: 16 May 2020).

Informed Consent Statement

Informed consent was not applicable because this study used routinely collected, anonymized surveillance data and did not involve direct interaction with participants or collection of identifiable personal information.

Data Availability Statement

All data is available in the ONMNE bases.

Acknowledgments

All acknowledgements to all members of the National Observatory of New and Emerging Diseases (ONMNE) for their unwavering commitment and invaluable contributions to COVID-19 surveillance, data management, epidemiological investigations, and response activities throughout the pandemic. We also express our sincere appreciation to all staff members of the regional sanitary directions across Tunisia for their dedication and collaborative efforts in implementing public health measures and supporting the national response. Finally, we pay tribute to all healthcare professionals, frontline workers, and COVID-19 survivors in Tunisia, whose resilience and experiences have shaped the country’s response to this unprecedented public health crisis.

Conflicts of Interest

The authors declare no conflicts of interest.

Abbreviations

The following abbreviations are used in this manuscript:
COVID-19Coronavirus Disease 2019
SARS-CoV-2Severe Acute Respiratory Syndrome Coronavirus 2
WHOWorld Health Organization
PHEICPublic Health Emergency of International Concern
2P2RThe National Preparedness, Prevention, Response, and Resilience Plan
RtEffective reproduction number
VOCVariant of concern
ONMNENational Observatory of New and Emerging Diseases
Rt-PCRreverse transcription polymerase chain reaction
RDTrapid diagnostic test
95% CI95% Confidence Interval

References

  1. European Centre for Disease Prevention and Control. ECDC Risk Assessment: Outbreak of Acute Respiratory Syndrome Associated with a Novel Coronavirus, Wuhan, China; First Update; European Centre for Disease Prevention and Control: Solna, Sweden, 2020. [Google Scholar]
  2. World Health Organization. WHO-Convened Global Study of Origins of SARS-CoV-2: China Part [Report]; World Health Organization: Geneva, Switzerland, 2021. [Google Scholar]
  3. Koh, J.; Shah, S.U.; Chua, P.E.Y.; Gui, H.; Pang, J. Epidemiological and Clinical Characteristics of Cases During the Early Phase of COVID-19 Pandemic: A Systematic Review and Meta-Analysis. Front. Med. 2020, 7, 295. [Google Scholar] [CrossRef] [PubMed] [PubMed Central]
  4. Zhukova, A.; Blassel, L.; Lemoine, F.; Morel, M.; Voznica, J.; Gascuel, O. Origin, evolution and global spread of SARS-CoV-2. Comptes Rendus Biol. 2021, 344, 57–75. [Google Scholar] [CrossRef]
  5. Organisation Mondiale de la Santé. Déclaration sur la Deuxième Réunion du Comité D’urgence du Règlement Sanitaire International (2005) Concernant la Flambée de Nouveau Coronavirus 2019 (2019-nCoV); Organisation Mondiale de la Santé: Geneva, Switzerland, 2020. [Google Scholar]
  6. Sohrabi, C.; Alsafi, Z.; O’Neill, N.; Khan, M.; Kerwan, A.; Al-Jabir, A.; Iosifidis, C.; Agha, R. World Health Organization declares global emergency: A review of the 2019 novel coronavirus (COVID-19). Int. J. Surg. 2020, 76, 71–76. [Google Scholar] [CrossRef] [PubMed] [PubMed Central]
  7. Cucinotta, D.; Vanelli, M. WHO Declares COVID-19 a Pandemic. Acta Bio-Medica Atenei Parm. 2020, 91, 157–160. [Google Scholar] [CrossRef] [PubMed] [PubMed Central]
  8. Eastin, C.; Eastin, T. Clinical Characteristics of Coronavirus Disease 2019 in China. J. Emerg. Med. 2020, 58, 711–712. [Google Scholar] [CrossRef] [PubMed Central]
  9. Lauring, A.S.; Hodcroft, E.B. Genetic Variants of SARS-CoV-2-What Do They Mean? JAMA 2021, 325, 529–531. [Google Scholar] [CrossRef] [PubMed]
  10. Walker, A.S.; Vihta, K.D.; Gethings, O.; Pritchard, E.; Jones, J.; House, T.; Bell, I.; Bell, J.I.; Newton, J.N.; Farrar, J.; et al. Tracking the Emergence of SARS-CoV-2 Alpha Variant in the United Kingdom. N. Engl. J. Med. 2021, 385, 2582–2585. [Google Scholar] [CrossRef] [PubMed] [PubMed Central]
  11. Wolf, J.M.; Wolf, L.M.; Bello, G.L.; Maccari, J.G.; Nasi, L.A. Molecular evolution of SARS-CoV-2 from December 2019 to August 2022. J. Med. Virol. 2023, 95, e28366. [Google Scholar] [CrossRef] [PubMed] [PubMed Central]
  12. Walensky, R.P.; Walke, H.T.; Fauci, A.S. SARS-CoV-2 Variants of Concern in the United States—Challenges and Opportunities. JAMA 2021, 325, 1037–1038. [Google Scholar] [CrossRef] [PubMed]
  13. Lina, B. Les différentes phases de l’évolution moléculaire et antigénique des virus SARS-CoV-2 au cours des 20 mois suivant son émergence. Bull. Acad. Natl. Med. 2022, 206, 87–99. [Google Scholar] [CrossRef] [PubMed] [PubMed Central]
  14. Agrawal, S.; Goel, A.D.; Gupta, N. Emerging prophylaxis strategies against COVID-19. Monaldi Arch. Chest Dis. 2020, 90. [Google Scholar] [CrossRef] [PubMed]
  15. Intawong, K.; Olson, D.; Chariyalertsak, S. Application technology to fight the COVID-19 pandemic: Lessons learned in Thailand. Biochem. Biophys. Res. Commun. 2021, 534, 830–836. [Google Scholar] [CrossRef] [PubMed]
  16. Tambo, E.; Djuikoue, I.C.; Tazemda, G.K.; Fotsing, M.F.; Zhou, X.N. Early stage risk communication and community engagement (RCCE) strategies and measures against the coronavirus disease 2019 (COVID-19) pandemic crisis. Glob. Health J. 2021, 5, 44–50. [Google Scholar] [CrossRef] [PubMed]
  17. Observatoire National des Maladies Nouvelles et Emergentes. COVID-19 en Tunisie Point de Situation a la Date du 14 Mai 2020; ONMNE: Tunis, Tunisia, 2020; p. 4. [Google Scholar]
  18. Choi, J.Y.; Smith, D.M. SARS-CoV-2 Variants of Concern. Yonsei Med. J. 2021, 62, 961–968. [Google Scholar] [CrossRef] [PubMed] [PubMed Central]
  19. World Health Organization. Considerations in Adjusting Public Health and Social Measures in the Context of COVID-19: Interim Guidance; World Health Organization: Geneva, Switzerland, 2020; Available online: https://www.who.int/publications/i/item/considerations-in-adjusting-public-health-and-social-measures-in-the-context-of-covid-19-interim-guidance (accessed on 11 November 2023).
  20. Talmoudi, K.; Safer, M.; Letaief, H.; Hchaichi, A.; Harizi, C.; Dhaouadi, S.; Derouiche, S.; Bouaziz, I.; Gharbi, D.; Najar, N.; et al. Estimating transmission dynamics and serial interval of the first wave of COVID-19 infections under different control measures: A statistical analysis in Tunisia from February 29 to May 5, 2020. BMC Infect. Dis. 2020, 20, 914. [Google Scholar] [CrossRef] [PubMed]
  21. Siddiquea, B.N.; Shetty, A.; Bhattacharya, O.; Afroz, A.; Billah, B. Global epidemiology of COVID-19 knowledge, attitude and practice: A systematic review and meta-analysis. BMJ Open 2021, 11, e051447. [Google Scholar] [CrossRef] [PubMed] [PubMed Central]
  22. Talic, S.; Shah, S.; Wild, H.; Gasevic, D.; Maharaj, A.; Ademi, Z.; Li, X.; Xu, W.; Mesa-Eguiagaray, I.; Rostron, J.; et al. Effectiveness of public health measures in reducing the incidence of covid-19, SARS-CoV-2 transmission, and covid-19 mortality: Systematic review and meta-analysis. Br. Med. J. 2021, 375, e068302. [Google Scholar] [CrossRef] [PubMed] [PubMed Central]
  23. Contreras, G.W. Getting ready for the next pandemic COVID-19: Why we need to be more prepared and less scared. J. Emerg. Manag. 2020, 18, 87–89. [Google Scholar] [CrossRef] [PubMed]
  24. Grubaugh, N.D.; Hodcroft, E.B.; Fauver, J.R.; Phelan, A.L.; Cevik, M. Public health actions to control new SARS-CoV-2 variants. Cell 2021, 184, 1127–1132. [Google Scholar] [CrossRef] [PubMed] [PubMed Central]
  25. Mziou, E.; Hchaichi, A.; Letaief, H.; Dhaouadi, S.; Safer, M.; Talmoudi, K.; Mhadhbi, R.; Elmili, N.; Bouabid, L.; Derouiche, S.; et al. Vaccine effectiveness against COVID-19: A test negative case-control study in Tunisia, August 2021. Vaccine 2024, 42, 1738–1744. [Google Scholar] [CrossRef] [PubMed]
  26. Fourati, A. Evaluation of COVID-19 Vaccine Effectivness in Tunisia, September 2021–September 2023 [Internet]. Faculté de médecine de Sfax. 2024. Available online: https://www.medecinesfax.org/fra/catalogue_theses/ (accessed on 12 December 2024).
  27. Dhaouadi, S.; Hechaichi, A.; Letaief, H.; Safer, M.; Mziou, E.; Talmoudi, K.; Borgi, C.; Chebbi, H.; Somrani, N.; Ali, M.B.; et al. Caractéristiques cliniques et épidémiologiques des décès COVID-19 en Tunisie avant l’émergence des VOCs (mars 2020-février 2021). Pan Afr. Med. J. 2022, 43, 172. [Google Scholar] [CrossRef] [PubMed] [PubMed Central]
  28. Mhedhebi, R.; Dhaouadi, S.; Alaya, N.B.; Hechaichi, A.; Zouayti, A.; Letaief, H.; Safer, M.; Borji, C.; Mziou, E.; Youssef, F.; et al. Epidemiological profile of covid-19 deaths in tunisia, 2020–2022. Popul. Med. 2023, 5, A448. [Google Scholar] [CrossRef]
  29. Laffet, K.; Haboubi, F.; Elkadri, N.; Nohra, R.G.; Rothan-Tondeur, M. The Early Stage of the COVID-19 Outbreak in Tunisia, France, and Germany: A Systematic Mapping Review of the Different National Strategies. Int. J. Environ. Res. Public Health 2021, 18, 8622. [Google Scholar] [CrossRef] [PubMed]
  30. Ben Alaya, N.B.; Letaief, H.; Hechaichi, A.; Safer, M.; Dhaouadi, S.; Mziou, E.; Ben Yousef, F.; Derouiche, S.; Mhadhbi, R.; Bouabid, L.; et al. Lessons learned from Tunisia prevention, preparedness, response and resilience to COVID-19 pandemic. Popul. Med. 2023, 5, A402. [Google Scholar] [CrossRef]
  31. Safer, M.; Kalai, W.; Neffati, A.; Hchaichi, A.; Dhaouadi, S.; Letaief, H.; Youssef, F.; Mziou, E.; Bougatef, S.; Bouabid, L.; et al. Genomic surveillance of sars-cov-2 in tunisia: January 2021-december 2022. Popul. Med. 2023, 5, A544. [Google Scholar] [CrossRef]
  32. Eyre, D.W.; Taylor, D.; Purver, M.; Chapman, D.; Fowler, T.; Pouwels, K.B.; Walker, A.S.; Peto, T.E. Effect of Covid-19 Vaccination on Transmission of Alpha and Delta Variants. N. Engl. J. Med. 2022, 386, 744–756. [Google Scholar] [CrossRef] [PubMed] [PubMed Central]
  33. Kirola, L. Genetic emergence of B.1.617.2 in COVID-19. New Microbes New Infect. 2021, 43, 100929. [Google Scholar] [CrossRef] [PubMed] [PubMed Central]
  34. Mohseni Afshar, Z.; Tavakoli Pirzaman, A.; Karim, B.; Rahimipour Anaraki, S.; Hosseinzadeh, R.; Sanjari Pireivatlou, E.; Babazadeh, A.; Hosseinzadeh, D.; Miri, S.R.; Sio, T.T.; et al. SARS-CoV-2 Omicron (B.1.1.529) Variant: A Challenge with COVID-19. Diagn 2023, 13, 559. [Google Scholar] [CrossRef] [PubMed] [PubMed Central]
  35. Ray, S.K.; Mukherjee, S. The Emergence of Omicron SARS-CoV-2 Variant (B.1.1.529): The Latest Episode in the COVID-19 Pandemic with a Global Riposte. Infect. Disord. Drug Targets 2022, 22, 14–20. [Google Scholar] [CrossRef] [PubMed]
  36. Fang, Y.; Nie, Y.; Penny, M. Transmission dynamics of the COVID-19 outbreak and effectiveness of government interventions: A data-driven analysis. J. Med. Virol. 2020, 92, 645–659. [Google Scholar] [CrossRef] [PubMed] [PubMed Central]
Figure 1. COVID-19 national epidemic curve, Tunisia, 2 March 2020 to 31 December 2022.
Covid 06 00133 g001
Figure 2. COVID-19 national weekly incidence rate, Tunisia, March 2020, December 2022.
Covid 06 00133 g002
Figure 3. Variation in the COVID-19 national screening rate in Tunisia, 2 March 2020 to 31 December 2022.
Covid 06 00133 g003
Figure 4. Age distribution of COVID-19 confirmed cases in Tunisia by phases and waves, 2 March 2020 to 31 December 2022.
Covid 06 00133 g004
Table 1. Evolution of transmission indicators by different phases and waves during the COVID-19 outbreak in Tunisia 2020–2022.
Phases and Waves of the COVID-19 Tunisian OutbreakPredominant Variant Duration (Weeks)Average Screening Rate
(/100,000 Inhabitants)
Average Positivity Rate
(%)
Incidence Rate
(/2 Weeks
/100,000 Inhabitants)
Average Effective Reproduction Number
[95% Confidence Interval]
First transmission phaseancestral lineage246.38 4.81%3.081.76
[1.67–1.86]
Second transmission phaseFirst wave20A (EU2) 20E (EU1) 1722.0627.74%68.451.02
[0.10–1.03]
Second wave20A (EU2) 20E (EU1)1339.8720.94%133.821.15
[1.14–1.16]
Third waveAlpha VOC0842.3523.22%139.761.08
[1.07–1.09]
Fourth waveDelta VOC2077.1516.09%367.281.04
[0.03–1.05]
Fifth waveOmicron wave-37.7614.56%141.220.96
[0.93–0.98]
VOC: Variant of concern.
Table 2. Measures taken by the Tunisian government during the first transmission phase of the COVID-19 outbreak in Tunisia (2 March until 17 August 2020).
Measures Taken by the Tunisian GovernmentDate
Indication of the systematic quarantine of all passengers arriving from China or other high-risk areas22 January 2020
Suspension of shipping services from northern Italy4 March 2020
Closure of schools and universities12 March 2020
Cancellation of sporting events16 March 2020
Total closure of borders17 March 2020
General lockdown declared22 March 2020
General lockdown extended31 March 2020
Disclaimer/Publisher’s Note: The statements, opinions and data contained in all publications are solely those of the individual author(s) and contributor(s) and not of MDPI and/or the editor(s). MDPI and/or the editor(s) disclaim responsibility for any injury to people or property resulting from any ideas, methods, instructions or products referred to in the content.