Article

SARS-CoV-2 Infection Epidemiology Changes During Three Years of Pandemic in a Region in Central India

State Level Viral Research and Development Laboratory (SVRDL), Department of Microbiology, Government Medical College, Nagpur 440003, Maharashtra, India
*
Author to whom correspondence should be addressed.
COVID 2025, 5(8), 125; https://doi.org/10.3390/covid5080125
Submission received: 14 April 2025 / Revised: 13 May 2025 / Accepted: 21 May 2025 / Published: 4 August 2025
(This article belongs to the Special Issue COVID and Public Health)

Abstract

Background: The surge in COVID-19 cases during the pandemic created a disease burden. An epidemiological study on COVID-19 is required as not much is known about the impact of containment and mitigation on health. We aimed to compare the epidemiological features during the years of the COVID-19 pandemic in the Vidarbha region in Maharashtra, India, to understand the epidemiology changes throughout the pandemic’s progression. Method: All of the cases reported at our testing centers in Nagpur and its periphery during the three years of the pandemic (i.e., from February 2020 to December 2022) were included. Descriptive analyses of variables of interest and statistical measures were compared. Results: There were 537,320 tests recorded during the study period. Of these, 13,035 (13.29%), 42,909 (13.70%), and 19,936 (15.91%) tested positive in 2020, 2021, and 2022, respectively. Hospitalization decreased from 2020 to 2022. An age group shift from 45 to 16–30 years over the pandemic was noticed. Seasonally, positivity peaked in September (27.04%) in 2020, in April (43.4%) in 2021, and in January in 2022 (35.30%). The estimated case fatality ratio was highest in 2021 (36.68%) over the three years in the hospital setting. Conclusion: Understanding the changing epidemiology of SARS-CoV-2 strengthens our perceptive of this disease, which will aid in improving the healthcare system in terms of both controlling and preventing the spread of COVID-19.

1. Introduction

The severe acute respiratory syndrome coronavirus 2 (SARS-CoV-2), a causative agent of coronavirus disease (COVID-19), emerged in Wuhan, China, in December 2019 [1,2] and produced one of the worst pandemics in human history [3]. Every country was affected and suffered badly [4]. India reported the first confirmed case of SARS-CoV-2 on 30 January 2020, a medical student resident of Kerala, who had recently crossed the international border from Wuhan, China [5]. Subsequently, the SARS-CoV-2 infection spread throughout the nation, travelling from state to state [6].
Globally, as of March 2023, 761,402,282 confirmed SARS-CoV-2 cases and 6,887,000 deaths have been reported. According to the WHO, Europe reported the most cases, while Africa reported the least. Most of the cases were reported during the period December 2021 to March 2022 [7]. In India, as of March 2023, a total of 44,707,525 SARS-CoV-2 infections have been reported, with 53,084 deaths. India was the most COVID-19-affected country after the US [7]. India is in the third position in terms of cumulative COVID-19 death cases (530,707), following the United States of America and Brazil. The COVID-19 vaccination was introduced in early 2021, and India managed the pandemic successfully following a huge COVID-19 vaccination drive.
A distinct healthcare system that represents pandemic resilience arises from the intersection of adequate funding, workforce readiness, a robust health infrastructure, and equitable governance. Pandemic outcomes have included increase social anxiety, panic brought on by insecurity, an economic recession, and extreme psychological stress. In India, the rate of COVID-19 vaccination reluctance was around 18.5%, while in European trials, it was 20.1%. Not all vaccinations were equally effective in nations where each resident received at least one dose [8].
India has implemented a mass vaccination drive, and as of today, 73.7% of the population has received at least one dose of a vaccine, whereas 68.3% of the population is fully vaccinated. Globally, 69.1% of the population has received at least one dose of a COVID-19 vaccine [7]. The number of fully vaccinated individuals per 100 who have received the last dose of a primary series comes to 64.45 globally, and in India, this number is 68.93. For the booster dose, this number is 30.38 globally and 16.19 in India [9].
The Maharashtra state had the highest COVID-19 burden, reporting more SARS-CoV-2 cases (8,145,342) than the rest of the India. Maharashtra has reported a death rate of 1.83% [8]. The Nagpur region is a part of central India engaged in administrative and business activities, so it attracts travelers. In Nagpur, the first confirmed case of SARS-CoV2 was reported on 12 March 2020, and was a person traveling from the United States. Thereafter, the SARS-CoV-2 spread throughout the whole region of Nagpur [10].
Assessing the SARS-CoV-2 infection in association with sociodemographic factors, along with the extent of infection, is necessary in order to fully comprehend the disease in service to the development of an effective public health response. The epidemiology of SARS-CoV-2 has to be investigated at different levels, i.e., both nationally and internationally, in order to prevent the spread of future diseases by strengthening public health infrastructure. In the present study, we have attempted to understand the epidemiology of SARS-CoV-2 during the three years of the pandemic in the Vidarbha region of Maharashtra in central India.

2. Method

2.1. Study Design, Period, and Settings

We conducted a retrospective analysis of COVID-19 samples tested between February 2020 and December 2022 in the of suburbs of the Vidarbha region of Maharashtra.

2.2. Sample Collection and Processing

Nasopharyngeal and oropharyngeal swabs were collected in a virus transport medium (VTM) and received and tested at the State Level Viral Research and Development Laboratory (SVRDL), Department of Microbiology, which includes the Government Medical College and Hospital, Nagpur, between February 2020 and December 2022. The samples were received from different centers from Nagpur and surrounding areas, including Government Medical College and Hospital Nagpur. All samples were checked according to the criteria in terms of the packing, the VTMcolor, and the labeling, and they were processed as early as possible for the detection of SARS-CoV-2 using the Indian Council of Medical Research (ICMR)’s guidelines for testing.

2.3. Viral Nucleic Acid Extraction

NS/TS samples in a viral transport medium (HiMedia, Mumbai, India) were transported to the laboratory via a cold chain and processed using the QIAamp viral RNA/DNA extraction (Qiagen, Germantown, MD, USA)/genes2me MagRNA-II Viral RNA Extraction Kit (Gurugram, Haryana, India) method according to the manufacturer’s instructions. The extracted RNA was immediately processed for real-time PCR.

2.4. Real-Time PCR

Real-time PCR testing was conducted in a step-one real-time system (Applied Biosystems, Banglore, Karnataka, India). The Multiplex CoviPath™ COVID-19 RT-PCR Kit was used according to the manufacturer’s instructions (Thermo Fisher Scientific, Bangalore, India). The quality of the specimens collection was checked by testing all the samples against an internal control (RNase P), and positive and negative controls were included for all the tests. The presence of viral targets (Orf1ab and N gene) was used to determine the results according to the Ct value. The cut-off criterion was used according to the kit’s instructions. All the results (both positive and negative) were entered immediately into the ICMR portal and shared with the district/state surveillance officers to facilitate further action, including the immediate tracing of contacts.

2.5. Statistical Analysis

The data were collected as part of routine clinical/laboratory operations and later extracted from database portals, reports, etc., for analysis. Data management was undertaken using MS-EXCEL. The case fatality ratio was calculated from the number of positive cases and deaths. Data are represented as proportions or percentages. Categorical variables are presented as frequencies and percentages (n, %). The comparability of groups was analyzed via a chi-square test using the online statistical tool OpenEpi (https://www.openepi.com/Menu/OE_Menu.htm, accessed on 20 May 2025). A p-value of <0.05 is considered to be statistically significant.

3. Results

During 2020, 2021 and 2022, a total of 537,320 COVID-19 samples were tested, with an overall positivity of 14.12%. A total of 98,060, 313,918, and 125,342 samples were tested in 2020, 2021, and 2022, respectively, with individual positivity rates of 13,035 (13.29%), 42,909 (13.7%), and 19,936 (15.91%). The numbers of tests increased by 220.12% in 2021 and by 27.82% in 2022 compared to 2020. The epidemiological curve (Figure 1) shows the RT-PCR-confirmed COVID-19 cases during the study period.
In 2020, 98,060 sample were tested, and among them, 13,035 (13.29%) were positive. The positive cases peaked (4603) (27.04%) in September. Males comprised 7935 (60.88%), and females comprised 5099 (39.11) (Table 1). Among the age groups, the highest positivity was found in the 45 plus group (4765) (36.56%), and lowest was found in the in 1–15 group (918) (7.04%). Vaccination had not commenced in 2020. Hospitalization cases were 5203 (5.30%), and asymptomatic cases were 88,796 (90.56%). The samples received were from Nagpur and its peripheral regions, where most samples were received from the Nagpur district (10,402) (79%), with the fewest coming from the Wardha district (22) (0.16%).
In 2021, a total of 313,918 samples were tested, with 42,909 (13.66%) positive samples. The positive cases peaked in April (21,139) (44.27%). Among them, males comprised 24,811 (57.82%), and females comprised 18,096 (42.17%). Among the age groups, the highest positivity was found in the 31–45 plus group (14,275) (33.27%), and lowest was found in the 1–15 group (3235) (7.54%). Vaccination started in early 2021. Vaccination was conducted in 10,381 (3.30%) cases, and the non-vaccinated came to 303,537 (96.69%). The hospitalized cases came to 2903 (0.92%), and asymptomatic cases came to 306,267 (97.57%). In 2021, most samples were received from the Nagpur district (42,275) (98.52%), with the fewest being received from the Gadchiroli district (11) (0.02%).
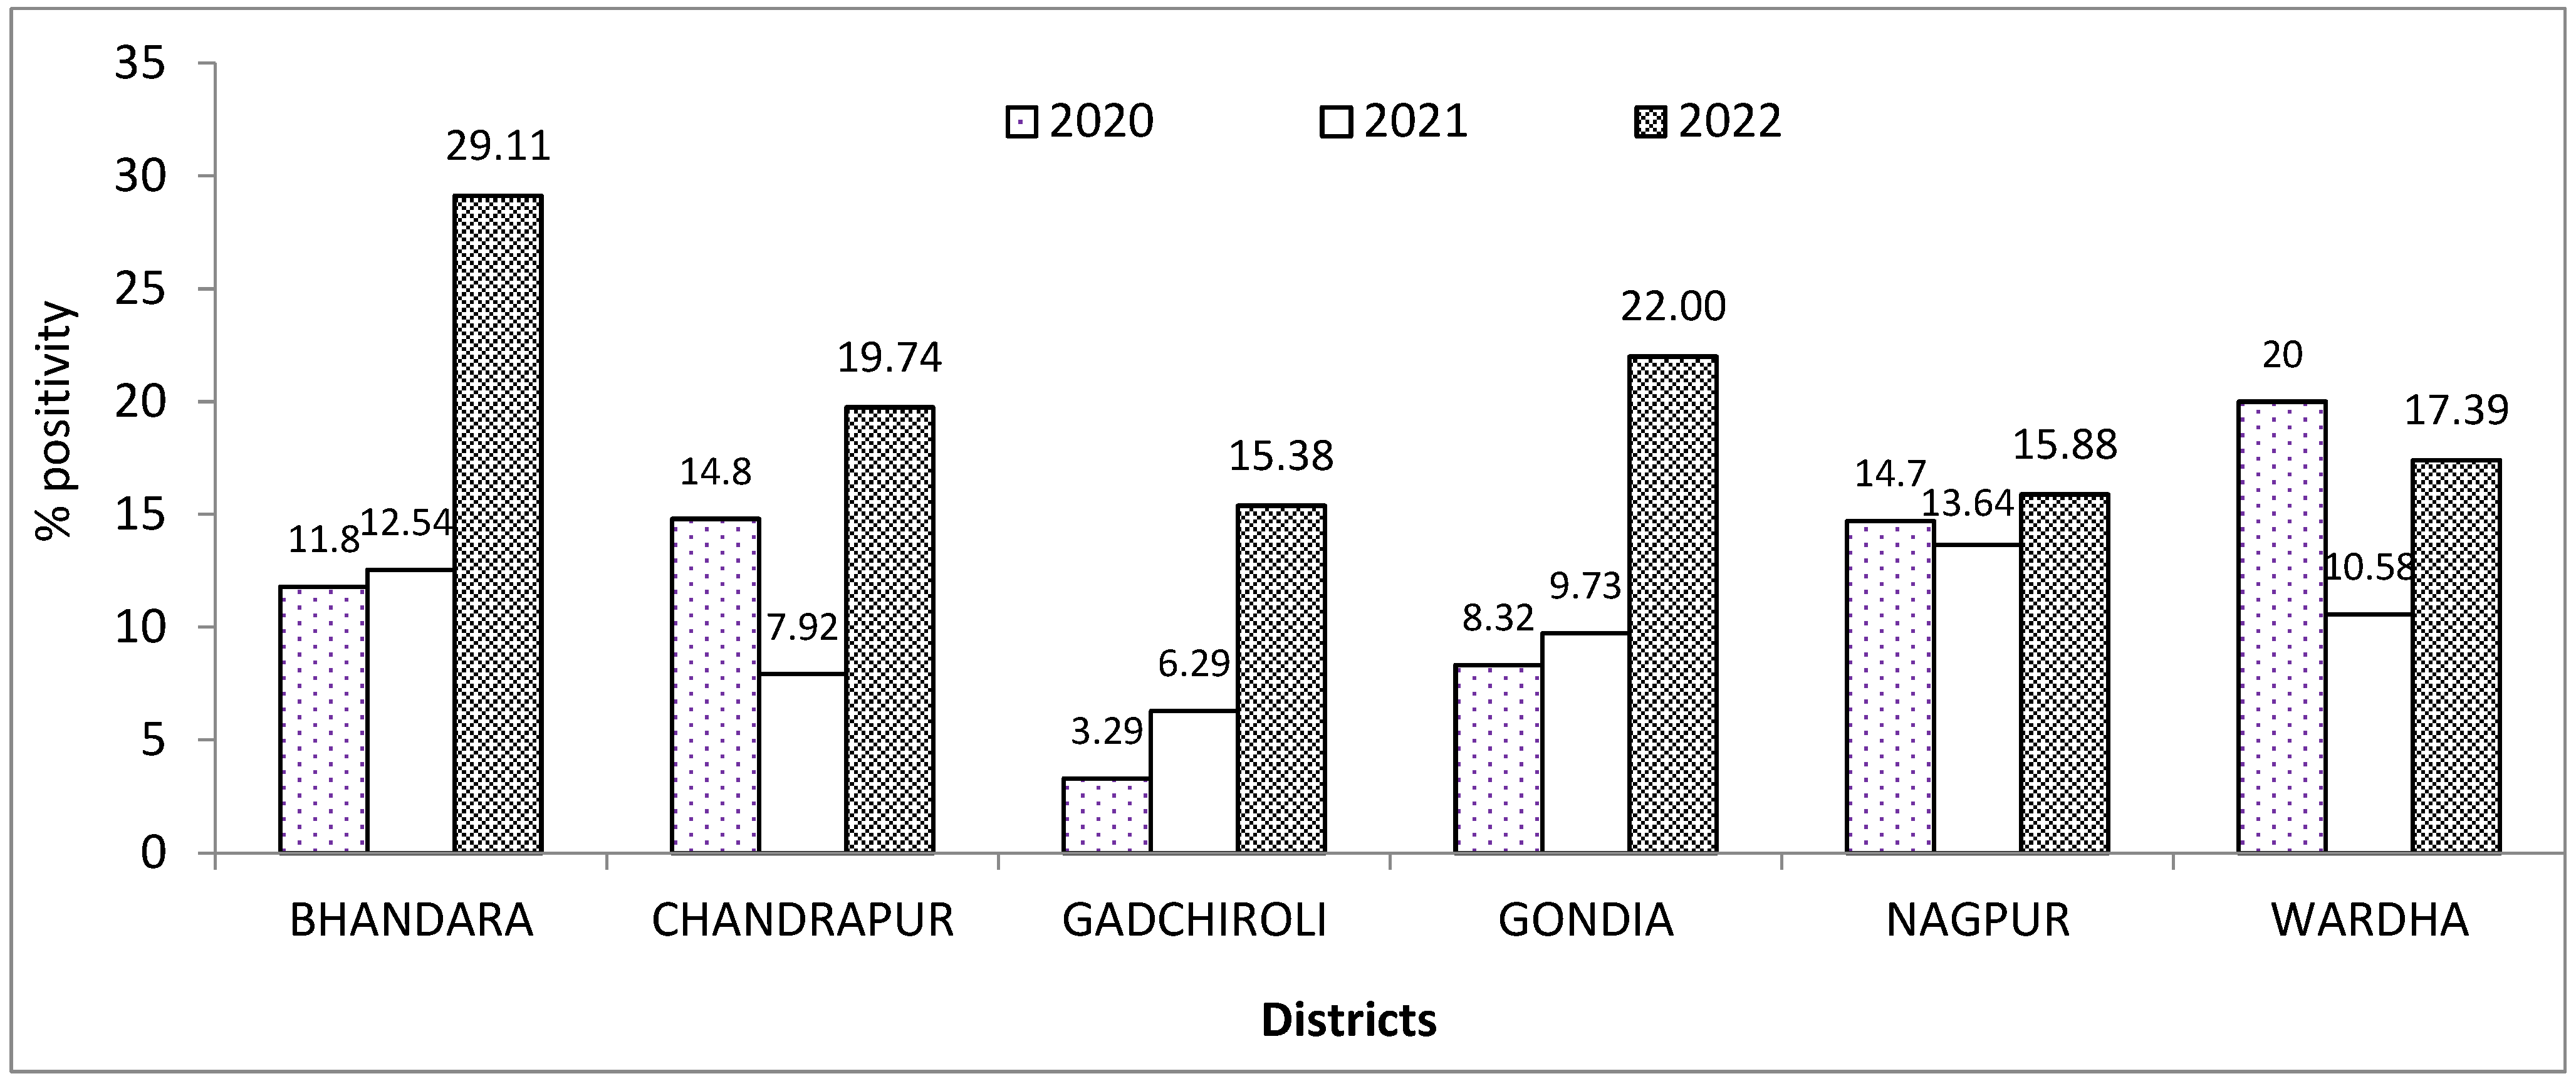
In 2022, a total of 125,342 samples were tested, with 19,936 (15.91%) positive samples. The positive cases peaked in January (13,778) (33.29%), and an increase was also noticed in July (1368) (13.45%). Among them, males comprised 11,640 (58.39%), and females comprised 8294 (41.60%). Among the age groups, the highest positivity rate was found in the 16–30 group (6735) (33.80%) and lowest was found in the in 1–15 group (1707) (8.56%). Vaccination was carried out in 10,105 (8.06%) case, and non-vaccinated cases came to 115,237 (91.93%). The hospitalized cases came to 266 (0.21%), and asymptomatic cases came to 119,112 (95.02%). In 2022, the most samples received also came from the Nagpur district (19,791) (99.27%), with the fewest coming from the Gadchiroli district (4) (0.02%) (Figure 2).
The highest individual positivity in 2020 found to be in the Wardha district, whereas the lowest was found in the Gadchiroli district. In 2021, the highest was found in Nagpur, and lowest was found in the Gadchiroli district. In 2022, the highest positivity was found in the Bhandara district, and the Gadchiroli district was the lowest (Figure 2).
We collected the samples mainly from the peripheral districts of Nagpur, namely, Bhandara, Chandrapur, Gadchiroli, Gondiya, and Wardha, including Nagpur (both urban and rural). We also collected some samples from Amaravati, Yawatmal, Buldhana, Akola, Nanded, and Washim, and we placed them under the category of “other”. Under this category, we reported 369 (3.03%), 479 (1.11%), and 84 (0.42%) positive cases in 2020, 2021, and 2022, respectively.
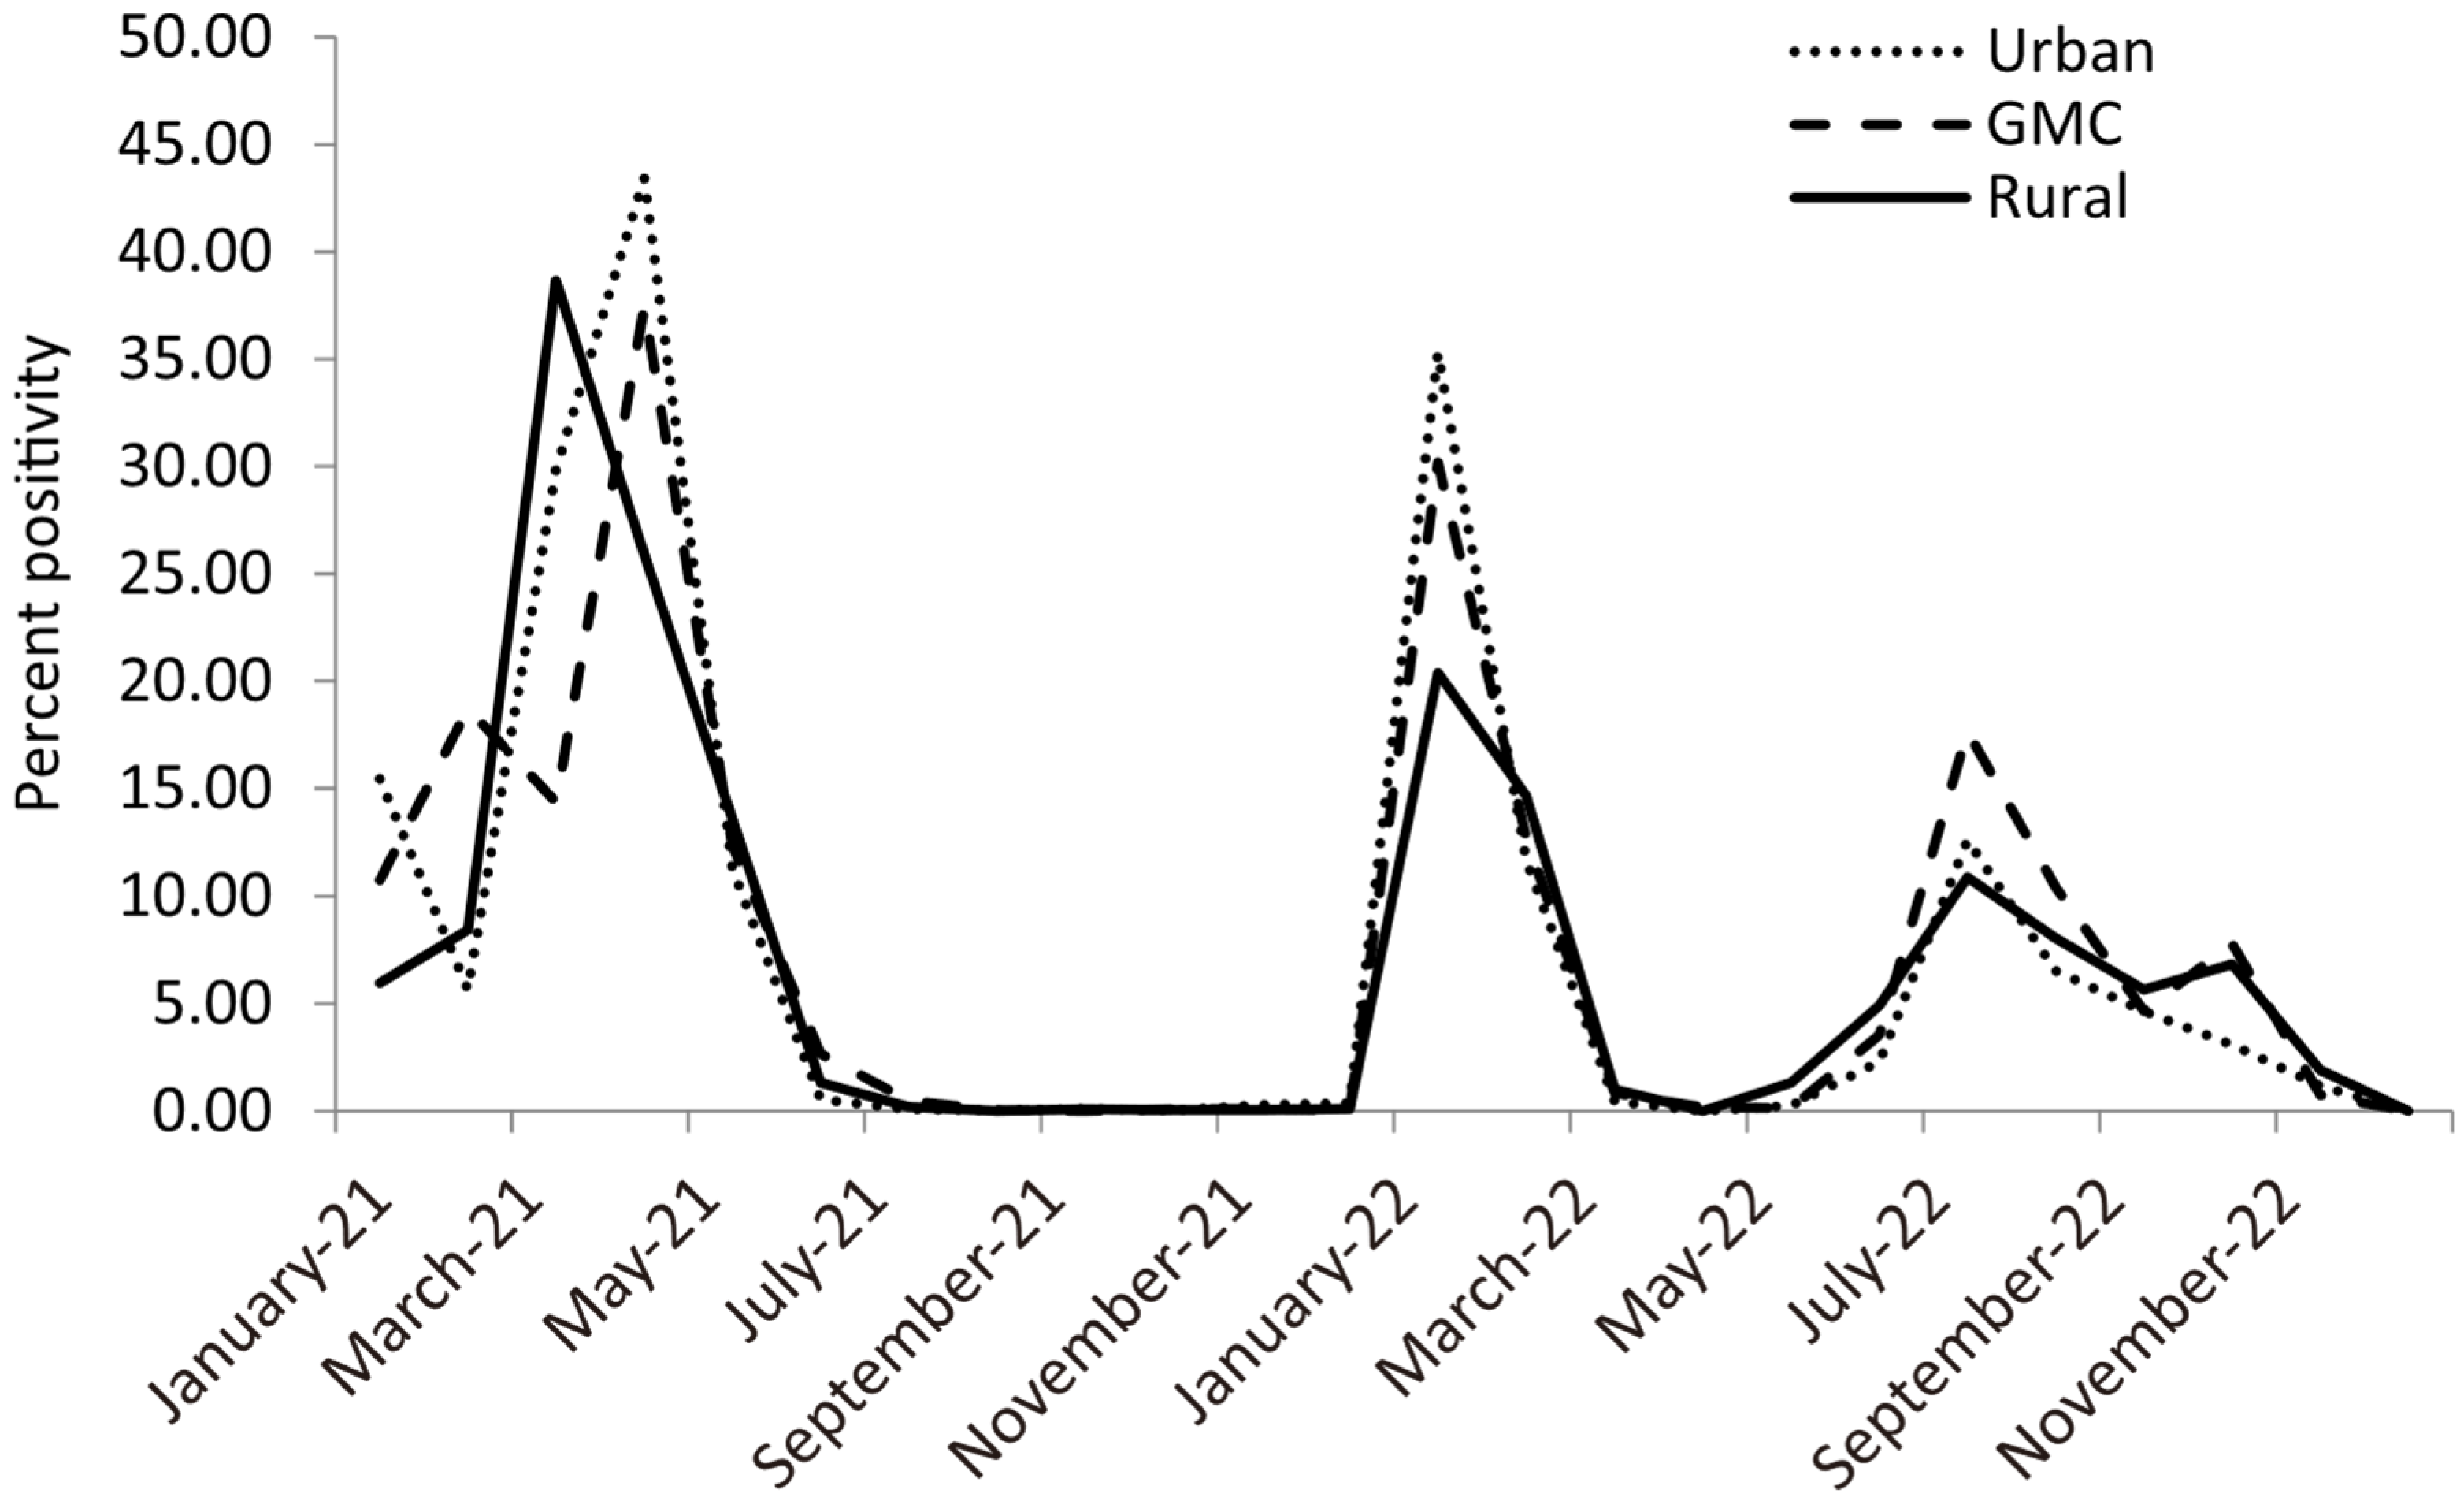
The positivity of SARS-CoV-2 in urban, rural, and GMCH locations in the period May 2021 to December 2022 is shown in Figure 3. In 2021 the percentage peaked in the month of April for GMCH (37.4%) and urban (43.4%), and in March for rural (38.6%). In 2022, two peaks were noticed; positivity peaks were seen during the months of January, i.e., urban (30.19%), rural (35.30%), GMCH (20.37%), and July, i.e., urban (17.65%), rural (12.59%), and GMCH (10.87%).
Considering the epidemiological parameters—and, in particular, the case fatality ratio (CFR)—of COVID-19 in the three-year period, most of the mortalities took place in 2021, with the fewest in 2022. The CFR was high (36.68%) in 2021, was more than two times the CRF in 2020, and was the lowest (13.32%) in 2022 (Table 2).

4. Discussion

We have compared the epidemiological characteristics of COVID-19 cases over three consecutive years (2020, 2021, and 2022) in the Vidarbha region of Maharashtra in India during the COVID-19 pandemic with the epidemiological change. This COVID-19 epidemiological study continues to be vital in managing the crisis, learning and preparing for the future, reinforcing the scientific backbone in our understanding of pandemics, and mitigating their human and economic toll.
As our center is located in Nagpur division, and the sample flow came mainly from the districts of Nagpur, Wardha, Bhandara, Chandrapur, Gadchiroli, and Gondia. However, samples were also tested from the Amravati divisions (namely, the Amravati, Yavatmal, Buldhana, Akola, Washim districts) though, initially, a testing facility was not available in this division. Later, a COVID-19 testing facility was established at Amravati, and subsequently, the number of samples were reduced. Similarly, the flow of samples to other districts decreased over time because testing facilities were developed in those districts. The rate of positivity in the Nagpur district continuously increased from 2020 to 2022, indicating an increase in transmission and infectivity over the period. The Gadchiroli district had the fewest positive cases across all three years. In 2021 and 2022, cases other than those in the Nagpur district were usually patients admitted to our tertiary care center.
During the start of the COVID-19 pandemic, hospitals and health systems were challenged to provide healthcare to a high number of COVID-19 patients, reaching a position close to the breakdown [11]. However, as the COVID-19 pandemic progressed, the healthcare system acquire more experienced staff and better management at various levels. Moreover, initially, there was a limited availability of real-time PCR diagnostic facilities in the primary care center, and diagnosis of COVID-19 was mainly conducted at sentinel hospitals, and only on symptomatic patients. Conversely, huge population screenings were started at the primary-care level, along with rapid antigen testing [12]. These revisions of the healthcare system during the progression of the pandemic led to smooth hospital care.
We report ahigh positivity percentage in 2022; it increased continuously throughout 2020. This may be due to factors like lockdown being eased and restrictions being withdrawn; these restrictions were in force in 2020 and started to become more lenient after 2021. A number of mass gatherings, including religious and marriages, reluctance to participate in COVID-19-appropriate behaviors, and emergence and circulation of a more infective mutant strain contributed to the transmission of the virus across populations [13,14].
The overpopulation of India and the lack of containment allowed the virus to mutate such that it was able to survive in this environment [15]. It has been reported that a newly emerged variant, which was a more contagious and transmissible form of SARS-CoV-2, was circulating in Maharashtra [15,16,17]. During the second wave, Maharashtra was severely affected; it registered nearly 1.4 lakh COVID-19 deaths since the start of the pandemic in 2020, of which almost 64% were recorded in the second wave, starting from February 2021, with a peak in May and June [18].
We have reported an increase in mortality after 2020, with a greater positivity rate. In 2020, India’s cumulative CFR was under 2.5%. The hospitalization and estimated CFR rates were high in 2021 in the hospital setting. This is possibly due to the fact that seriously ill patients were hospitalized, and this outcome affected CFR. According to the WHO, India’s cumulative CFR, as of the 3rd of March 2023, was 0.11%, whereas last week’s CFR is 0.29%. Variation in the CFR was reported in different regions of India, influenced by several factors [19].
Possibly due to the unlocking of the country after January 2021, huge transmission resulted in higher positivity. The COVID-19 vaccination campaign launched in early 2021, and as the vaccination campaign progressed, hospitalization and CFR is decreased. Substantial developments in clinical knowledge concerning COVID-19 and virulence might be a key factor. A number of drugs have been tried and tested across the world in an effort to identify effective therapeutic approaches for severe cases of COVID-19 [20,21,22]. We reported a higher positivity in men (60%) among the total samples. This is in line with other reported studies, and it may be due to the fact that the male population is more likely to be exposed than the female population, as well as sex hormone-driven immune processes [23,24].
The shifting epidemiology of SARS-CoV-2 with respect to age was also reported. In 2020 to 2022, the least-affected age group was 1–15 group, indicating good immunity against COVID-19. People with illnesses and comorbidities are at higher risk because of their compromised immunity [25,26]. Two studies in Barcelona, Spain, have observed increased severity in the patients hospitalized during the second wave [27]. The number of vaccinated cases recorded, namely, 3.30% in 2021 and 7.92% in 2022, indicates an increase in the vaccination rate. Most of the hospitalized cases were from 2020, followed by 2021 and then 2022, indicating an decrease in hospitalization over time. The high rate of hospitalization is because of the virulence of SARS-CoV-2 during these early years [28]. The year 2020 saw the most symptomatic cases, followed by 2022 and 2021. The majority of cases were found to be asymptomatic due to the random sampling. However, the ability to spread infection asymptomatically cannot be ignored.
Factors like age, gender, severe obesity, vital measures, and comorbidities are valuable in predicting the severity of COVID-19 [29]. A study reported an equal risk of infection among children, teenagers, and working-age adults. Moreover, an increased risk of infection and death is associated with older age and comorbidities [30]. This study reported that the first wave affected the population more in urban areas than in rural areas during the second wave. The second wave was more severe than the first wave, resulting in a high number of cases and deaths in India [31,32]. Tamil Nadu and Andhra Pradesh reported a CFR rate of 0.05% for ages of 5 to 17 years and a rate of 16.6% for ages of 85 years during 2020 [33].
China and Italy reported similar CFR rates of 2.3, with most fatalities occurring in elderly cohort with comorbidities [34]. Nigeria reported a less severe second COVID-19 wave, with decreased CFR (0.7%) compared with the first wave (1.8%) [35]. The Democratic Republic of the Congo reported that the first and second waves of the COVID-19 pandemic were more severe than the third and fourth waves, and every wave produced a new SARS-CoV-2 variant [36]. The African continent reported a more severe second wave of the COVID-19 pandemic than the first [37]. There was a shift from multiple variants causing the disease in the early-pandemic period to a single (Omicron) lineage dominating the fourth wave [38].
We could not include all of the data on the confirmed COVID-19 cases and deaths from the rest of the district of Vidarbha. The distribution of the testing load was shared among the other testing centers in the district due to the heavy burden during 2021 (the second-wave period). Hence, we could not estimate other epidemiological parameters like the attack rate.
In conclusion, this three-year comparative study shows the changing epidemiology of SARS-CoV-2 during the COVID-19 pandemic. In the face of incoming threats from COVID-19, this study may be helpful in improving existing awareness of the evolution of the pandemics. We expect that the current study will assist in understanding the impact of COVID-19 and in taking steps to ensure surveillance and preventive control measures to combat future waves.

Author Contributions

Conceptualization, S.B. (Swati Bhise) and S.K.; methodology, S.P., A.D., S.B. (Sachin Baghele) and J.G.; software, P.S.; validation, H.R., V.R. and P.M.; formal analysis, P.D.; investigation, P.M.; resources, S.K.; data curation S.P.; writing—original draft preparation, P.D.; writing—review and editing, S.B. (Swati Bhise); visualization, S.B. (Swati Bhise); supervision, S.S.; project administration, S.K.; funding acquisition, S.K. All authors have read and agreed to the published version of the manuscript.

Funding

The resources (kits, reagents, and consumables) were supplied by the Maharashtra Government, during COVID-19 pandemic.

Institutional Review Board Statement

Ethical review and approval were waived for this study due to all data were collected as part of routine clinical/laboratory operations and later extracted for analysis. The data have been anonymized.

Informed Consent Statement

Patient consent was waived due to the research presents no risk of harm to subjects. The data have been anonymized.

Data Availability Statement

Research data are not shared.

Acknowledgments

We acknowledge the Indian Council of Medical Research, New Delhi, India for providing infrastructure. We thank all of the technicians and data entry operators for their help in this study, especially Mohan Padhey. We also thank all of the district health officials for their cooperation. We thank Ranjeet Kumar for his inputs.

Conflicts of Interest

The authors declare no conflicts of interest.

References

  1. Du Toit, A. Outbreak of a novel coronavirus. Nat. Rev. Microbiol. 2020, 18, 123. [Google Scholar] [CrossRef]
  2. Lai, C.C.; Shih, T.P.; Ko, W.C.; Tang, H.J.; Hsueh, P.R. Severe acute respiratory syndrome coronavirus 2 (SARS-CoV-2) and coronavirus disease-2019 (COVID-19): The epidemic and the challenges. Int. J. Antimicrob. Agents 2020, 55, 105924. [Google Scholar] [CrossRef]
  3. Feehan, J.; Apostolopoulos, V. Is COVID-19 the worst pandemic? Maturitas 2021, 149, 56–58. [Google Scholar] [CrossRef]
  4. Blake, P.; Wadhwa, D. 2020 Year in Review: The Impact of COVID-19 in 12 Charts. 2020. Available online: https://blogs.worldbank.org/voices/2020-year-review-impact-covid-19-12-charts (accessed on 2 March 2023).
  5. Bhosale, S.; Kulkarni, A.P. Is a problem shared, a problem halved? Not always! The novel coronavirus COVID-19 outbreak. Indian J. Crit. Care Med. 2020, 24, 88–89. [Google Scholar] [CrossRef]
  6. Soni, A.R.; Amrit, K.; Shinde, A.M. COVID-19 and transportation of India: Influence on infection risk and greenhouse gas emissions. Environ. Dev. Sustain. 2022, 9, 7377–7392. [Google Scholar] [CrossRef]
  7. WHO Coronavirus (COVID-19) Dashboard. Available online: https://covid19.who.int/table (accessed on 3 March 2023).
  8. Carta, M.G.; Orrù, G.; Littera, R.; Firinu, D.; Chessa, L.; Cossu, G.; Primavera, D.; Del Giacco, S.; Tramontano, E.; Manocchio, N.; et al. Comparing the responses of countries and National Health Systems to the COVID-19 pandemic: A critical analysis with a case-report series. Eur. Rev. Med. Pharmacol. Sci. 2023, 27, 7868–7880. [Google Scholar] [CrossRef]
  9. India Fights Corona COVID-19 Dashboard. Available online: https://www.mygov.in/covid-19 (accessed on 3 March 2023).
  10. Tanna, J.; Singha, B.; Nayak, A.R.; Husain, A.A.; Raje, D.V.; Desai, S.A.; Deshmukh, M.; Mundhada, S.; Kashyap, R.S. Incidence and Epidemiological study of COVID-19 in Nagpur urban region (India) using Molecular testing. MedRxiv 2021. [Google Scholar] [CrossRef]
  11. Filip, R.; Gheorghita Puscaselu, R.; Anchidin-Norocel, L.; Dimian, M.; Savage, W.K. Global Challenges to Public Health Care Systems during the COVID-19 Pandemic: A Review of Pandemic Measures and Problems. J. Pers. Med. 2022, 12, 1295. [Google Scholar] [CrossRef] [PubMed] [PubMed Central]
  12. Laxminarayan, R.; Jameel, S.; Sarkar, S. India’s Battle against COVID-19: Progress and Challenges. Am. J. Trop. Med. Hyg. 2020, 103, 1343–1347. [Google Scholar] [CrossRef] [PubMed] [PubMed Central]
  13. Bureau, W.O. India’s Double Mutant COVID Strain More Transmissible Than Other Variants: WHO. Outlook India. 2021. Available online: https://www.outlookindia.com/website/story/india-news-indias-double-mutant-covid-strain-more-transmissible-than-other-variants-who/382472 (accessed on 3 March 2023).
  14. Vaidyanathan, G. Coronavirus variants are spreading in India—what scientists know so far. Nature 2021, 593, 321–322. [Google Scholar] [CrossRef]
  15. Asrani, P.; Eapen, M.S.; Hassan, M.I.; Sohal, S.S. Implications of the second wave of COVID-19 in India. Lancet Respir. Med. 2021, 9, e93–e94. [Google Scholar] [CrossRef] [PubMed]
  16. Cherian, S.; Potdar, V.; Jadhav, S.; Yadav, P.; Gupta, N.; Das, M.; Rakshit, P.; Singh, S.; Abraham, P.; Panda, S.; et al. SARS-CoV-2 Spike Mutations, L452R, T478K, E484Q and P681R, in the Second Wave of COVID-19 in Maharashtra, India. Microorganisms 2021, 9, 1542. [Google Scholar] [CrossRef] [PubMed]
  17. Callaway, E. Fast-spreading COVID variant can elude immune responses. Nature 2021, 589, 500–501. [Google Scholar] [CrossRef] [PubMed]
  18. Times of India 2021. 2nd Wave Claimed 89,000 Lives in Maharashtra, Pune Worst Affected. Available online: http://timesofindia.indiatimes.com/articleshow/86542100.cms?utm_source=contentofinterest&utm_medium=text&utm_campaign=cppst. (accessed on 3 March 2023).
  19. Ansari, A.A.Z.; Desai, H.D.; Sharma, K.; Jadeja, D.M.; Patel, R.; Patel, Y.; Desai, H.M. Prevalence and cross states comparison of case fatality rate and recovery rate of COVID 19/SARS-CoV-2 in India. J. Fam. Med. Prim. Care 2021, 10, 475–480. [Google Scholar] [CrossRef]
  20. Tarighi, P.; Eftekhari, S.; Chizari, M.; Sabernavaei, M.; Jafari, D.; Mirzabeigi, P. A review of potential suggested drugs for coronavirus disease (COVID-19) treatment. Eur. J. Pharmacol. 2021, 895, 173890. [Google Scholar] [CrossRef]
  21. Leentjens, J.; van Haaps, T.F.; Wessels, P.F.; Schutgens, R.E.G.; Middeldorp, S. COVID-19-associated coagulopathy and antithrombotic agents-lessons after 1 year. Lancet Haematol. 2021, 8, e524–e533. [Google Scholar] [CrossRef]
  22. The WHORapid Evidence Appraisal for COVID-19 Therapies (REACT) Working Group: Association between Administration of Systemic Corticosteroids Mortality among Critically Ill Patients with COVID-19: AMeta-analysis. JAMA 2020, 324, 1330–1341. [CrossRef]
  23. Maleki Dana, P.; Sadoughi, F.; Hallajzadeh, J.; Asemi, Z.; Mansournia, M.A.; Yousefi, B.; Momen-Heravi, M. An Insight into the Sex Differences in COVID-19 Patients: What are the Possible Causes? Prehosp. Disaster Med. 2020, 35, 438–441. [Google Scholar] [CrossRef]
  24. Penna, C.; Mercurio, V.; Tocchetti, C.G.; Pagliaro, P. Sex-related differences in COVID-19 lethality. Br. J. Pharmacol. 2020, 177, 4375–4385. [Google Scholar] [CrossRef]
  25. O’Driscoll, M.; Ribeiro Dos Santos, G.; Wang, L.; Cummings, D.A.T.; Azman, A.S.; Paireau, J.; Fontanet, A.; Cauchemez, S.; Salje, H. Age-specific mortality and immunity patterns of SARS-CoV-2. Nature 2021, 590, 140–145. [Google Scholar] [CrossRef]
  26. Chen, Y.; Klein, S.L.; Garibaldi, B.T.; Li, H.; Wu, C.; Osevala, N.M.; Li, T.; Margolick, J.B.; Pawelec, G.; Leng, S.X. Aging in COVID-19: Vulnerability, immunity and intervention. Ageing Res. Rev. 2021, 65, 101205. [Google Scholar] [CrossRef] [PubMed]
  27. Cossio, Y.; Aller, M.B.; Abadias, M.J.; Domínguez, J.M.; Romea, M.S.; Barba, M.À.; Rodríguez, M.I.; Roman, A.; Salazar, A. Comparing the first and second waves of COVID-19 in a tertiary university hospital in Barcelona. F1000Res 2021, 10, 1197. [Google Scholar] [CrossRef] [PubMed]
  28. Fisman, D.N.; Tuite, A.R. Evaluation of the relative virulence of novel SARS-CoV-2 variants: A retrospective cohort study in Ontario, Canada. CMAJ 2021, 193, E1619–E1625. [Google Scholar] [CrossRef] [PubMed]
  29. Booth, A.; Reed, A.B.; Ponzo, S.; Yassaee, A.; Aral, M.; Plans, D.; Labrique, A.; Mohan, D. Population risk factors for severe disease and mortality in COVID-19: A global systematic review and meta-analysis. PLoS ONE 2021, 16, e0247461. [Google Scholar] [CrossRef]
  30. Laxminarayan, R.; Vinay, T.G.; Kumar, K.A.; Wahl, B.; Lewnard, J.A. SARS-CoV-2 infection and mortality during the first epidemic wave in Madurai, south India: A prospective, active surveillance study. Lancet Infect. Dis. 2021, 21, 1665–1676. [Google Scholar] [CrossRef]
  31. Shil, P.; Atre, N.M.; Tandale, B.V. Epidemiological findings for the first and second waves of COVID-19 pandemic in Maharashtra, India. Spat. Spatiotemporal Epidemiol. 2022, 41, 100507. [Google Scholar] [CrossRef]
  32. Agarwala, P.; Bhargava, A.; Gahwai, D.K.; Negi, S.S.; Shukla, P.; Dayama, S. Epidemiological Characteristics of the COVID-19 Pandemic During the First and Second Waves in Chhattisgarh, Central India: A Comparative Analysis. Cureus 2022, 14, e24131. [Google Scholar] [CrossRef]
  33. Laxminarayan, R.; Wahl, B.; Dudala, S.R.; Gopal, K.; Mohan, B.C.; Neelima, S.; Jawahar Reddy, K.S.; Radhakrishnan, J.; Lewnard, J.A. Epidemiology and transmission dynamics of COVID-19 in two Indian states. Science 2020, 370, 691–697. [Google Scholar] [CrossRef]
  34. Porcheddu, R.; Serra, C.; Kelvin, D.; Kelvin, N.; Rubino, S. Similarity in Case Fatality Rates (CFR) of COVID-19/SARS-CoV-2 in Italy and China. J. Infect. Dev. Ctries. 2020, 14, 125–128. [Google Scholar] [CrossRef] [PubMed]
  35. Akande, O.W.; Elimian, K.O.; Igumbor, E.; Dunkwu, L.; Kaduru, C.; Olopha, O.O.; Ohanu, D.O.; Nwozor, L.; Agogo, E.; Aruna, O.; et al. Epidemiological comparison of the first and second waves of the COVID-19 pandemic in Nigeria, February 2020-April 2021. BMJ Glob. Health 2021, 6, e007076. [Google Scholar] [CrossRef]
  36. Otshudiema, J.O.; Folefack, G.L.T.; Nsio, J.M.; Mbala-Kingebeni, P.; Kakema, C.H.; Kosianza, J.B.; Mfumu, A.K.; Saidi, G.N.; Kabongo, P.M.; Okum, R.; et al. Epidemiological Comparison of Four COVID-19 Waves in the Democratic Republic of the Congo, March 2020-January 2022. J. Epidemiol. Glob. Health 2022, 12, 316–327. [Google Scholar] [CrossRef] [PubMed]
  37. Salyer, S.J.; Maeda, J.; Sembuche, S.; Kebede, Y.; Tshangela, A.; Moussif, M.; Ihekweazu, C.; Mayet, N.; Abate, E.; Ouma, A.O.; et al. The first and second waves of the COVID-19 pandemic in Africa: A cross-sectional study. Lancet 2021, 397, 1265–1275. [Google Scholar] [CrossRef] [PubMed]
  38. Gao, L.; Zheng, C.; Shi, Q.; Xiao, K.; Wang, L.; Liu, Z.; Li, Z.; Dong, X. Evolving trend change during the COVID-19 pandemic. Front. Public Health 2022, 10, 957265. [Google Scholar] [CrossRef] [PubMed]
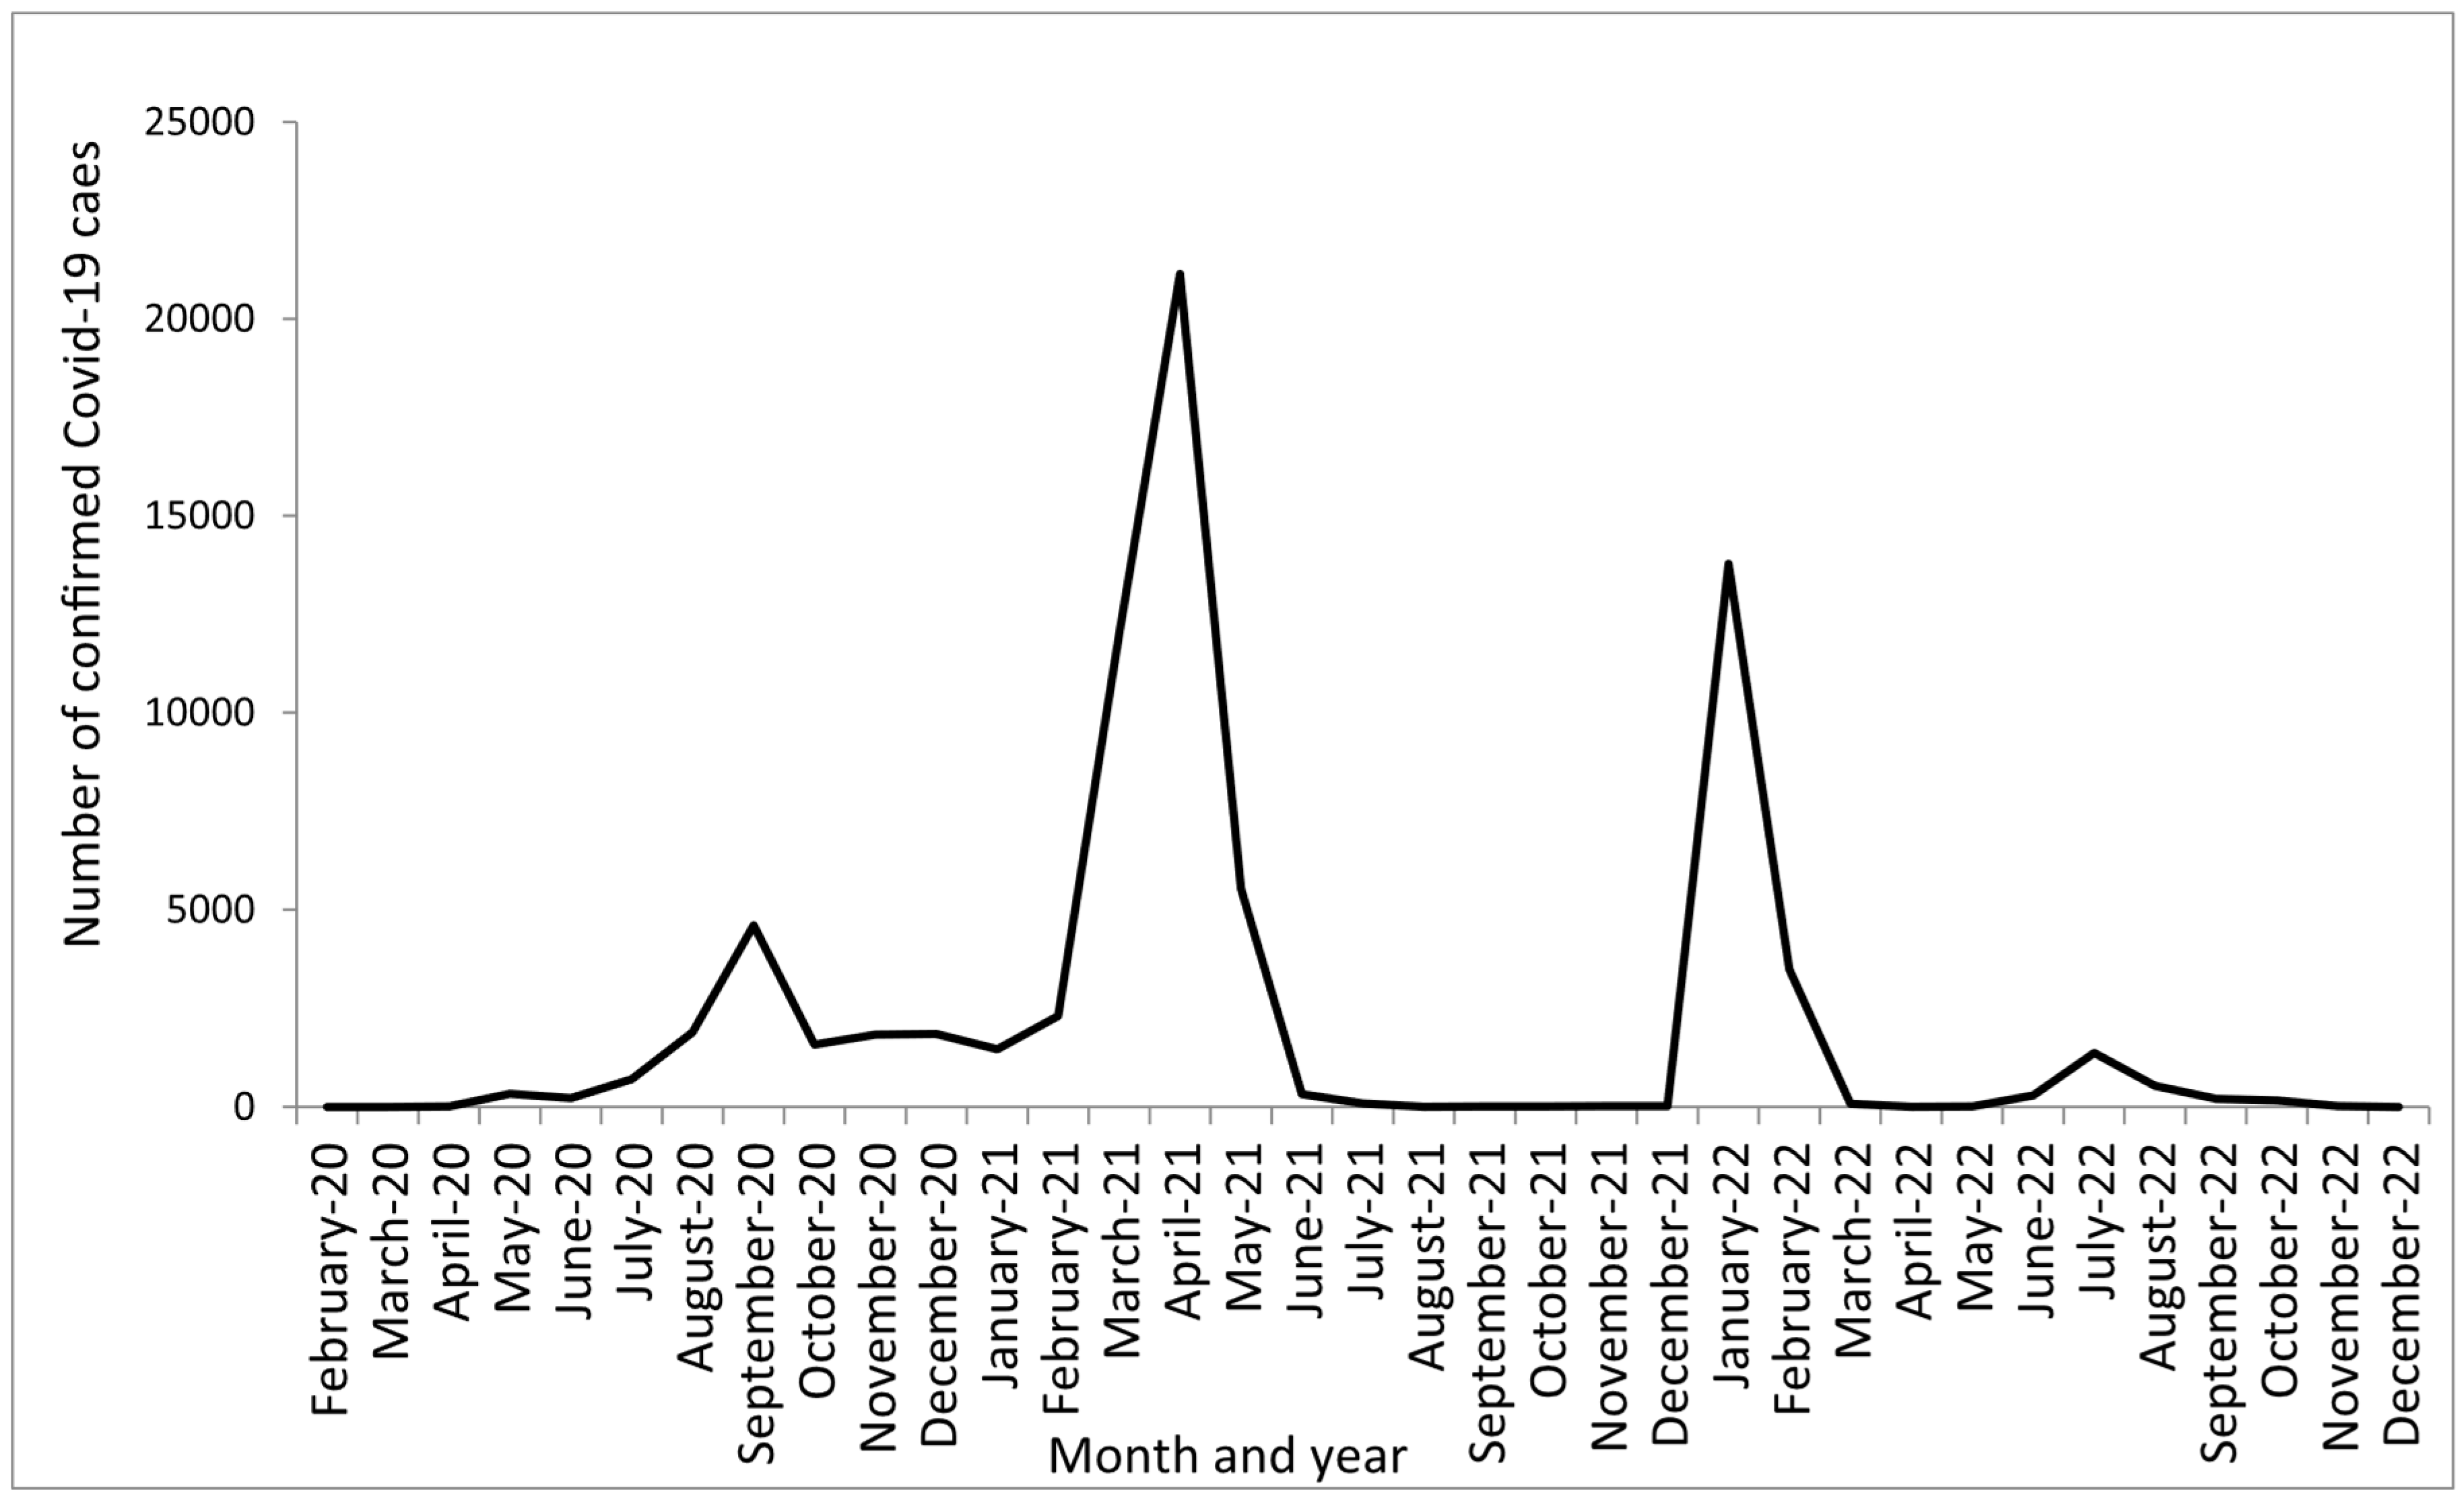
Figure 1. Distribution of COVID-19-positive cases over the three-year period.
Covid 05 00125 g001
Figure 2. SARS-CoV-2 positivity in the districts of Vidarbha in Maharashtra.
Covid 05 00125 g002
Figure 3. The percentage positivity of SARS-CoV-2 between January 2021 and December 2022 in urban, rural, and GMCH (Government Medical College and Hospital) Nagpur in the Vidarbha region of Maharashtra.
Covid 05 00125 g003
Table 1. Demographic characteristic and COVID-19 indicators over a three-year period. Values are shown as numbers and %.
Year202020212022p-Value
Overall Positivity13,035 (13.29)42,909 (13.66)19,936 (15.91)<0.001
District <0.001
Bhandara1807 (13.86)73 (0.17)23 (0.11)
Chandrapur49 (0.38)27 (0.07)15 (0.07)
Gadchiroli304 (2.33)11 (0.03)4 (0.02)
Gondia55 (0.42) 22 (0.05)11 (0.06)
Nagpur10,402 (79.80)42,275 (98.52)19,791 (99.28)
Wardha22 (0.16)22 (0.05)8 (0.04)
Other396 (3.04)479 (1.11)84 (0.42)
Gender <0.001
Male7935 (60.88)24,811 (57.82)11,640 (58.39)
Female5099 (39.11)18,096 (42.17)8294 (41.60)
Transgender1 (0.01)2 (0.01)2 (0.01)
Age Group (years) <0.001
1–15918 (7.04)3235 (7.54)1707 (8.56)
16–303476 (26.66)12,121 (28.25)6735 (33.80)
31–453876 (29.74)14,275 (33.27)6192 (31.05)
45+4765 (36.56)13,278 (30.94)5302 (26.59)
Vaccination <0.001
Yes010,381 (3.30)10,105 (8.06)
No0303,537 (96.69)115,237 (91.93)
Hospitalization <0.001
Yes5203 (5.30)2903 (0.92)266 (0.21)
No92,857 (94.70)311,015 (99.08)125,076 (99.79)
Clinical Status <0.001
Symptomatic9264 (9.44)7651 (2.43)6230 (4.98)
Asymptomatic88,796 (90.56)306,267 (97.57)119,112 (95.02)
Table 2. Epidemiological parameters for COVID-19 in hospital of study settings.
Parameter202020212022
Cumulative confirmed cases86076882672
Deaths15622525103
Case fatality ratio (CFR)18.14%36.68%15.32%
Disclaimer/Publisher’s Note: The statements, opinions and data contained in all publications are solely those of the individual author(s) and contributor(s) and not of MDPI and/or the editor(s). MDPI and/or the editor(s) disclaim responsibility for any injury to people or property resulting from any ideas, methods, instructions or products referred to in the content.