Abstract
The COVID-19 pandemic has spread worldwide for over two years. It was considered a significant threat to global health due to its transmissibility and high pathogenicity. The standard test for COVID-19, namely, reverse transcription polymerase chain reaction (RT–PCR), is somehow inaccurate and might have a high false-negative rate (FNR). As a result, an infected person with a negative test result may unknowingly continue to spread the virus, especially if they are infected with an undiscovered COVID-19 strain. Thus, a more accurate diagnostic technique is required. In this study, we propose 3Cs, which is a capsule neural network (CapsNet) used to classify computed tomography (CT) images as novel coronavirus pneumonia (NCP), common pneumonia (CP), or normal lungs. Using 6123 CT images of healthy patients’ lungs and those of patients with CP and NCP, the 3Cs method achieved an accuracy of around 98% and an FNR of about 2%, demonstrating CapNet’s ability to extract features from CT images that distinguish between healthy and infected lungs. This research confirmed that using CapsNet to detect COVID-19 from CT images results in a lower FNR compared to RT–PCR. Thus, it can be used in conjunction with RT–PCR to diagnose COVID-19 regardless of the variant.
1. Introduction
At the end of 2019, China was invaded by an unknown fatal human-to-human transmissible virus causing symptoms of pneumonia, fever, dry cough and fatigue [1]. These symptoms are highly similar to those of viral pneumonia symptoms but are significantly more fatal. The International Committee on Taxonomy of Viruses named this virus SARS-CoV-2 [2], which was subsequently termed coronavirus disease 2019 (COVID-19) [3]. Due to its high transmission, in March 2020, the World Health Organization declared the SARS-CoV-2 infection a pandemic [4]. Several countries banned various social activities entirely to control the virus. As of 26 May 2024, there had been 775,552,2035 confirmed cases of COVID-19 worldwide, including 7,050,201 deaths [5]. COVID-19 transmission threatens human life, particularly the elderly and those with chronic diseases [1,6]. The diagnosis of infected patients reduces the spread of the disease. Reverse transcription polymerase chain reaction (RT–PCR) is used as a gold standard for COVID-19 testing [7]. However, this diagnostic tool has a critical issue: low reliability due to its high false-negative rate (FNR) [8], where the improper use of testing kits and low viral loads are contributing factors to its inaccuracy [9,10]. A false-negative RT–PCR test result can lead to a COVID-19-infected person spreading the virus and infecting others. Thus, a more accurate rapid detection method is needed to help fight the COVID-19 pandemic, especially when RT–PCR retesting is not feasible.
Alternative methods like medical radiography have been used for COVID-19 diagnoses that involve computed tomography (CT) and X-ray to detect abnormalities in chest imaging. It has been reported that RT–PCR failed to diagnose a large number of suspected cases with typical clinical COVID-19 symptoms and identical specific CT images [9]. According to Huang et al. [10], 98% of patients with chest CT imaging have bilateral lung involvement. Moreover, various research studies have shown that COVID-19 CT images have bilateral ground-glass opacity (GGO) and subsegmental consolidation areas. Fang et al. [11] showed that the sensitivity of CT images to COVID-19 is higher than that of RT–PCR (98% vs. 71%). Additionally, as stated in [12], more than 70% of patients with negative RT–PCR tests have typical CT image manifestations. Hang et al. [13] established the relationship between CT features and RT–PCR test results, particularly in patients with a negative RT–PCR. As a result, CT images can be used as a reliable source to diagnose COVID-19 infections.
Even though X-ray and CT images are promising mechanisms in COVID-19 diagnosis, they require a subject-matter expert to confirm the infection. In other words, a trained expert is still required to differentiate between COVID-19-caused pneumonia and viral pneumonia, such as that caused by the influenza virus. It is possible to use transitional machine learning techniques to automate the detection of COVID-19 in CT images by utilizing trained observers to annotate infected areas to provide a probabilistic estimate of confidence in the lesion area. However, expert manual annotation is not considered an efficient option as it is a time-consuming and costly process, which increases the need for automatic image annotation techniques to speed up the labeling process. This indicates that more advanced machine learning algorithms are essential for the efficient detection of COVID-19 in CT images.
The progress in artificial intelligence, particularly in the field of deep learning (DL), has significantly contributed to the automation of numerous tasks, including COVID-19 detection [14]. DL refers to an enhanced type of neural network with additional layers that increase the levels of abstraction [15]. It can be the ideal technology for solving the problem of automatic image annotation because, unlike classic machine learning techniques, DL can automatically learn features from training data. It has recently shown remarkable success in medical imaging by learning important features from large training datasets [16]. One may suggest using a convolutional neural network (CNN) as a DL technique to solve the issue of automating COVID-19 X-ray and CT image annotation. However, CNN does not account for the spatial features of the image, which make it difficult to catch the valuable features in the CT images properly [17]. This paper suggests using a more suitable DL structure known as a capsule neural network (CapsNet).
CapsNet is a DL architecture designed to overcome the limitations of CNN models [18]. CapsNet is based on the idea of capsules; a capsule is a group of neurons that encapsulate an image’s essential information with the possibility that the entity is present and then produces a vector as an output [18]. A capsule might be an alternative to traditional neural networks; whereas neurons deal with scalars, capsules deal with vectors that can track features’ orientation. As a result, if the feature’s position changes, the vector’s value remains unchanged, but the direction changes to reflect the change in position [18]. This enables CapsNet to perform very well on smaller datasets and represents the robustness against rotated input data [19].
This study used CapsNet to multiclassify chest CT images into novel coronavirus pneumonia (NCP), common pneumonia (CP) and normal control. To achieve this, we fine-tuned the CapsNet architecture to handle CT lung images and used Clean-CC-CCII dataset [20] for experiments. Our 3Cs model achieved up to 97.89% accuracy and 2.11% FNR. These results demonstrate CapsNet’s ability to detect image features from small datasets. Thus, it represents another diagnostic tool that can be used in conjunction with negative RT–PCR results to verify the negative result and prevent the patient from spreading the virus. This paper makes the following key contributions:
- Re-purposing CapsNet to deal with lung CT images to speed up the process of medical image annotation.
- Fine-tuning our implementation of CapsNet to work as a multi-class classifier with three classes: NCP, CP and normal control.
- Providing a new state-of-the-art high-accuracy diagnostic technique (3Cs) that can be used with RT–PCR results to verify COVID-19 detection.
This paper proceeds as follows: Section 2 reviews the related work in neural network applications for COVID-19 detection. Section 3 explains the dataset and discusses 3Cs, the proposed model. Moreover, we discuss the experiments and evaluation approach in Section 4, while Section 5 discusses the results and concludes the paper.
2. Related Work
Since the discovery that X-ray and CT images can detect COVID-19, researchers have been working continuously to develop automatic COVID-19 classification systems. These systems aim to provide accurate, rapid, cost-effective diagnostic tools with minimal FNRs. CNN and CapsNet are two of the most popular DL algorithms in medical image classification. Both are powerful for extracting image features, but CNN requires a large training dataset and might not consider the spatial features of images [18]. The CapsNet enables us to overcome the problem of limited COVID-19 data.
2.1. COVID-19 Detection by Combining CNNs with CapsNets
A prevalent approach combines CNNs with CapsNets, leveraging the strengths of both architectures, such as the work in [21,22,23,24,25,26]. The idea behind such an approach is that CNNs excel at feature extraction, while CapsNets offer advantages in representing features as capsules in limited datasets. In other words, these studies typically utilize CNNs to extract features from the input images and then feed those features into CapsNet for classification purposes. For example, DenseNet, which is an extension to the traditional CNN, was used in [21] in which the authors proposed DenseCapsNet, a DL framework that combines the strengths of CapsNets and DenseNet for COVID-19 detection from chest X-ray images. DenseCapsNet leverages DenseNet’s efficient feature extraction capabilities and CapsNet’s ability to represent spatial relationships within the image. This combination aims to achieve superior performance on limited COVID-19 datasets, as demonstrated by the authors’ significant improvement in sensitivity compared to other detection models. The study in [23] proposes an end-to-end DL model combining DenseNet and CapsNet (DCC) for COVID-19 detection. Recognizing the limitations of CapsNet’s feature extraction on small datasets, Javidi et al. leverage DenseNet’s strength in this area. DCC feeds features extracted by DenseNet into CapsNet, aiming to benefit from both architectures’ advantages: CapsNet’s ability to represent spatial relationships and DenseNet’s efficient feature extraction. Notably, the authors achieved a high accuracy (98.46%) even with significantly imbalanced data (positive COVID-19 samples being 50 times fewer). They employed a modified margin loss function within their DCC model to address this class imbalance.
Another example of a standard CNN architecture is VGG which was used in many studies [22,25]. The research in [22] proposes VGG-CapsNet, a CapsNet-based system for COVID-19 diagnosis using chest X-ray images. This work addresses the limitations of CNN-based approaches, such as view-invariance and information loss during downsampling. VGG-CapsNet leverages the strengths of CapsNets in preserving spatial relationships within the image, potentially overcoming these limitations. The authors achieved promising results, including 97% accuracy for COVID-19 vs. non-COVID-19 classification and 92% accuracy for multi-class classification (COVID-19 vs. normal vs. viral pneumonia). The authors in [25] propose a CNN-CapsNet model for chest X-ray classification to aid radiologists in COVID-19 diagnosis. Recognizing the strengths of both architectures, the authors leverage a pre-trained VGG19 CNN for efficient feature extraction. These extracted features are then fed into a newly designed CapsNet for the final classification task. This approach combines the power of CNNs in feature learning with the ability of CapsNets to capture spatial relationships within the image, potentially leading to improved COVID-19 detection.
ResNet, a type of CNN architecture, was also used in [24]. It proposes Detail-Oriented Capsule Networks (DECAPS), a novel architecture that utilizes a ResNet for feature extraction from CT scans in COVID-19 diagnosis. DECAPS then integrates capsule layers for classification. This approach achieves promising results, suggesting its potential for CT-based COVID-19 detection. Similarly, the study in [26] introduces COVID19-ResCapsNet, a DL model for COVID-19 risk prediction using chest X-ray images. This hybrid network leverages a ResNet for improved feature extraction, followed by CapsNet layers for classification between COVID-19 and non-COVID-19 cases. The authors achieved high accuracy up to 99.88% on two chest X-ray datasets.
Table 1 shows a summary of the performance of binary and multi-class classifiers that combine both CNNs and CapsNets in detecting COVID-19 from medical images, where it is clear that binary studies outperform multi-class studies in terms of performance. This might be related to the visual similarities between COVID-19 and viral pneumonia. Hence, a better multi-class classifier is needed to distinguish between COVID-19 and common pneumonia patients.

Table 1.
Summary of the combined CNN and CapsNet models studies.
2.2. COVID-19 Detection by CapsNets
Many studies have employed the standard CapsNet architecture for both feature extraction and classification tasks [34,35,36,37] in COVID-19 detection. Most of the studies suffer from class imbalance, which several proposed approaches tackle in different methods, for example, modifying the margin loss [23,34] or data augmentation on COVID-19 training data [21,24,25,35,36]. The literature on [38] introduced a parallel multi-lane CapsNet [39] that was used instead of a standard CapsNet. The article in [37] proposes CapsNetCovid, a standard CapsNet model achieving high accuracy (up to 99% for CT images with binary classification and 94% for X-ray with multi-class classification) in COVID-19 diagnosis without augmentation techniques. CapsNetCovid outperforms CNN and pre-trained models (DenseNet121, ResNet50) on both standard and augmented datasets. Notably, it demonstrates stronger resistance to image rotations and transformations compared to these models.
We have summarized the performance of CapsNet-based COVID-19 detection in Table 2, demonstrating the potential of CapsNet for robust COVID-19 classification. Specifically, the impact of CapsNet on feature extraction in binary-class scenarios using CT images surpasses the performance of combining CNN with CapsNet as discussed above in Section 2.1. While the CNN-CapsNet combination achieved an accuracy of up to 92% in detecting COVID-19 from CT images [23], CapsNet alone achieved an accuracy of up to 99% [37]. Consequently, this paper focuses on a detailed examination of CapsNet and aims to enhance its performance for multi-class COVID-19 detection further using CT images.

Table 2.
Summary of COVID-19 CapsNet models studies.
3. Materials and Methods
CapsNet is an effective DL algorithm that can be exploited to solve many research problems. In this section, we will explain the data selection and preprocessing we used throughout our research. Moreover, we will discuss our customizations to the CapsNet architecture and its hyperparameters to produce a high-accuracy multi-class COVID-19 classifier.
3.1. Datasets Extraction
Zhang et al. [43] constructed a dataset of CT images from the China Consortium of Chest CT Image Investigation (CC-CCII) and named it the CC-CCII dataset. Then, He et al. [20] unified the data types and deleted the damaged data from the CC-CCII dataset, renaming it the Clean-CC-CCII dataset. For this study, we extracted two sets of data (DatasetA and DatasetB) from the Clean-CC-CCII dataset [20] where the CT images are classified into NCP, CP and normal. We made sure that only the slices with infected lesions were chosen to produce a cleaner and more accurate dataset for NCP and CP, while the normal slices were selected randomly. We only considered slices with left and right lungs, where we manually excluded low-quality slices, unreadable scans and black images with no content. We show in Figure 1 three-segmented chest CT images from each class where Figure 1a displays a CT slice with severe NCP lesions and bilateral and peripheral mixed GGO and consolidation shadows. On the other hand, Figure 1b shows a CT slice of a patient with a confirmed CP infection, and Figure 1c shows a CT slice of a normal lung.
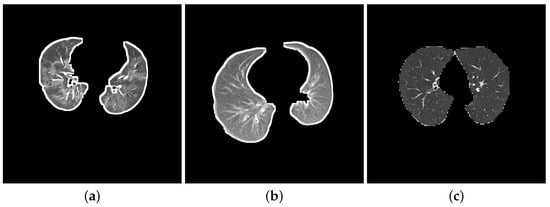
Figure 1.
Three CT slice samples from each class. (a) NCP; (b) CP; (c) Normal.
DatasetA, contains 6104 of the highest-quality unsegmented slices with clear lungs. It consists of 2032 slices of confirmed NCP infection, 2033 slices of confirmed CP infections and 2039 normal slices. On the other hand, DatasetB contains 13,874 segmented slices having 4581 slices of confirmed NCP infection, 4310 slices of confirmed CP infections and 4983 normal slices. Note that 7751 slices of DatasetB are sourced from the lower-quality segmented slices in the Clean-CC-CCII dataset, while the rest are segmented slices from DatasetA. The details regarding the preprocessing of the datasets is discussed in Section 3.2.
Table 3 and Table 4 present the distribution of images across these classes within DatasetA, along with the corresponding train/validation/test split percentages. Similarly, Table 5 and Table 6 depict the class distribution and train/validation/test split for DatasetB.

Table 3.
The number of images in Dataset A.

Table 4.
Class distribution and Train/Test/Val split in Dataset A.

Table 5.
The number of images in Dataset B.

Table 6.
Class distribution and Train/Test/Val split in Dataset B.
3.2. Dataset Preprocessing
Data preprocessing is a crucial step before building the classification model. We aim to enhance the quality of the images so that the proposed 3Cs model can analyze them better. We adopted three basic preprocessing approaches: segmentation, resizing and augmentation.
- Segmentation: Segmentation in lung images separates the lung regions from those of the other body parts. More specifically, we segmented DatasetA by using K-Means method to separate lung images from CT slices and eliminate the white background. While the reference paper [20] employed ten dilation kernels, we opted for seven. This choice aimed to achieve a balance between removing the background and preserving the integrity of the lung boundaries. Seven iterations were found to be sufficient for filling small holes within the lungs while minimizing the thickening of the boundaries compared to ten iterations. We did not apply any segmentation to DatasetB as it contains a combination of segmented images from the Clean-CC-CCII dataset and our segmented slices from DatasetA. Figure 2 shows three slices: Figure 2a is from the unsegmented Clean-CC-CCII dataset, Figure 2b is from DatasetA after applying the segmentation using K-Means with seven dilation kernels, and Figure 2c is from DatasetB which is already segmented using K-Means with ten dilation kernels.
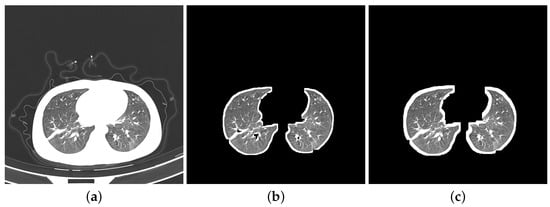 Figure 2. Three COVID-19 CT slices, before and after segmentation. (a) Unsegmented slice; (b) segmented slice from DatasetA; (c) segmented slice from DatasetB.
 - Resizing: The Clean-CC-CCII dataset has an image resolution of 512 × 512 pixels, which are resized to 224 × 224 pixels to be more suitable for our study. This size (224 × 224 pixels) was found in our experiments to be more efficient for running the CapsNet classification model on the Clean-CC-CCII dataset and produced better results compared to other tested image resolutions.
- Augmentation: Data augmentation artificially generates new data from existing sets to train ML models, consequently improving the model’s performance and generalization ability [44]. Hinton—the CapsNet developer—augmented the MNIST dataset that was used to build the original CapsNet by shifting the data up to two pixels in each direction [18]. In this study, we shifted the CT images by only 0.05 pixels in each direction since lung images have more critical and sensitive features than digit images in the MNIST dataset.
3.3. Model Architecture and Hyperparameters Tuning
Developing a CapsNet with the potential to recognize COVID-19 from CT images is challenging. CapsNet was selected to achieve this objective due to its advantages in generating suitable higher-order features for the problem in question. The architecture of the 3Cs model is depicted in Figure 3 with details of the selected parameters. It mainly consists of two parts: preprocessing, which has been described thoroughly in Section 3.2, and classification.
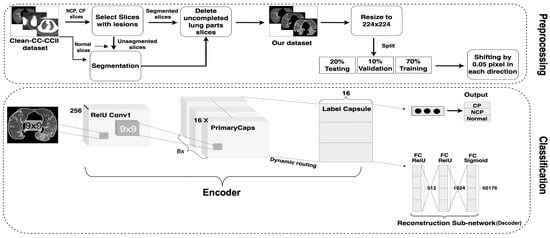
Figure 3.
The 3Cs model architecture.
The original CapsNet architecture consists of Encoder and Decoder parts; the former extracts features from the input, while the latter reconstructs the image from those extracted features [18]. Our 3Cs model differs from the original CapsNet architecture in a number of aspects:
- Input Image Size: The digit image size in the original CapsNet was 28 × 28, which has to be enlarged for CT images as they contain more critical information than digit images. The image size has been increased to 224 × 224 to extract more relevant features.
- Conv1 Layer: The number of Conv1 layer strides has been increased from one to two; this makes the filter move two pixels right for each horizontal movement of the filter and two pixels down for each vertical movement when creating the feature map. Also, the padding of the Conv1 layer has been changed to “SAME” rather than “VALID”; “SAME” makes the output size equivalent to the input size.
- PrimaryCapsules layer: The number of capsule channels in the PrimaryCapsules layer has been reduced from 32 to 16.
- Label Capsule: The original CapsNet worked on ten-digit images from the MNIST dataset, which must be adjusted for the problem at hand. Thus, the number of capsules in this layer has been changed to three: NCP, CP diseases and normal control.
- Reconstruction Network: This is an important part of the original CapsNet architecture and is also called the decoder. It regenerates the images from the features of the Label Capsule layer. It learns—with a learning rate (LR) equal to 0.0003—to reconstruct the input image with the minimal SSE (sum squared error) in the case of the original CapsNet, while MSE (mean squared error) was used in the 3Cs model architecture. The reconstruction loss is calculated as indicated in Equation (1). The total loss of the training process is then calculated as a weighted combination of margin and reconstruction losses, as seen in Equation (2).
It is worth mentioning that the margin loss indicates that if a particular object of a class is present in the image, then, the square length of the associated vector of that object’s capsule must not be smaller than 0.9. Similarly, if an object of that class is not present in the image, then the square length of the related vector of that object should not be greater than 0.1. The reconstruction loss is reduced by 0.0005 to give more importance to the margin loss and avoid overfitting during training. The reconstruction unit and the reconstruction loss are significant because they force the network to save the information needed to reconstruct the image up to the highest capsule layer. Finally, the reconstruction network’s last layer will output 50,176-pixel intensity values (224 × 224 reconstructed image).
It is also significant to point out that a series of experiments described in Section 4 revealed the significant impact of hyperparameter changes, such as the input image size and the number of capsule channels of the PrimaryCapsule layer, on CapsNet’s classification performance.
4. Experiments and Results
In this section, we show the results of the experiments we conducted on 3Cs, where the implementation was performed using the Python programming language and Tensorflow framework in the Google Colab Pro+ environment. In this setting, we configured CapsNet to be suitable for COVID-19 diagnosis, studied the effect of data augmentation of the proposed model and performed hyperparameter optimizations. Since the datasets, discussed in Section 3.1, used to train and evaluate 3Cs are balanced, we focused on accuracy () metrics to measure the model performance. Moreover, we also used FNR () to assess 3Cs since our main objective is to overcome the main disadvantage of RT–PCR of having high FNR. In this metric, we consider the prediction to be when the sample is infected with COVID-19 but not recognized, while is when the sample is infected with COVID-19 and recognized correctly.
For all of our experiments in this Section, the training was performed on 80% of the DatasetA, and the testing was conducted on the remaining 20%. We used the early-stopping technique with a validation set (obtained by randomly selecting 20% of the DatasetA from the training set) to stop the network’s training and minimize the model’s overfitting.
We performed an extensive and systematic analysis of the multiple hyperparameter combinations to derive a robust CapsNet structure for feature extraction and recognition of COVID-19 within multiple classes of CT images. Some parameters were fixed before starting the experiments. For example, the ADAM optimizer was used to optimize the loss function, the batch size was 16, the capsule network had three dynamic routing iterations, and the epoch was 100. On the other hand, the remaining parameters were changed sequentially. This means that if fine-tuning a parameter in an experiment improved performance, the same fine-tuned parameter was used in subsequent experiments in addition to the new parameter change. Each experiment was repeated three times. Since learning rates (LR) are one of the most critical hyperparameters to consider when configuring neural network models, we conducted our experiments with different LRs of 0.0001, 0.0003 and 0.00005. When the model weights are updated, LR specifies how much the model should change in response to the estimated error.
4.1. Result of 3Cs through the Standard CapsNet
The first experiment employs the same parameters as the original CapsNet with the modifications we discussed in Section 3.3. We show in Table 7 and Figure 4 the results of this experiment. The confusion matrix is demonstrated in Figure 4a, while the reconstruction of a sample from the test set is shown in Figure 4b, where the top part of this figure is random images from the test set, while the lower part is the model prediction of the images generated by the decoder part of the CapsNet. Although the receiver operator characteristic (ROC) curve is usually used to evaluate binary classification models, we apply the ROC curve to multi-classification by binarizing the output and show the results in Figure 4c. The Area Under Curve (AUC) in Table 7 measures a classifier’s ability to distinguish between classes and summarizes the ROC curve. In summary, we show that LR or 0.00005 produces the best results compared to the others with 82% accuracy and 18% FNR. Notably, the training process took a total of 33 min with 11 epochs.

Table 7.
Standard CapsNet parameters.
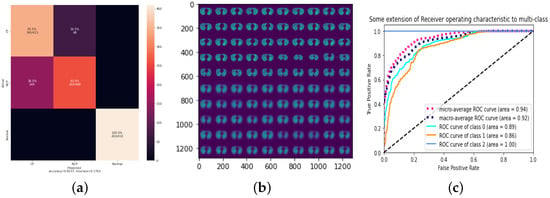
Figure 4.
Standard CapsNet parameters for 0.00005 LR. (a) Confusion Matrix; (b) Reconstruction of a sample test set; (c) ROC.
4.2. Result of 3Cs with Augmentation Optimization
To improve the accuracy of our 3Cs model, we applied data augmentation (shifting), as discussed in Section 3.1. The shift involves moving the image’s pixels horizontally or vertically without changing the image’s dimensions. For this, some image pixels will be clipped off, and there will be a new area where new pixels from the image are added to achieve the same image dimension. In our model, the dataset was shifted by 0.05 pixels in each direction. The findings of this experiment are shown in Table 8. As indicated, data augmentation significantly improves the outcomes. All of the LRs below have comparable results. The best accuracy is achieved when 0.0001 LR equals 96.75%, which is shown in Figure 5, with a training process that took a total of 55 min with 39 epochs.

Table 8.
Data augmentation effect.
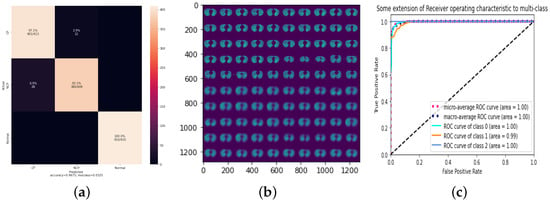
Figure 5.
Data augmentation with 0.0001 LR. (a) Confusion matrix; (b) reconstruction of a sample test set; (c) ROC.
4.3. Result of 3Cs with Hyperparameter Optimization
Since there is still room to improve the performance of 3Cs, we shift our focus in this section on the hyperparameters of the CapsNet components, for example, the PrimaryCapsules layer and the Conv1 layer. For the PrimaryCapsules layer, we reduced the number of channels in the layer from 32 to 16, and the result of the experiment was positive; however, the improvement compared to previous results was minimal with the best accuracy being 96.67% for LR equals 0.0003. The results are presented in Table 9 and Figure 6. It is worth mentioning that the training process took a total of 31 min with 20 epochs.

Table 9.
Changing the number of PrimaryCapsules channels from 32 to 16.
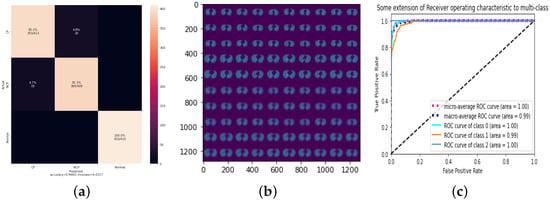
Figure 6.
The number of PrimaryCapsules channels is 16 with 0.0003. (a) Confusion matrix; (b) reconstruction of a sample test set; (c) ROC.
We also applied improvements to the Conv1 Layer in the CapsNet structure, in which the strides value changed from one to two, meaning that the filter is two pixels to the right for each horizontal movement of the filter and two pixels down for each vertical direction of the filter when making the feature map. We also changed the padding to “SAME” rather than “VALID”. Using “SAME” padding ensures that the filter is performed to all the input elements. The results, as shown in Table 10, indicate the highest accuracy (97.89%) of all the experiments for LR equals 0.0003. Since this is our final cumulative optimization, we tested 3Cs with the same setup on the lower quality DatasetB, which resulted in an accuracy of 94.51% as shown in Figure 7, which indicates the model’s robustness. For DatasetA, which achieved an accuracy of 97.8%, the training process took 15 min with 32 epochs. When applying the same configuration to DatasetB (accuracy: 94.51%), the training time increased to 45 min with 35 epochs. This difference might be attributed to the lower quality of data in DatasetB, requiring more training iterations to achieve a good level of accuracy.

Table 10.
Changing the strides and padding of the Conv1 layer.
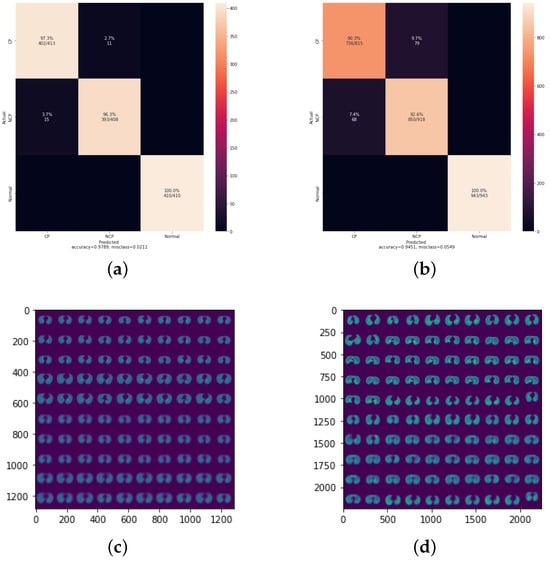
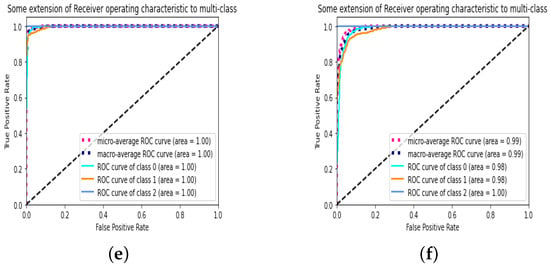
Figure 7.
Results of the final CapsNet model on DatasetA and DatasetB. (a) Confusion matrix of DatasetA; (b) confusion matrix of DatasetB; (c) reconstructed images of DatasetA; (d) reconstructed images of DatasetB; (e) ROC of DatasetA; (f) ROC of DatasetB.
5. Discussion and Conclusions
This study presents a Capsule Network model designed to detect COVID-19 from CT images. The experimental results demonstrate the 3Cs model’s efficacy, showing significant improvements in diagnostic accuracy and reliability.
The implementation of the CapsNet model yielded promising results, particularly when fine-tuning the hyperparameters and employing data augmentation techniques. Initially, the model achieved an accuracy of 82% with the standard CapsNet parameters. By applying data augmentation, specifically shifting the image pixels, the accuracy increased significantly to 96.75% for an LR of 0.0001. Further adjustments to the model architecture, such as reducing the number of channels in the PrimaryCapsules layer and modifying the Conv1 layer’s strides and padding, resulted in a peak accuracy of 97.89% and FNR of 2.11% on DatasetA and an accuracy of 94.51% and FNR of 5.7% on DatasetB, which is remarkable.
These results highlight the model’s capability to distinguish between COVID-19, common pneumonia and normal lung conditions with high precision and recall rates. The adjustments to hyperparameters, particularly the learning rate, played a crucial role in enhancing the model’s performance, indicating the importance of hyperparameter optimization in DL models for medical image analysis.
While the 3Cs model has shown substantial improvements in accuracy and reliability, there are several avenues for future research that could further enhance its performance and applicability:
- Exploration of Additional Data Augmentation Techniques: Future studies could explore other data augmentation methods, such as rotation, scaling and flipping, to assess their impact on model performance and robustness.
- Incorporation of Advanced Capsule Network Architectures: Investigating advanced capsule network architectures, such as dynamic routing by agreement and attention-based capsule networks, could potentially improve the model’s ability to capture spatial hierarchies and complex patterns in CT images.
- Expansion to Multi-modal Data: Integrating multi-modal data, such as combining CT images with clinical data and other imaging modalities (e.g., X-rays), could enhance the model’s diagnostic accuracy and provide a more comprehensive assessment of the patient’s condition.
- Real-world Clinical Validation: Conducting real-world clinical trials and validation studies to evaluate the model’s performance in diverse and larger patient populations would be essential to establish its efficacy and reliability in clinical settings.
- Transfer Learning and Domain Adaptation: Employing transfer learning techniques to adapt the model to different imaging devices, protocols and other respiratory diseases could make the model more versatile and widely applicable.
In conclusion, the 3Cs CapsNet model for diagnosing COVID-19 represents a significant step forward in the application of capsule networks for medical image analysis, particularly in the context of COVID-19 detection. By addressing the outlined future research directions, the model’s performance can be further optimized, contributing to more accurate and reliable diagnostic tools in the fight against COVID-19 and other respiratory illnesses.
Author Contributions
R.A.: Conceptualization, Methodology, Software, Validation, Formal analysis, Investigation, Resources, Data Curation, Writing—Original Draft, Visualization. M.K.: Conceptualization, Methodology, Validation, Writing-Review and Editing, Supervision, Project administration. F.A.: Conceptualization, Validation, Writing-Review and Editing, Supervision, Project administration. All authors have read and agreed to the published version of the manuscript.
Funding
This research received no external funding.
Data Availability Statement
The code and datasets used in this study can be found at https://doi.org/10.5281/zenodo.6570758 (permission is required for access) (accessed on 12 June 2024).
Conflicts of Interest
The authors declare no conflicts of interest.
Abbreviations
The following abbreviations are used in this manuscript:
| DL | Deep Learning |
| CT | Computed Tomography |
| RT–PCR | Reverse Transcription Polymerase Chain Reaction |
| CapsNet | Capsules Neural Network |
| CNN | Convolutional Neural Network |
| NCP | Novel Coronavirus Pneumonia |
| CP | Common Pneumonia |
| GGO | Ground-Glass Opacity |
| DECAPS | DEtail-oriented Capsule Networks |
| ResNet | Residual Neural Network |
| SVM | Support Vector Machine |
| ReLU | Rectified Linear Units |
| SSE | Sum Squared error |
| MSE | Mean Squared error |
| TP | True Positive |
| TN | True Negative |
| FP | False Positive |
| FN | False Negative |
| FNR | False-Negative Rate |
| FPR | False Positive Rate |
| LR | Learning Rate |
| ROC | Receiver Operator Characteristic |
| AUC | Area Under the Curve |
References
- World Health Organization. Coronavirus. 2024. Available online: https://www.who.int/health-topics/coronavirus#tab=tab_1 (accessed on 12 June 2024).
- Gorbalenya, A.E.; Baker, S.C.; Baric, R.S.; de Groot, R.J.; Drosten, C.; Gulyaeva, A.A.; Haagmans, B.L.; Lauber, C.; Leontovich, A.M.; Neuman, B.W.; et al. Severe acute respiratory syndrome-related coronavirus: The species and its viruses—A statement of the Coronavirus Study Group. bioRxiv 2020. [Google Scholar] [CrossRef]
- World Health Organization. Laboratory Testing for Coronavirus Disease 2019 (COVID-19) in Suspected Human Cases: Interim Guidance, 2 March 2020. Technical Documents. 2020. Available online: https://iris.who.int/handle/10665/331329 (accessed on 12 June 2024).
- World Health Organization. WHO Director-General’s Opening Remarks at the Media Briefing on COVID-19—11 March 2020. 2020. Available online: https://www.who.int/director-general/speeches/detail/who-director-general-s-opening-remarks-at-the-media-briefing-on-covid-19---11-march-2020 (accessed on 12 June 2024).
- World Health Organization. COVID-19 Dashboard: Deaths. 2024. Available online: https://data.who.int/dashboards/covid19/deaths?n=c (accessed on 12 June 2024).
- World Health Organization. Timeline of WHO’s Response to COVID-19. 2020. Available online: https://www.who.int/news/item/29-06-2020-covidtimeline (accessed on 12 June 2024).
- World Health Organization. Use of Chest Imaging in COVID-19: A Rapid Advice Guide. 2020. Available online: https://iris.who.int/bitstream/handle/10665/332336/WHO-2019-nCoV-Clinical-Radiology_imaging-2020.1-eng.pdf?sequence=1 (accessed on 12 June 2024).
- Shi, H.; Han, X.; Jiang, N.; Cao, Y.; Alwalid, O.; Gu, J.; Fan, Y.; Zheng, C. Radiological findings from 81 patients with COVID-19 pneumonia in Wuhan, China: A descriptive study. Lancet Infect. Dis. 2020, 20, 425–434. [Google Scholar] [CrossRef] [PubMed]
- Wang, Y.; Kang, H.; Liu, X.; Tong, Z. Combination of RT-qPCR testing and clinical features for diagnosis of COVID-19 facilitates management of SARS-CoV-2 outbreak. J. Med. Virol. 2020, 92, 538. [Google Scholar] [CrossRef] [PubMed]
- Clinical features of patients infected with 2019 novel coronavirus in Wuhan, China. Lancet 2020, 395, 497–506. [CrossRef] [PubMed]
- Fang, Y.; Zhang, H.; Xie, J.; Lin, M.; Ying, L.; Pang, P.; Ji, W. Sensitivity of Chest CT for COVID-19: Comparison to RT-PCR. Radiology 2020, 296, E115–E117. [Google Scholar] [CrossRef] [PubMed]
- Ai, T.; Yang, Z.; Hou, H.; Zhan, C.; Chen, C.; Lv, W.; Tao, Q.; Sun, Z.; Xia, L. Correlation of Chest CT and RT-PCR Testing for Coronavirus Disease 2019 (COVID-19) in China: A Report of 1014 Cases. Radiology 2020, 296, E32–E40. [Google Scholar] [CrossRef] [PubMed]
- Fu, H.; Xu, H.; Zhang, N.; Xu, H.; Li, Z.; Chen, H.; Xu, R.; Sun, R.; Wen, L.; Xie, L.; et al. Association between Clinical, Laboratory and CT Characteristics and RT-PCR Results in the Follow-up of COVID-19 patients. medRxiv 2020. [Google Scholar] [CrossRef]
- Alaufi, R.; Kalkatawi, M.; Abukhodair, F. Challenges of deep learning diagnosis for COVID-19 from chest imaging. Multimed. Tools Appl. 2024, 83, 14337–14361. [Google Scholar] [CrossRef]
- Lu, L.; Zheng, Y.; Carneiro, G.; Yang, L. Deep Learning and Convolutional Neural Networks for Medical Image Computing: Precision Medicine, High Performance and Large-Scale Datasets; Springer International Publishing: Berlin/Heidelberg, Germany, 2017. [Google Scholar] [CrossRef]
- Chen Yen-Wei, J.L.C. Deep Learning in Healthcare: Paradigms and Applications; Springer International Publishing: Berlin/Heidelberg, Germany, 2020. [Google Scholar]
- Cao, J.; Zhao, A.; Zhang, Z. Automatic image annotation method based on a convolutional neural network with threshold optimization. PLoS ONE 2020, 15, e0238956. [Google Scholar] [CrossRef]
- Sabour, S.; Frosst, N.; Hinton, G.E. Dynamic Routing between Capsules. arXiv 2017, arXiv:1710.09829. [Google Scholar]
- Kronenberger, J.; Haselhoff, A. Do Capsule Networks Solve the Problem of Rotation Invariance for Traffic Sign Classification? In Artificial Neural Networks and Machine Learning—ICANN 2018: 27th International Conference on Artificial Neural Networks, Rhodes, Greece, 4–7 October 2018; Proceedings, Part III 27; Kůrková, V., Manolopoulos, Y., Hammer, B., Iliadis, L., Maglogiannis, I., Eds.; Springer: Cham, Switzerland, 2018; pp. 33–40. [Google Scholar]
- He, X.; Wang, S.; Shi, S.; Chu, X.; Tang, J.; Liu, X.; Yan, C.; Zhang, J.; Ding, G. Benchmarking Deep Learning Models and Automated Model Design for COVID-19 Detection with Chest CT Scans. medRxiv 2020. [Google Scholar] [CrossRef]
- Quan, H.; Xu, X.; Zheng, T.; Li, Z.; Zhao, M.; Cui, X. DenseCapsNet: Detection of COVID-19 from X-ray images using a capsule neural network. Comput. Biol. Med. 2021, 133, 104399. [Google Scholar] [CrossRef] [PubMed]
- Tiwari, S.; Jain, A. Convolutional capsule network for COVID-19 detection using radiography images. Int. J. Imaging Syst. Technol. 2021, 31, 525–539. [Google Scholar] [CrossRef]
- Javidi, M.; Abbaasi, S.; Atashi, S.N.; Jampour, M. COVID-19 early detection for imbalanced or low number of data using a regularized cost-sensitive CapsNet. Sci. Rep. 2021, 11, 18478. [Google Scholar] [CrossRef] [PubMed]
- Mobiny, A.; Cicalese, P.A.; Zare, S.; Yuan, P.; Abavisani, M.; Wu, C.C.; Ahuja, J.; de Groot, P.M.; Nguyen, H.V. Radiologist-Level COVID-19 Detection Using CT Scans with Detail-Oriented Capsule Networks. arXiv 2020, arXiv:2004.07407. Available online: https://arxiv.org/abs/2101.07433 (accessed on 12 June 2024).
- Yousra, D.; Abdelhakim, A.B.; Mohamed, B.A. A Novel Model for Detection and Classification Coronavirus (COVID-19) Based on Chest X-ray Images Using CNN-CapsNet. In Sustainable Smart Cities and Territories Lecture Notes in Networks and Systems; Springer: Berlin/Heidelberg, Germany, 2021. [Google Scholar] [CrossRef]
- Li, Z.; Xing, Q.; Zhao, J.; Miao, Y.; Zhang, K.; Feng, G.; Qu, F.; Li, Y.; He, W.; Shi, W.; et al. COVID19-ResCapsNet: A Novel Residual Capsule Network for COVID-19 Detection From Chest X-Ray Scans Images. IEEE Access 2023, 11, 52923–52937. [Google Scholar] [CrossRef]
- Praveen. CoronaHack Chest X-ray Dataset. Available online: https://www.kaggle.com/praveengovi/coronahack-chest-xraydataset (accessed on 12 June 2024).
- Cohen, J.P.; Morrison, P.; Dao, L. COVID-19 Image Data Collection. arXiv 2020, arXiv:2003.11597. [Google Scholar]
- Chowdhury, M.E.H.; Rahman, T.; Khandakar, A.; Mazhar, R.; Kadir, M.A.; Mahbub, Z.B.; Islam, K.R.; Khan, M.S.; Iqbal, A.; Al-Emadi, N.; et al. COVID-19 Radiography Database. 2020. Available online: https://kaggle.com/tawsifurrahman/covid19-radiography-database (accessed on 12 June 2024).
- Ning, W.; Lei, S.; Yang, J.; Cao, Y.; Jiang, P.; Yang, Q.; Zhang, J.; Wang, X.; Chen, F.; Geng, Z.e.a. Open resource of clinical data from patients with pneumonia for the prediction of COVID-19 outcomes via deep learning. Nat. Biomed. Eng. 2020, 4, 1197–1207. [Google Scholar] [CrossRef] [PubMed]
- Larxel. COVID-19 X-rays. Available online: https://www.kaggle.com/datasets/andrewmvd/convid19-x-rays (accessed on 12 June 2024).
- Sait, U.; Lal, K.; Prajapati, S.; Bhaumik, R.; Kumar, T.; S, S.; Bhalla, K. Curated Dataset for COVID-19 Posterior-Anterior Chest Radiography Images (X-rays). 2022. Available online: https://data.mendeley.com/datasets/9xkhgts2s6/1 (accessed on 12 June 2024).
- He, X.; Yang, X.; Zhang, S.; Zhao, J.; Zhang, Y.; Xing, E.; Xie, P. Sample-Efficient Deep Learning for COVID-19 Diagnosis Based on CT Scans. medRxiv 2020. [Google Scholar] [CrossRef]
- Afshar, P.; Heidarian, S.; Naderkhani, F.; Oikonomou, A.; Plataniotis, K.N.; Mohammadi, A. COVID-CAPS: A capsule network-based framework for identification of COVID-19 cases from X-ray images. Pattern Recognit. Lett. 2020, 138, 638–643. [Google Scholar] [CrossRef]
- Toraman, S.; Alakus, T.B.; Turkoglu, I. Convolutional capsnet: A novel artificial neural network approach to detect COVID-19 disease from X-ray images using capsule networks. Chaos Solitons Fractals 2020, 140, 110122. [Google Scholar] [CrossRef] [PubMed]
- Aksoy, B.; Salman, O.K.M. Detection of COVID-19 Disease in Chest X-ray Images with capsul networks: Application with cloud computing. J. Exp. Theor. Artif. Intell. 2021, 33, 527–541. [Google Scholar] [CrossRef]
- Akinyelu, A.A.; Bah, B. COVID-19 Diagnosis in Computerized Tomography (CT) and X-ray Scans Using Capsule Neural Network. Diagnostics 2023, 13, 1484. [Google Scholar] [CrossRef] [PubMed]
- Sridhar, S.; Sanagavarapu, S. Multi-Lane Capsule Network Architecture for Detection of COVID-19. In Proceedings of the 2021 2nd International Conference on Intelligent Engineering and Management (ICIEM), London, UK, 28–30 April 2021. [Google Scholar] [CrossRef]
- Du, W.; Sun, Y.; Li, G.; Cao, H.; Pang, R.; Li, Y. CapsNet-SSP: Multilane capsule network for predicting human saliva-secretory proteins. Bmc Bioinform. 2020, 21, 237. [Google Scholar] [CrossRef] [PubMed]
- Wang, L.; Wong, A.; Lin, Z.Q.; McInnis, P.; Chung, A.; Gunraj, H.; Lee, J.; Ross, M.; VanBerlo, B.; Ebadi, A.; et al. Figure 1 COVID-19 Chest X-ray Dataset. 2020. Available online: https://github.com/agchung/Figure1-COVID-chestxray-dataset (accessed on 12 June 2024).
- Chowdhury, M.E.H.; Rahman, T.; Khandakar, A.; Mazhar, R.; Kadir, M.A.; Mahbub, Z.B.; Islam, K.R.; Khan, M.S.; Iqbal, A.; Emadi, N.A.E.A. Can AI Help in Screening Viral and COVID-19 Pneumonia? IEEE Access 2020, 8, 132665–132676. [Google Scholar] [CrossRef]
- The Wiki-Based Collaborative Radiology Resource. 2019. Available online: https://radiopaedia.org/ (accessed on 12 June 2024).
- Zhang, K.; Liu, X.; Shen, J.; He, J.; Lin, T.; Li, W.; Wang, G. Consortium of Chest CT Image Investigation (CC-CCII) Dataset. Cell 2020, 181, 1423–1433. [Google Scholar] [CrossRef]
- Perez, L.; Wang, J. The Effectiveness of Data Augmentation in Image Classification using Deep Learning. arXiv 2017, arXiv:1712.04621. [Google Scholar]
Disclaimer/Publisher’s Note: The statements, opinions and data contained in all publications are solely those of the individual author(s) and contributor(s) and not of MDPI and/or the editor(s). MDPI and/or the editor(s) disclaim responsibility for any injury to people or property resulting from any ideas, methods, instructions or products referred to in the content. |
© 2024 by the authors. Licensee MDPI, Basel, Switzerland. This article is an open access article distributed under the terms and conditions of the Creative Commons Attribution (CC BY) license (https://creativecommons.org/licenses/by/4.0/).