Article

Scalable and Demography-Agnostic Confinement Strategies for COVID-19 Pandemic with Game Theory and Graph Algorithms

by
Sreenitha Kasarapu
1,*,
Rakibul Hassan
1,
Houman Homayoun
2 and
Sai Manoj Pudukotai Dinakarrao
1
1
Department of Electrical and Computer Engineering, George Mason University, Fairfax, VA 22030, USA
2
Department of Electrical and Computer Engineering, University of California, Davis, CA 95616, USA
*
Author to whom correspondence should be addressed.
COVID 2022, 2(6), 767-792; https://doi.org/10.3390/covid2060058
Submission received: 3 May 2022 / Revised: 31 May 2022 / Accepted: 2 June 2022 / Published: 17 June 2022

Abstract

:
In the past, epidemics such as AIDS, measles, SARS, H1N1 influenza, and tuberculosis caused the death of millions of people around the world. In response, intensive research is evolving to design efficient drugs and vaccines. However, studies warn that new pandemics such as Coronavirus (COVID-19), variants, and even deadly pandemics can emerge in the future. The existing epidemic confinement approaches rely on a large amount of available data to determine policies. Such dependencies could cause an irreversible effect before proper strategies are developed. Furthermore, the existing approaches follow a one-size-fits-all control technique, which might not be effective. To overcome this, in this work, we develop a game-theory-inspired approach that considers societal and economic impacts and formulates epidemic control as a non-zero-sum game. Further, the proposed approach considers the demographic information that provides a tailored solution to each demography. We explore different strategies, including masking, social distancing, contact tracing, quarantining, partial-, and full-lockdowns and their combinations, and present demography-aware optimal solutions to confine a pandemic with minimal history information and optimal impact on the economy. To facilitate scalability, we propose a novel graph learning approach, which learns from the previously obtained COVID-19 game outputs and mobility rates of one state (region) depending on the other to produce an optimal solution. Our optimal solution is strategized to restrict the mobility between states based on the impact they are causing on COVID-19 spread. We aim to control the COVID-19 spread by more than 50% and model a dynamic solution that can be applied to different strains of COVID-19. Real-world demographic conditions specific to each state are created, and an optimal strategic solution is obtained to reduce the infection rate in each state by more than 50%.

1. Introduction

The human race has adapted and reshaped in past decades with the emergence of deadly viruses such as AIDS, measles, SARS, Ebola, H1N1 influenza, and Tuberculosis [1]. These viruses kill millions of people and create permanent health issues for many others. Such epidemics and pandemics are not new to mankind, and they follow a pattern of spreading [2]. Such pandemic threats, especially in modern civilization where cities are well connected, come with an extremely high human and financial cost. According to the world health organization (WHO), ongoing SARS-2 COVID-19 is declared a pandemic and has infected over 249 million people and claimed more than five million lives around the globe as of 7 November 2021 and still increasing [3].
As a measure to confine the COVID-19 pandemic, many public health organizations and government officials, including the White House, have declared an emergency across the globe [4]. Measures include, but are not limited to, mandatory mask usage, lockdown, social distancing, limited travel across countries, vaccine mandates, and many more. Although these measures are being enforced across the globe, they are followed differently due to the different factors such as demography, population density and distribution (age, race, underlying medical conditions), availability of personal protection equipment (PPE) kits and masks, variants of COVID-19 in different regions, varied voluntariness by the people to abide by the measures [5].
The data available from previous pandemics such as HIV/AIDS, Cholera, and Plague, as well as COVID-19, plays a key role in devising an efficient confinement strategy. The past epidemics and the adopted measures indicate that the confinement measures followed by a country or a region may not be suitable or effective in another country or region due to the aforementioned factors [2]. Due to variable demographic factors, a one-size-fits-all approach does not have practical benefits. Moreover, often in providing a confinement strategy for a region, the impacts of neighboring regions on disease spread are not considered [2]. Furthermore, the practice of such techniques comes at different costs for the government and the public. Thus, the challenge of confining the pandemic along with the minimal impact on the economy is a non-trivial challenge. Although the works such as [6] focus on the importance of the demography-based confinement strategy for the COVID-19 epidemic, they do not propose how to confine the spread while utilizing minimum resources.
To address this challenge, a game-theoretic optimization solution is proposed in this work. In recent times, game-based solutions have gained much credibility among researchers in solving epidemic spread problems [7,8] and financial decision-making scenarios [9,10]. Game theory perfectly captures the real-world scenario of disease spread and control policies in terms of masking, vaccinations, or other measures. These inspire the players of the game, the attacker, and the defender. The defender (Government) prioritizes controlling the attacker (COVID-19 virus) to decrease its losses (death of the infected and loss in economy). An attacker being a virus, works with its natural phenomena, that is, increasing its infection spread which can be termed as attacker’s gain. Game theory can be modeled to identify the best outcome of this social situation with different control strategies involved. Thus, we propose a demography-aware confinement strategy using a game theory that considers the demographic information such as population distribution, intra-, and inter-state mobility, under the economic and public-health constraints.
Furthermore, with the new variants of COVID-19, the confinement strategy needs to be dynamic to combat the spread of COVID-19 effectively. Though works such as [11], analyze the spread patterns of newer COVID-19 variants, the need for a model to be adaptable to different variants is necessary. By considering the dynamic infection rate and other epidemic traits; we build our confinement model so that it is easily applicable to variants of COVID-19 and produces a suitable optimal solution. For this purpose, we extend our previous game theory-based COVID-19 confinement strategy proposed in [12], by considering the external factors such as the in-flow and out-flow of people from the individual demographics into the Susceptible-Exposed-Infected-Recovered-Vaccinated-Dead (SEIRV/D) [13,14] model.
Despite being efficient, the game theory-based approaches [12] are limited to a smaller-scale, i.e., few tens of nodes (demographics). To apply game theory on a large scale, suppose each state of the United States would be a hugely time-consuming task. It is challenging to build a system containing demographic information of each state coupled with the ever-changing COVID-19 mutations and restrictions. All this data must be collected, nodes should be created (containing demographic information of each state), and these nodes must be interconnected to mimic the real-world scenario. To make this plausible, we employ graph-learning [15]. Graph learning makes it possible to create nodes of each state containing specific demographic information and a graph database. The nodes are connected based on the mobility rates, replicating the real-world conditions. The graph Learning algorithm is built to identify the high impact connection from the graph and alter it. The mobility between states is restricted by altering the connections, affecting the COVID-19 spread. Thus, we propose to introduce a demography- and mobility-aware COVID-19 infection confinement policy-making system which will be able to decrease the infection rate of each state by more than 50%.
The cardinal contributions of this work can be outlined in a three-fold manner as follows:
  • Propose a demographic-aware game-theory-based solution for COVID-19 confinement.
  • Replicate real-world inter-and intra-state public transit mobility information and utilize it for the confinement of COVID-19 and its variants.
  • Graph-theory solution to restrict mobility between states and health policies to be adopted by demographics for COVID-19 confinement (https://github.com/sreenithakasarapu/COVID-19_game) (accessed on 04 April 2022).
Our contributions in this paper include building a COVID-19 confinement model with the help of the epidemic modeling technique, game theory, and graph theory; capturing the demographic information of each state and analyzing these factors to understand which ones are influencing the rapid COVID-19 spread and restricting them; and giving a dynamic confinement model which can be easily adapted to different variations of COVID-19 for producing suitable optimal solutions.
The rest of the paper is organized as follows: Section 2 describes the related work and its shortcomings and comparison with the proposed model. Section 3 describes the proposed architecture. The experimental evaluations of the proposed model are illustrated in Section 4 followed by the limitations of the proposed technique described in Section 5. The conclusions drawn from the proposed technique are explained in Section 6.

2. Related Work

In this section, we present some of the related works on epidemic modeling and confinement. To confine an epidemic, it is imperative to understand the spread of the virus. As such, modeling the spread of a novel virus is crucial to devising a confinement strategy. We first review the epidemic-spreading models, followed by the confinement strategies.
There have been several epidemic models proposed in the literature for infectious diseases. Some well-studied models fall under the compartmental modeling techniques [16,17] where the population falls under certain compartments such as Susceptible (S), Infectious (I), or Recovered (R) [18]. In agent-based modeling, there are a group of agents present, and the interactions among those agents are simulated to predict the dynamics of the disease [19].
The SIS and SIR are the two most studied and applied compartmental models for an epidemic disease where the models have two common population compartments; namely, the Susceptible group and the Infected (I) group [20]. In the Susceptible-Infected-Susceptible (SIS) model, the population is divided into a Susceptible group and an Infected group. A susceptible individual can be infected with some probability, whereas the infected individual can be brought back to the susceptible status. The Susceptible-Infected-Recovered (SIR) model has only one difference from the SIS model: the Recovered status. In the SIR model, a person becomes infected, then he/she becomes immune to the virus after a long time. Whereas, in the SIS model, one Infected individual can be Infected again.
The SEIR is another popular model with one additional status: the “E” status. Here, an individual becomes Exposed before being Infectious, meaning that the individual is not infecting other individuals but rather exposed to the virus [21,22]. To portray a particular infectious disease, some additional intermediate statuses better capture the dynamics of the epidemics. Another compartmental model, named SEIRD, has five different statuses. This model has one additional status to the SEIR model: the Died (D) status. Unlike the SEIR model, which groups the recovered and the dead individual as one status, i.e., Recovered status, this SEIRD model treats the Recovered and the dead individuals as two different statuses. The SIR and SEIRD and a variety of other compartmental models have been extensively applied to model the novel COVID-19 outbreak [12]. Works in [23,24] propose an agent-based model where there exist some agents such as demography-specific age-groups and their household, way of living, health care facilities, and the outcome of being infected to the disease for forecasting the spread pattern of the novel COVID-19 pandemic.
Several works have reported on the effectiveness of the COVID-19 control strategies and critical model parameters involved in COVID-19 spread [25]. In [17,26], the authors discuss the effectiveness of quarantine, lockdown and isolation using the traditional Susceptible-Exposed-Infected-Recovered (SEIR) model. Authors propose a neural network-inspired SIR model that learns how to increase the quarantine control strength, which lowers the infection rate in [27]. Work in [28] proposes an age-structured SEIR model and simulates the model for several physical distancing parameters. Their simulation results show that physical distancing is a practical solution to lowering the infection curve.
An improved SEIR model is used in [29] with a combination of genetic algorithms to build a model that can predict the COVID-19 trend. In [30], a modified SEIR model is developed that proposes different confinement strategies such as horizontal and vertical lockdown strategies to confine the COVID-19 pandemic and report their impacts on (a) number of hospitalizations, (b) the number of ICU beds, and (c) the number of fatalities. Their model was evaluated on the population of Brazil only. They divided the population into nine age groups and observed the impact of quarantining different age groups for some time. They concluded that quarantining each age group has a different impact on the resources and suggested that authorities should consider additional actions in addition to the age-based confinement strategy.
Similar work has been reported in [31]. Works such as [6] focus on the importance of the demography-based confinement strategy for the COVID-19 epidemic; they do not propose how to confine the spread while utilizing minimum resources.
Table 1 discusses the state-of-the-art epidemic confinement techniques. These techniques consider a variety of factors in developing control policies for disease spread. Factors such as economic concerns, economic costs, and the population are observed to be effective in formulating control strategies. As shown in Table 1, they use many efficient methods such as genetic algorithms [32], stochastic search strategy, graph theory [33], and compartmental modeling techniques [11,17]. They also use policies such as physical distancing, quarantining, shield immunity, and contact tracing, in modeling their techniques [28,30]. The main drawback with these techniques is that they use the same policies for the whole country, imposing the “one-size-fits-all” notion. However, a localized technique that considers demographic factors at a state level would be more effective in controlling the disease. Furthermore, most of these techniques don’t consider the demographic and mobility changes in each state or behavioral changes of people which impact the disease spread.
The proposed technique works to address the challenges in the existing techniques. By introducing a demographic-aware game-theory [12] technique, we were able to obtain a suitable control policy for each state and vary it with time to optimize the infection spread. To factor in the impact of external factors in formulating its disease control policies, we consider the demographic and mobility factors of each state. A game-theoretic optimization solution is proposed in [12], where we considered the Susceptible-Exposed-Infected-Recovered-Dead (SEIRD) model [34,35] to predict the COVID-19 epidemic spread [36] and applied a novel non-zero-sum game theory to analyze the impact on the epidemic spread and the economy under different strategies for different demographics. Although [12] produced results reducing the infection rate in all the states of the US on individual demographics, it does not consider the inter-dependencies between the states. That is, it does not factor in the effect induced on one state from other states. It is essential to consider the inter-dependency factor because factors such as mobility from one state to another can be the root of causing the COVID-19 spread.
Graph learning is becoming essential to providing solutions for these kinds of substantial inter-linked data [42]. In [33], the authors observe the cause of COVID-19 spread in Italy using a three-way decision to evaluate critical regions based on Graph Theory. They use a centrality graph algorithm to identify which region is critical for disease spread. They introduce methods to decrease the centrality effect of that particular region by a uniform decrease in centrality values and accounting for the mobility changes due to the centrality. They estimate the centrality of each region to make decisions at the national level to decrease the spread but do not produce any solution to do so. They also do not consider the demographic information at the state level in formulating their estimations.
To consider the effects of inter-state demographics on COVID-19 spread, we formulate a new solution using a graph algorithm. So, rather than only producing estimations of which state is critical in the spread, we try to produce solutions that can control the spread with optimal strategies specific to each state. We produce strategic solutions like masking, social distancing, or contact tracing based on the demographics of each state. We also produce a restricted mobility solution specific to each state by restricting each state’s incoming and outgoing mobility rates. As COVID-19 mutates, we induce different cases, which help us understand COVID-19 spread even with differing spread patterns.

3. Proposed Graph Algorithm-Based COVID-19 Confinement

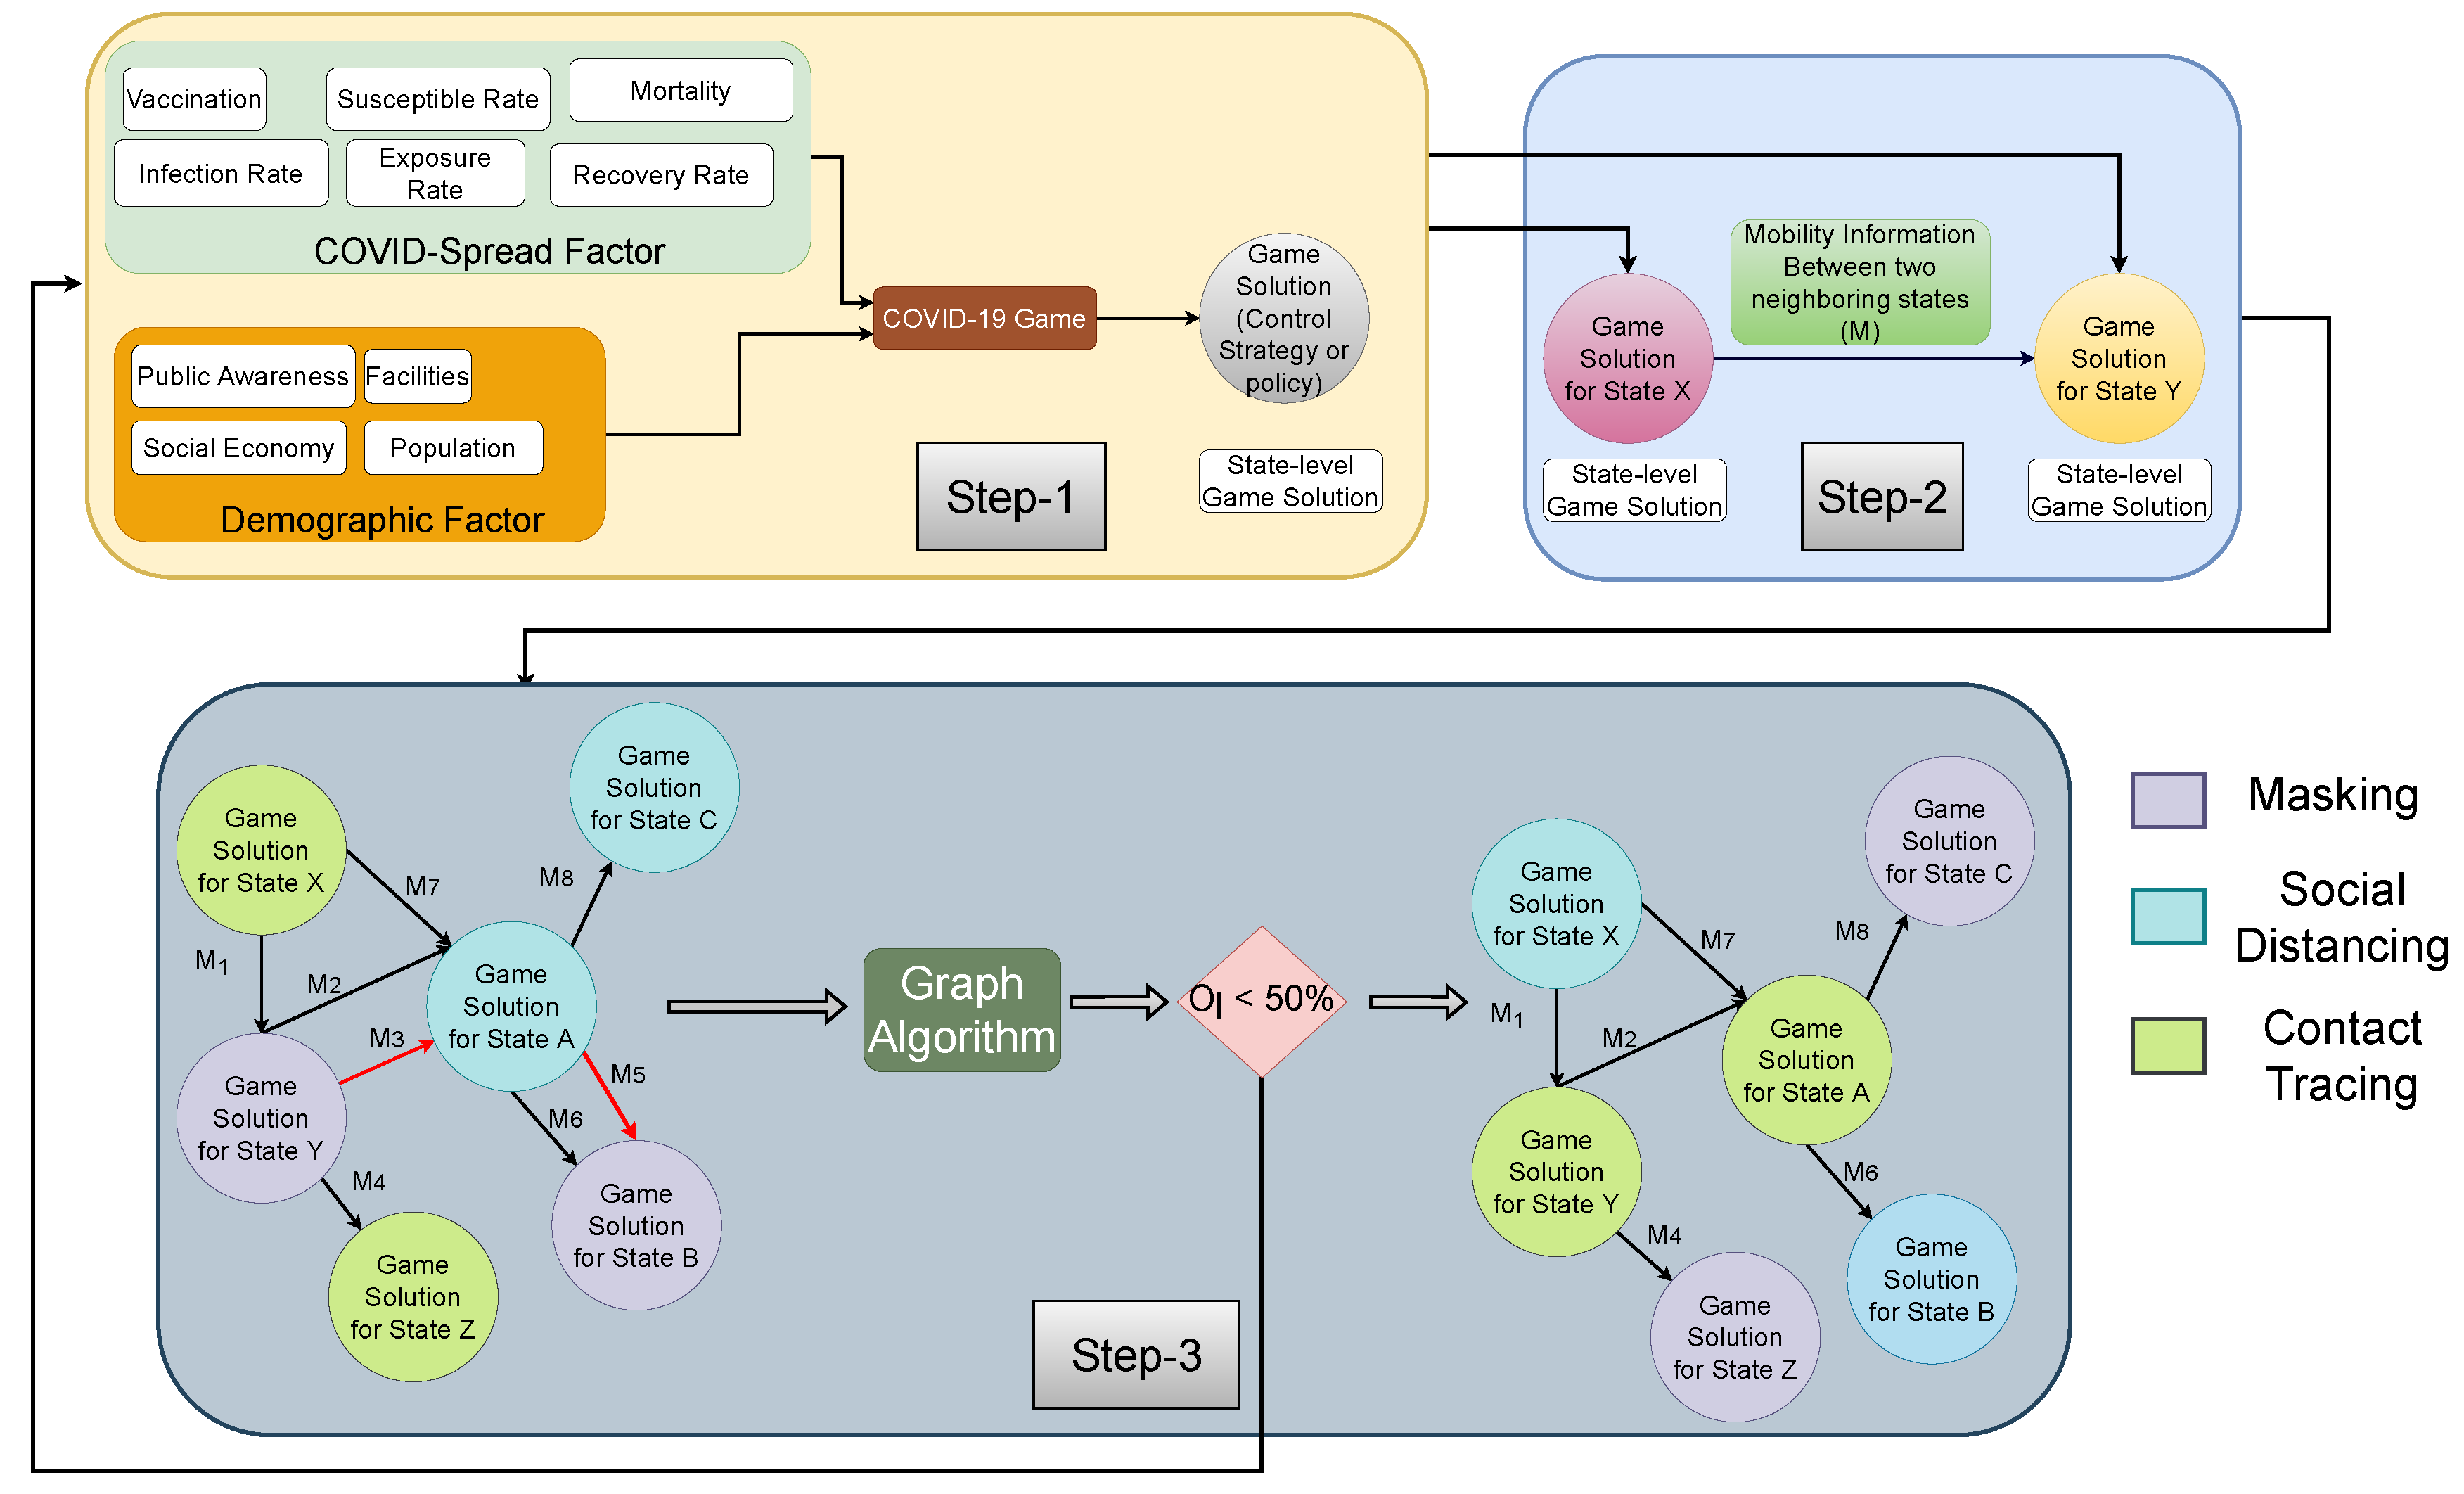
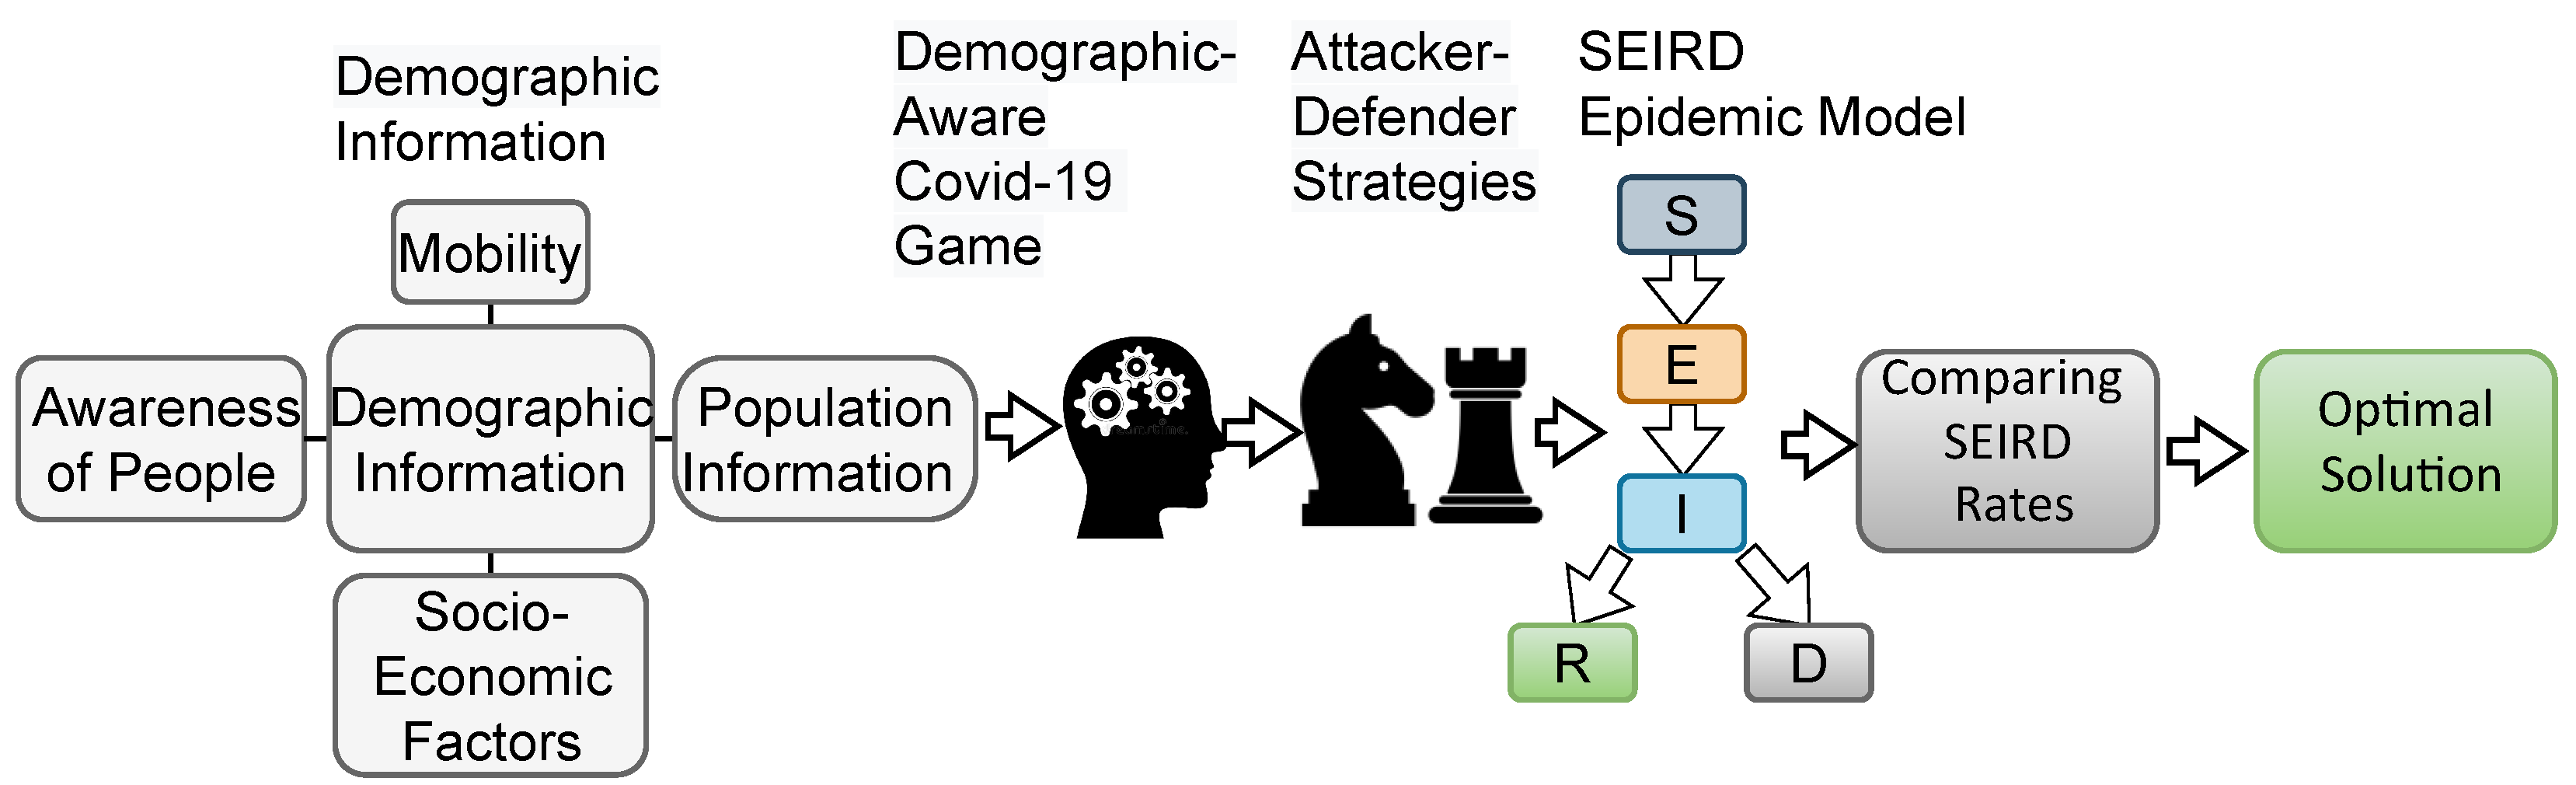
The proposed technique mimics the real-world dependencies for COVID-19 confinement. The process includes considering the demographic factors of specific locations impacting the COVID-19 spread.
The demographic factors such as population, facilities, public willingness to vaccination, isolation, and socio-economic factors vary from state to state. These factors would impact the COVID-19 spread from state to state. Based on this information, a COVID-19 game is built to control the infection rates of different states in the US. However, the demographic factors do not consider the mobility between states which creates interdependencies between states for COVID-19 spread. To include the individual location’s demographics and the dependencies between locations, we propose the Graph-Learning based iterative technique in modeling a solution for COVID-19 spread.
The proposed solution is a three-step iterative process as shown in Figure 1 containing: (1) a COVID-19 game based on game theory; (2) creating a graph database; and (3) a graph algorithm. Different colors in the figure distinguishes the various step. The technique starts with a COVID-19 game, constructed based on game theory. The game contains two players: the attacker, and the defender. The attacker is the COVID-19, whose intention is to spread the disease, and the defender is the government, trying to decrease the virus spread. Players come up with specific strategies to escalate their chance of winning. Based on the player’s strategies, the SEIRV/D epidemic model (considered in this work) is altered, and the disease spread is observed. An optimal solution is chosen based on the cost functions. The optimal solution is a control strategy to obtain a low-infection rate, limiting the virus spread with minimal cost.

3.1. Overview of the Proposed Solution

Further, to create inter-dependencies, we take each state’s demographic factors and game theory strategic solution to create nodes representing each state, as shown in step 2 of Figure 1. These nodes are connected using mobility information, to form a graph database. A graph learning algorithm is developed to identify the high impacting connection in virus spread. In this work, graph learning refers to learning the mobility and infection rates from the graph (demographic topology) and the ability to formulate a control solution from them. The high impacting connections are removed, and each state’s infection rates are updated and given as input to the COVID-19 game theory. The process occurs iteratively, between game theory-based confinement and graph learning algorithm until the virus spread is confined up to 50%.
The connection between states is completely broken with the stay-at-home [43] and quarantine [44] orders where people are not allowed to cross their states or provinces. However, in a real-world scenario, the connection between states may not be completely broken, for such cases, the proposed technique has a mobility factor, where 0 indicates a strict travel ban, whereas 1 indicates no travel restrictions and the intermediate values (0–1) indicate looser restrictions, i.e., the weight of the edges is modified in our technique to restrict the mobility, if not completely broken for better confinement of the disease.
At the end of the solution, each state gets assigned a control strategy that best fits them, based on the demographic conditions. The control strategy is the optimal solution to the proposed technique, which can decrease the disease spread, i.e., the infection rate 50% under limited cost, is considered to be the optimal strategy in confining the disease.

3.2. Modeling of SARS-2 COVID-19 Epidemic

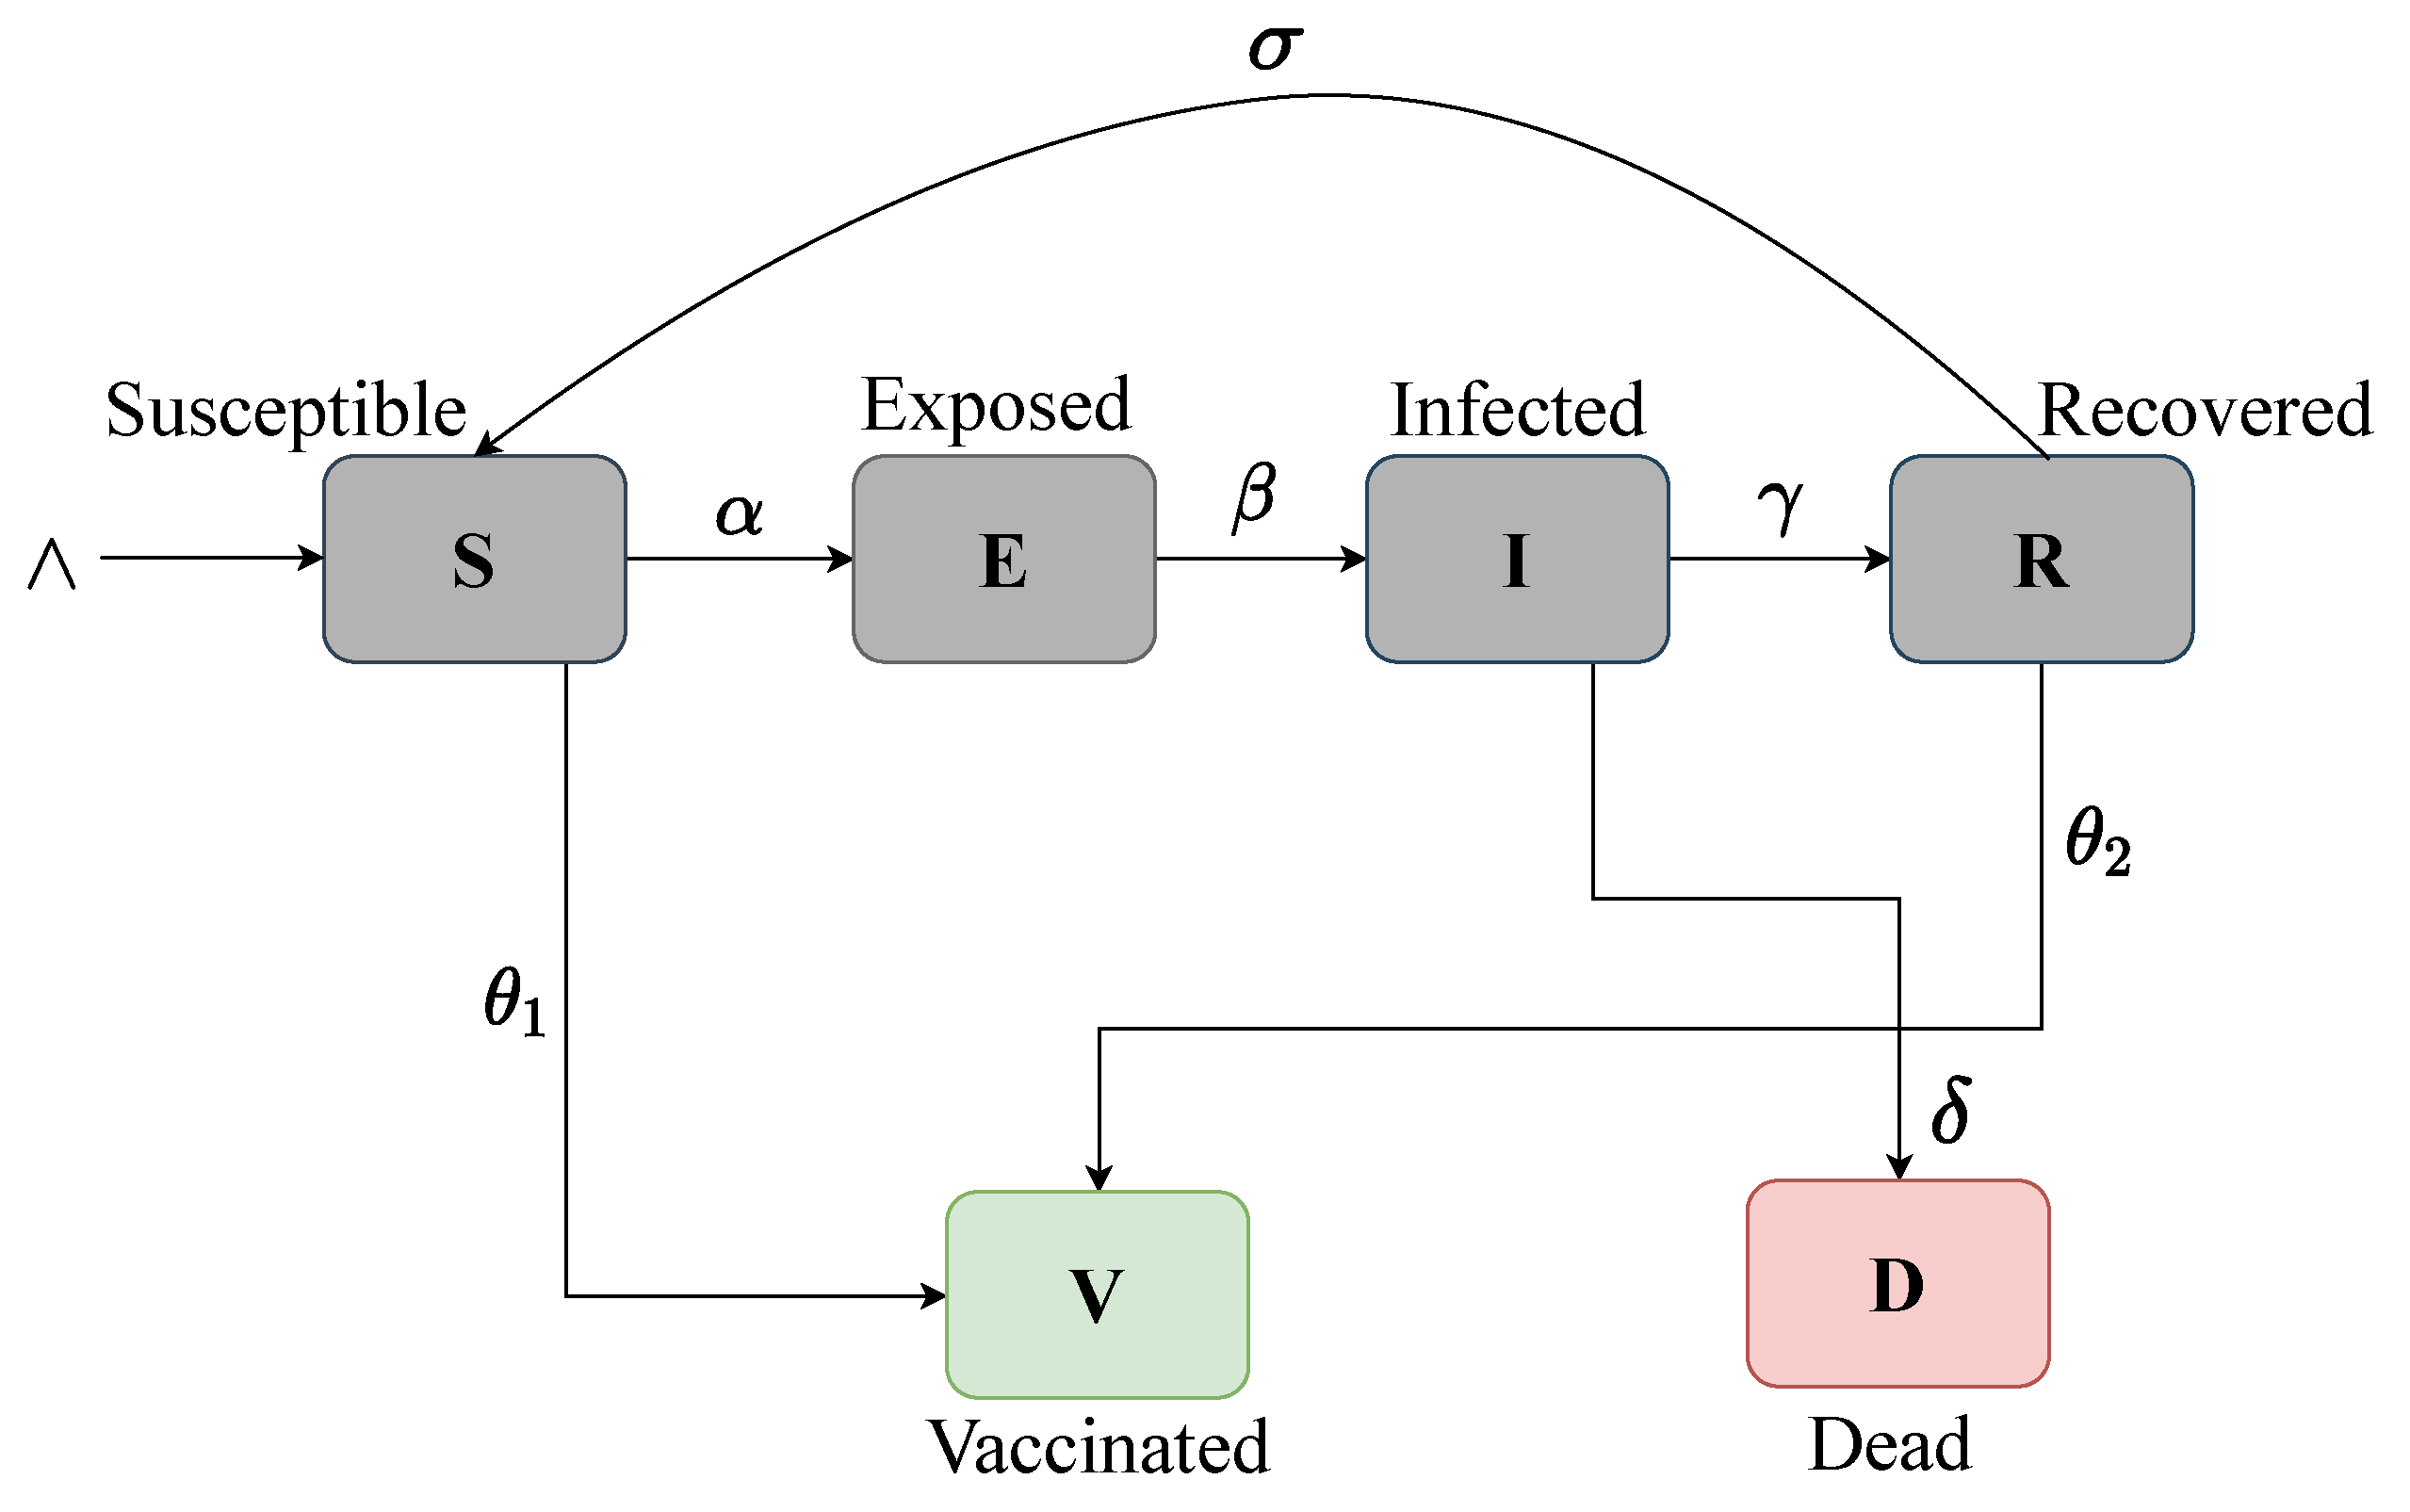
As outlined in the overview, we proposed a compartmental SEIRV/D model [13] to analyze the spread of the SARS-2 COVID-19 disease. SEIRV/D is widely used to model infectious diseases [13] mathematically. We employ this model based on the fact that COVID-19 has an incubation period, i.e., a person who is exposed might not be infected immediately, and a person who is recovered from the disease can be reinfected, COVID-19 may also lead to the death of an infected person. The only case a person can be prevented from being re-infected by the COVID-19 infection is to get vaccinated. Hence, the SEIRV/D model is considered in this work, in contrast to the SEIR or SIR models.
In SEIRV/D, S represents the number of susceptible people, E represents the number of people who are exposed, I represents the number of people infected, R represents the number of people recovered from the disease, V is the number of people who are vaccinated against the disease and D represents the number of people dead by the disease.
As represented in Figure 2, at the beginning of the disease, the whole population is Susceptible (S) to the disease, then a certain fraction of people get Exposed (E) to the disease. The infection has an incubation period, in which, from the exposed population, a certain fraction of people will be Infected (I) by the disease. Among the infected people, a certain fraction of people will be Recovered (R) but can get reinfected, and a certain fraction of the infected will be Dead (D). In each time instance, a certain fraction of people are Vaccinated (V), who are assumed to be excluded from the epidemic spread.
S ( t ) = d S d t = N ( t ) α S ( t ) I ( t ) + σ R ( t ) θ 1 S ( t ) ,
E ( t ) = d E d t = α S ( t ) I ( t ) β E ( t ) ,
I ( t ) = d I d t = β E ( t ) γ I ( t ) δ I ( t ) ,
R ( t ) = d R d t = γ I ( t ) σ R ( t ) θ 2 R ( t ) ,
V ( t ) = d V d t = θ 1 S ( t ) + θ 2 R ( t ) ,
D ( t ) = d D d t = δ I ( t ) ,
At any given point of time the total population can be divided into S ( t ) , E ( t ) , I ( t ) , R ( t ) , V ( t ) and D ( t ) elements. So the total population N ( t ) of any effected area, can be represented as sum of all these factors.
N ( t ) = S ( t ) + E ( t ) + I ( t ) + R ( t ) + V ( t ) + D ( t ) ,
In the above equations, N is the total population, ∧ is the susceptible rate of the population to the disease, α represents the population exposure rate to the disease, β is the transmission rate of the disease, γ is the recovery rate of the infected population, δ represents the mortality rate of the infected population, θ 1 represents the rate of people vaccinated against the disease who are in the susceptible status. Moreover, θ 2 represents the rate of people vaccinated against the disease and in the recovered status. The explanation of these symbols are also provided in Table 2 and Table 3.
Thus, the population is divided into the above-mentioned compartments and the people are progressed between the compartments in the SEIRV/D order, as shown in Figure 2.

3.3. COVID-19 Confinement with Game Theory

Game Theory is the process of modeling the strategic changes between two or more players. That is building-specific strategies for the players and cost functions for each player to enforce the strategy. The players in the gameplay as opponents, known as attackers and defenders, and each trying to win the game. The attacker tries to maximize their gain with minimal attacker cost, while the defender tries to maximize their gain and minimize their defender cost. Each player formulates certain strategies, supporting their chance of winning. By measuring the impact of the strategies and their costs, game theory produces the game’s outcome.
We consider two players for the COVID-19 game, an attacker and a defender. The attacker tries to increase the number of people infected by the disease, and the defender tries to decrease the number of people infected by the disease. Usually, one player’s gain would be another player’s loss, and there will be a Nash Equilibrium attained by the gain, which will be equal to zero. However, with the COVID-19 game, Nash equilibrium can not be achieved, that is, the attacker’s gain will usually be higher than the defender’s loss. This is because the defender cannot recover the infected people at the same rate as the attacker infects them. So this game is a Non-Zero Sum game. Figure 3 shows the workflow of our proposed game-theoretic framework for COVID-19 confinement.
The Table 4, represents the attacker’s and defender’s strategies used in the COVID-19 game.
The attacker’s enforced strategies try to speed up the infection rate, such as reduced incubation, mutation of the virus, and creating red zones. A reduced incubation strategy decreases the virus’s incubation period, and thereby, the exposed person can transmit the virus immediately. Evolution or mutations of the virus make the traditional defense strategies (including vaccines in some scenarios) less effective and force the defender to employ more costly techniques. Red Zones are certain areas such as malls, gyms, movie theatres, recreational centers, and clubs where there will be more people in a close space, so the attacker has the chance to infect more people. To enforce these techniques the attacker needs to pay a certain cost. Thus, the payoff for each attacker strategy is defined as follows:
C R I = [ S ( t ) + R ( t ) ] · A R I ; C E = [ S ( t ) + R ( t ) ] · A E ,
C R E D = [ S ( t ) + R ( t ) ] · A R Z ,
In the above equations, S ( t ) is the number of people susceptible to the disease; I ( t ) is the number of people infected with the disease; A R I represents the attacker’s cost of reduced incubation; A E represents the attacker’s cost of evolution; A R Z represents the attacker’s cost of red zones; and C R I , C E , C R E D represent the cost functions of reduced incubation, evolution, and red zone attacker strategies, respectively.
The defender’s strategies are targeted to decrease the infection rate, to minimize the number of people infected. The defender’s strategies are masking, social distancing, and contact tracing. With the masking technique, the susceptible people are advised to follow masking, and people who are infected will be masked mandatorily; with this, the spread of infection can be controlled. In the social distancing strategy, the susceptible people are advised to follow social distancing, and those who are infected will be asked to follow strict social distancing. In the contact tracing strategy, the infected people and the people they met after being infected are traced and isolated. The costs associated with each of these strategies are modeled as follows:
C M = D M M · I ( t ) + D M · S ( t ) ; C C T = D C T · I ( t ) ,
C S D = D S S D · I ( t ) + D S D · S ( t ) ,
In the above equations, S ( t ) is the number of people susceptible to the disease in the above equations; I ( t ) is the number of people infected with the disease; D M M represents the cost of mandatory masking; D M represents the defender cost of masking; C S S D represents the cost of strict social distancing; D S D represents the cost of social distancing; D C T represent the cost of contact tracing; and C M , C S D , C C T represent the cost functions of masking, social distancing, and contact tracing strategies, respectively. The total defender payoff can be defined as follows:
P D = r m · C M + r s d · C S D + r c t · C C T ,
where r m represents the percentage of strategy masking being enforced; C M represents the masking strategy cost; r s d represents the percentage of strategy social distancing being enforced; C S D represents the social distancing strategy cost; r c t represents the percentage of strategy contact tracing being enforced; and C C T represents the contact tracing strategy cost.
In this work, the defender is the government or public health agencies that try to control the spread of COVID-19. Thus, the defender (government) allocates this budget based on total funds available for different activities to curb the pandemic, such as costs for paying front-line workers, testing, vaccination, building hospitals, boosting facilities during the pandemic, and providing PPE kits. We assume that the total defender’s payoff is less than the allocated defender budget to minimize the economic impacts. However, the maximum cost defender can pay for enforcing the strategies is equal to the maximum amount available in the budget.

3.4. Optimal Strategy for COVID-19 Using Game Theory

We build an attacker-defender game, enforce different strategies, and observe the COVID-19 spread pattern using the SEIRV/D epidemic model. To be specific to the state, we consider demographic information of each state such as population, public awareness, socio-economic factors, economic costs, and willingness to vaccination. These factors would impact the COVID-19 spread from state to state. We consider all these factors in formulating a new term λ , the demographic factor. λ is defined as follows:
λ = x · F 1 + y · F 2 + z · F 3 + ,
In Equation (13), λ is the demographic factor which is the sum of factors F 1 , F 2 , F 3 , that vary from state to state and must be considered to observe their effect in COVID-19 spread. x, y, and z are the rates of each of these factors’ impact. We assume that x + y + z + ⋯= 1. Demographic factors such as economic costs, socio-economic factors of the state, and medical infrastructure available of each state are considered to handle an epidemic.
We redefine the equation of the number of people infected I ( t ) from the S E I R V / D epidemic model by adding the demographic factor λ . I ( t ) is updated because demographic factors such as economic costs, medical infrastructure, etc, can influence the disease spread. All the other factors S ( t ) , E ( t ) , R ( t ) , V ( t ) , and D ( t ) are dependent on I ( t ) . So, by changing I ( t ) , we are indirectly changing other epidemic modeling terms. The redefined I ( t ) in terms of λ is shown in the following equation.
I x ( t ) = d I d t = ( β + λ ) · E ( t ) γ · I ( t ) ,
In Equation (14), α is the transmission rate of the disease, λ is the demographic factor of each state, and β is the recovery rate of the people infected by the disease.
The epidemic S E I R V / D model is dependent on variables such as, ∧, α , β , γ , δ and λ . Nevertheless, the optimal solution for the game is modeled based on S E I R V / D variations, so the COVID-19 game can be defined as follows:
G C = G T ( , α , β , γ , δ , λ ) ,
To obtain an optimal control strategy from the COVID-19 game, the following steps must be followed as shown in Algorithm 1. The inputs to the game are COVID-19 spread factors such as , α , β , γ , δ and the demographic factor λ . The COVID-19 spread is observed at different time instances by varying , α , β , γ , δ and the impact they create on S, E, I, R, V, and D terms. At each time interval, the infection is tried to confine by using certain defender strategies. The impact of each strategy is estimated in terms of, the amount of decrease in the infection rate they can achieve and how much they cost. After comparing these factors of each defender strategy, a strategy that can achieve the least infection rate at a minimum cost is considered as game theory optimal control policy and assigned to the state.
Algorithm 1: Optimal Game Theory Strategy.
1:
Input: Susceptible rate ( α ), Infection rate ( β ), Recovery rate ( γ ), mortality rate δ , demographic impact factor λ , Budget B
2:
   define  G T ( , α , β , γ , δ , λ ) :
3:
     for  t v a l u e s : do
4:
          s S ( t )
5:
          e E ( t )
6:
          i I x ( t )
7:
          r R ( t )
8:
          v V ( t )
9:
          d D ( t )
10:
         m = r m · C M
11:
         c t = r C T · C C T
12:
         s d = r S D · C S D
13:
        if m or ct or sd > B
14:
          break
15:
        else
16:
           s c = m i n ( m I M , c t I C T , s d I S D )
17:
           i c = s c . I x
18:
          end if
19:
        end for
20:
      G C = { i c , s c }
21:
     return  G C
22:
Output:  G C
Algorithm 1 represents the workflow of the COVID-19 game using game theory. G T ( , α , β , γ , δ , λ ) represents the game theory function and , α , β , γ , δ , λ are inputs to the game. Where ∧ is the susceptible rate of the population to the disease, α represents the population exposure rate to the disease, β is the transmission rate of the disease, γ is the recovery rate of the infected population, and δ represents the mortality rate of the infected population.
For different time instances t, the disease spread is observed. So, in Algorithm 1, the time t is in a for a loop. The variables S ( t ) , E ( t ) , I ( t ) , R ( t ) , V ( t ) and D ( t ) are updated over different time values (instances). The updated variables are stored in susceptible s, exposed e, infected i, recovered r, vaccinated v, and dead d terms. Our goal is to make the defender win by selecting a defender strategy that can control the COVID-19 infection rate. All the defender strategies are analyzed to determine which can decrease the COVID-19 infection rate and the cost they require to achieve it. The total cost of a strategy is calculated by multiplying the percentage of its application and the cost for it. So for masking m, the total cost is defined as, the percentage of masking r m times the cost of masking C M , For contact tracing c t , the total cost is defined as the percentage of contact tracing r c t times the cost of contact tracing C C T . Moreover, for social distancing s d , the total cost is defined as the percentage of social distancing r s d times the cost of social distancing C S D . The cost functions C M , C C T and C S D are taken from Equations (10) and (11).
The budget B is the total defender budget. All the strategies should abide by this budget to play the COVID-19 game. If the defender strategy cost is more than the budget B, the COVID-19 game will be terminated. If the defender strategies fall under the budget B, the COVID-19 game is played to obtained the confined infection rate i and the optimal control strategy s c specific to each demography.
The function min ( m I M , c t I C T , s d I S D ) accesses each defender strategy and produces an optimal control strategy as an output to the game. Where, m I M is a function of the masking strategy m and its controlled infection number I M . The c t I C T is a function of the contract tracing strategy c t , and its controlled infection number I C T . The s d I S D is a function of social distancing strategy s d , and its controlled infection number I S D . The selected control strategy and corresponding confined infection rate are given as outputs to the COVID-19 game G C . The selected control strategy is stored in variable s c and its corresponding confined infection rate is stored in the variable i c .
We currently have many variations of COVID-19; the disease is mutating with spread patterns. So for the ever-changing disease, we cannot formulate a single solution and use it for variations. We need a dynamic solution, which is adaptable to different COVID-19 mutations. To study if our model produces a suitable solution for COVID-19 variants, we vary the game’s input parameters and observe the game’s output effectiveness. So we vary game input variables such as ∧, α , β , γ , δ , and λ with three different values for each variable, considered as best-case scenario to worst-case scenario. We even vary λ because there could be changes in the demographic conditions.
As shown in Algorithm 2, three different values are considered for each of the following variables, susceptible rate 1 , 2 , 3 , disease exposure rate α 1 , α 2 , α 3 , transmission rate β 1 , β 2 , β 3 , recovery rate γ 1 , γ 2 , γ 3 , mortality rate δ 1 , δ 2 , δ 3 and factors that represent demographic conditions λ 1 , λ 2 , λ 3 . The values are taken from the New York Times [45] daily COVID-19 reports of each state and their demographic factors. For each state, these variables are iterated using loop and given as input to the game theory function G T ( ) , represented as G T ( , α , β , γ , δ , λ ) . For j in the range of 3, ( j ) , α ( j ) , β ( j ) , γ ( j ) , δ ( j ) , λ ( j ) are iterated with their initialized values. As shown in Algorithm 2, for each case, game theory G T ( , α , β , γ , δ , λ ) plays the COVID-19 game and control strategy as output. The output control strategy to confine the disease is stored in the s c variable. Moreover, s c values are appended to a form a list of solutions represented as s c n . Here, n represents the list of all states in US. s c n contains output to the COVID-19 game for different states in US with varied demographic and infection conditions.
Algorithm 2: Game-Theory Optimal Strategics for Variants.
1:
Input:  α 0 , β 0 , γ 0 , δ 0 , λ 0 , s n = [ ]
2:
    = [ 1 , 2 , 3 ]
3:
    α = [ α 1 , α 2 , α 3 ]
4:
    β = [ β 1 , β 2 , β 3 ]
5:
    γ = [ γ 1 , γ 2 , γ 3 ]
6:
    δ = [ δ 1 , δ 2 , δ 3 ]
7:
    λ = [ λ 1 , λ 2 , λ 3 ]
8:
   for  s t a t e n
9:
     for  j r a n g e ( 3 ) : do
10:
         ( j )
11:
         α α ( j )
12:
         β β ( j )
13:
         γ γ ( j )
14:
         δ δ ( j )
15:
         λ λ ( j )
16:
         , s c = G T ( , α , β , γ , δ , λ ) {// Algorithm 1)
17:
         s c n . a p p e n d ( s c )
18:
        end for
19:
     end for
20:
Output:  s c n

3.5. Graph Theory

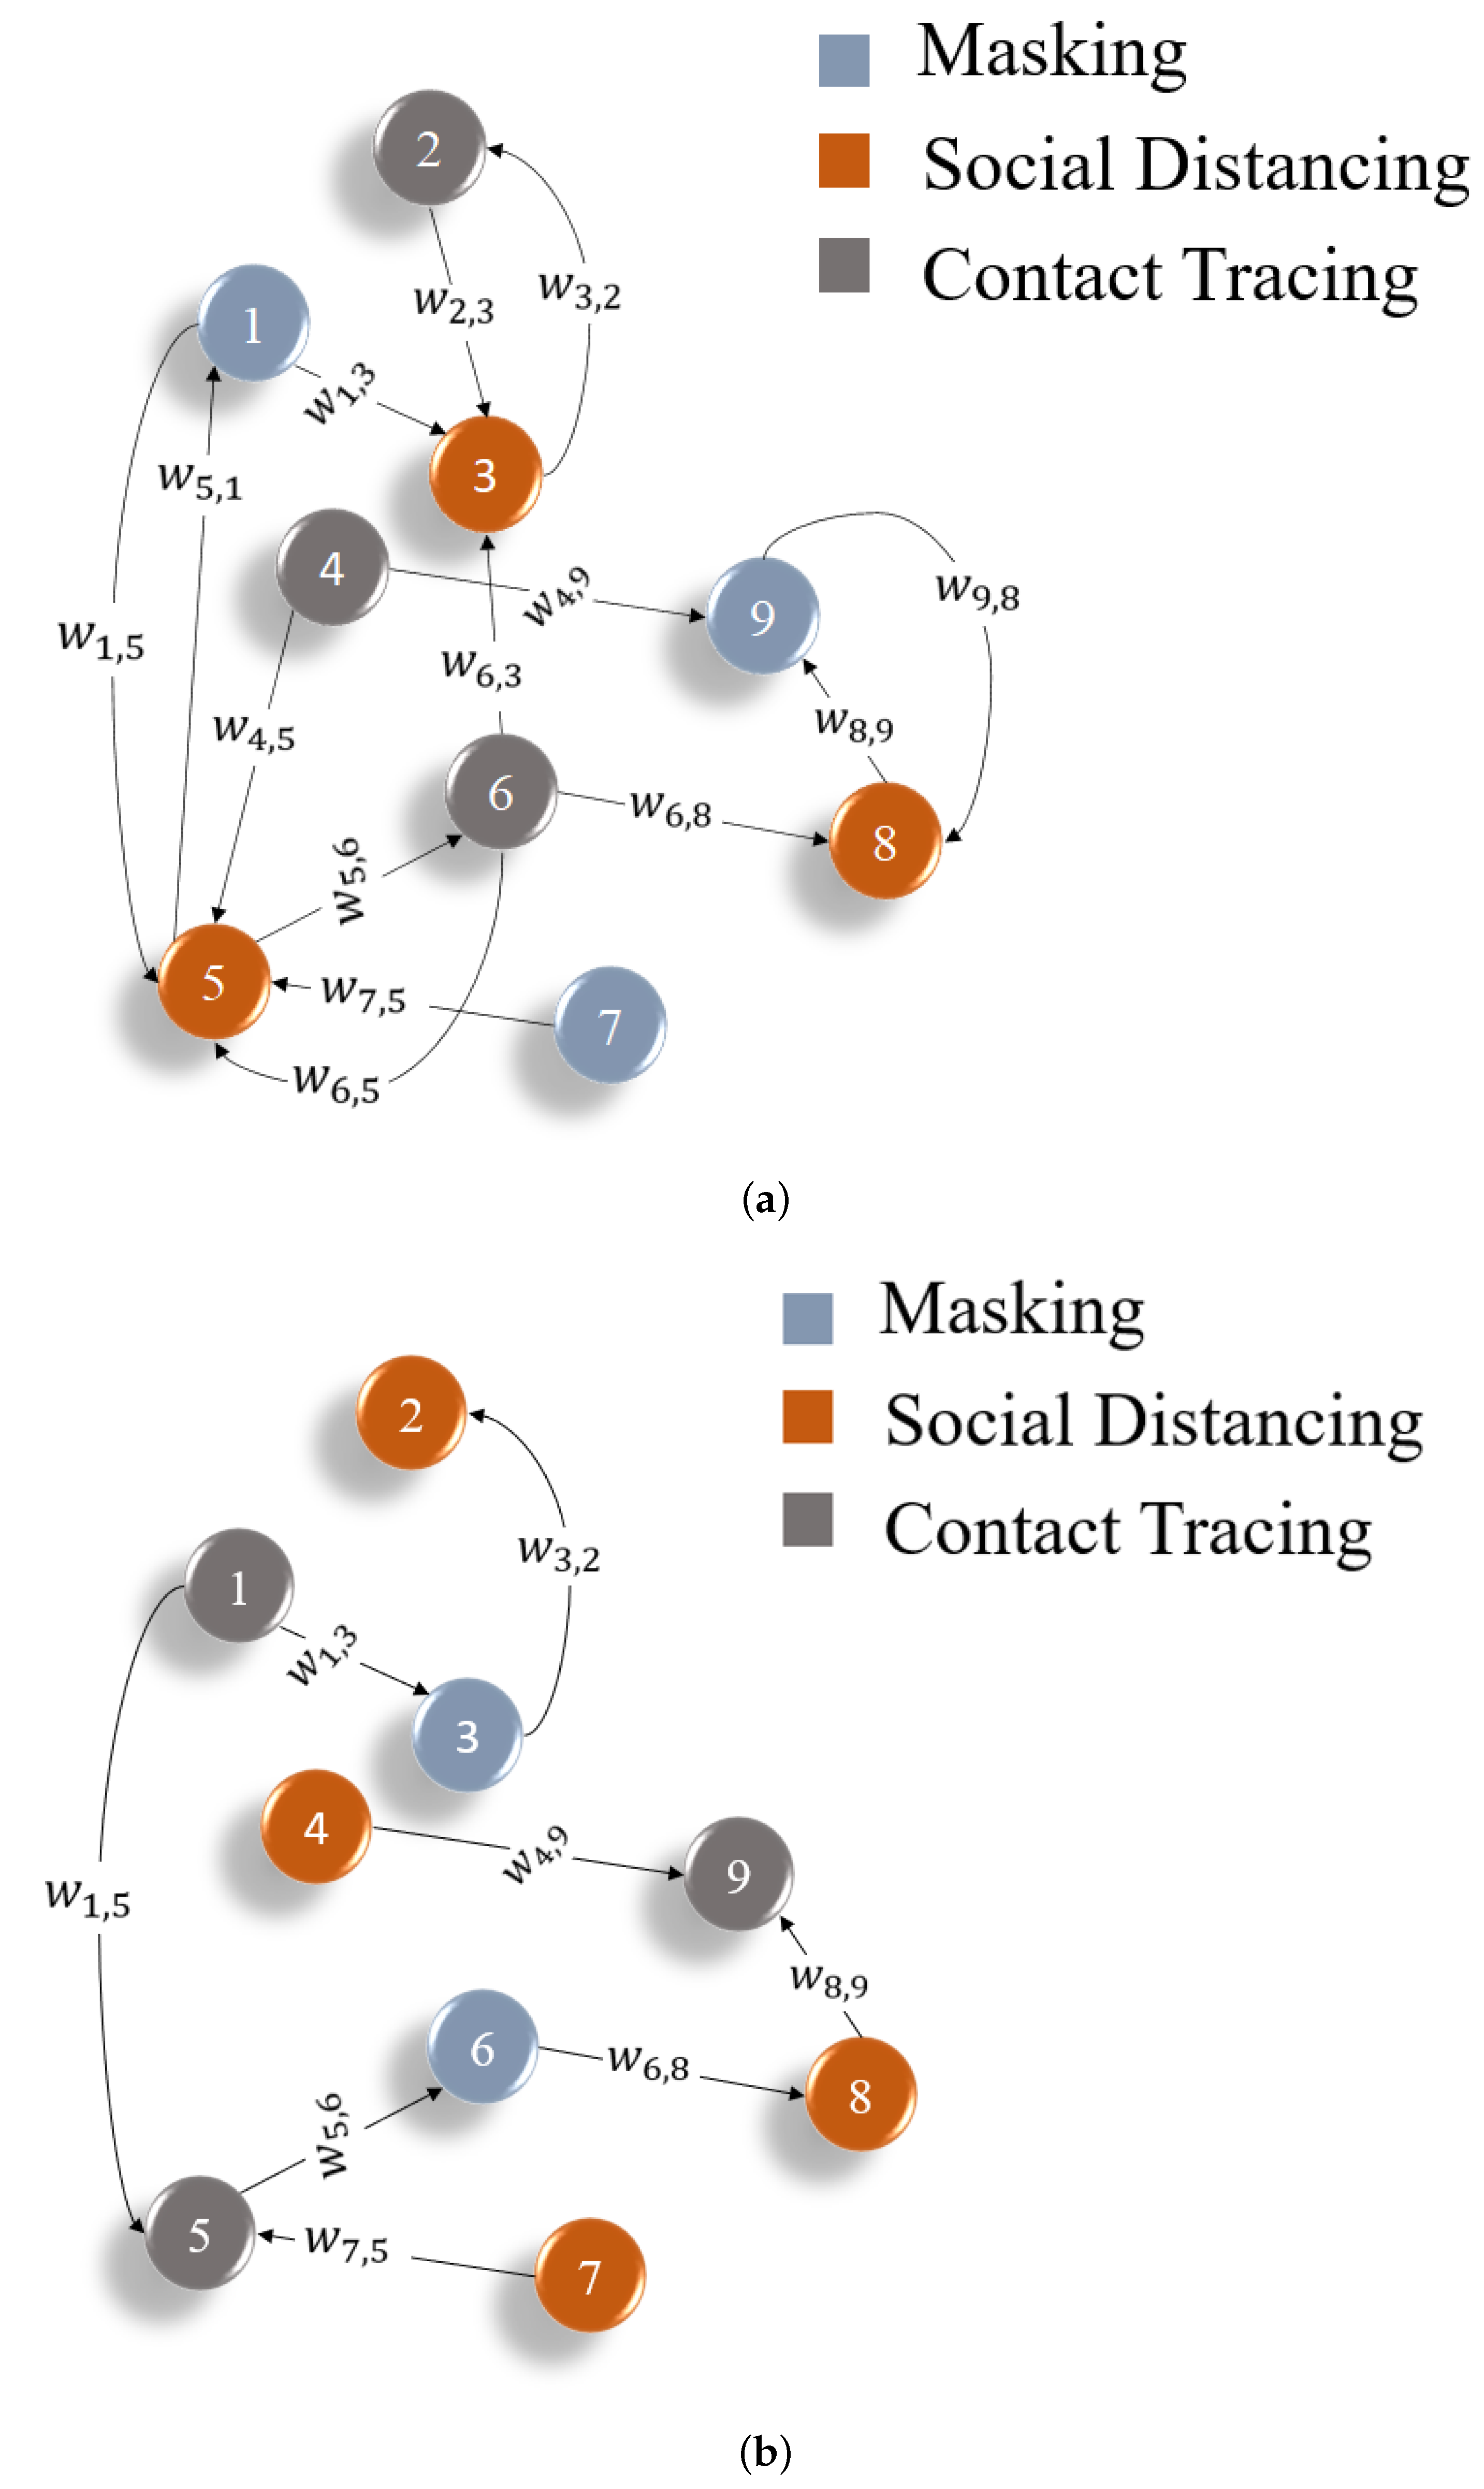
A graph is defined as a function containing nodes and edges G ( N , E ) . Nodes are connected with the help of edges. We can create directed and undirected graphs. Directed graphs are known to represent the flow from one node to another using arrows, whereas, in undirected graphs, there are no arrows rather straight lines connecting nodes N . The relationships between the nodes are based on the weights of the edges E . While replicating the real-world conditions between states, huge amounts of interlinked data are collected, and graph modeling techniques are employed to model it.
In our database, states are represented by the nodes which are populated with different features such as , α , β , γ , δ , λ , the number of infected specific to the state, and the day on which we are observing the disease from the start. The edge weights are represented by the mobility rates incoming and outgoing from each state. We represent our graph database as G x ( N , W ) . In Figure 4a, we can observe an example graph connecting different nodes with respect to weights. We have incoming and outgoing weights from one node to another. The graph is a basic representation of the structure of a graph database. The COVID-19 graph database has connections between all states with incoming and outgoing mobility between states as weights. To theoretically demonstrate the workflow of proposed method, consider the nodes (2, 3) where w 2 , 3 represents the weight from 2 to 3 and w 3 , 2 represents the weight from 3 to 2.
As shown in Figure 1, we build our graph database with inputs from the Game Theory solution and mobility rates. After applying the graph algorithm, we update these factors with new mobility and optimal infected cases. The connection between states which contribute to high infection spread is removed. This iterative process continues until the number of infected is less than 50% from the original value. The Table 5, gives insights to important terminology used to create graph database and graph algorithm.
Algorithm 3 provides information on how to create a graph database. Where N represents the nodes of the graph, similar to the numbers 1 , 2 , 3 , as shown in Figure 4a. In the COVID-19 graph database, the nodes are different states in the US. These nodes are populated with features such as the susceptible rate ∧, disease exposure rate α , transmission rate β , recovery rate γ , mortality rate δ , and factor that represents demographic conditions λ , the optimal strategic output of game theory G C · { s c } , specific to each state. To populate different nodes (states) N is iterated using a for a loop. These features are added for each node (state) N in graph G x ( N , W ) . These features are represented as N · F , where, F is the variable that represents different features.
Algorithm 3: Creating COVID-19 Graph Database.
1:
Input: Susceptible rate ( α ), Infection rate ( β ), Recovery rate ( γ ), Mortality rate δ , Demographic impact factor λ , Budget B
2:
   define  G x ( N , W ) :
3:
     for  N s t a t e s : do
4:
         G x ( N · S u s R a t e )
5:
         G x ( N · E x p o R a t e ) α
6:
         G x ( N · I n f e c R a t e ) β
7:
         G x ( N · R e c o v R a t e ) γ
8:
         G x ( N · M o r R a t e ) δ
9:
         G x ( N · D e m o f a c ) λ
10:
         G x ( N · s t r a t e g y ) G C · { s }
11:
        for  T r a f f i c [ s t a t e s N ] : do
12:
           G x ( W ) = C : ( N ) [ W ] > ( T r a f f i c )
13:
          end for
14:
        end for
15:
     return  G x ( N , W )
16:
Output:  G x ( N , W )
In Algorithm 3, the feature susceptible rate ∧ of each state is added to the corresponding node in the graph and is represented using G x ( N · S u s R a t e ) . The feature disease exposure rate α of each state is added to the corresponding node in the graph and it is represented using G x ( N · E x p o R a t e ) . The feature transmission rate β of each state is added to the corresponding node in the graph and is represented using G x ( N · I n f e c R a t e ) . The feature recovery rate γ of each state is added to the corresponding node in the graph and it is represented using G x ( N · R e c o v R a t e . The feature mortality rate δ of each state is added to the corresponding node in the graph and it is represented using G x ( N · M o r R a t e ) . The feature demographic factor λ of each state is added to the corresponding node in the graph and it is represented using G x ( N · D e m o f a c ) . The feature, optimal strategic output of game theory G C · { s c } of each state is added to the corresponding node in the graph and is represented using G x ( N · s t r a t e g y ) . In a conventional database, these features are like the columns of a table. The states are connected using weights W, all the external states are considered as Traffic, except the state itself, which is represented as N , and they are connected using mobility W. The query G x ( W ) = C : ( N ) [ W ] > ( T r a f f i c ) interprets the creation of connection between states. Where G x ( W ) contains the information of the graph’s weights. C : interprets the creation of connection, ( N ) [ W ] > ( T r a f f i c ) represents the connection between state ( N ) and external states (traffic). The output o Algorithm 3 is a COVID-19 graph database G x ( N , W ) , obtained by iteratively populating nodes of each state and connecting them.
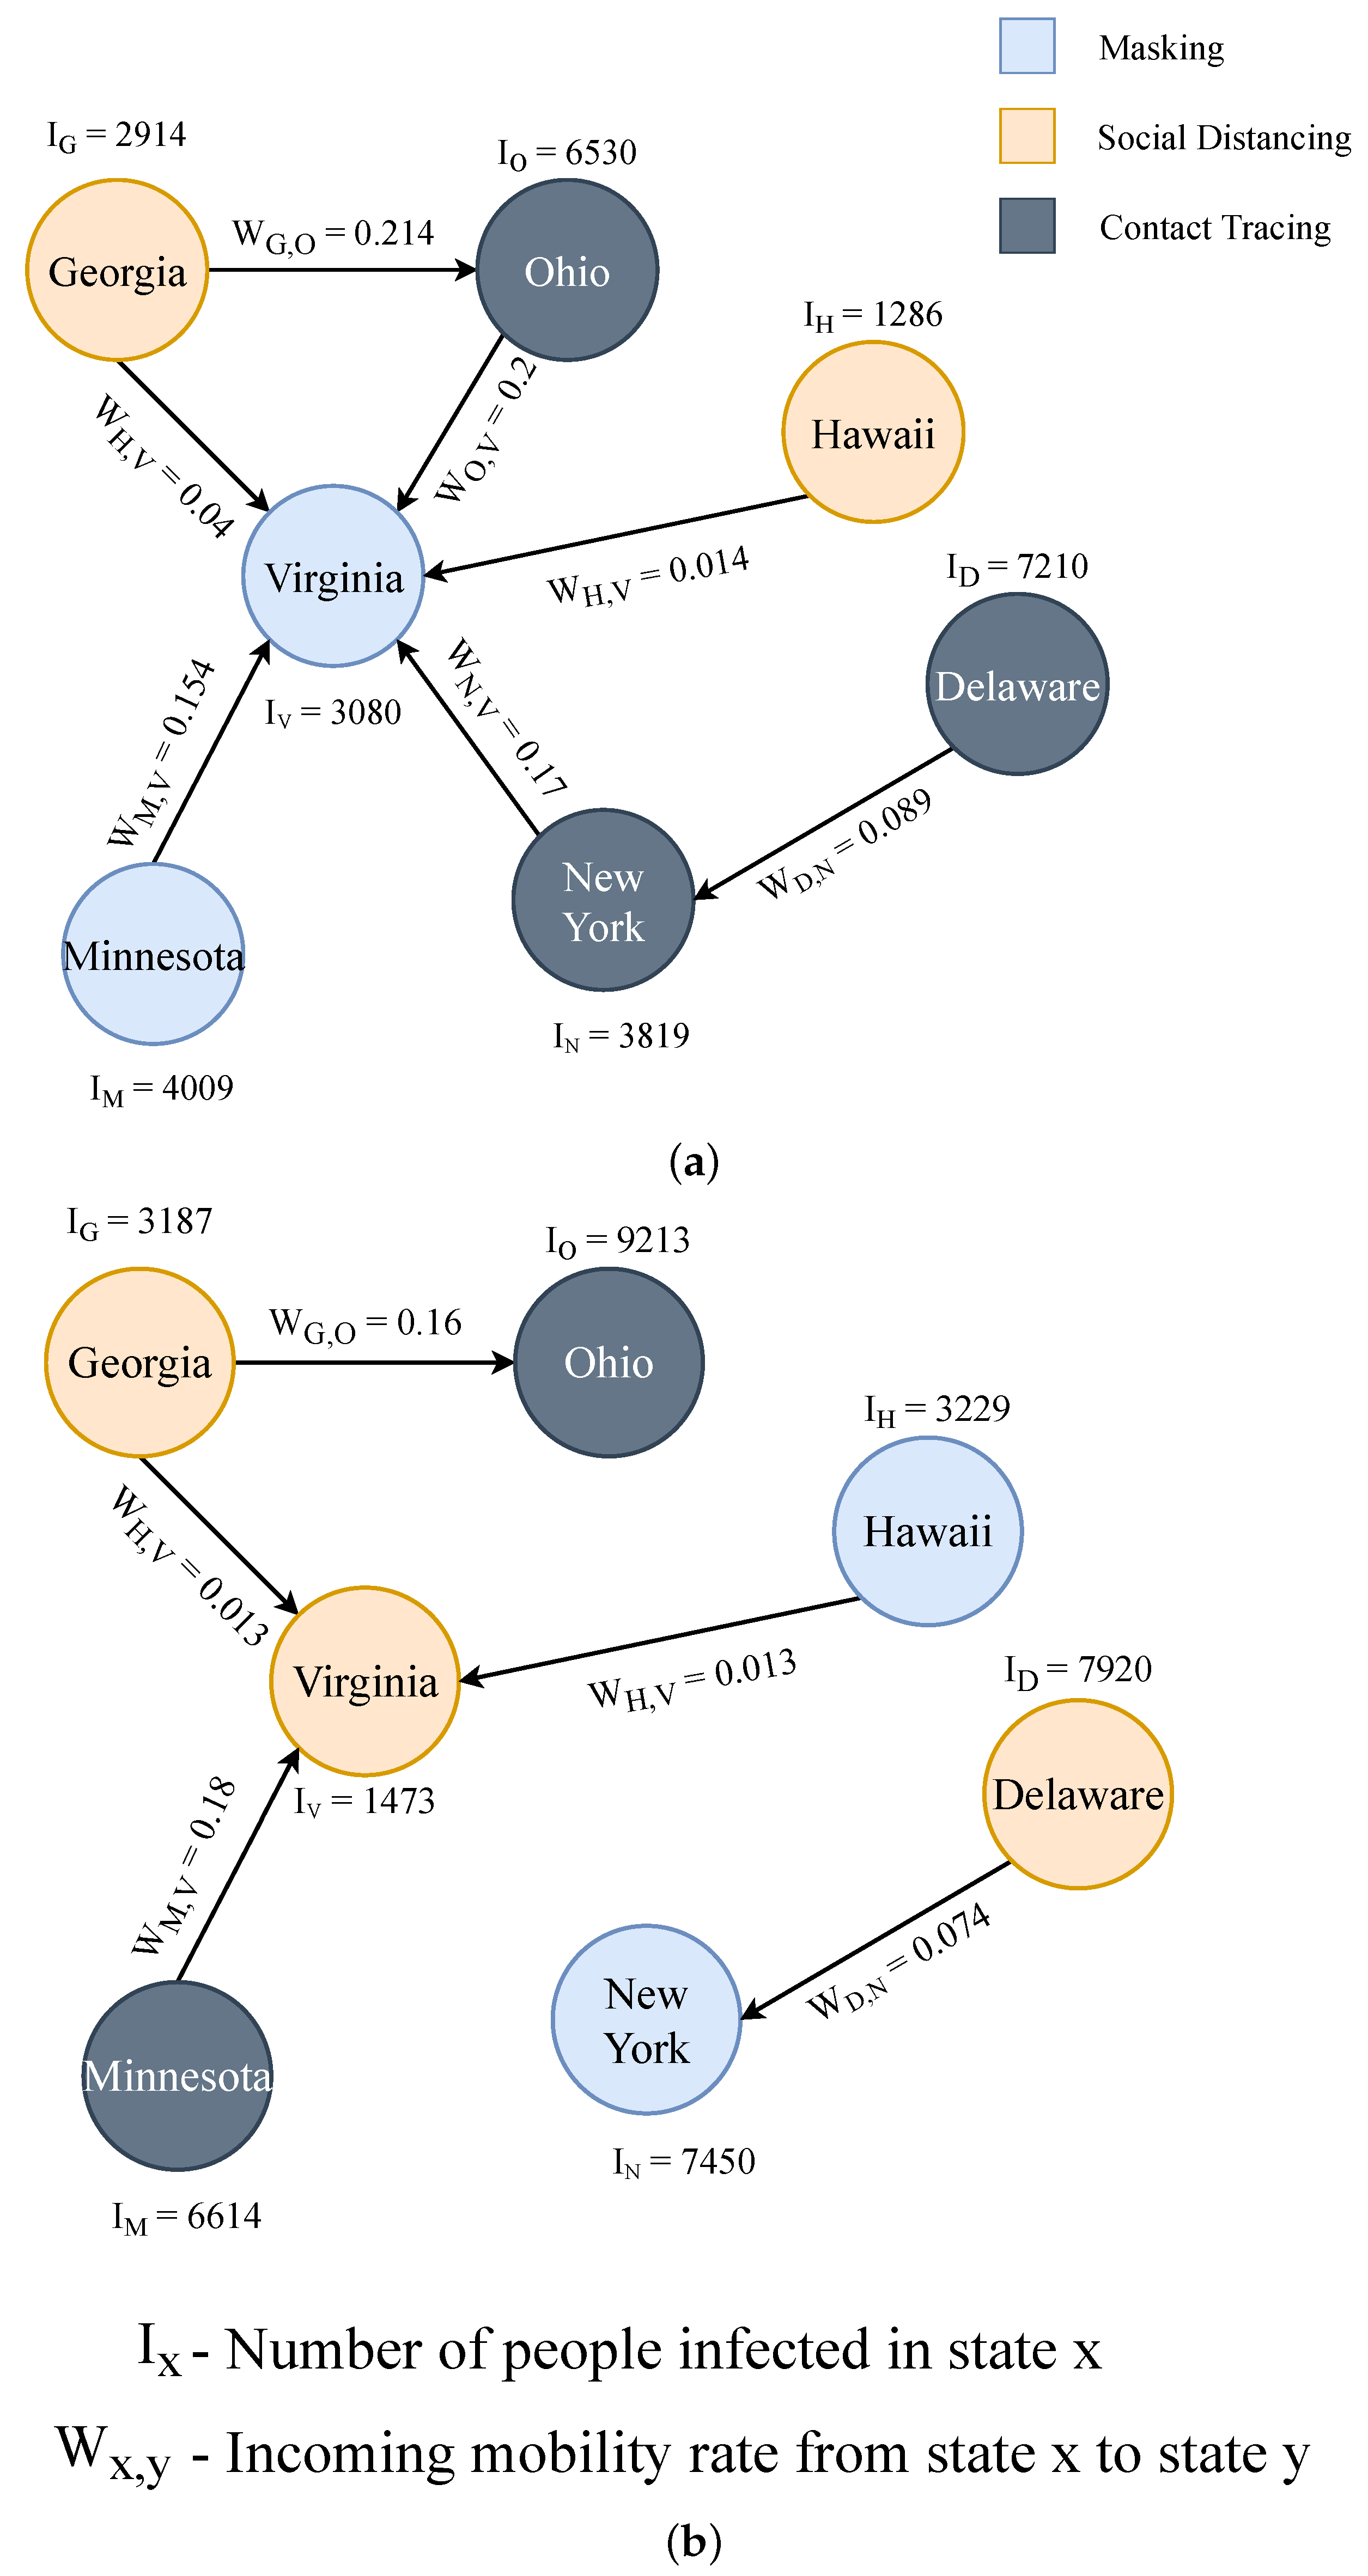
Algorithm 4 describes the functionality of the graph algorithm built to restrict mobility in the COVID-19 graph database. The graph database is built to recreate the real-world conditions between states regarding the demographics and mobility of intra- and inter-states. A graph database is created for each state, and interconnections are made between them using mobility rates. For example, we consider Virginia state for applying the graph algorithm. For simplicity Virginia is represented as V A . The goal of the algorithm is to reduce the total optimal infection rate of Virginia state O I ( V A ) by 50 % . Virginia state’s total optimal infection rate O I ( V A ) represents the total infection rate induced due to external mobility (incoming traffic from other states). The total optimal infection rate O I ( V A ) is defined as the sum of infection rates induced by all other incoming states into Virginia. Individual infection rates induced from other states are represented as O I 1 , O I 2 , O I 3 ,..... O I n .
Algorithm 4: Graph Algorithm for Optimal Solution with Mobility Restrictions.
1:
Input:  I ( V A ) 50 % n 0 , O I x = W x β x
2:
    I ( V A ) = O I 1 + O I 2 + .... + O I n
3:
    W 1 + W 2 + W 3 + .... + W n = 1
4:
    O I y = m a x ( O I 1 , O I 2 , .... , O I n )
5:
    W y 0
6:
    O I ( V A ) ( O I 1 + O I 2 + .... + O I n ) O I y
7:
   for  n v a l u e s
8:
     if  O I ( V A ) < 50 % and n > 0
9:
        break
10:
     else
11:
         α α
12:
         β β
13:
         γ γ
14:
         δ δ
15:
         λ λ
16:
         O I x , O S = G T ( α , β , γ , δ , λ )
17:
         W = W 1 + W 2 + W 3 + .... + W n 1
18:
         G x ( N · I n f e c R a t e ) β x
19:
         G x ( N , W ) G x ( N , W n 1 )
20:
        end if
21:
     end for
22:
Output:
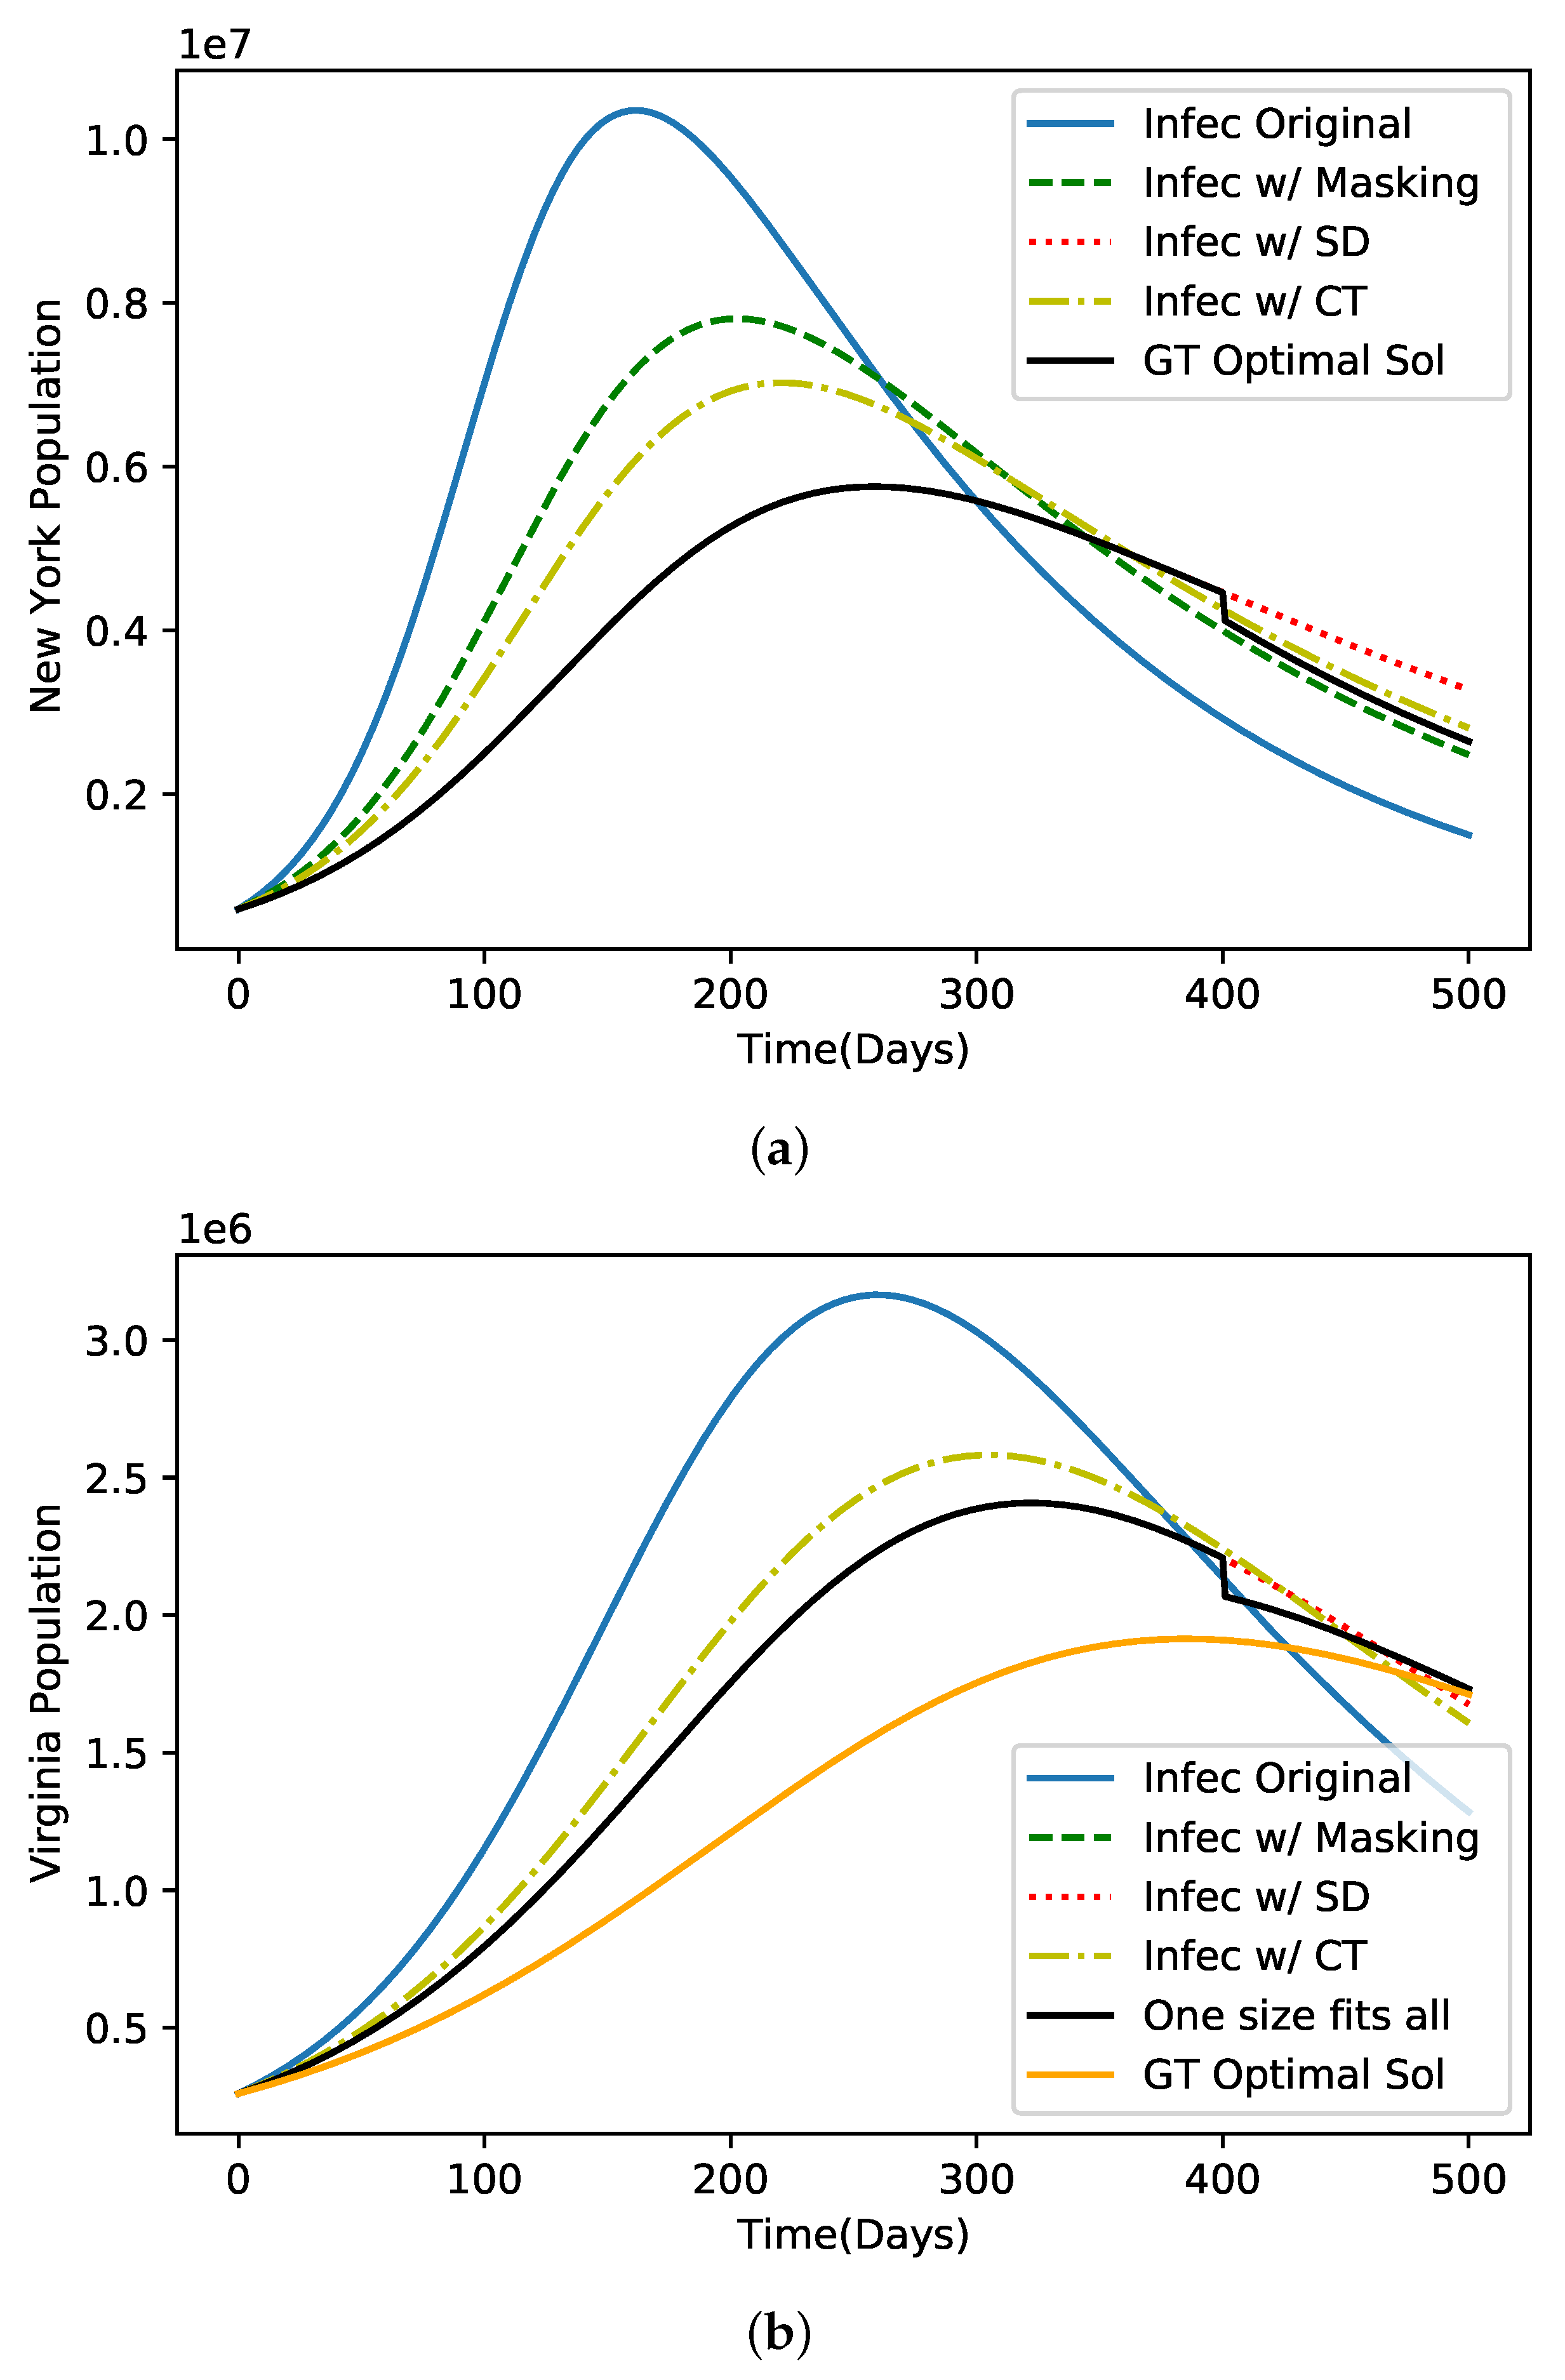
We have n different states incoming to Virginia. Each state comes in with a different mobility rate W x and the infection rate of that state is represented as O I x .The infection induced by each incoming state O I x is defined as the product of mobility rates between Virginia state and the incoming state W x and the infection rate of that incoming state O I x . The impact factor O I x is calculated for all the n states and compared. The link between VA and the state with the highest impact factor is removed by making the mobility factor of that state equal to zero ( W y 0 ). Based on the updated mobility, the graph representing the connection between all states in US G x ( N , W ) is updated by eliminating the link between states. As the graph is updated, the conditions of COVID-19 spread is different, so the infection rate of the state VA is evaluated. If it is lower than 50% of the initial infection rate, it is considered the optimal solution, and the corresponding strategy is considered the optimal strategy. The algorithm is stopped by breaking the loop, but if the infection rate of the state VA is higher than 50% then the algorithm is iterated until it finally becomes less than 50%.
When the infection rate of the state VA is higher than 50%, the graph is updated which reflects in updating the variables , α , β , γ , δ , λ . Which updates the game output and updates the Optimal Strategy for the game. A new graph is made based on the new variables and new Optimal Solutions. The high-impact mobility link is identified and removed for the new graph with updated mobilities and other states’ infection rates. If now the infection rate of VA is less than 50% the process is stopped, or it is again iterated as shown in Algorithm 3 until the desired condition is reached.

4. Experimental Results

4.1. Experimental Setup

The implementation of the COVID-19 game on all 50 states requires a massive amount of memory and time; when performed on the CPU, it took 30 h to perform the game theory and graph algorithm-based combined confinement. Thus, we used Tesla P100-PCIE-16GB GPU available in Google Colab Pro to perform and execute the experiments faster. We used the high-RAM setting of Google Colab to provide the higher memory required by the experiment. The high-RAM setting provides a maximum GPU RAM of 26GB. It took almost two hours to run the experiment for all 50 states’ data [46]. We used the Neo4j browser to create a graph database and apply the graph algorithm.
We have considered the real population information of all 50 US states and the general mobility of the state. The parameter values are chosen from the information of the NY times [45] daily infection rates and the average mobility between states. We believe that even a low contact between states may help in transmitting infection, as we can see in the real world, a variant that originated in one state may take a few days to spread through the whole country. So, it is important to consider the effect of mobility rates between states. Based on this information, we vary different important factors of the attacker and defender strategies. For instance, if a state has high mobility, it can lead to a higher infection rate, and states which are running out of resources to accommodate medical attention for infected patients has low recovery rate and high mortality rate. Based on the urban and sub-urban areas in that state, we consider the effectiveness or rate of the masking or social distancing strategies. We assume that more populated areas make these strategies less effective and increase the attacker strategies’ effectiveness.
We initialize the , α , β , γ , δ , λ factors based on all the above factors (for each state). We vary each factor three times (best case scenario to worst-case scenario), to make our solution reliable in case of mutations of COVID-19. A graph database is built based on the inputs from game theory. A graph algorithm is also built, which eliminates the highest impact incoming mobility link between states. Information from these intermediate graphs (which have some mobility links broken) is sent as input to game theory for an iterative process until the desired optimal solution is achieved.

4.2. Impact of Proposed Graph Algorithm

Here, we present our observation on how a demographic-aware game theory lowers the infection rate over the “One size fits all” approach. Then, we optimize the solution using the proposed graph learning method while considering real-world factors affecting COVID-19 spread between states such as mobility. As New York has a higher transmission rate of virus due to the high mobility rate, we gave this increased transmission rate as input to the game, and as observed in Figure 5a by using the social distancing strategy has the lowest number of people infected than all the other strategies.
From our game-theoretic solution, we can observe that it picks the social distancing strategy as the optimal solution until 400 days of infection and picks the masking strategy after that as the masking strategy has a lower infection rate. Our proposed game-theoretic optimal solution has approximately 40% fewer infected people than the original number at the peak infection stage. When it comes to the Virginia population, we can observe that masking achieves a lower infection rate than the social distancing strategy as shown in Figure 5b. If we were to adopt the “One size fits all” approach, then we would be picking the social distancing approach like New York, but that will lead to a higher infection rate for Virginia’s people. So, based on the demographic information of Virginia, our game theory picks masking as the optimal strategy. Due to this, the number of infected people is approximately 35% lower than the actual infected population when the curve peaks. However, it does not consider the external factors affecting the state’s infection rate such as mobility. So, we apply a graph algorithm to further decrease the infection rate of each state by more than 50%.
The game theory of optimal infection rates and suitable strategy for each state as shown in Figure 5b are given as input to the graph learning model of Figure 6a. We then optimize the game theory solution by considering the impact of other states on COVID-19 spread, similar to the real world, as shown in Figure 6b. Figure 5a,b shows the impact of each strategy on the infection rate for New York’s population and the population of Virginia, respectively. As mentioned before, we consider different factors and observe how S, E, I, R, and D are affected over a time equal to 500 days. For every 100 days, we compare the number of infected cases with each strategy and perform a game theory-based optimization. Moreover, we find the optimal solution with lower infection spread and minimal costs. Depending on the optimal strategy that leads to lower infection spread with minimal costs represnted in Figure 7 a new strategy is chosen for the next 100 days Depending on the optimal strategy that leads to lower infection spread with minimal costs, a new strategy is chosen for the next 100 days. We switched to the strategy with low infection values recorded in the defender’s case and high infection values recorded in the attacker’s case. Finally, we calculate the overall payoff of the attacker and defender to determine the best strategy in the game.
These optimal solutions and strategies are used to make a graph as shown in Figure 6a, where each state has an initial infected number I. Its value is specific to each state. We consider Virginia state, where the infection value is I V = 3080 and our goal is to decrease it by more than half, considering all the real-world factors impacting its growth. Each of these states is connected with mobility rates weights between them, represented by W. The incoming weights from other states are given as suffixes to W. For example, the incoming traffic from Minnesota to Virginia is given as W M , V .
We run the graph algorithm on this graph, and based on the impact of disease spread, we observe that Ohio had the highest effect on Virginia, with its infected number of I O = 6530 and incoming mobility rate W O , V = 0.2 . New York had the next highest impact on Virginia with I N = 3819 and mobility of W N , V = 0.12 . Based on this, we can observe that the link was removed accordingly in the next iteration Figure 6b and the infected number of Virginia is decreased by more than half to I V = 1473 . The information in the newly updated graph is given back to the game theory to obtain a suitable strategy for Virginia, with changing demographics, and we can observe its strategy changing from m a s k i n g in Figure 6a to social distancing in Figure 6b. These steps are followed iteratively until the total infected number is decreased by 50% for each state.
In Table 6, we can observe various cases of COVID-19, still, our model produces a suitable strategy for each of these cases and also the optimal solution specific to each case. Moreover, most of these cases obtain a 50% decrease in the number of infected from the initial value. These results capture the workflow of the graph learning algorithm. So, we prove that our model is efficient in producing solutions even for dynamic cases.

4.3. Advantages of the Study over Existing Works

The proposed technique can produce a superior confinement strategy than the existing works [38,40]. Our technique achieves the lowest infection rate compared to other control techniques [32] with similar policies such as masking, social distancing, and contact tracing. Works such as [37,41], apply a single control policy such as quarantine or social distancing to the whole country. However, unlike other works, the proposed technique chooses a confinement strategy specific to each state. This notably improves the effectiveness of the proposed technique in confining the COVID-19 infection. The proposed technique produces control policies specific to each state helping the state-wise policymakers to choose the most effective policy. It helps government and healthcare workers to analyze the disease spread over time and gives them the chance to prepare for it in advance. The proposed technique works effectively even with the change in conditions such as disease variants.

5. Limitations of the Study

This section will present a critical discussion and possible shortcomings of the proposed method. The key motivation behind our demographic-aware game-theoretic approach for confining the COVID-19 pandemic was to consider the demographic and mobility information for adopting confinement strategies to bend the infection curve. Though our proposed method has shown significant improvement while comparing with other state-of-the-art methods, there are still scopes for improvement. In our current study, we portray the difference between the demography of one state from the other. We considered the United States’ state-level infection data and our model can only provide optimization at the state-level. However, we did not consider that a particular state has different demographic counties and cities, and adopting one strategy state-wide might not work efficiently in other particular counties or cities. We believe that if we could integrate county and/or city-level COVID-19 data into this work it would be more robust.

6. Conclusions

In this work, we propose a demography-aware COVID-19 confinement strategy where a game-theoretic optimization is adopted to achieve an optimal confinement solution for different confinement strategies and a theory-based graph algorithm that restricts the mobility between states to confine the COVID-19 spread. We consider the demographic impact on the given confinement strategy and solve for an optimal strategy while lowering the infection rate. We present the fact that one optimal strategy for one demographic region might not be the optimal solution for different demographics. Our model dynamically produces optimal solutions specific to each state based on demographics and can also work efficiently on variants of COVID-19.

Author Contributions

Conceptualization, S.K. and R.H.; methodology, S.K.; software, S.K.; validation, S.K., R.H. and S.M.P.D.; formal analysis, S.K.; investigation, S.K.; resources, S.M.P.D.; data curation, S.K.; writing—original draft preparation, S.K.; writing—review and editing, S.M.P.D.; visualization, S.K.; supervision, S.M.P.D., H.H.; project administration, S.M.P.D.; funding acquisition, S.M.P.D. All authors have read and agreed to the published version of the manuscript.

Funding

This material is based upon work supported by the National Science Foundation under Grant No. CNS-2029291. Any opinions, findings, and conclusions or recommendations expressed in this material are those of the author(s) and do not necessarily reflect the views of the National Science Foundation.

Institutional Review Board Statement

Not applicable.

Informed Consent Statement

Not applicable.

Data Availability Statement

Not applicable.

Conflicts of Interest

The authors declare no conflict of interest.

References

  1. Barac, A.; Poljak, M.; Ong, D.S. Innovative Approaches in Diagnosis of Emerging Re-emerging Infectious Diseases. Front. Microbiol. 2020, 11, 619498. [Google Scholar] [CrossRef] [PubMed]
  2. Bertozzi, A.L.; Franco, E.; Mohler, G.; Short, M.B.; Sledge, D. The challenges of modeling and forecasting the spread of COVID-19. Proc. Natl. Acad. Sci. USA 2020, 117, 16732–16738. [Google Scholar] [CrossRef] [PubMed]
  3. Weekly Epidemiological Update on COVID-19—9 November 2021. Available online: https://www.who.int/publications/m/item/weekly-epidemiological-updateon-covid-19 (accessed on 23 November 2021).
  4. COVID-19 Disaster Declarations. Available online: https://www.fema.gov/disaster/coronavirus/disaster-declarations (accessed on 23 November 2021).
  5. Why Do Some People Refuse to Wear a Face Mask in Public? Available online: https://www.health.com/condition/infectious-diseases/coronavirus/face-mask-refuse-to-wear-one-but-why (accessed on 5 February 2022).
  6. Dowd, J.B.; Andriano, L.; Brazel, D.M.; Rotondi, V.; Block, P.; Ding, X.; Liu, Y.; Mills, M.C. Demographic science aids in understanding the spread and fatality rates of COVID-19. Proc. Natl. Acad. Sci. USA 2020, 117, 9696–9698. [Google Scholar] [CrossRef] [PubMed] [Green Version]
  7. Xuan, Y.; Balkin, R.; Han, J.; Hu, R.; Ceniceros, H.D. Optimal policies for a pandemic: A stochastic game approach and a deep learning algorithm. In Proceedings of the Mathematical and Scientific Machine Learning, Virtual, 16–19 August 2022; pp. 987–1012. [Google Scholar]
  8. Petrakova, V.; Krivorotko, O. Mean field game for modeling of COVID-19 spread. J. Math. Anal. Appl. 2022, 514, 126271. [Google Scholar] [CrossRef] [PubMed]
  9. Su, Y.; Li, Y.; Liu, Y. Common Demand vs. Limited Supply—How to Serve the Global Fight against COVID-19 through Proper Supply of COVID-19 Vaccines. Int. J. Environ. Res. Public Health 2022, 19, 1339. [Google Scholar] [CrossRef] [PubMed]
  10. Sakarombe, U.; Masona, C.E. Public Health Policy Stance Options in Response to COVID–19: An Evolutionary Game Theory Modelling Approach. 2022. Available online: https://www.researchgate.net/publication/358930645_PUBLIC_HEALTH_POLICY_STANCE_OPTIONS_IN_RESPONSE_TO_COVID_-19_AN_EVOLUTIONARY_GAME_THEORY_MODELLING_APPROACH (accessed on 23 February 2022).
  11. Cai, M.; Karniadakis, G.E.; Li, C. Fractional SEIR Model and Data-Driven Predictions of COVID-19 Dynamics of Omicron Variant. arXiv 2022, arXiv:2205.11379. [Google Scholar]
  12. Kasarapu, S.; Hassan, R.; Rafatirad, S.; Homayoun, H.; Dinakarrao, S.M.P. Demography-aware COVID-19 Confinement with Game Theory. In Proceedings of the 2021 IEEE 3rd International Conference on Artificial Intelligence Circuits and Systems (AICAS), Washington, DC, USA, 6–9 June 2021; pp. 1–4. [Google Scholar]
  13. David, J.; Iyaniwura, S.; Yuan, P.; Tan, Y.; Kong, J.; Zhu, H. Modeling the potential impact of indirect transmission on COVID-19 epidemic. MedRxiv 2021. [Google Scholar] [CrossRef]
  14. Matter, D.; Potgieter, L. Allocating epidemic response teams and vaccine deliveries by drone in generic network structures, according to expected prevented exposures. PLoS ONE 2021, 16, e0248053. [Google Scholar] [CrossRef]
  15. Needham, M.; Hodler, A.E. Graph Algorithms: Practical Examples in Apache Spark and Neo4j; O’Reilly Media: Sebastopol, CA, USA, 2019. [Google Scholar]
  16. Fang, Y.; Nie, Y.; Penny, M. Transmission dynamics of the COVID-19 outbreak and effectiveness of government interventions: A data-driven analysis. J. Med Virol. 2020, 92, 645–659. [Google Scholar] [CrossRef] [Green Version]
  17. Tang, B.; Xia, F.; Tang, S.; Bragazzi, N.L.; Li, Q.; Sun, X.; Liang, J.; Xiao, Y.; Wu, J. The effectiveness of quarantine and isolation determine the trend of the COVID-19 epidemics in the final phase of the current outbreak in China. Int. J. Infect. Dis. 2020, 95, 288–293. [Google Scholar] [CrossRef]
  18. Kermack, W.O.; McKendrick, A.G. A contribution to the mathematical theory of epidemics. Proc. R. Soc. Lond. Ser. A 1927, 115, 700–721. [Google Scholar]
  19. Parker, J. A flexible, large-scale, distributed agent based epidemic model. In Proceedings of the 2007 Winter Simulation Conference, Washington DC, USA, 9–12 December 2007; pp. 1543–1547. [Google Scholar]
  20. Nowzari, C.; Preciado, V.M.; Pappas, G.J. Analysis and control of epidemics: A survey of spreading processes on complex networks. IEEE Control. Syst. Mag. 2016, 36, 26–46. [Google Scholar]
  21. Aron, J.L.; Schwartz, I.B. Seasonality and period-doubling bifurcations in an epidemic model. J. Theor. Biol. 1984, 110, 665–679. [Google Scholar] [CrossRef]
  22. Meiksin, A. Using the SEIR model to constrain the role of contaminated fomites in spreading an epidemic: An application to COVID-19 in the UK. Math. Biosci. Eng. 2022, 19, 3564–3590. [Google Scholar] [CrossRef]
  23. Ferguson, N.M.; Laydon, D.; Nedjati-Gilani, G.; Imai, N.; Ainslie, K.; Baguelin, M.; Bhatia, S.; Boonyasiri, A.; Cucunubá, Z.; Cuomo-Dannenburg, G.; et al. Impact of Non-Pharmaceutical Interventions (NPIs) to Reduce COVID-19 Mortality and Healthcare Demand; Imperial College COVID-19 Response Team: London, UK, 2020; p. 20. [Google Scholar]
  24. Kerr, C.C.; Stuart, R.M.; Mistry, D.; Abeysuriya, R.G.; Rosenfeld, K.; Hart, G.R.; Núñez, R.C.; Cohen, J.A.; Selvaraj, P.; Hagedorn, B.; et al. Covasim: An agent-based model of COVID-19 dynamics and interventions. PLoS Comput. Biol. 2021, 17, e1009149. [Google Scholar] [CrossRef] [PubMed]
  25. Khoshnaw, S.H.; Abdulrahman, K.Y.; Mustafa, A.N. Identifying key critical model parameters in spreading of COVID-19 pandemic. Aims Bioeng. 2022, 9, 163–177. [Google Scholar] [CrossRef]
  26. Abernethy, G.; Glass, D. Optimal COVID-19 lockdown strategies in an age-structured SEIR model of Northern Ireland. J. R. Soc. Interface 2022, 19, 20210896. [Google Scholar] [CrossRef] [PubMed]
  27. Dandekar, R.; Barbastathis, G. Neural Network aided quarantine control model estimation of COVID spread in Wuhan, China. arXiv 2020, arXiv:2003.09403. [Google Scholar]
  28. Prem, K.; Liu, Y.; Russell, T.W.; Kucharski, A.J.; Eggo, R.M.; Davies, N.; Flasche, S.; Clifford, S.; Pearson, C.A.; Munday, J.D.; et al. The effect of control strategies to reduce social mixing on outcomes of the COVID-19 epidemic in Wuhan, China: A modelling study. Lancet Public Health 2020, 5, e261–e270. [Google Scholar] [CrossRef] [Green Version]
  29. Qiu, Z.; Sun, Y.; He, X.; Wei, J.; Zhou, R.; Bai, J.; Du, S. Application of genetic algorithm combined with improved SEIR model in predicting the epidemic trend of COVID-19, China. Sci. Rep. 2022, 12, 8910. [Google Scholar] [CrossRef] [PubMed]
  30. Lyra, W.; do Nascimento, J.D.; Belkhiria, J.; de Almeida, L.; Chrispim, P.P.; de Andrade, I. COVID-19 pandemics modeling with SEIR (+ CAQH), social distancing, and age stratification. The effect of vertical confinement and release in Brazil. medRxiv 2020. [Google Scholar] [CrossRef] [Green Version]
  31. Chowdhury, A.; Kabir, K.A.; Tanimoto, J. How Quarantine and Social Distancing Policy Can Suppress the Outbreak of Novel Coronavirus in Developing or Under Poverty Level Countries: A Mathematical and Statistical Analysis. Available online: https://www.researchsquare.com/article/rs-20294/v2 (accessed on 13 February 2022).
  32. Yousefpour, A.; Jahanshahi, H.; Bekiros, S. Optimal policies for control of the novel coronavirus disease (COVID-19) outbreak. Chaos Solitons Fractals 2020, 136, 109883. [Google Scholar] [CrossRef]
  33. Gaeta, A.; Loia, V.; Orciuoli, F. A Method Based on Graph Theory and Three Way Decisions to Evaluate Critical Regions in Epidemic Diffusion. 2021. Available online: https://www.researchgate.net/publication/348519623_A_method_based_on_Graph_Theory_and_Three_Way_Decisions_to_evaluate_critical_regions_in_epidemic_diffusion_An_analysis_of_COVID-19_in_Italy (accessed on 18 January 2022).
  34. Piccolomiini, E.L.; Zama, F. Monitoring Italian COVID-19 spread by an adaptive SEIRD model. MedRxiv 2020. [Google Scholar] [CrossRef]
  35. Korolev, I. Identification and Estimation of the SEIRD Epidemic Model for COVID-19. J. Econom. 2021, 220, 63–85. [Google Scholar] [CrossRef]
  36. Weitz, J.S.; Dushoff, J. Modeling post-death transmission of Ebola: Challenges for inference and opportunities for control. Sci. Rep. 2015, 5, 1–7. [Google Scholar] [CrossRef]
  37. Kabir, K.M.; Tanimoto, J. Evolutionary game theory modelling to represent the behavioural dynamics of economic shutdowns and shield immunity in the COVID-19 pandemic. R. Soc. Open Sci. 2020, 7, 201095. [Google Scholar] [CrossRef] [PubMed]
  38. Tsay, C.; Lejarza, F.; Stadtherr, M.A.; Baldea, M. Modeling, state estimation, and Optimal Control for the US covid-19 outbreak. Sci. Rep. 2020, 10, 10711. [Google Scholar] [CrossRef] [PubMed]
  39. Munir, M.S.; Kim, D.H.; Bairagi, A.K.; Hong, C.S. When cvar meets with bluetooth pan: A physical distancing system for COVID-19 proactive safety. IEEE Sens. J. 2021, 21, 13858–13869. [Google Scholar] [CrossRef]
  40. Madubueze, C.E.; Dachollom, S.; Onwubuya, I.O. Controlling the spread of covid-19: Optimal Control Analysis. Comput. Math. Methods Med. 2020, 2020, 1–14. [Google Scholar] [CrossRef]
  41. Bairagi, A.; Masud, M.; Kim, D.H.; Munir, M.; Nahid, A.; Abedin, S.; Alam, K.M.; Biswas, S.; Alshamrani, S.; Han, Z.; et al. Controlling the Outbreak of COVID-19: A Noncooperative Game Perspective. IEEE Access 2020, 8, 215570–215581. [Google Scholar] [CrossRef] [PubMed]
  42. Netrapalli, P.; Sanghavi, S. Learning the graph of epidemic cascades. ACM Sigmetrics Perform. Eval. Rev. 2012, 40, 211–222. [Google Scholar] [CrossRef]
  43. U.S. State and Local Government Responses to the COVID-19 Pandemic. Available online: https://ballotpedia.org/Local_government_responses_to_the_coronavirus_(COVID-19)_pandemic (accessed on 6 January 2022).
  44. States that Issued Lockdown and Stay-at-Home Orders in Response to the Coronavirus (COVID-19) Pandemic. 2020. Available online: https://ballotpedia.org/States_that_issued_lockdown_and_stay-at-home_orders_in_response_to_the_coronavirus_(COVID-19)_pandemic (accessed on 6 January 2022).
  45. By Coronavirus in the, U.S.: Latest Map and Case Count. 2020. Available online: https://www.nytimes.com/interactive/2021/us/covid-cases.html (accessed on 6 January 2022).
  46. Coronavirus (Covid-19) Data in the United States. Available online: https://raw.githubusercontent.com/nytimes/covid-19-data/master/us-counties.csv (accessed on 15 February 2022).
Figure 1. Workflow of the proposed graph algorithm-based COVID-19 confinement technique.
Covid 02 00058 g001
Figure 2. Status Diagram of elements in the SEIRV/D Epidemic Modeling Technique.
Covid 02 00058 g002
Figure 3. Workflow of the proposed Demography-aware COVID-19 Game.
Covid 02 00058 g003
Figure 4. Comparing the input and output COVID-19 graphs (a) Input, (b) Output.
Covid 02 00058 g004
Figure 5. Comparing the effect of strategies on infection rate for (a) New York, (b) Virginia.
Covid 02 00058 g005
Figure 6. Comparing the effect of outputs of restricted mobility algorithm for (a) Iteration 1, (b) Iteration 2.
Covid 02 00058 g006
Figure 7. Comparing the cost for each strategies.
Covid 02 00058 g007
Table 1. State-of-the-art techniques to model COVID-19 control strategies.
PaperMethodPoliciesDescription
[17]Neural network-inspired SIR modelQuarantine control strengthIn this work, the authors discuss the effectiveness of quarantine and isolation using the traditional Susceptible-Exposed-Infected-Recovered (SEIR) model. The authors propose a neural network-inspired SIR model that learns how to increase the quarantine control strength, which leads to a lower infection rate.
[30]SEIRLockdown strategiesThis paper, proposes a modified SEIR model that proposes different confinement strategies such as horizontal and vertical lockdown strategies to confine the COVID-19 pandemic and report their impacts on (a) number of hospitalizations, (b) number of ICU beds, and (c) the number of fatalities.
[28]SEIRPhysical distancingAuthors propose an age-structured SEIR model and simulate the model for several physical distancing parameters. Their simulation results show that physical distancing is a practical solution to lower the infection curve.
[37]Compartmental epidemiological models, game theoryLockdown, shield immunityThis paper compares the COVID-19 spread patterns in the case of shield immunity where no measures are taken against COVID-19 and when certain measures are taken against it. They access the effectiveness of policies employed based on the costs they paid to mitigate the infection spread.
[38]Optimization-based framework, compartmental models, optimal control strategySocial distancing, quarantining, strict social distancingIn this paper, the authors introduce an optimization-based decision-making framework to control COVID-19 in the united states. They observe the infection curves in the compartmental model and use dynamic optimization strategies to decrease the curves. They model various cases in which quarantine and social distancing are effective in decreasing the infection curve.
[39]Bluetooth-enabled personal area network (PAN), probabilistic linear model, Levenberg-MarquardtSocial DistanceThis paper proposes a risk-aware physical distancing system that helps individuals to maintain a safe distance from others as a control policy against COVID-19 or other pandemics. They use Bluetooth PAN data to analyze the proposed technique and estimate that the proposed technique dramatically diseases the risk factor of individuals and ensures private safety.
[40]Optimal control analysis, Pontryagin’s maximumQuarantine, isolation, public educationIn this paper, the authors study the effects of various COVID-19 control policies such as quarantine, isolation, and public education as time-dependent using mathematical modeling and optimal control approach. They observe that the time-dependent interventions reduce the number of individuals exposed and infected by the disease.
[41]Game theorySocial distancingIn this paper, the authors introduce a mathematical optimization problem for controlling the COVID-19 outbreak, intending to motivate individuals to consider social distance and isolation policies. Through their extensive analysis, they prove that the game has a Nash Equilibrium and that a lockdown policy is best to control the spread. They also analyze the time to estimate how long a country can sustain the lockdowns.
[12]Game Theory, epidemic modeling, demographic knowledgeMasking, social distancing, contact tracingIn our previous work, we consider a Susceptible-Exposed-Infected-Recovered-Dead (SEIRD) model to predict the COVID-19 epidemic spread and applied a novel non-zero-sum game theory to analyze the impact of the epidemic spread and the economy under different strategies for different demographics. Results depict that this technique reduces the infection rate in all the states of the US on individual demographics.
[33]Graph TheoryDisease spread analysisThe authors observe the COVID-19 spread in Italy using a three-way decision to evaluate critical regions based on Graph Theory. They use a centrality graph algorithm to account for which region is critical for disease spread.
[32]SEIR, genetic algorithm, stochastic search strategyQuarantine, Contact Tracing, Isolation, TreatmentIn this paper, the authors investigate the COVID-19 spread model and the optimal control policies. To design the optimal strategies, in this work authors propose a multi-objective genetic algorithm. Their analysis shows that considering the disease spread as an optimization problem, would be an innovative solution to model effective control strategies.
Table 2. Description of the symbols used.
SymbolsDescription
tTotal time where an infection is active
N ( t ) Total population of a state
S ( t ) Number of people susceptible to a disease
E ( t ) Number of people exposed to a disease
I ( t ) Number of people infected by a disease
R ( t ) Number of people recovered by a disease
V ( t ) Number of people vaccinated against disease
D ( t ) Number of people dead due to the disease
Susceptible rate of the population to the disease
α Exposure rate of the population to the disease
β Transmission rate of the population to the disease
γ Recovery rate of the population to the disease
δ Mortality rate of the population to the disease
θ Vaccination rate of the population to the disease
Table 3. Description of the symbols used.
SymbolsDescription
C R I Cost function of attacker’s reduced incubation
C E Cost function of attacker’s evolution strategy
C R E D Cost function of attacker’s red zones strategy
C M Cost function of defender’s masking strategy
C C T Cost function of defender’s contact tracing strategy
C S D Cost function of defender’s social distancing strategy
A R I Attacker cost to enforce reduced incubation per person
A E Attacker cost to enforce evolution per person
A R Z Attacker cost to enforce red zones per person
D M Defender cost to enforce masking per person
D M M Defender cost to enforce mandatory masking per person
D C T Defender cost to enforce contact tracing per person
D S D Defender cost to enforce social distancing per person
D S S D Defender cost to enforce strict social distancing per person
r M Total rate of enforcement of the masking strategy
r C T Total rate of enforcement of the contact tracing strategy
r S D Total rate of enforcement of the social distancing strategy
P D Total defender payoff
λ Demographic factor
Table 4. Description of the symbols used.
Attackers StrategiesDefender Strategies
Reduced IncubationMasking
MutationsContact Tracing
Red ZonesSocial Distancing
Table 5. Description of the symbols used.
SymbolsDescription
mMasking strategy defined as r m C M
c t Contact tracing strategy defined as r c t C C T
s d Social distancing strategy defined as r s d C S D
G C COVID-19 game, defined using the function G T ( , α , β , γ , δ , λ ) . GT() gives s and i as output to COVID-19 game G C .
s c Game theory control strategy
i c Controlled infection rate produced as an output of COVID-19 game
G x ( N , W ) Graph database with nodes N , created using the states of the US and edge weights W as mobility between the states
I O s Optimal infection rate
O S Optimal strategic solution
Table 6. Graph Algorithm on COVID-19 Variants.
DemographicVariablesInitialOptimalOptimal%
Factor ( λ ) InfectedInfectedStrategyChange
α = 0.82
β = 0.012
0.089 γ = 0.0056 8459835277Social41.70
δ = 0.0049 Distancing
α = 0.82
β = 0.0067
0.064 γ = 0.0032 6149328471Social46.32
δ = 0.0015 Distancing
α = 0.82
β = 0.67
0.015 γ = 0.32 2890513831Masking47.85
δ = 0.15
α = 0.82
β = 0.67
0.008 γ = 0.32 17333983046Masking47.91
δ = 0.15
α = 0.82
β = 0.67
0.00027 γ = 0.32 68933318Contact48.15
δ = 0.15 Tracing
Publisher’s Note: MDPI stays neutral with regard to jurisdictional claims in published maps and institutional affiliations.

