Article

A Data Driven Analysis and Forecast of COVID-19 Dynamics during the Third Wave Using SIRD Model in Bangladesh

1
Department of Mathematics, Bangladesh University of Engineering and Technology, Dhaka 1000, Bangladesh
2
Basic Science Division, World University of Bangladesh, Dhaka 1205, Bangladesh
*
Author to whom correspondence should be addressed.
COVID 2021, 1(2), 503-517; https://doi.org/10.3390/covid1020043
Submission received: 18 September 2021 / Revised: 7 October 2021 / Accepted: 11 October 2021 / Published: 16 October 2021
(This article belongs to the Topic Burden of COVID-19 in Different Countries)

Abstract

:
In this study, we developed a compartmental SIRD model to analyze and forecast the transmission dynamics of the COVID-19 pandemic in Bangladesh during the third wave caused by the Indian delta variant. With the help of the nonlinear system of differential equations, this model can analyze the trends and provide reliable predictions regarding how the epidemic would evolve. The basic reproduction number regarding the pandemic has been determined analytically. The parameters used in this model have been estimated by fitting our model to the reported data for the months of May, June, and July 2021 and the goodness of fit of the parameter’s value has been found by the respective regression coefficients. Further, we conducted a sensitivity analysis of the basic reproduction number and observed that decreasing the transmission rate is the most significant factor in disease prevention. Our proposed model’s appropriateness for the available COVID-19 data in Bangladesh has been demonstrated through numerical simulations. According to the numerical simulation, it is evident that a rise in the transmission rate leads to a significant increase in the infected number of the population. Numerical simulations have also been performed by using our proposed model to forecast the future transmission dynamics for COVID-19 over a longer period of time. Knowledge of these forecasts may help the government in adopting appropriate measures to prepare for unforeseen situations that may arise in Bangladesh as well as to minimize detrimental impacts during the outbreak.

1. Introduction

COVID-19 was first identified in the capital of China’s Hubei province, Wuhan in December 2019 [1,2,3,4]. Bangladesh reported its first confirmed COVID-19 case on 8 March 2020 and continues to report the new cases on a daily basis [5]. In a press conference, the IEDCR confirmed the first three coronavirus cases (IECDR, 2020). Two men and one woman, aged 20 to 35, were confirmed as the first COVID-19 positive cases in Bangladesh. Among them, the two men had returned from Italy, and the woman was a relative of one of the men. On that day in Bangladesh, approximately 111 tests were carried out to diagnose COVID-19 positive cases. On 18 March 2020, the first death of a 70-year-old man as a result of COVID-19 was reported in Bangladesh. To reduce the transmission of the disease, just as in other countries, several measures were implemented in Bangladesh, including a mandatory lockdown, home quarantine, social distancing, and local and international flight restrictions. Bangladesh’s educational institutions including schools, colleges, and universities were shut down on 18 March 2020. Following this, all offices were directed to shut down one week later on 26 March 2020, resulting in a national lockdown., Residents were only permitted to leave their houses in emergency situations. All of these measures were taken to reduce the exponential rise of the transmission rate due to COVID-19 in Bangladesh.
Bangladesh has already experienced two deadly waves of COVID-19 prior to the diagnosis of the Indian delta variant cases. The government has tried its utmost to control the transmission of the disease throughout the 1st and 2nd waves. Both the transmission rate and the deceased rate significantly decreased across the country. On 8 May 2021, the health authorities of Bangladesh first identified the Indian delta variant of COVID-19 [6]. The variant is considered to be responsible for India’s second pandemic wave, which began in February 2021. It eventually caused the third wave in Fiji, the United Kingdom, and South Africa, and the WHO cautioned in July 2021 that a third wave may occur across Europe and Africa [7]. Finally, the third wave of COVID-19 impacted Bangladesh severely, for which the Indian delta variant was responsible. The current wave of COVID-19 has proved to be the deadliest in Bangladesh as the death toll continues to rise and the confirmed cases have eclipsed all prior records. It has been found that the delta variant accounted for 78% of the sampled COVID-19 tests in June 2021 according to recent research conducted by the Institute of Epidemiology, Disease Control and Research (IEDCR), Bangladesh [8]. It has now overrun regions outside of Dhaka, particularly in Khulna’s southern division, which borders the Indian state of West Bengal. Even though Bangladesh attempted to close its borders in late April, the policy was not entirely effective as Bangladesh has porous borders with India. Since mid-May, the number of COVID-19 confirmed cases and fatalities continue to rise exponentially and experts have urged the government to reinforce its existing policies to combat the third wave. Despite the Global vaccine supply shortages and stalled deliveries before the third wave, the government has already begun vaccinations across the country to reduce the infection and the fatality rate of COVID-19.
In this study, we analyzed the transmission dynamics of COVID-19 during this third wave that has been caused by the Indian delta variant, and we also forecast the future trends of COVID-19 through the use of the mathematical model. Mathematical models offer the ability to better comprehend the dynamic transmission of infectious diseases as well as forecast their long-term transmission behaviors [9,10,11,12,13,14]. The probable transmission rate of the disease and the anticipation of the starting and ending time of the epidemic can be determined using mathematical models. Researchers have developed several COVID-19 mathematical models to examine the transmission dynamics in Wuhan, China, and other countries across the world [15,16,17,18,19,20,21,22,23,24,25]. In this study, we proposed a continuous nonlinear compartmental mathematical model containing deterministic ordinary differential equations of susceptible, infected, recovered, and dead (SIRD) individuals to analyze the transmission dynamics of the COVID-19 pandemic and further investigate its future trends in Bangladesh using COVID-19 daily reported data. We undertook the parameter estimation and analyzed the sensitivity of the basic reproduction number relative to the parameters of our proposed model by using the initial values of the variables collected from the daily reported data during the process [26,27,28,29]. This model may also be used for other countries to forecast the number of confirmed cases, the number of recovered cases, and the fatalities caused by COVID-19 with sufficient precision. By comparing existing data with analytical results, the proposed model will be able to forecast the stages of COVID-19.

2. Data Source

In this study, we have used the data repository maintained by Johns Hopkins University [1] to collect data on the number of cases, of those recovered and of the deceased as our primary source. For our analysis and for the forecast on COVID-19, we have used data from 20 May–23 July 2021. We have also used the DGHS [2], The Humanitarian Data Exchange [3], our world in data [4], and IEDCR [5] as secondary sources for data. The total population chosen for this analysis and for the forecast is 164,689,383 [4]. The data collected from the sources for this study are presented in Table 1.

3. Methodology

In order to analyze and predict the behavior and dynamics of infectious diseases, the SIR model is frequently used and is considered to be an effective mathematical tool. The total population is divided into three compartments in this model as follows:
  • Susceptible class S —those who could become infected,
  • Infected class I —those who are infected with the virus at the time,
  • Recovered class R —those who have recovered from the infection.
In this study, we will modify the SIR model, instead using a SIRD model through the inclusion of the compartment of the deceased class D —those who have died due to the infection.

3.1. SIRD Model

We will divide the total population into four mutually exclusive compartments of the susceptible population S , infected population I , recovered population R , and deceased population D for the model.
In accordance with our model, we made the following assumptions throughout the simulations:
(i)
The total population is closed.
(ii)
The susceptible and infected individuals are homogeneous in the population.
(iii)
The natural death or birth rate is not considered in this model. We only take into account the fatalities associated with COVID-19.
(iv)
The recovered population develops permanent immunity.
(v)
All variables and parameters regarding the model are non-negative.
A diagram of the flow through the compartments is shown in Figure 1 below.
We assume that the total population N = 164,689,383   [4] is a fixed number over time and is defined by:
N t = S t + I t + R t + D t = c o n s t a n t
The SIRD model is governed by the following system of differential equations:
d S d t = β N S I  
d I d t = β N S I γ R + γ D I  
d R d t = γ R I  
d D d t = γ D I  
With the initial conditions, S 0 = S 0 = N I 0 R 0 D 0 , I 0 = I 0 , R 0 = R 0 , D 0 = D 0 .
From the above equations, it can be seen that the model depends on the following three parameters: transmission rate β , recovery rate γ R , and deceased rate γ D . The transmission rate β represents the growth rate of the number infected with the disease, the recovery rate γ R represents the growth rate of recovered population and the death rate γ D depicts the growth rate of the deceased population. We may define the removing rate by γ = γ R + γ D which represents the rate of the population removed from the susceptible population. Detailed descriptions of the variables and parameters are shown in Table 2 below.
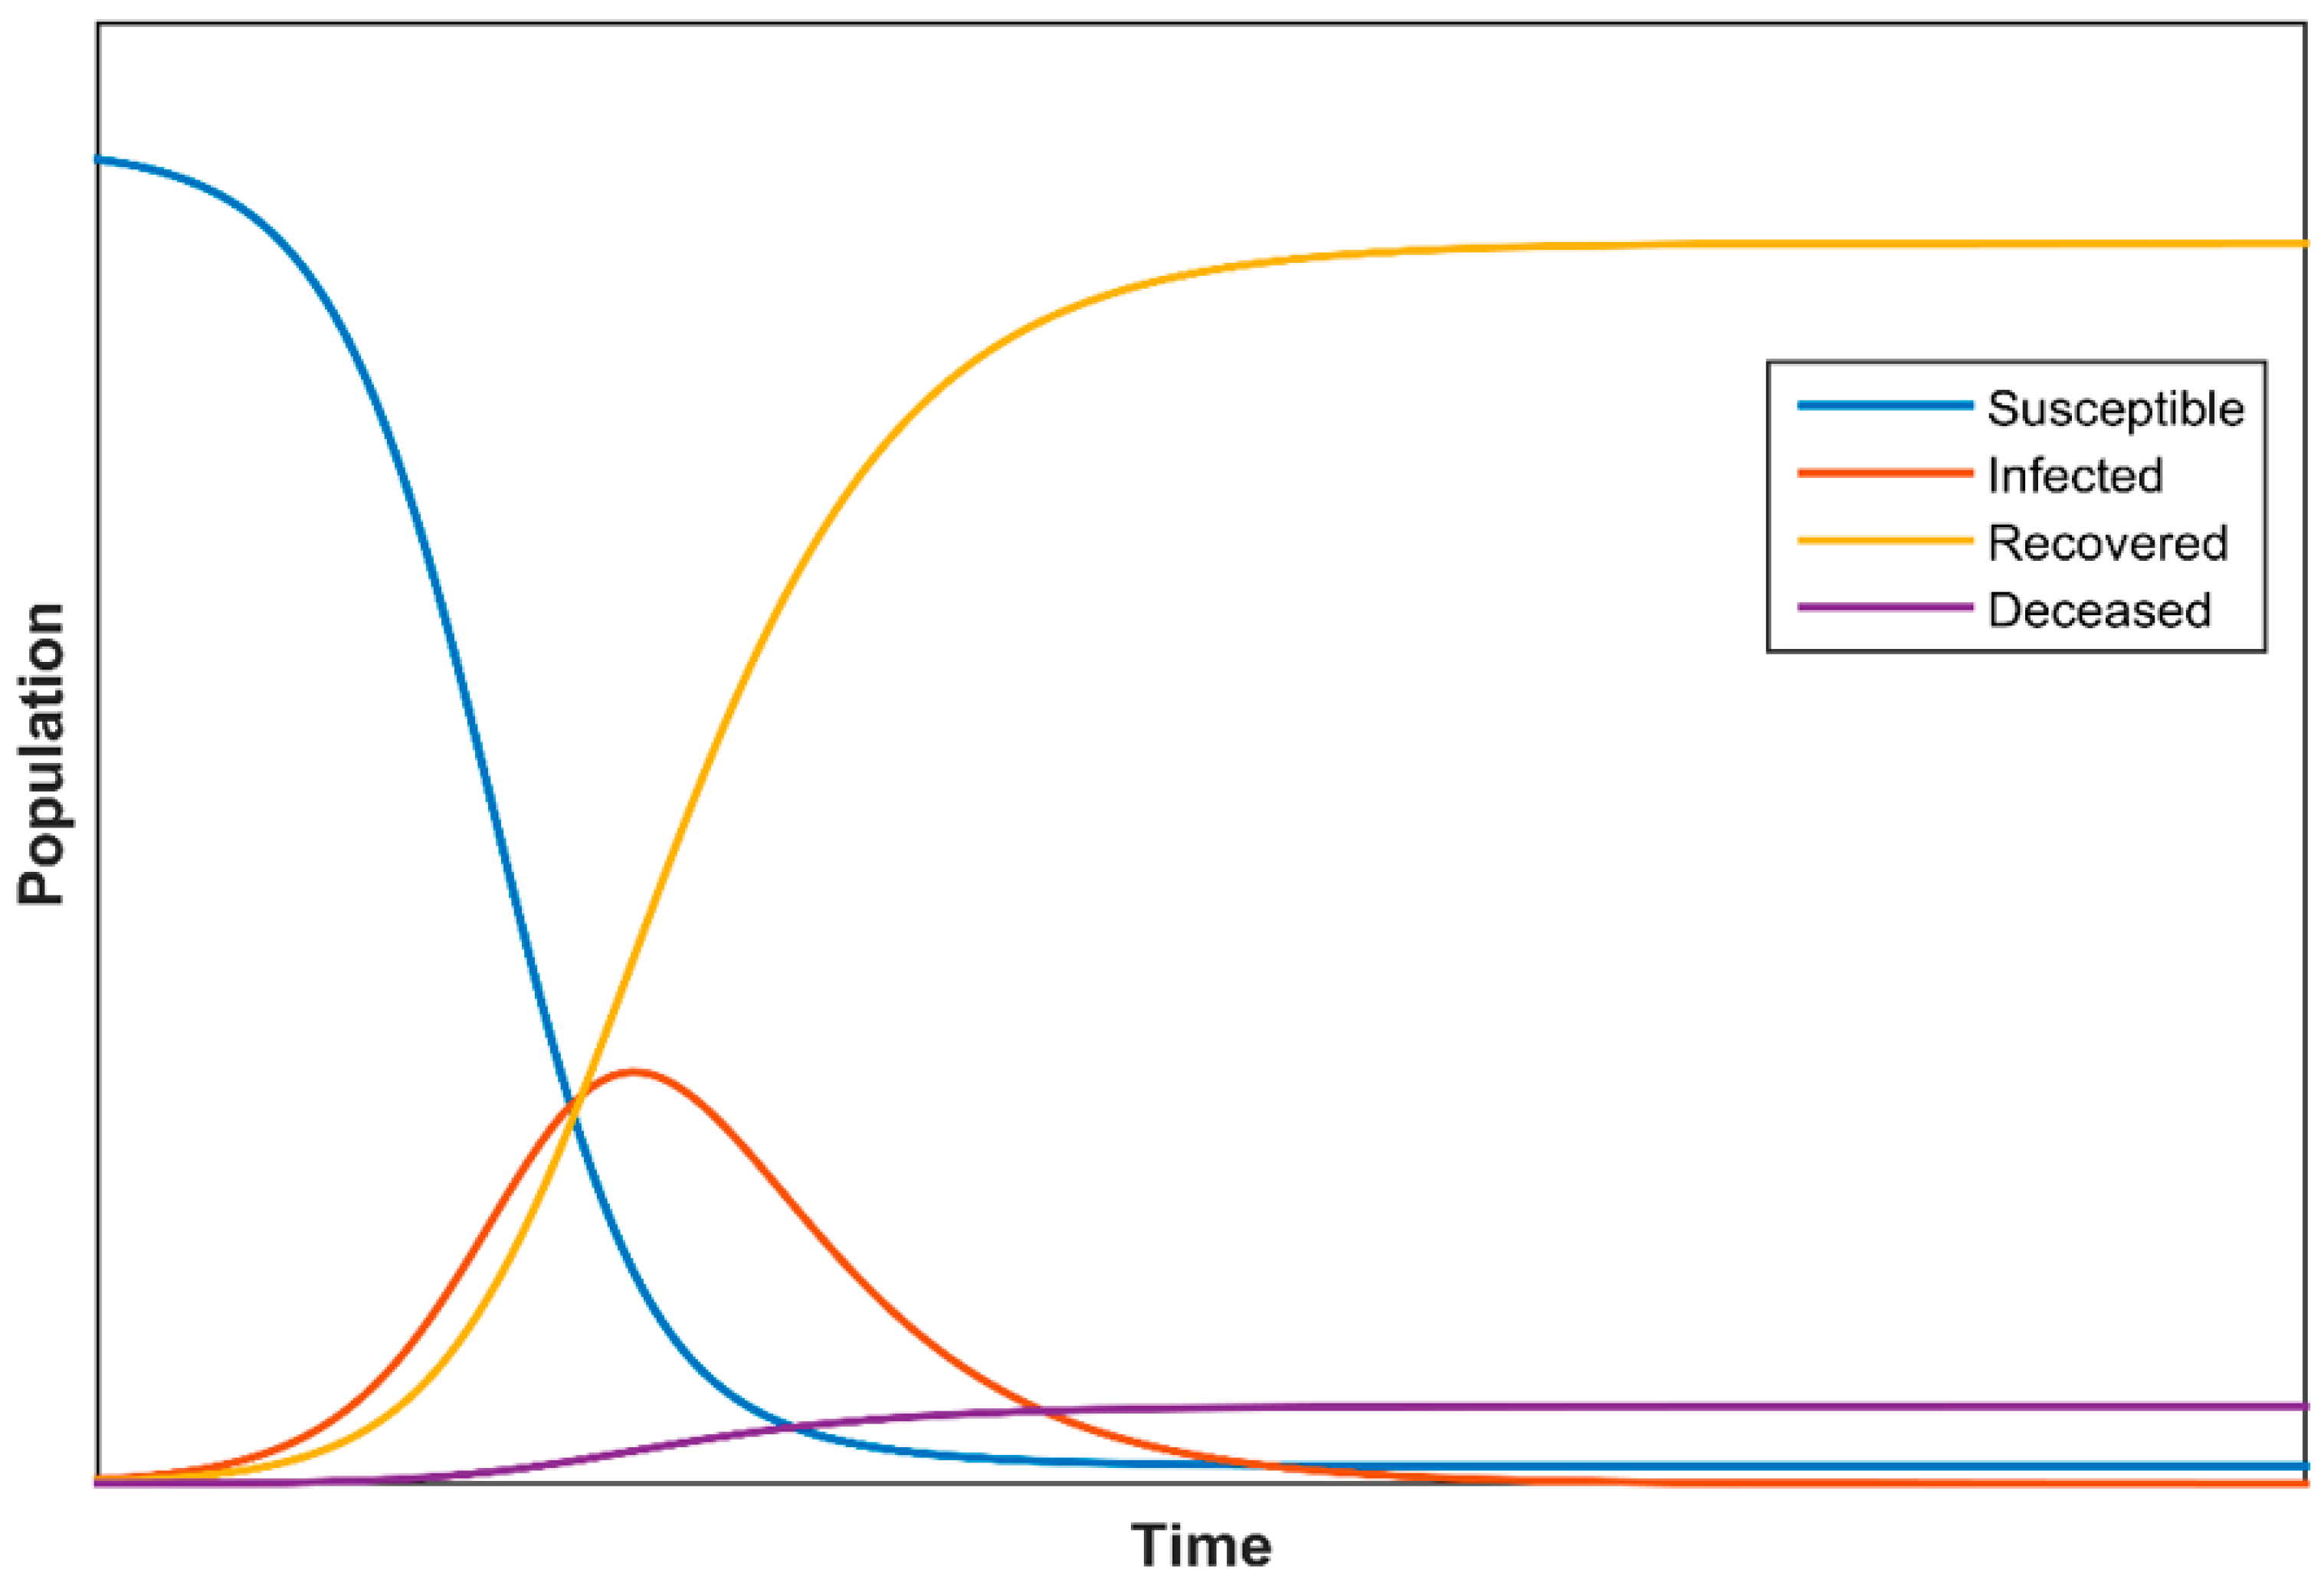
Figure 2 depicts the typical evolution of the variables S , I , R , and D over time where the ranges for this model depend on each particular epidemic.

3.2. Basic Reproduction Number R 0

In epidemiology, the basic reproduction number R 0 is one of the most significant factors that indicates the severity of an outbreak. It is defined as the number of contacts from the infected individuals in the susceptible population before the treatment is complete. R 0 is used to determine whether a disease persists in a particular population or not. If R 0 < 1 , each infected person infects less than one person on average, and hence the disease will not be able to spread in a population extensively. If R 0 > 1 , on the other hand, the infection will be able to spread rapidly throughout a population. A greater value of R 0 indicates that it is harder to control the spread of the infection in a population. The SIRD model can be used to calculate the basic reproduction number by dividing Equation 2 by the entire population N .
d I d t 1 N = β S I N 1 N γ R + γ D I N d i d t = β N S i γ R + γ D i
where i = I N denotes the normalized number of infected individuals. An epidemic develops when the number of infected people grows, d i d t > 0 , implying that the basic reproduction number R 0 must be larger than unity:
R 0 = β γ R + γ D S N > 1  
Almost everyone in the population is susceptible at the start of an epidemic, thus we have S 0 N ~ 1 and hence
R 0 = β γ R + γ D S N = β γ R + γ D S 0 N = β γ R + γ D = β γ
where γ = γ R + γ D is defined as the removing rate. If the transmission rate β is higher than the removing rate γ , then R 0 > 1 and the outbreak will be an epidemic. On the other hand, if β is small compared to γ then R 0 < 1 and the outbreak will eventually be eradicated.

3.3. Regression Coefficient R 2

The regression coefficient R 2 is a useful tool in compartmental models for predicting future behavior. It is a statistical measure generally used to compare projected values (y) obtained from the SIRD model to real data (x). For each of the four compartments, i.e., susceptible, infected, recovered, and deceased the regression coefficient R 2 is calculated separately in the following way to determine the accuracy of the model’s fit to the actual data.
R 2 = 1 x y 2 ( x x ¯ ) 2  
Here x ¯ is defined as the mean of the four compartments regarding the actual data. The value of the regression coefficient R 2 close to unity indicates the better fitness of the functions and the accuracy of the prediction.

3.4. Estimation of Parameters

In general, differential equations are solved by approximating them into separate equations which are solved algebraically to mitigate complexity. Due to stochastic variations in data, this approach may yield substantial uncertainties in some cases. To avoid this phenomenon, we require a more authentic approach to solve the system of differential equations and for fitting the model to the actual data by adopting an effective method. In this study, we solved the set of differential Equations (1)–(4) numerically and fitted the model to the real data of susceptible, infected, recovered, and deceased cases simultaneously, using a nonlinear least squares method. As a specific instance of maximum likelihood, least squares assume that the data are chosen from a normal distribution with the mean determined by the solution to the ODE. The set of differential Equations (1)–(4) is expressed in a typical dynamic model as follows:
y = f t ,   y ,   Φ ,   y t 0 = y 0  
where Φ represents the parameters to be determined. We define a least squares objective function as follows for measuring the fit to real data:
ξ Φ = i = 1 y i y ¯ i 2
where y i is the fitted data obtained from the solution of 5 and y ¯ i represents the real data. We have used numerical solver ode45 in MATLAB to solve the differential equations and applied MATLAB algorithm lsqcurvefit to obtain the optimum value of coefficients in the SIRD model, which fits the data to our real data. Regression coefficients R 2 are used to assess the accuracy of the fitted data obtained from our model. Through the use of the above approach, the values of the estimated parameters and the regression coefficients are provided in Table 3.

4. Results and Discussion

In this section, the numerical findings of the system of Equations (1)–(4) are discussed. By fitting our mathematical model to the real data collected from 20 May–23 July 2021 in Bangladesh as presented in Table 1, we were able to estimate the parameter values of the system of Equations (1)–(4) as well as to conduct numerical simulations to determine which parameters are the most and least sensitive at the estimated parameter values. Finally, we carried out numerical simulations for forecasting the behavior of COVID-19 dynamics for the following 235 days using the values of the estimated parameters.

4.1. Interpretation of the Public Data

To analyze the public data presented in Table 1, we used our previously described SIRD model in Section 3. The optimal values for the model parameters that best describe the observed data have been determined through extensive simulations which are presented in Table 3.
The following values from Table 1 are used as the initial values for simulation purposes:
S 0 = S 0 = N ( I 0 + R 0 + D 0 ) = 164,686,515 I 0 = I 0 = 1457 R 0 = R 0 = 1378 D 0 = D 0 = 36
where N is defined as the total population of Bangladesh given by N = 164,689,383 [4].
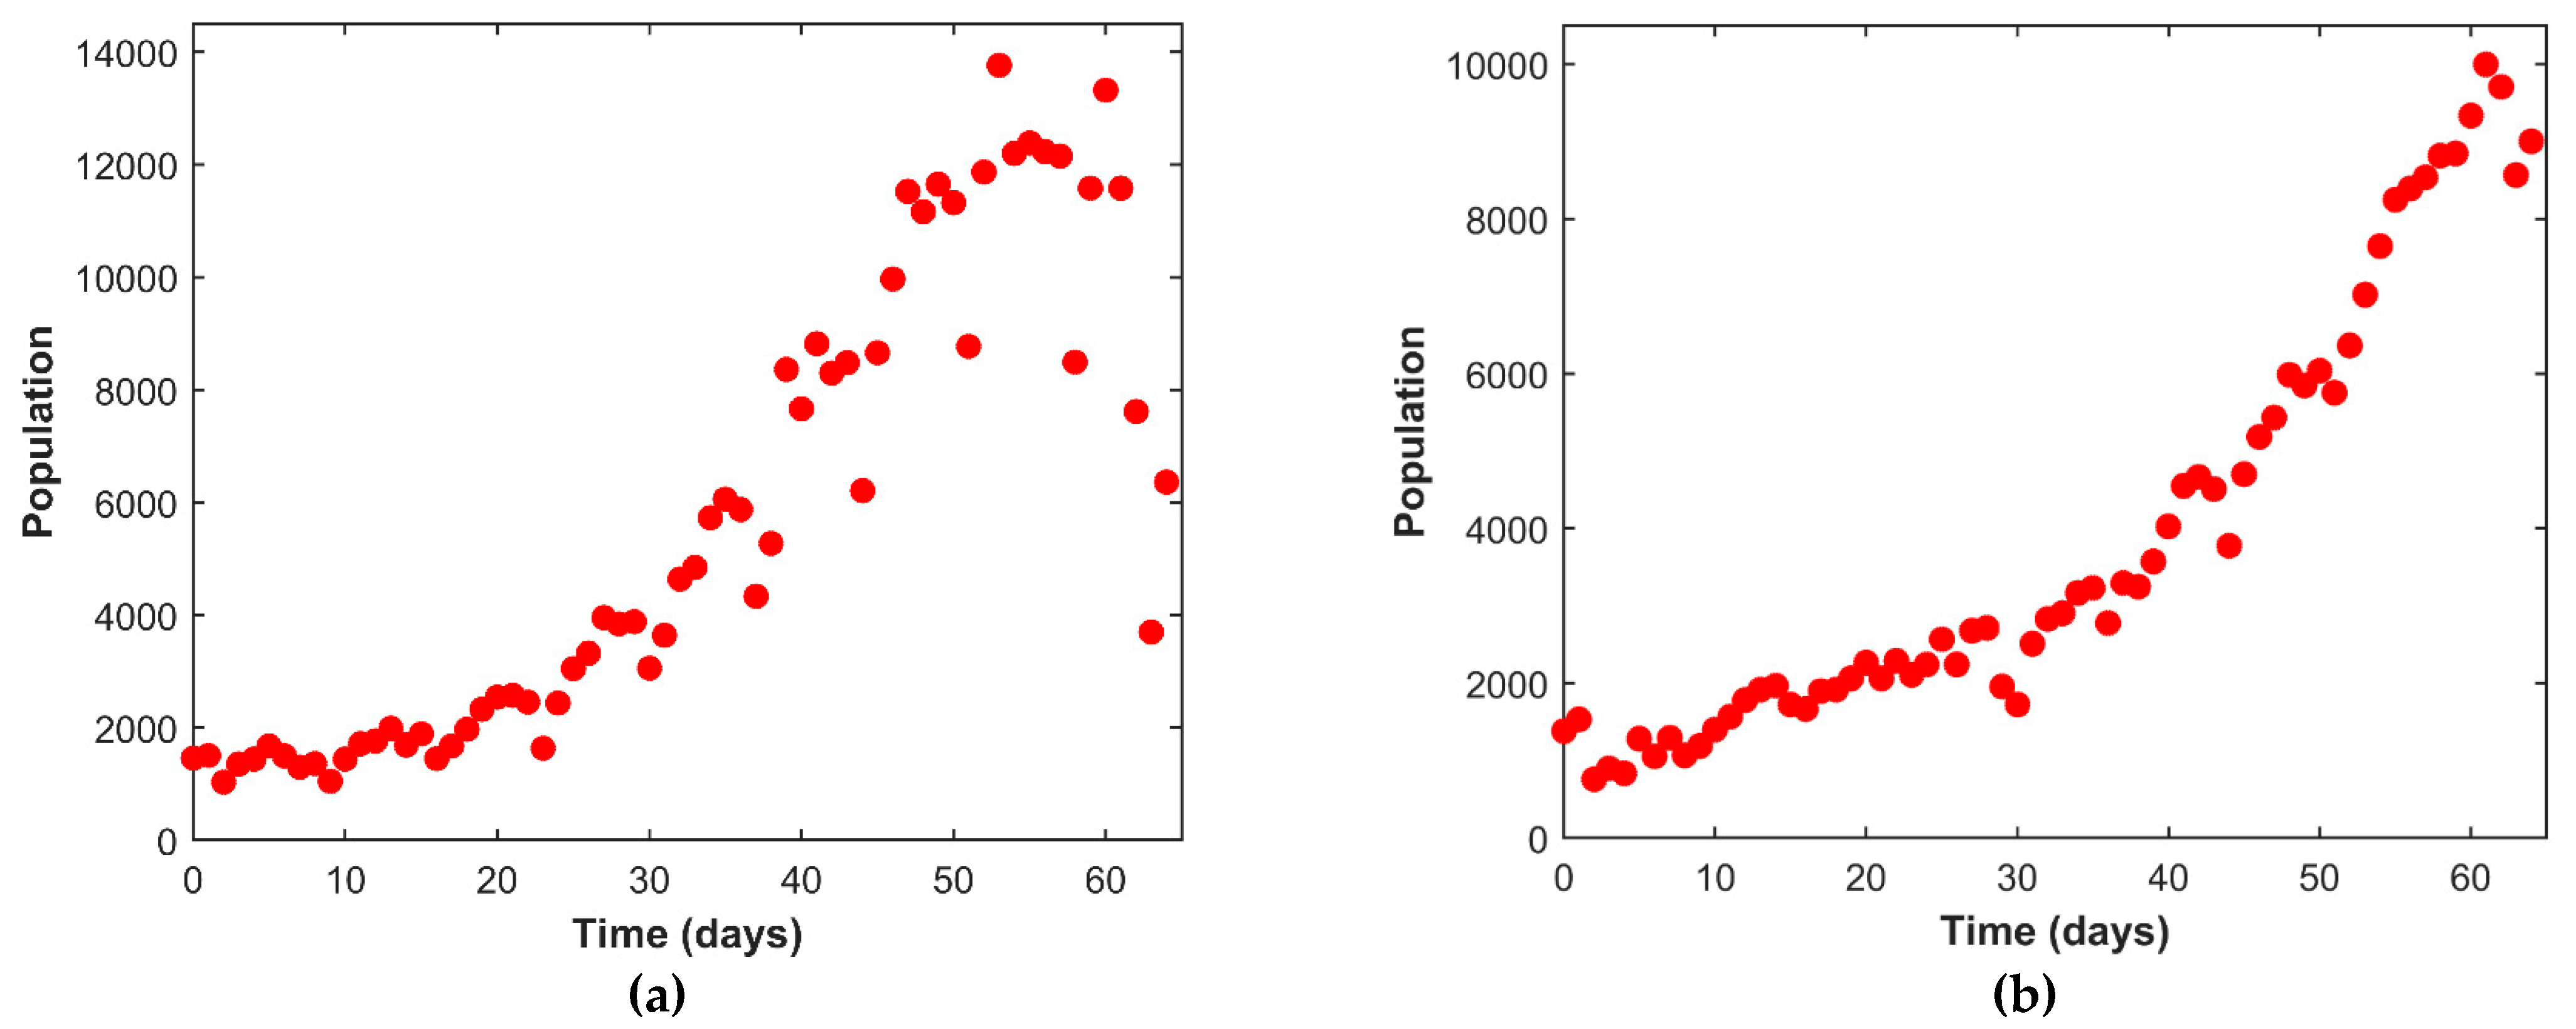
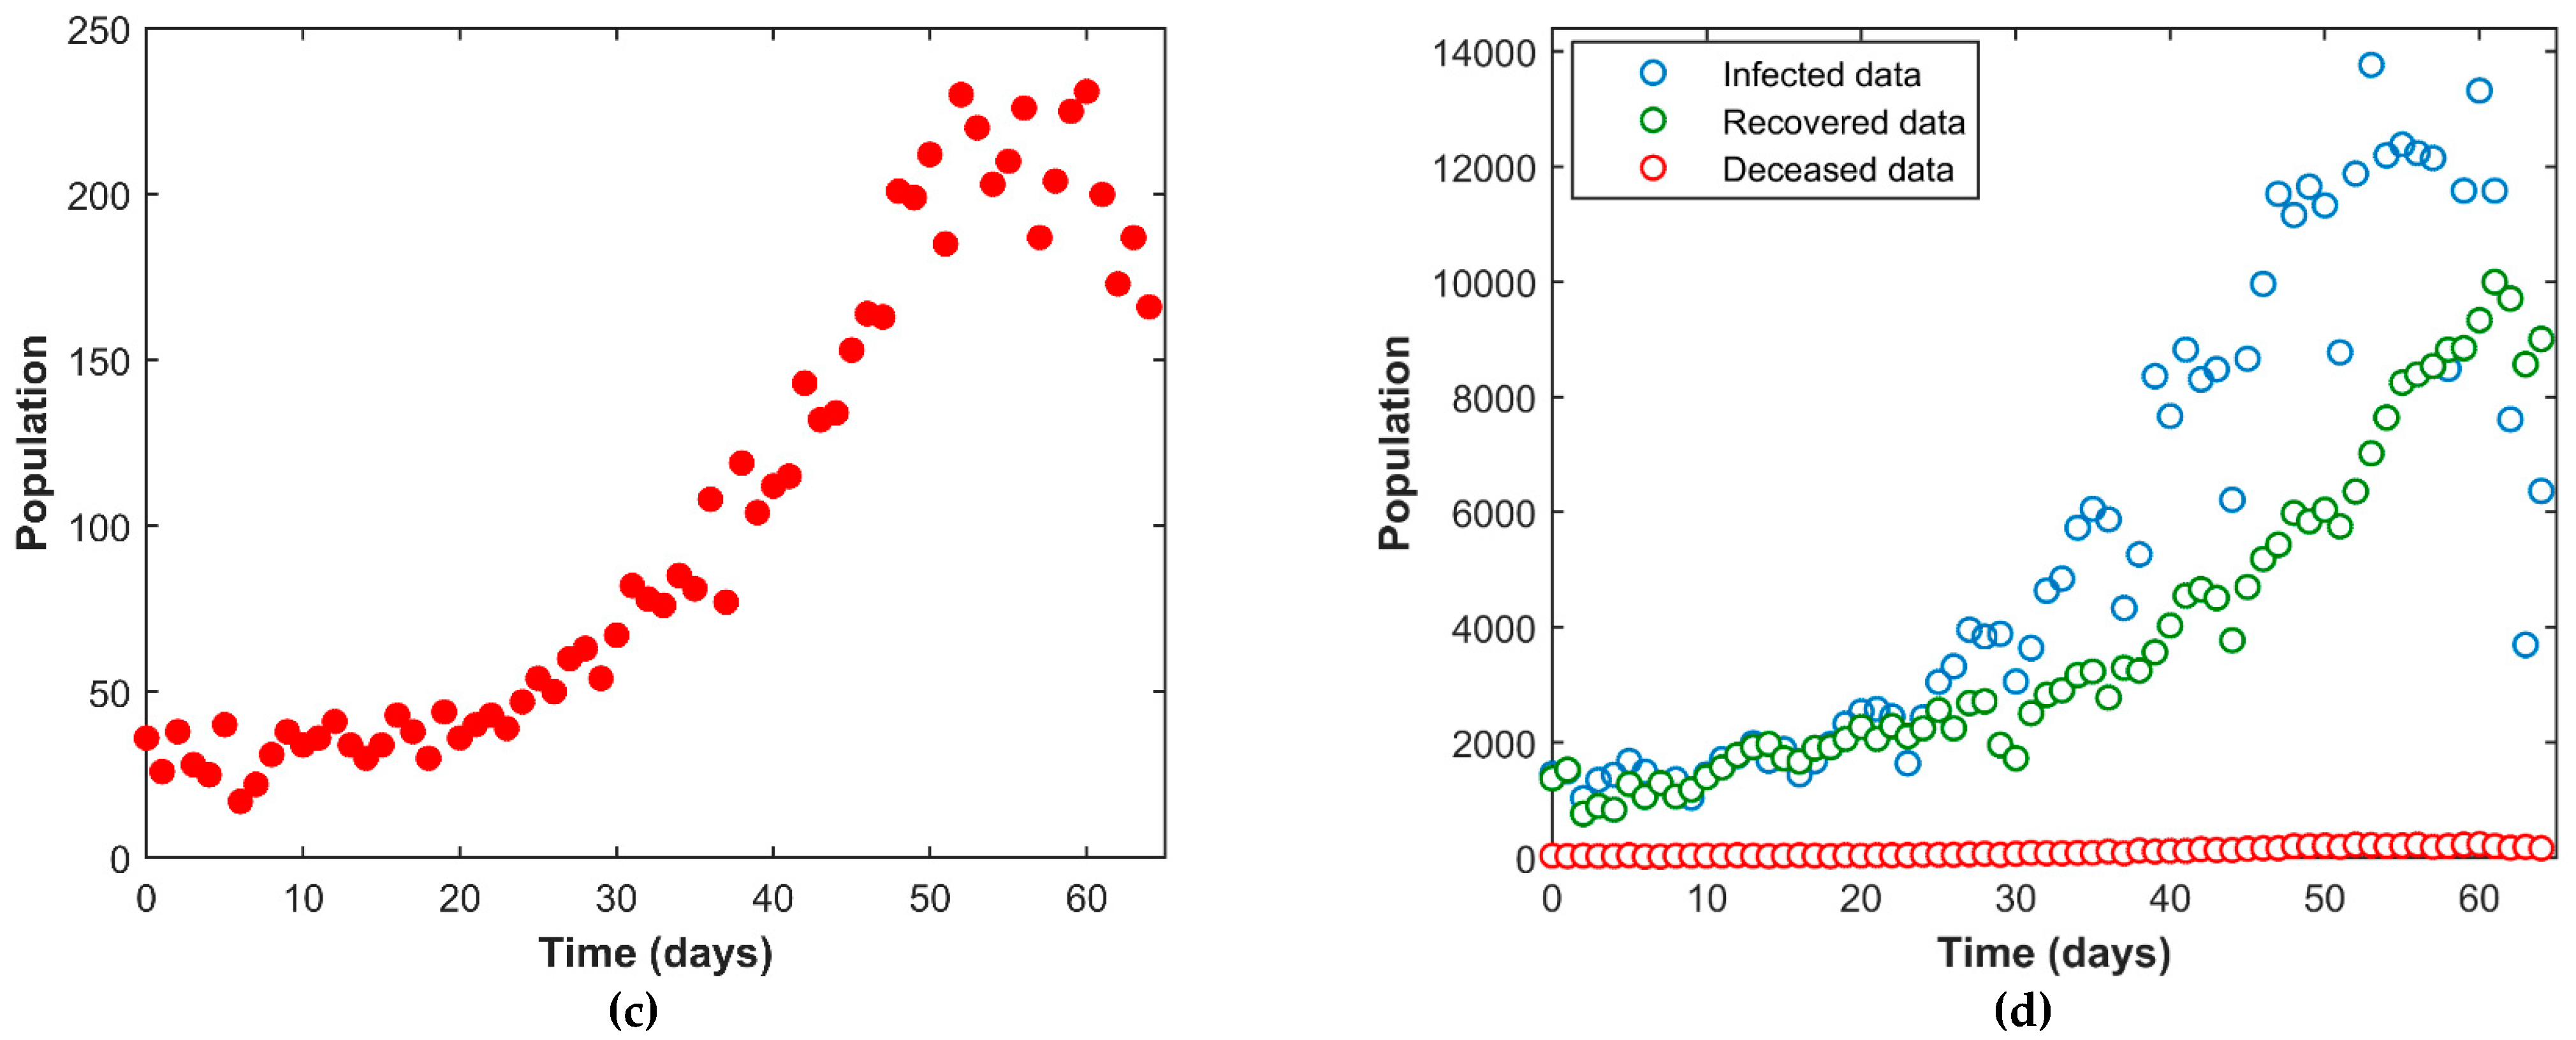
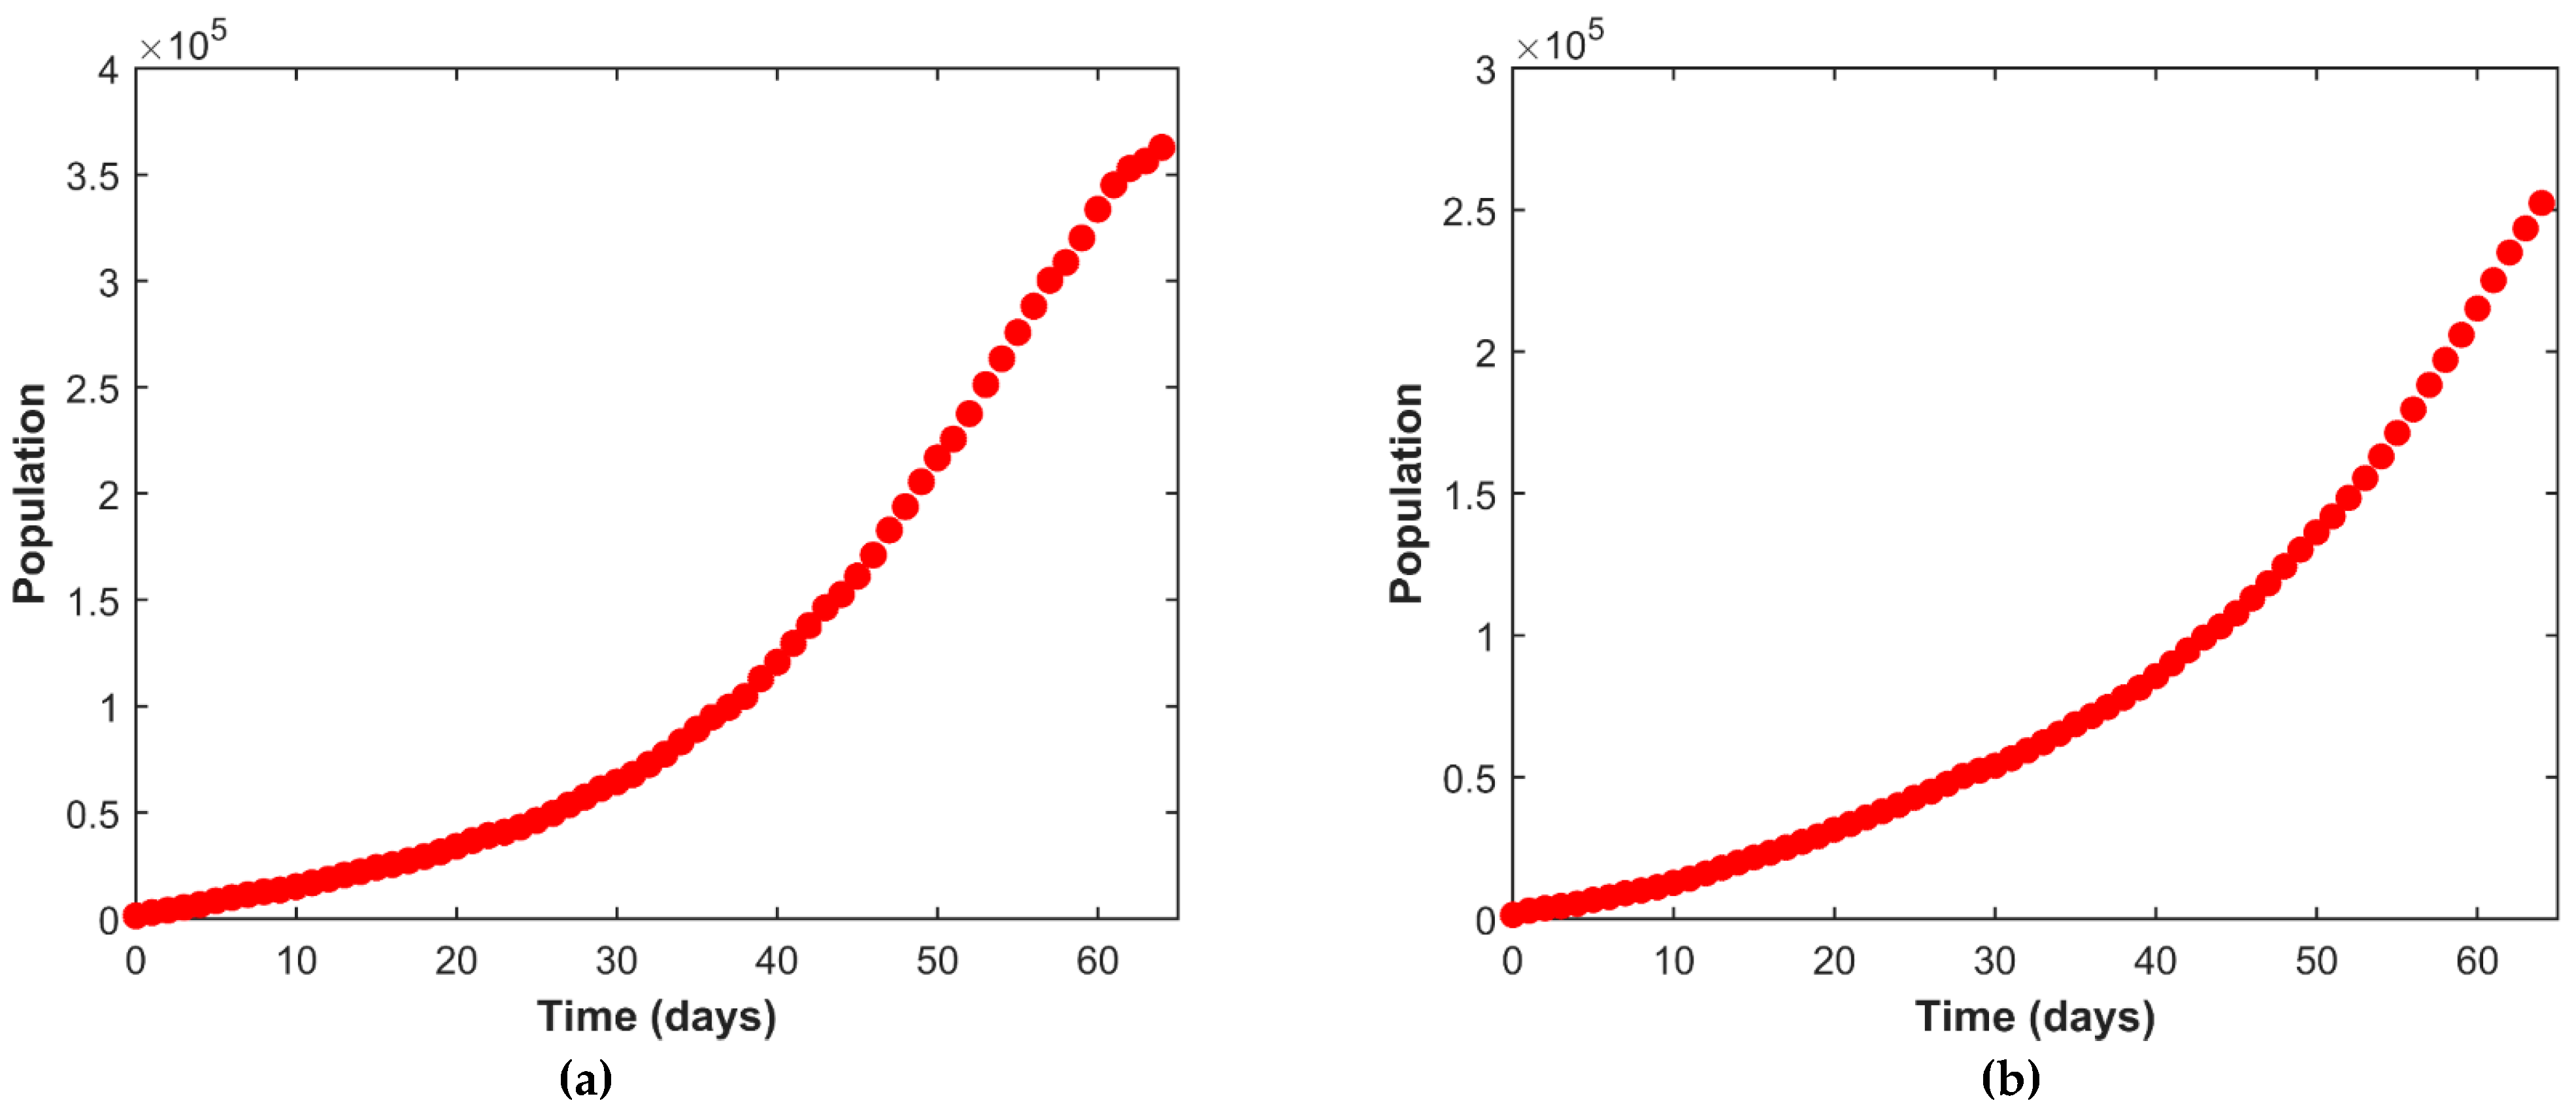
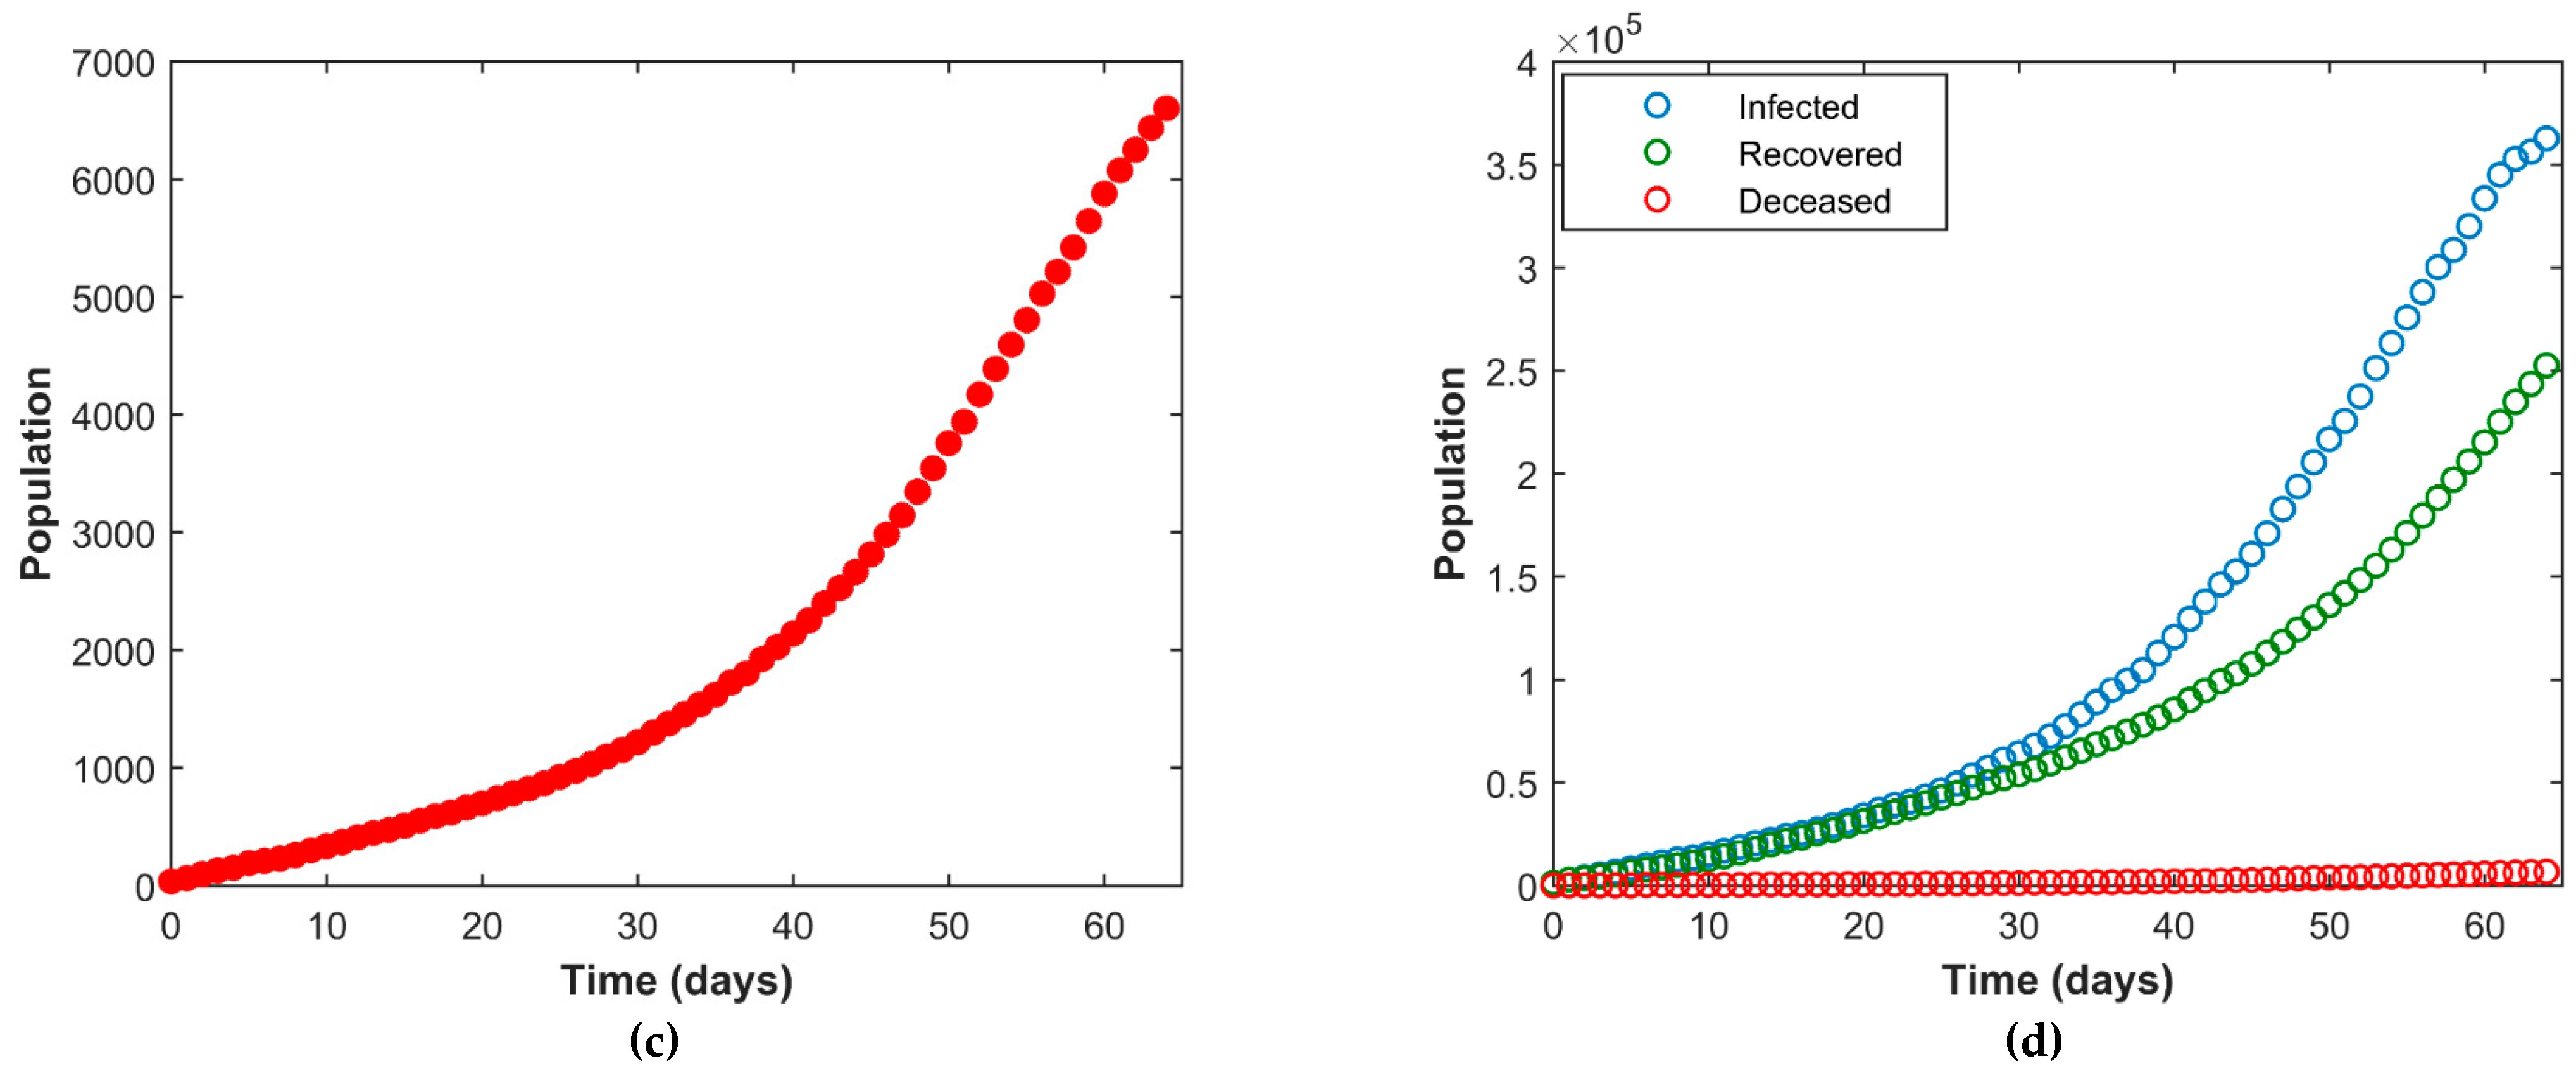
Following the diagnosis of the Delta variant of COVID-19 in Bangladesh, the number of infected and deceased individuals increased rapidly. In this study, we have studied the data during the peak of the delta variant. Figure 3 represents the daily development of the COVID-19 situation of Bangladesh from 20 May–23 July 2021, while Figure 4 represents the cumulative development within this period.
Figure 3a depicts the daily development of individuals infected with COVID-19. From the figure, we can see that the number of infected individuals increases as time passes. Figure 3b represents the number individuals who have recovered from COVID-19. The number of the recovered individuals continues to rise in number as time passes. Figure 3c exhibits the number of deceased individuals due to COVID-19. It depicts that the deceased population as a result of COVID-19 is minimal at first, and then steadily increases over time.
On the other hand, Figure 4a represents the cumulative development of the infected individuals due to COVID-19. It illustrates that the infected cases in Bangladesh are increasing substantially as the days increase. Figure 4b represents the cumulative development of the recovered individuals from COVID-19. The line shows that the number of recovered individuals grows at an increasing rate with the passing of time. Figure 4c represents the cumulative development of the deceased individuals due to COVID-19. The increasing curve clearly indicates an increasing rate of the deceased population.
In Figure 3 and Figure 4, the number of covid positive cases and the number of deceased cases indicates an increasing trend of community transmission. Despite the high recovery rate, the situation is worsening as the rate of infection and the number of deceased increase as time passes. The situation became more severe as a result of the high rate of infection and the number of deceased after the diagnosis of the delta variant of COVID-19. In response to this, the government of Bangladesh implemented immediate preventive measures within the first few days to mitigate the infection rate by imposing a national lockdown and a mass vaccination program.
The estimated parameters presented in Table 3 determine the value of the basic reproduction number, R 0 > 1 which indicates that the transmission rate is larger than the recovery rate and as a result, the transmission will spread rapidly throughout the population.

4.2. Fitting the SIRD Model to Data

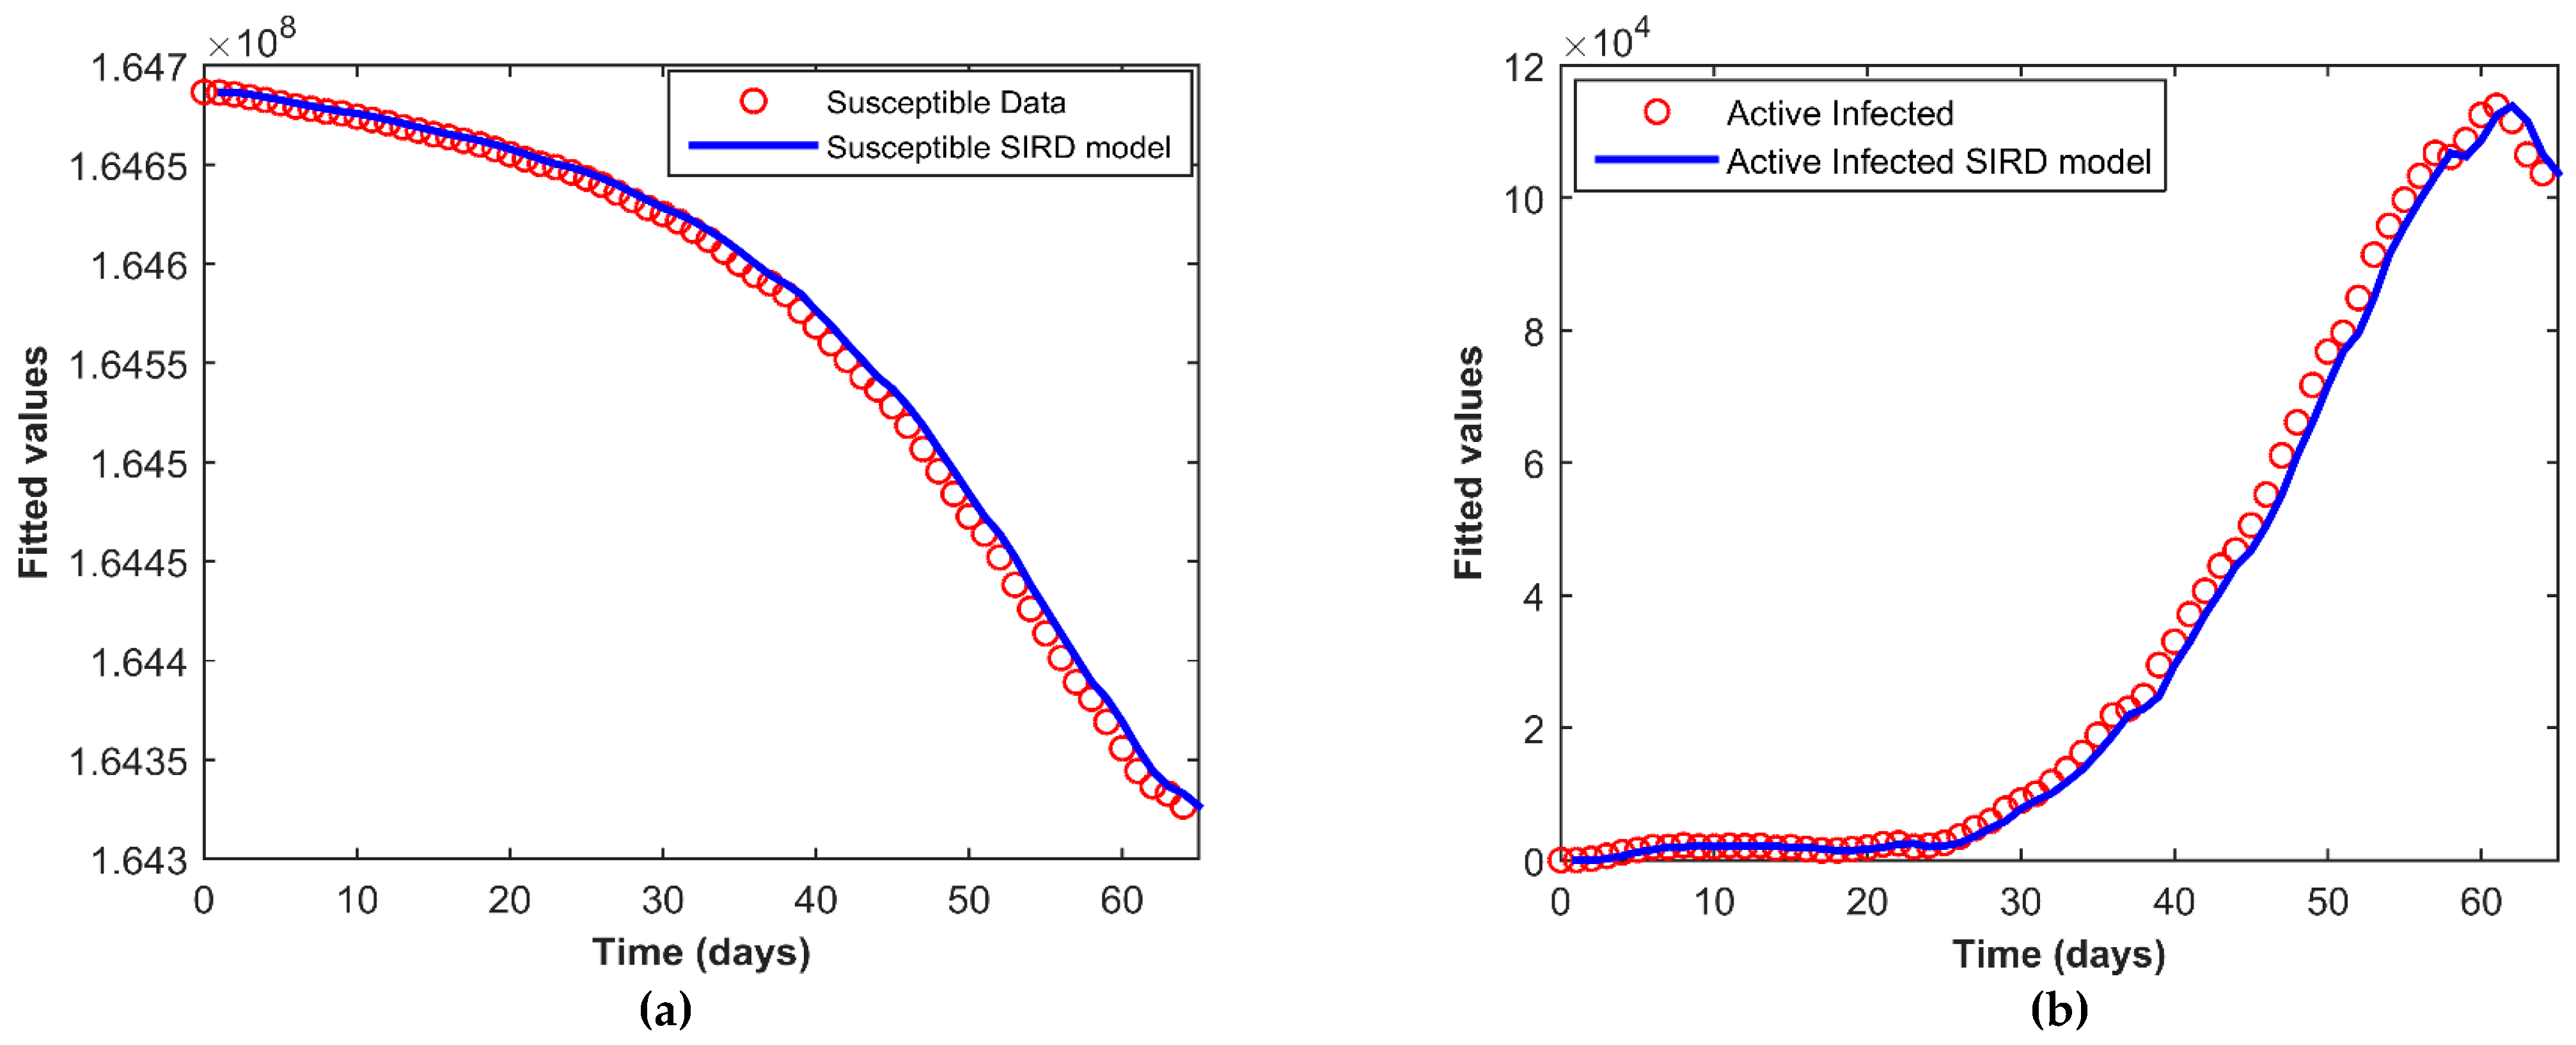
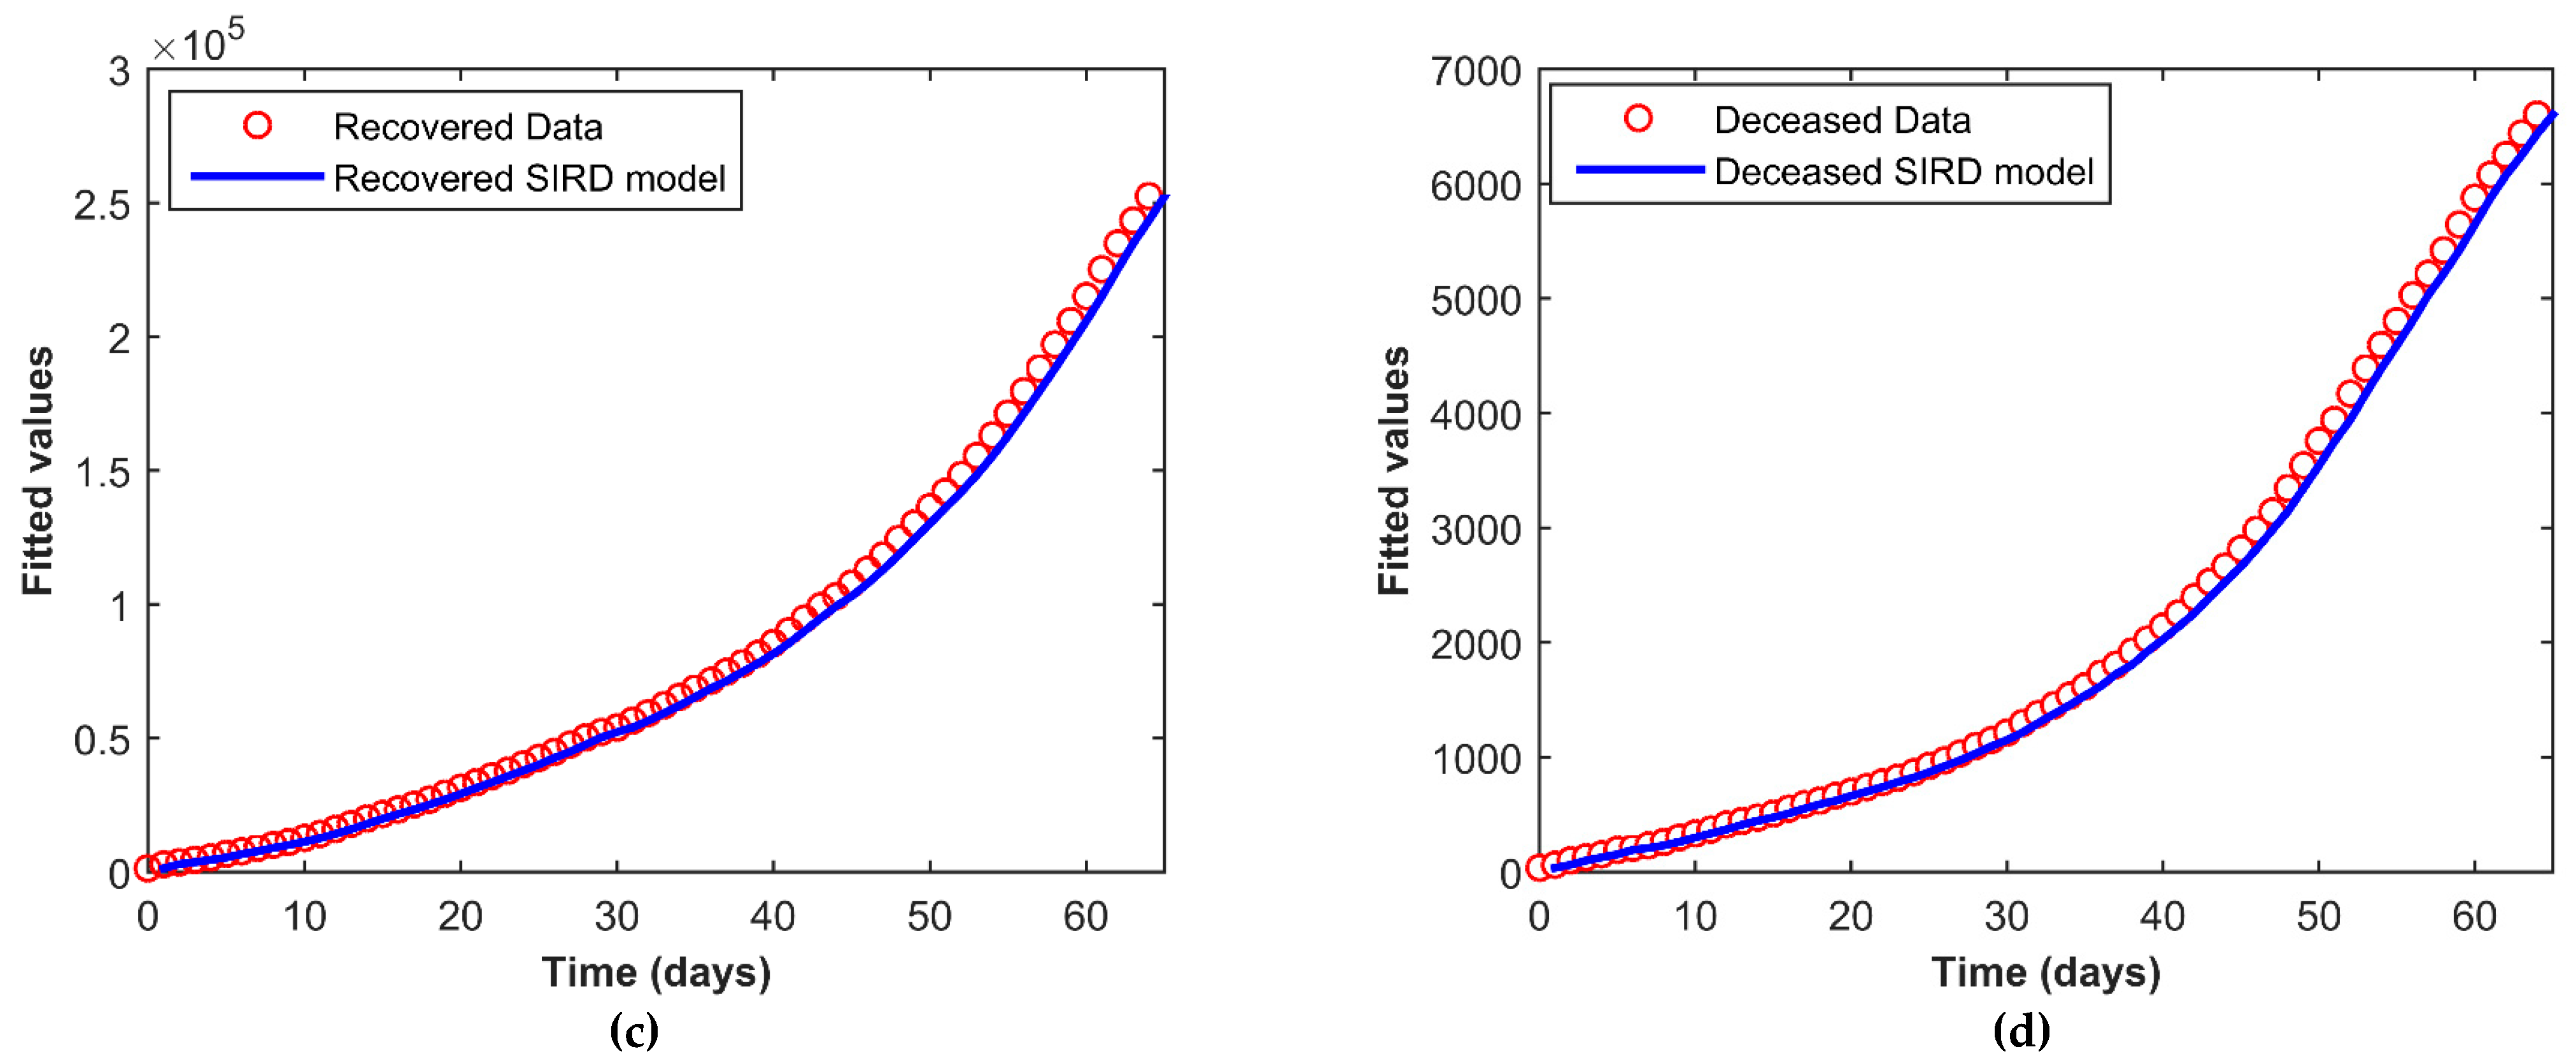
By using the ode45 solver and lsqcurvefit algorithm in MATLAB, we find the fitting of the SIRD model to the actual data presented in Table 1, the outcome for which is shown in Figure 5 below.
Here, Figure 5a–d depicts the fitting of the susceptible, active infected, recovered, and the deceased population respectively. The continuous line represents our model simulation and the circles depict the real reported data presented in Table 1 for all the cases. From this graphical representation, it is observed that the model simulation and the real data align quite well.
By using the fitted values represented in Figure 5, all the parameters for our model have been computed with their respective regression coefficients shown in Table 3. Both the regression coefficient and the fitted data represent that our model simulation aligned quite well with the reported data presented in Table 1.

4.3. Sensitivity Analysis

The sensitivity analysis demonstrates the relevance of each parameter to the transmission of the disease in epidemiology. As there may be some inaccuracies in the data collection and the estimated values of the parameters, it is often used to assess the stability of the model predictions to the values of the model parameters. It is also used to identify parameters that have a significant impact on the basic reproduction number R 0 and should be addressed through intervention methods. Sensitivity indices enable us to evaluate the relative change in a variable when a parameter changes. The normalized forward sensitivity index of a variable for a parameter is the ratio of the relative change in the variable to the corresponding change in the parameter. When a system’s basic reproduction number R 0 is differentiable with respect to the parameter, for example Φ , the normalized forward sensitivity index is defined as follows:
Ψ Φ R 0 = R 0 Φ × Φ R 0
For each parameter, we may determine the normalized forward sensitivity index of R 0 , which is derived as follows:
Ψ β R 0 = 1 > 0  
Ψ γ R R 0 = γ R γ R + γ D < 0
Ψ γ D R 0 = γ D γ R + γ D < 0
It is observed that the sensitivity index Ψ β R 0 is positive whereas Ψ γ R R 0 and Ψ γ D R 0 are negative in value. The sensitivity indices will change as the value of the parameters changes since all the sensitivity indices are the functions of the parameters. The sensitivity indices are calculated using the values of the estimated parameters in Table 3. Table 4 presents the normalized sensitivity indices of R 0 with respect to these estimated parameters. The high sensitivity parameters must be estimated carefully, as even a slight change in the parameters might result in significant quantitative changes. From the above equations, we can see that the sensitivity index of R 0 is independent of the parameter β although it depends on the parameters γ R and γ D . Table 4 further shows that the value of R 0 is extremely sensitive to the parameters β and γ R . With the parameter β , it is apparent that the basic reproduction number R 0 reaches its maximum value. More precisely, an increase (or decrease) in β by 100% will increase (or decrease) R0 by the same value by 100% and an increase (or decrease) in γR will increase (or decrease) R0 by 97.31%. Similarly, an increase (or decrease) in the value of γD by 100% will increase (or decrease) R0 by 2.69%.

4.4. COVID-19 Forecast for Bangladesh

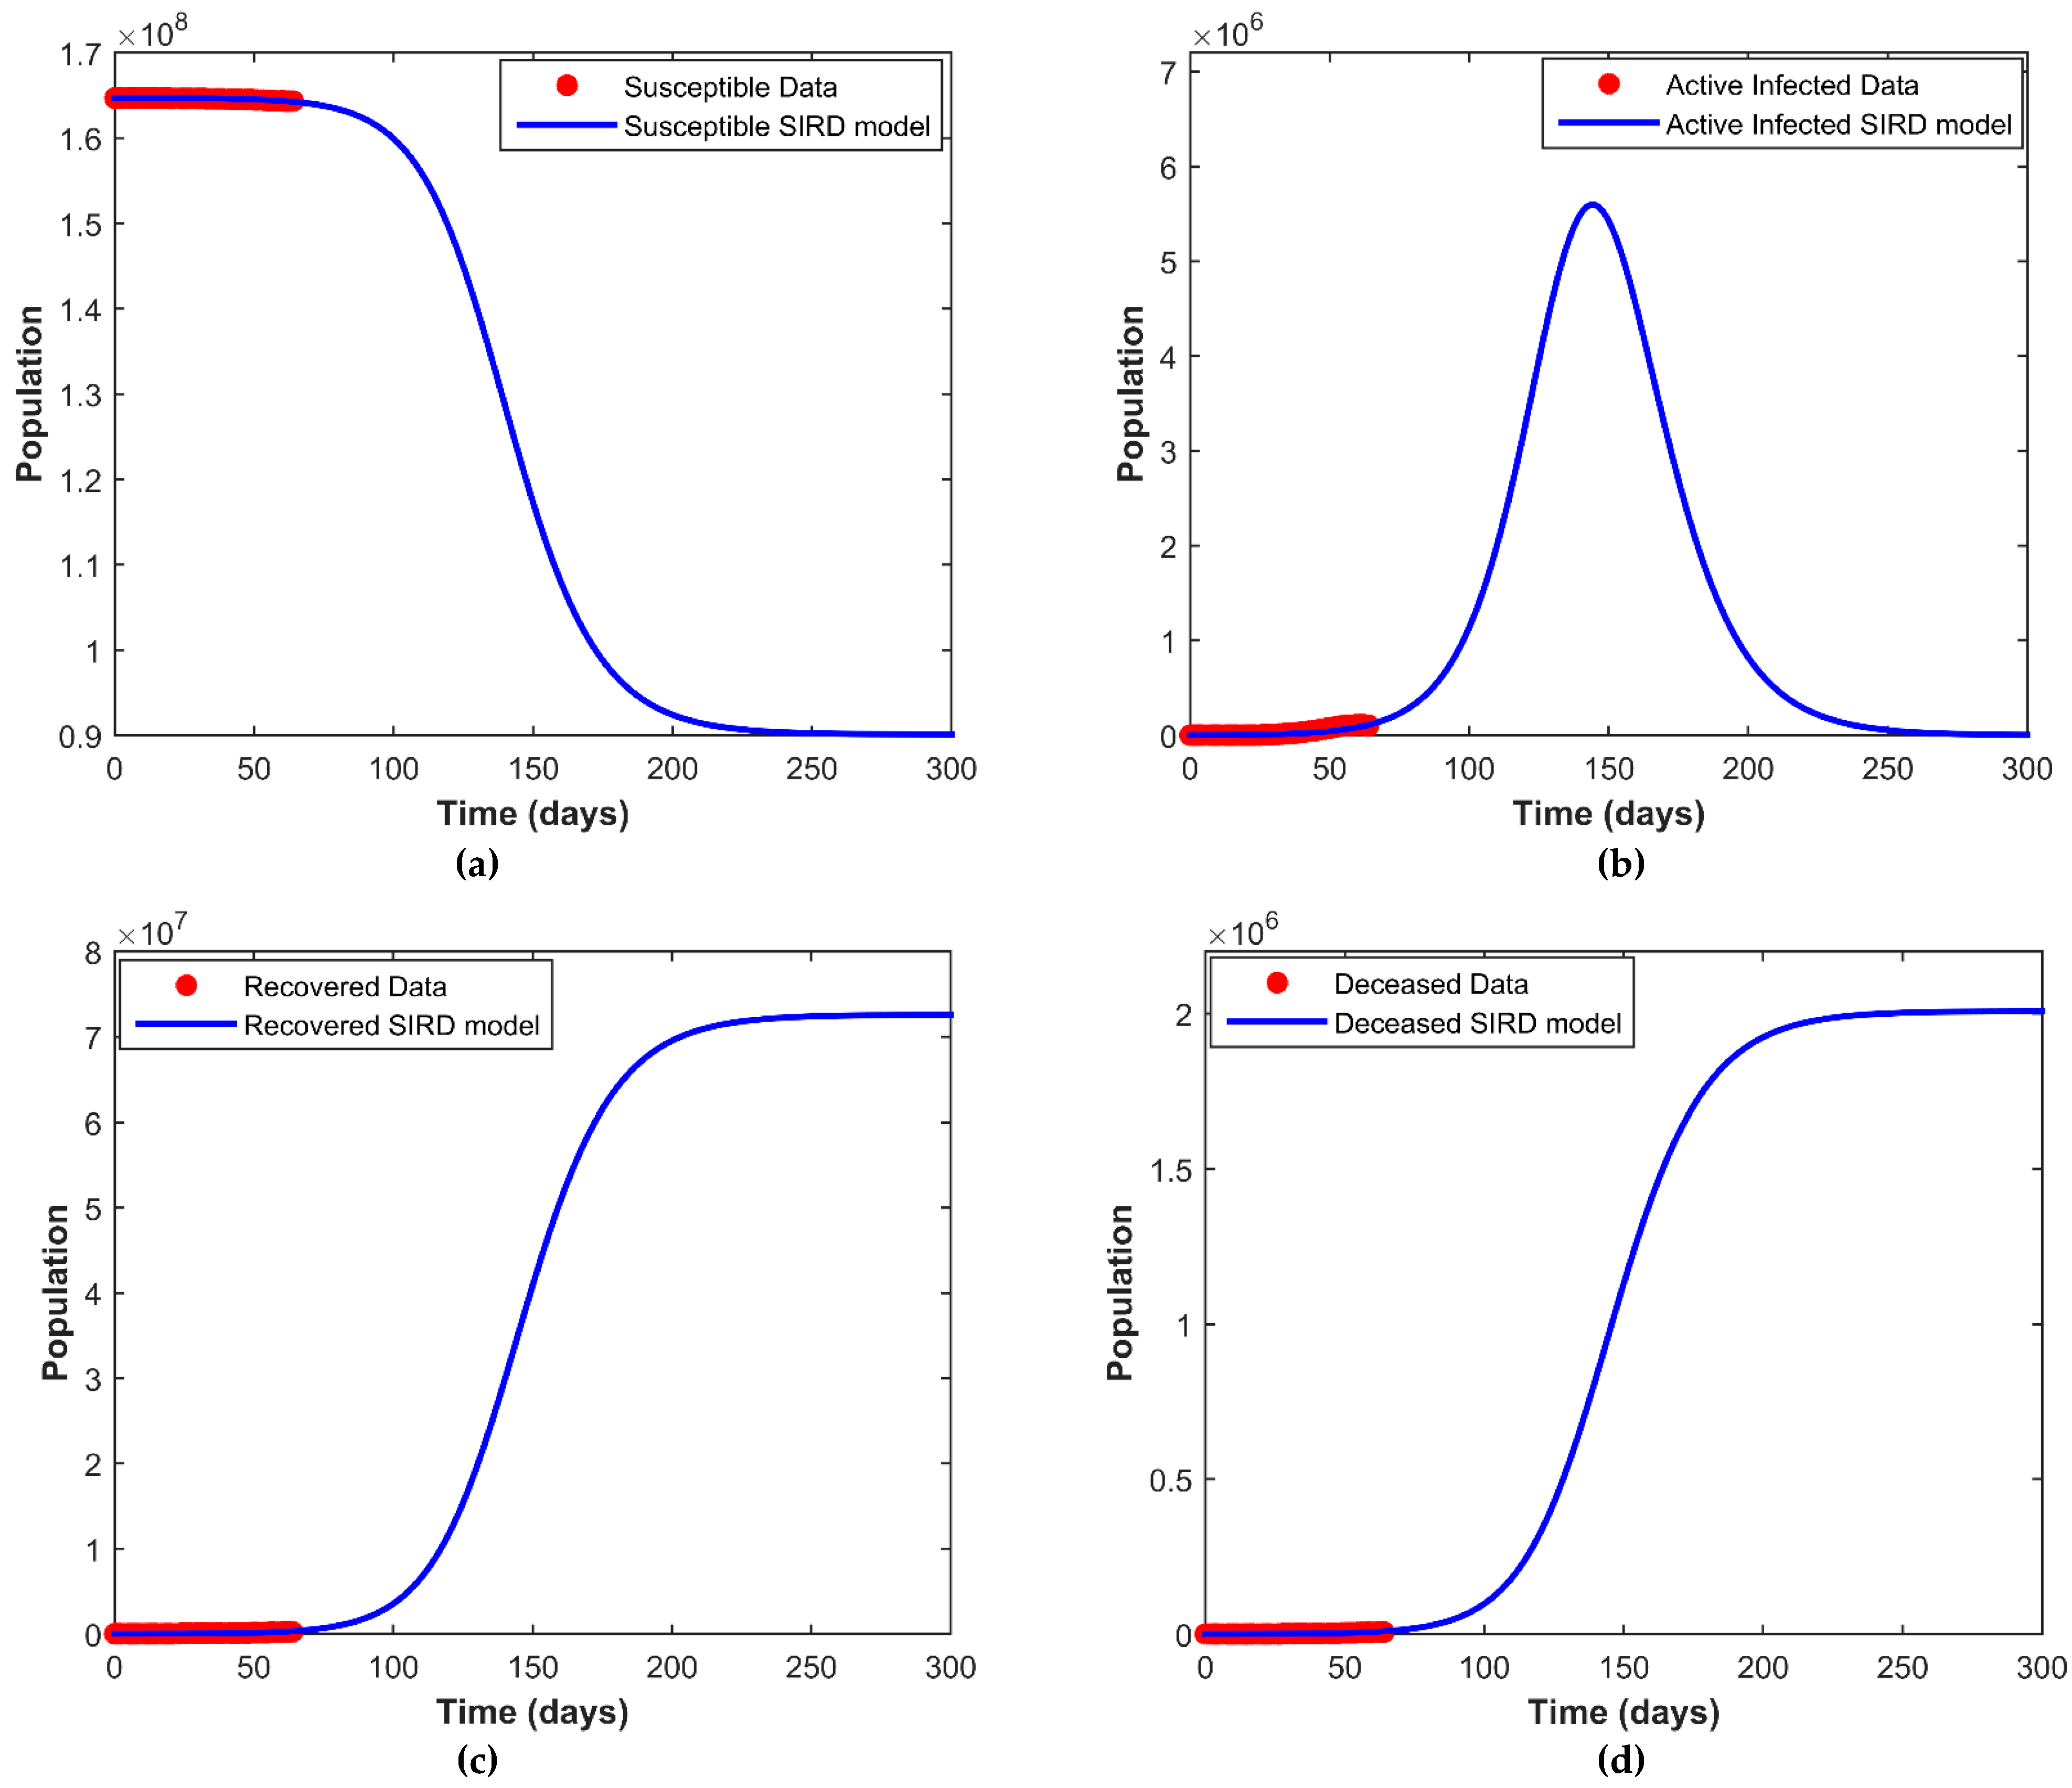
A forecast of the pandemic is one of the most critical elements for the implementation of effective and efficient tactical preventive measures to reduce infection and fatality. The objective of this study is to explore the dynamics of COVID-19 in Bangladesh over a longer period, utilizing the estimated parameters presented in Table 3. We performed a numerical simulation for the system of differential Equations (1)–(4) using the data in Table 1 for the forecast of COVID-19 for 235 days following 23 July 2021. The simulation anticipates a rise in infection rate, as the disease is rapidly spreading across Bangladesh.
Figure 6 depicts the forecasts of COVID-19 where the red dot represents the real data presented in Table 1 and the blue line represents the predicted value using our model simulation. Figure 6a depicts the forecast of susceptible individuals = to COVID-19. The figure shows that the number of susceptible individuals decreases asymptotically with time. Figure 6b is a prediction of the number of infected individuals due to COVID-19, where the increasing blue line clearly illustrates that the infection rate increases exponentially with time and then decreases after reaching the peak value. Figure 6c represents the anticipated number of recovered individuals from COVID-19. The line shows that the number of recovered individuals grows at an increasing rate with the advancement of time. Figure 6d represents the prediction of the number of deceased individuals due to COVID-19 where the increasing curve clearly illustrates an increasing rate of the deceased population.
The predictions derived from our model simulation indicate large variations in the number of cumulative confirmed, recovered, and deceased individuals compared to the real data presented in Table 1. Policymakers are urged to enact preventive measures to reduce the infection rate, such as ensuring the use of face masks, social distancing, quarantine, and disinfecting to flatten the increasing curve according to our model simulation.
As the value of the basic reproduction number, R 0 > 1 , the transmission will spread rapidly across the entire population in Bangladesh. If this current situation remains the same with this existing infection rate, our simulation predicts that the total number of infected and deceased population will be 2,011,284 and the total cases due to COVID-19 would be 74,585,718 after 234 days from 23 July 2021. The discrepancy between the actual reported cumulative value and the predicted value might be ascribed to the proposed system’s absence of preventive measures.
Since the infection rate increased drastically after the diagnosis of the delta variant of COVID-19 in Bangladesh, the government immediately took some measures to take the situation under control and decrease the infection. A strict lockdown was imposed immediately in the border district areas to control the transmission rate due to the delta variant. After that, the whole country came under this strict lockdown until 10 August 2021 by increasing the deadline several times. After the lockdown, the government has initiated a mass vaccination program for the people of Bangladesh and made the minimum age limit for vaccination to 18 years to mitigate the transmission rate. The program is still running across the whole country and we are hopeful that the transmission rate will decrease as the immune system is growing high through vaccination.

4.5. Study Limitations

The study has limitations. First, the values of the parameters defining the system are determined by applying field data to COVID-19. Estimating the parameters is a difficult task due to the absence of a significant part of the infectious cycle. The most important limitation is the use of ode45 and the optimization method lsqcurvefit to find the optimum parameters. lsqcurvefit is an optimization strategy that can obtain both positive and negative optimum parameters, but the required parameter values are non-negative. In this case, we have to simulate the system using different initial values of parameters until we get positive optimum parameter values.

5. Conclusions

In this study, we developed a SIRD compartmental model to analyze the present situation of COVID-19 disease transmission and for forecasting its future developments in Bangladesh. We used the initial value of the variables from the real data in Table 1 and applied curve fitting to obtain the value of the parameters used in the model. The goodness of fit for the parameters has been determined by the regression coefficient. Our findings demonstrate that our proposed model fits well with the reported data collected from 20 May–23 July 2021 in Bangladesh, which has been presented in Table 1. According to the sensitivity analysis, the transmission rate β is the most sensitive parameter. The epidemiological consequence is that increasing this parameter may worsen the situation of the disease in the population. The value of the basic reproduction number R 0 > 1 shows that the transmission of the disease is growing rapidly and that COVID-19 cannot be eradicated from the entire population over a short period of time. Numerical simulations are conducted to validate our model analysis and the model was fitted to the real data for forecasting the future trends of COVID-19. As our prediction shows that the transmission and the deceased rate is increasing day by day, necessary preventive measures should be taken immediately to reduce the transmission and deceased rate by policymakers. Though the government has already imposed strict lockdown measures across the whole country several times during this period, social awareness should be increased among the people to reduce the transmission rate. We acknowledge and appreciate the initiative of the mass vaccination program after 10 August 2021 that has been taken by the government and lowering the age limit for vaccination to 18 years of age. It will take time to vaccinate the entire through the vaccination program, until then wearing face masks should be made mandatory to prevent the transmission rate. Furthermore, the healthcare facilities in Bangladesh are insufficient to treat a large number of COVID-19 positive patients. The capacity of healthcare institutions should be enhanced to assist in reducing the transmission of COVID-19.

Author Contributions

Conceptualization, O.F.; methodology, O.F.; software, O.F.; validation, O.F. and S.K.; formal analysis, O.F.; investigation, O.F.; resources, O.F.; data curation, O.F. and S.K.; writing—original draft preparation, O.F.; writing—review and editing, O.F.; visualization, O.F.; supervision, S.K.; project administration, O.F. and S.K.; funding acquisition, S.K. All authors have read and agreed to the published version of the manuscript.

Funding

This research received no external funding.

Institutional Review Board Statement

Not Applicable.

Informed Consent Statement

Not Applicable.

Data Availability Statement

All the data sources are available in the published manuscript.

Acknowledgments

It gives us much pleasure to express our heartiest gratitude and thanks to Ahmad Sedaghat, Associate Professor, Department of Mechanical Engineering, Australian College of Kuwait, Kuwait for his continuous support in method simulation to pursue this work.

Conflicts of Interest

The authors declare no conflict of interest.

References

  1. Johns Hopkins University Center for Systems Science and Engineering. 2019 Novel Coronavirus COVID-19 (2019-nCoV) Data Repository by Johns Hopkins CSSE. 2020. Available online: https://github.com/CSSEGISandData/COVID-19/tree/master/csse_covid_19_data/csse_covid_19_time_series (accessed on 2 August 2021).
  2. Directorate General of Health Services, Bangladesh. Available online: http://103.247.238.92/webportal/pages/covid19.php (accessed on 2 August 2021).
  3. The Humanitarian Data Exchange. Available online: https://data.humdata.org/dataset/novel-coronavirus-2019-ncov-cases (accessed on 2 August 2021).
  4. Github. Our World in Data. Available online: https://ourworldindata.org/ (accessed on 2 August 2021).
  5. IECDR, Institute of Epidemiology Disease Control And Research. Available online: https://www.iedcr.gov.bd (accessed on 2 August 2021).
  6. IEDCR: 78% Covid Cases in June Caused by Delta Variant. Available online: https://www.dhakatribune.com/health/coronavirus/2021/07/04/iedcr-delta-variant-dominant-in-bangladesh (accessed on 28 July 2021).
  7. SARS-CoV-2 Delta Variant. Available online: https://en.wikipedia.org/wiki/SARS-CoV-2_Delta_variant (accessed on 28 July 2021).
  8. Bangladesh Battles Third Wave of COVID-19. Available online: https://www.devex.com/news/bangladesh-battles-third-wave-of-covid-19-100340 (accessed on 28 July 2021).
  9. Sedaghat, A.; Mosavi, A. Predicting Trends of Coronavirus Disease (COVID-19) Using SIRD and Gaussian-SIRD Models. Preprints 2020. [Google Scholar] [CrossRef]
  10. Korolev, I. Identification and estimation of the SEIRD epidemic model for COVID-19. J. Econom. 2021, 220, 63–85. [Google Scholar] [CrossRef] [PubMed]
  11. Sedaghat, A.; Oloomi, S.A.A.; Malayer, M.A.; Band, S.; Rezaei, N.; Mosavi, A.; Nadai, L. Coronavirus (COVID-19) Outbreak Prediction Using Epidemiological Models of Richards Gompertz Logistic Ratkowsky and SIRD. In Proceedings of the 2020 IEEE 3rd International Conference and Workshop in Óbuda on Electrical and Power Engineering (CANDO-EPE), Budapest, Hungary, 18–19 November 2020; pp. 289–298. [Google Scholar] [CrossRef]
  12. Sen, D.; Sen, D. Use of a Modified SIRD Model to Analyze COVID-19 Data. Ind. Eng. Chem. Res. 2021, 60, 4251–4260. [Google Scholar] [CrossRef]
  13. Carcione, J.M.; Santos, J.E.; Bagaini, C.; Ba, J. A Simulation of a COVID-19 Epidemic Based on a Deterministic SEIR Model. Front. Public Health 2020, 8, 230. [Google Scholar] [CrossRef] [PubMed]
  14. Victor Okhuese, A. Estimation of the Probability of Reinfection With COVID-19 by the Susceptible-Exposed-Infectious-Removed-Undetectable-Susceptible Model. JMIR Public Health Surveill 2020, 6, e19097. Available online: https://publichealth.jmir.org/2020/2/e19097 (accessed on 28 July 2021). [CrossRef]
  15. Sedaghat, A.; Alkhatib, F.; Mostafaeipour, N.; Abbas Oloomi, S.A. Prediction of COVID-19 Dynamics in Kuwait using SIRD Model. Integr. J. Med. Sci. 2020, 7, 170. Available online: https://mediterraneanjournals.com/index.php/ijms/article/view/170 (accessed on 27 July 2021). [CrossRef]
  16. De León, U.A.-P.; Pérez, Á.G.C.; Avila-Vales, E. A data driven analysis and forecast of an SEIARD epidemic model for COVID-19 in Mexico. Big Data Inf. Anal. 2020, 5, 14–28. [Google Scholar] [CrossRef]
  17. Gebremeskel, A.A.; Berhe, H.W.; Atsbaha, H.A. Mathematical modelling and analysis of COVID-19 epidemic and predicting its future situation in Ethiopia. Results Phys. 2021, 22, 103853. [Google Scholar] [CrossRef] [PubMed]
  18. Martínez, V. A Modified SIRD Model to Study the Evolution of the COVID-19 Pandemic in Spain. Symmetry 2021, 13, 723. [Google Scholar] [CrossRef]
  19. Caccavo, D. Chinese and Italian COVID-19 outbreaks can be correctly described by a modified SIRD model. medRxiv 2020. [Google Scholar] [CrossRef]
  20. Khan, M.H.R.; Hossain, A. COVID-19 Outbreak Situations in Bangladesh: An Empirical Analysis. medRxiv 2020. [Google Scholar] [CrossRef]
  21. Pabel Shahrear, S.M.; Rahman, S.; Nahid, M.M.H. Prediction and mathematical analysis of the outbreak of coronavirus (COVID-19) in Bangladesh. Results Appl. Math. 2021, 10, 100145. [Google Scholar] [CrossRef]
  22. Lounis, M.; dos Santos Azevedo, J. Application of a Generalized SEIR Model for COVID-19 in Algeria. Eur. J. Sustain. Dev. Res. 2021, 5, em0150. [Google Scholar] [CrossRef]
  23. Hassan, R.; Dosar, A.S.; Mondol, J.K.; Khan, T.H.; Noman, A.A.; Sayem, M.S.; Hasan, M.; Juyena, N.S. Prediction of Epidemics Trend of COVID-19 in Bangladesh. Front. Public Health 2020, 8, 559437. [Google Scholar] [CrossRef] [PubMed]
  24. Fargana, A.; Arifutzzaman, A.; Rakhimov, A.A. Spreading Analysis of COVID-19 Epidemic in Bangladesh by Dynamical Mathematical Modelling. Eur. J Med. Educ. Technol. 2021, 14, em2109. [Google Scholar] [CrossRef]
  25. Annas, S.; Pratama, M.I.; Rifandi, M.; Sanusi, W.; Side, S. Stability analysis and numerical simulation of SEIR model for pandemic COVID-19 spread in Indonesia. Chaos Solitons Fractals 2020, 139, 110072. [Google Scholar] [CrossRef] [PubMed]
  26. Berhe, H.W.; Makinde, O.D.; Theuri, D.M. Parameter Estimation and Sensitivity Analysis of Dysentery Diarrhea Epidemic Model. J. Appl. Math. 2019, 2019, 8465747. [Google Scholar] [CrossRef]
  27. Chitnis, N.; Hyman, J.M.; Cushing, J.M. Determining Important Parameters in the Spread of Malaria Through the Sensitivity Analysis of a Mathematical Model. Bull. Math. Biol. 2008, 70, 1272–1296. [Google Scholar] [CrossRef] [PubMed]
  28. Van den Driessche, P. Reproduction numbers of infectious disease models. Infect. Dis. Model. 2017, 2, 288–303. [Google Scholar] [CrossRef] [PubMed]
  29. Rodrigues, H.S.; Monteiro, M.T.T.; Torres, D.F.M. Sensitivity Analysis in a Dengue Epidemiological Model. Conf. Pap. Sci. 2013, 721406. [Google Scholar] [CrossRef]
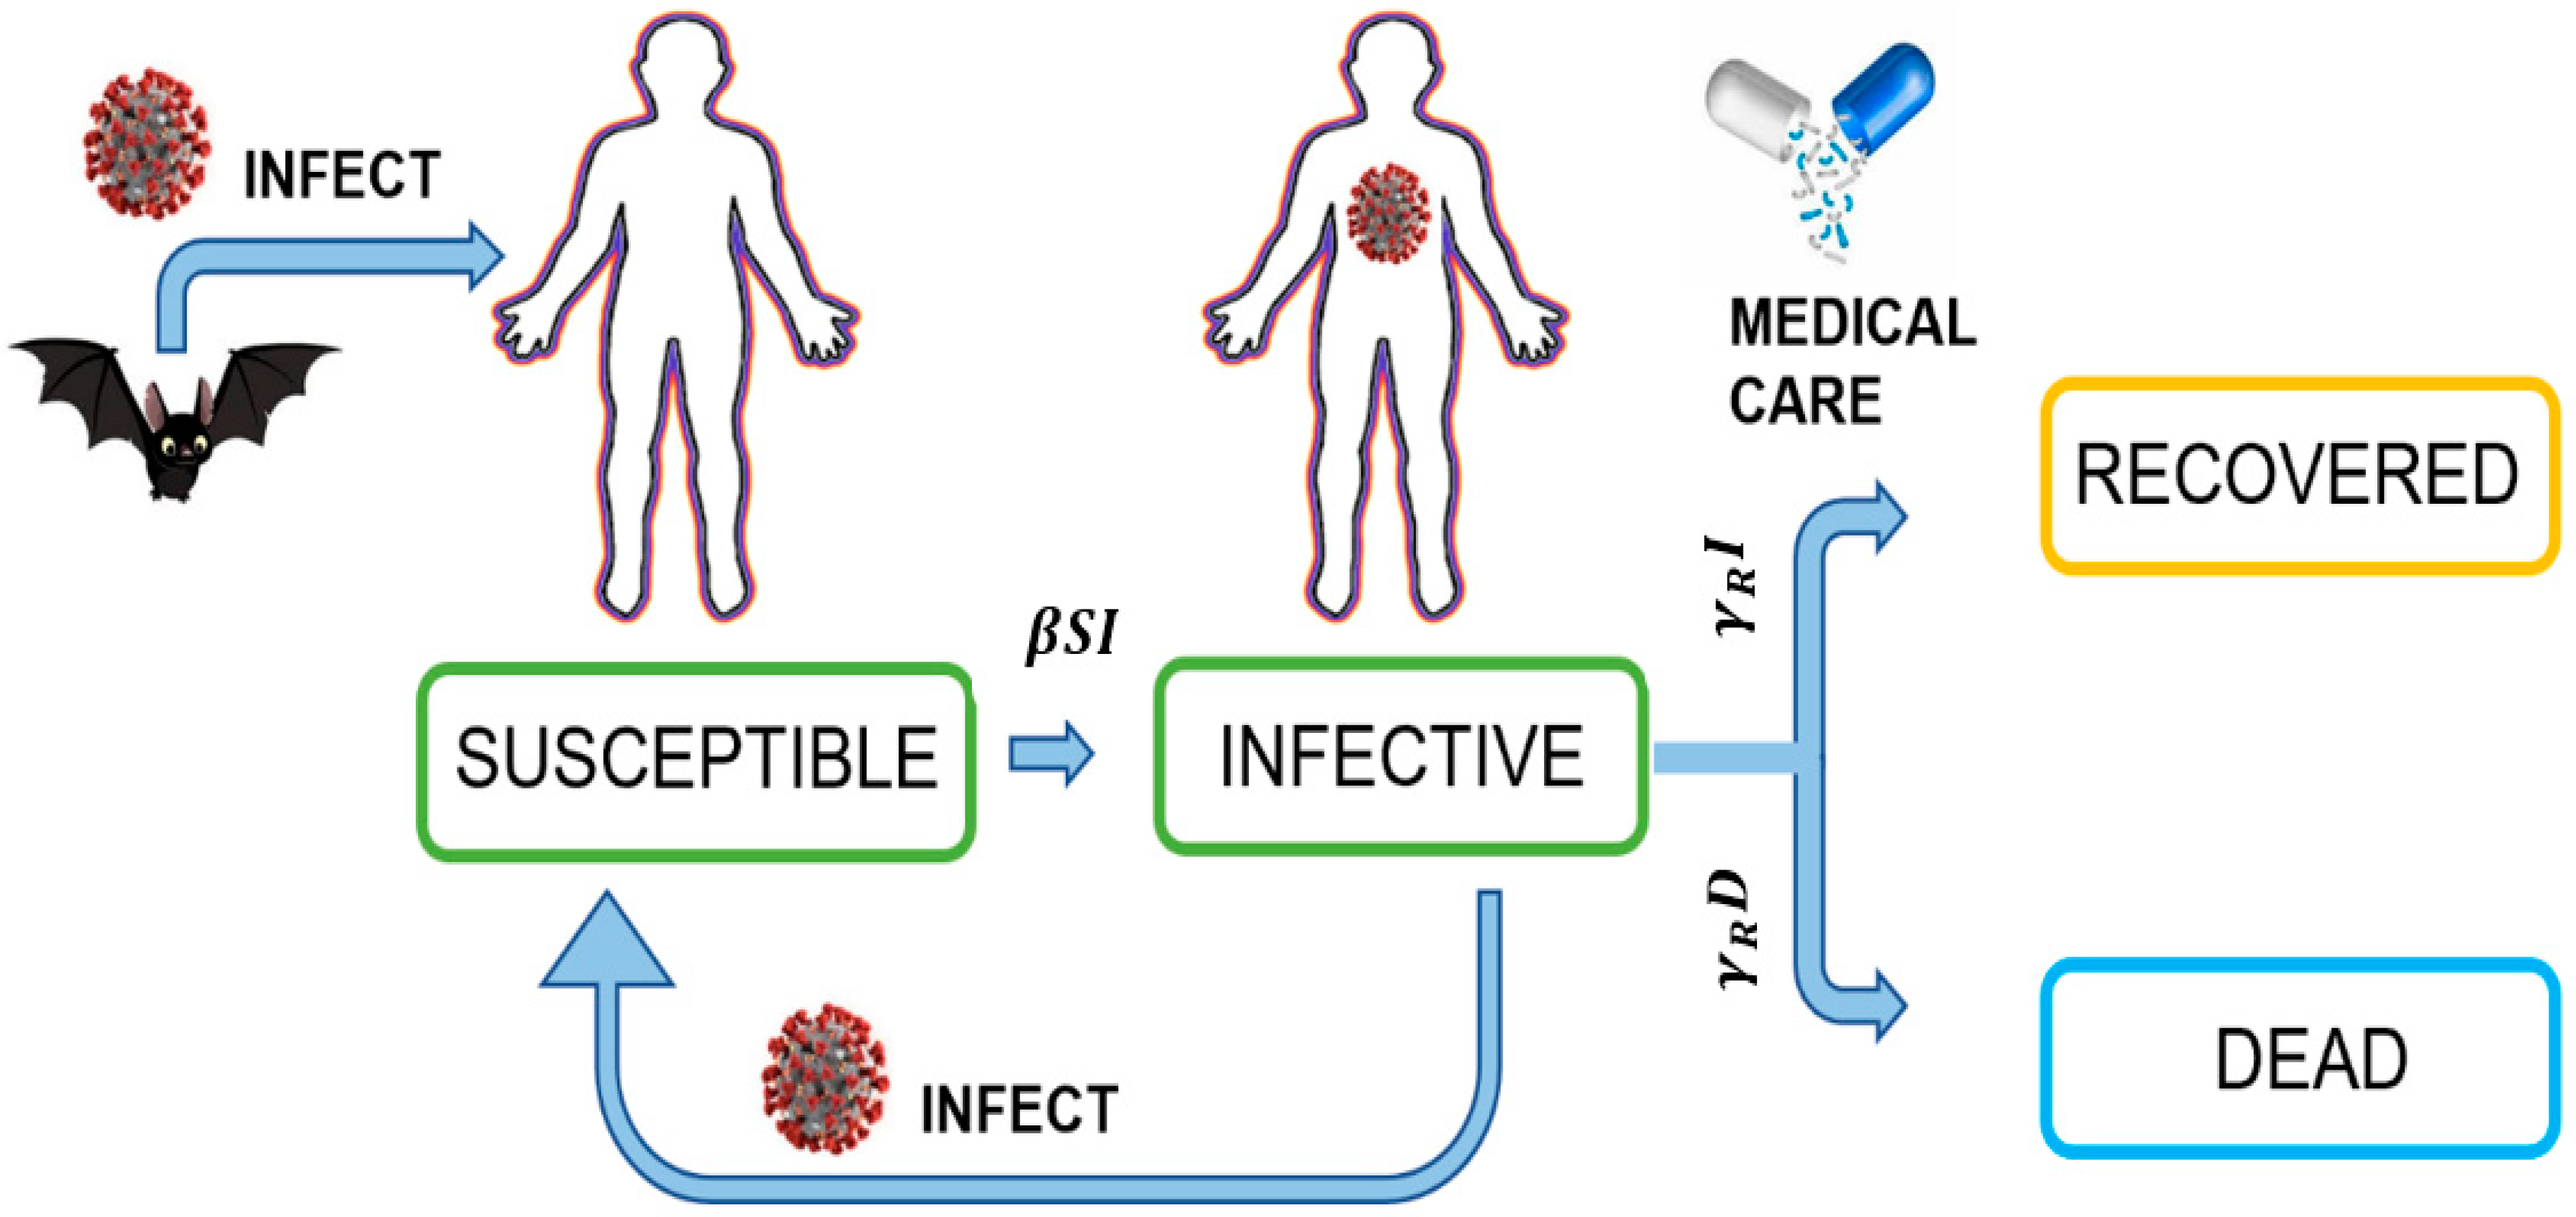
Figure 1. Schematization of the SIRD model.
Covid 01 00043 g001
Figure 2. Typical behavior of the SIRD Model over time.
Covid 01 00043 g002
Figure 3. Daily development of the COVID-19. (a) Daily infected, (b) Daily recovered, (c) Daily deceased, (d) Combined (infected, recovered, deceased).
Covid 01 00043 g003aCovid 01 00043 g003b
Figure 4. Cumulative development of COVID-19. (a) Cumulative infected, (b) Cumulative recovered, (c) Cumulative deceased, (d) Combined (infected, recovered, deceased).
Covid 01 00043 g004aCovid 01 00043 g004b
Figure 5. Fitting model to the actual data. (a) Susceptible fitted, (b) Active infected fitted, (c) Recovered fitted, (d) Deceased fitted.
Covid 01 00043 g005aCovid 01 00043 g005b
Figure 6. Model forecasting for COVID-19. (a) Forecast of susceptible population, (b) Forecast of active infected population, (c) Forecast of recovered population, (d) Forecast of deceased population.
Covid 01 00043 g006
Table 1. Number of cases, recovered and deceased in Bangladesh from 20 May–23 July 2021.
DateCasesRecoveredDeceasedDateCasesRecoveredDeceased
20 May145713783622 June4846290376
21 May150415292623 June5727316885
22 May10287593824 June6058323081
23 May13548992825 June58692776108
24 May14418342526 June4334329577
25 May167512794027 June52683249119
26 May149710561728 June83643570104
27 May129212912229 June76664027112
28 May135810643130 June88224550115
29 May104311873801 July83014663143
30 May144413973402 July84834509132
31 May171015673603 July62143777134
01 June176517794104 July86614698153
02 June198819143405 July99645185164
03 June168719703006 July11,5255433163
04 June188717233407 July11,1625987201
05 June144716674308 July11,6515844199
06 June167618973809 July11,3246038212
07 June197019183010 July87725755185
08 June232220624411 July11,8746362230
09 June253722673612 July13,7687020220
10 June257620614013 July12,1987646203
11 June245422864314 July12,3838245210
12 June163721083915 July12,2368395226
13 June243622424716 July12,1488536187
14 June305025645417 July84898820204
15 June331922435018 July11,5788845225
16 June395626796019 July13,3219335231
17 June384027146320 July11,5799997200
18 June388319555421 July76149704173
19 June305717256722 July36978566187
20 June364125098223 July63649006166
21 June4636282778
Table 2. Variables and parameters used in the model.
NotationDescription
  N                     Total population
        S t                     Susceptible population at time t
        I t                     Infected population at time t
        R t                       Recovered population at time t
        D t                       Deceased population at time t
    β                     The rate of transmission from susceptible to infectious population
    γ R                   The rate of recovery from infection
    γ D                   The death rate induced by disease
Table 3. Estimated model parameters with their regression coefficient.
ParameterRegression Coefficient
β γ R γ D R 2 S R 2 I R 2 R R 2 D
0.2721 0.1988 0.0055 1 0.8135 0.9022 0.9162
Table 4. Sensitivity indices of R 0 .
ParameterSensitivity Index
β + 1
γ R 0.9731
γ D 0.0269
Publisher’s Note: MDPI stays neutral with regard to jurisdictional claims in published maps and institutional affiliations.