3.1. Effect of Polymeric Cell Volume and Precursor Loading Factor
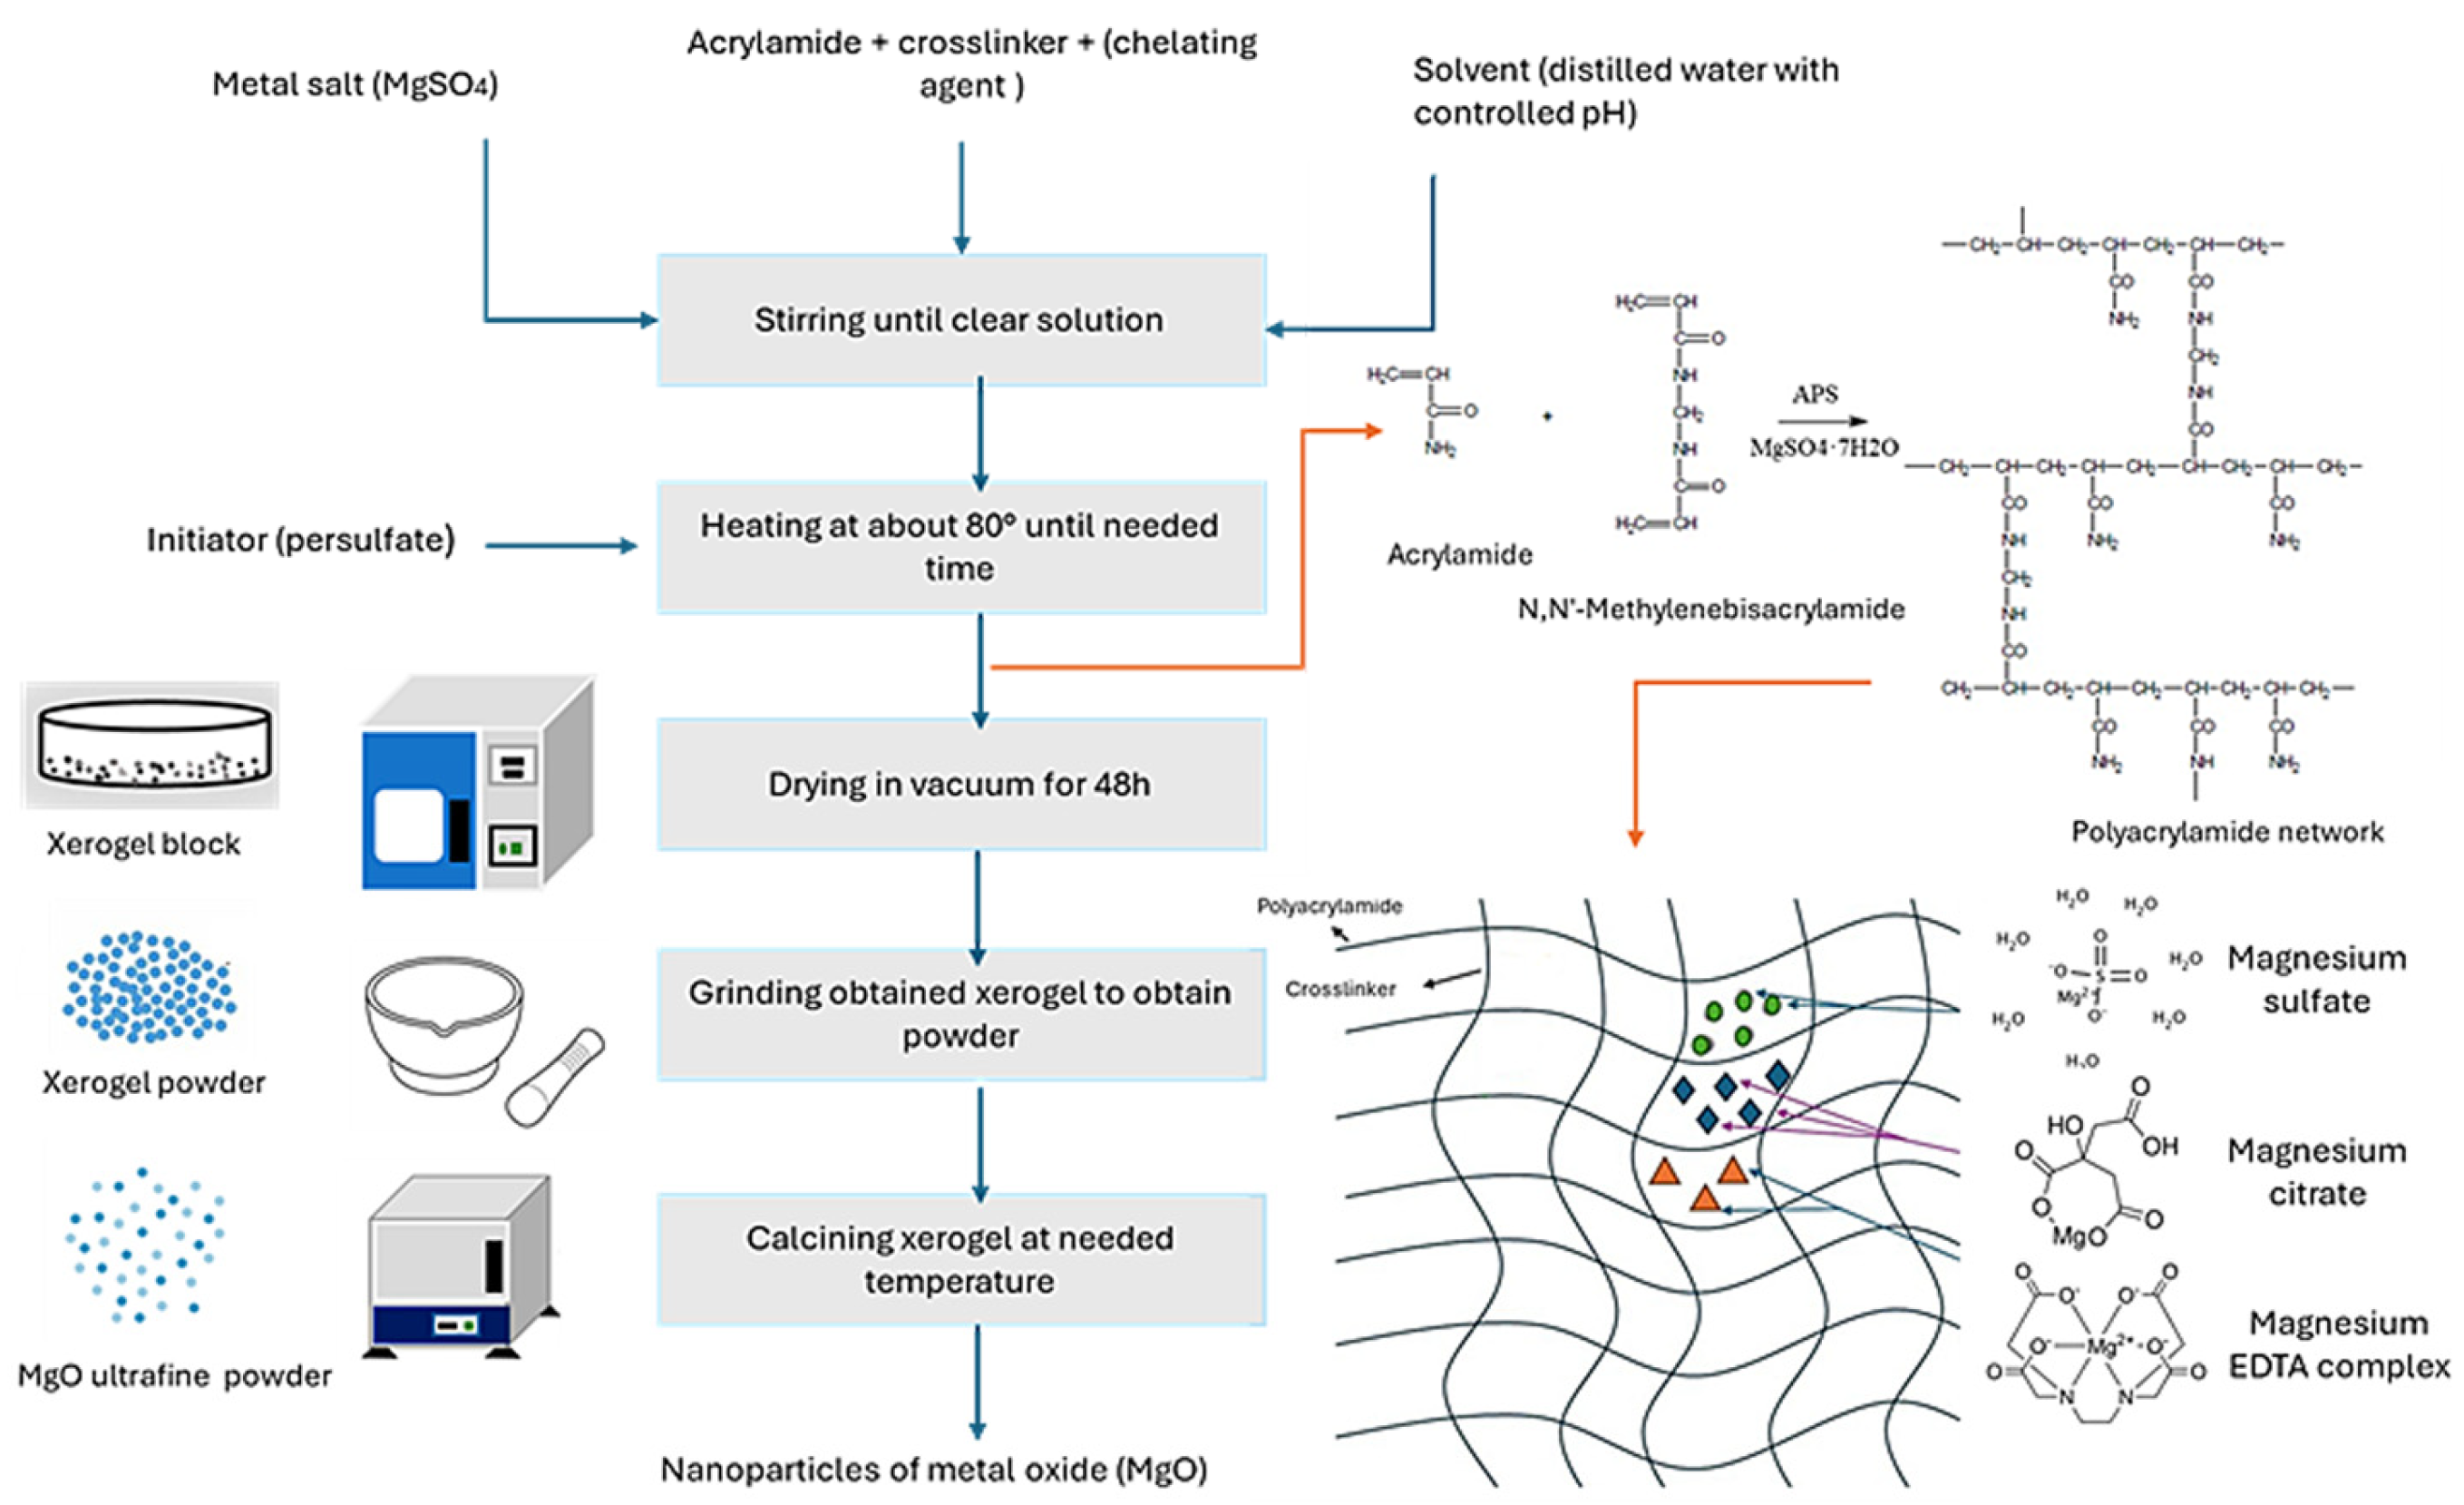
The polyacrylamide gel method functions by creating a three-dimensional polymer network that acts as a nanoscale scaffold, confining the precursor and dictating the subsequent growth of nanoparticles. According to the literature [
24], the morphology of this polymeric matrix, specifically the volume and size of its constituent “cells” is a critical factor determining the size of the final product. This morphology is primarily influenced by the molecular weight of the polyacrylamide chains and the density of crosslinking knots, which are, in turn, controlled by the initiator concentration and the crosslinker-to-monomer ratio.
The initiator concentration directly affects the number of polymer chains; a higher concentration of ammonium persulfate (APS) generates more free radicals, leading to a larger number of shorter polymer chains. The crosslinker ratio, defined as:
controls the spacing between these chains. A higher ratio creates a more rigid and densely crosslinked network with smaller pores.
Simultaneously, the precursor loading fraction φ, defined as the amount of metal salt relative to the monomer content, is another fundamental parameter.
In this study, the total monomer concentration was held constant. Therefore, we refer to the precursor concentration directly as a measure of the loading factor. This parameter is expected to directly influence nanoparticle nucleation and growth dynamics within the polymeric nanoreactors.
This subsection investigates the individual and combined effects of these parameters on the properties of the synthesized MgO. We first present the impact on chemical purity, followed by an analysis of particle size and distribution. The elemental composition of the synthesized products was determined by XRF spectroscopy, and the relative Mg mass fraction was taken from the measured XRF data. As discussed in detail in
Section 2.3.1, this estimation is justified within our experimental system by the combination of TEM morphological evidence, quantitative tracking of sulfur depletion, and the thermodynamic instability of alternative Mg-bearing phases under the applied calcination conditions. The results for variations in precursor concentration and crosslinker ratio are presented in
Table 2.
Mg mass fraction decreases consistently with increasing precursor concentration. At the lower precursor concentrations (0.5 M and 1 M), a higher crosslinker ratio (40%) leads to a slightly higher relative Mg enrichment (97.5% vs. 96.14% at 0.5 M; 95.2% vs. 91.2% at 1 M). At the high concentration (2 M), the crosslinker ratio has a negligible effect (78.9% vs. 78.3%).
The dominant effect is explained by the chemistry of the sulfate precursor. The thermal decomposition of magnesium sulfate to MgO is a complex, energy-intensive process that may involve intermediate phases such as MgSO
3. At high precursor concentrations (2 M), a large amount of sulfate ions is present in the gel. During calcination, some sulfate groups may remain undecomposed due to kinetic limitations, consistent with the known high thermal stability of MgSO
4 (onset >875 °C according to Zhong et al., 2025 [
43]; Scheidema & Taskinen, 2011 [
44]), leaving sulfur-containing residues trapped within the product.
In addition, a highly crosslinked gel (40%) may create a more rigid and porous network. This enhanced porosity presumably facilitates the diffusion and escape of gaseous decomposition products (e.g., SO
x) during calcination. However, direct evidence for this proposed porosity-mediated gas transport mechanism would require dedicated porosimetric analysis of the xerogel structure prior to calcination, which lies beyond the scope of the present study. This effect appears more pronounced at lower precursor loads, where there is less solid residue to remove, hence the slight improvement in MgO content. At high precursor loads (2 M), the amount of decomposition products is presumably too large for the improved porosity to make a measurable difference. The influence of the initiator’s concentration on the purity of MgO is shown in
Table 3 below.
The results shown in
Table 3 appear counterintuitive at first glance; however, they can be rationalized by considering the role of the initiator in defining the polymer network structure. A higher concentration of APS generates a greater number of free radicals at the onset of polymerization, resulting in a larger number of shorter polyacrylamide chains and a higher density of crosslinking points in the gel.
Furthermore, a gel with a higher number of smaller pores, created by the more numerous shorter chains formed at 1% initiator, may facilitate more controlled and gradual decomposition during heating. A similar kinetic effect of heating rate on MgSO
4 decomposition was reported in [
43,
44], although direct evidence within the gel matrix is not provided here. This could allow for a more efficient release and oxidation of the magnesium precursor, compared to a gel with a coarser structure formed with less initiator. The more efficient the polymer removal and precursor decomposition, the less carbonaceous and other residue is left behind, leading to a higher-purity MgO product.
Thus, the choice of MgSO4 as a safer precursor comes with a trade-off: a challenging decomposition process that impacts final product purity. The synthesis parameters (precursor concentration, crosslinker ratio, initiator amount) must be carefully optimized not only to control particle size and morphology (as shown in the figures) but also to maximize the chemical purity of the final MgO nanopowder by promoting the complete removal of sulfate residues.
The initial synthesis using the reference parameters (underlined values in
Table 1) serves as a baseline for the study. To quantitatively assess the size distribution and degree of agglomeration of the resulting MgO nanopowder, acoustic spectroscopy was employed. This technique is particularly valuable for analyzing particles in suspension, as it measures the attenuation of sound waves to determine size distribution, providing insight into both primary particle size and the extent of agglomeration.
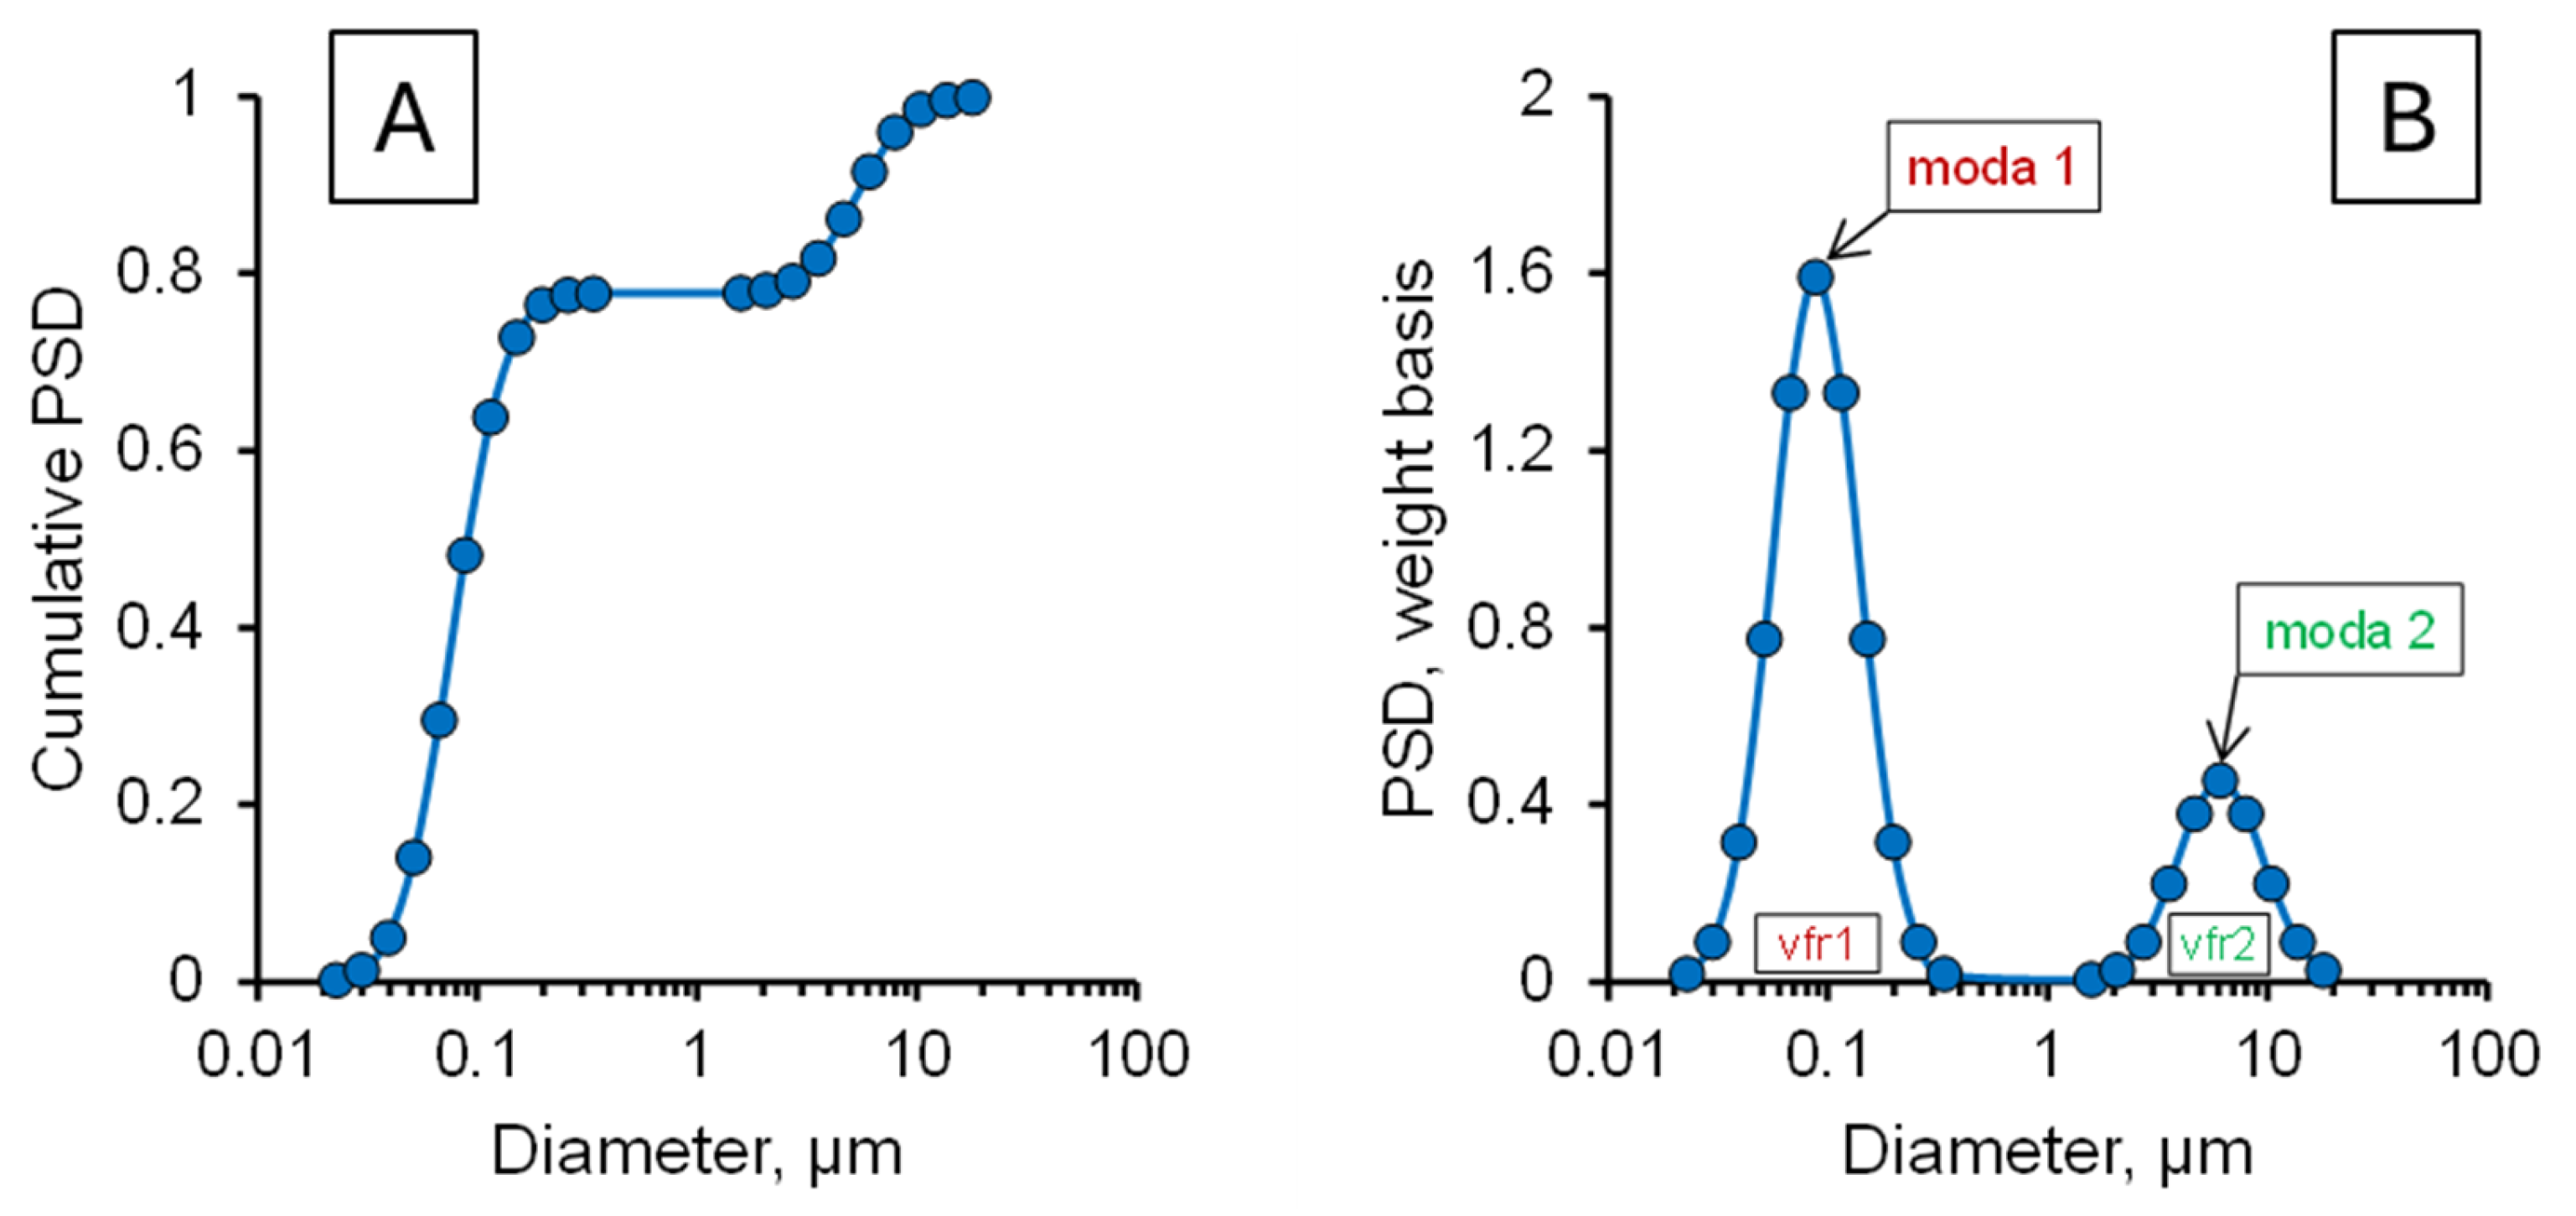
Figure 3 presents the acoustic spectroscopy results for the MgO nanoparticles synthesized under these reference conditions, revealing the fundamental dispersion state of the product before further parameter optimization.
Acoustic spectroscopy analysis of the baseline MgO sample, synthesized using the reference parameters, revealed a bimodal size distribution, delineating a primary population of nanoparticles with a median size of ~80 nm and a secondary population of microparticle agglomerates at ~6.1 µm. This distribution immediately identified severe agglomeration as a critical challenge inherent to the process. Consequently, the parameters extracted for subsequent study—the average nano-size, (moda 1), the average micro-size (moda 2), and the percentage of micro-size particles—were strategically selected to quantify and address this issue. The average nano-size was tracked to monitor the target property of primary particle formation, the average micro-size served to gauge the scale of unwanted sintering, and crucially, the percentage of micro-size particles was established as the definitive metric for evaluating sample homogeneity. Thus, this initial result justified a systematic investigation into how various synthesis parameters could be optimized to minimize this percentage and suppress agglomeration, thereby ensuring the final product retains its desired nanoscale properties.
Figure 3A presents the cumulative particle size distribution curve, which shows two distinct inflection points. This indicates the presence of two main particle groups of different sizes in the material: a nanoparticle population with a median size of ~80 nm and a microparticle agglomerate population with a median size of ~6.1 µm.
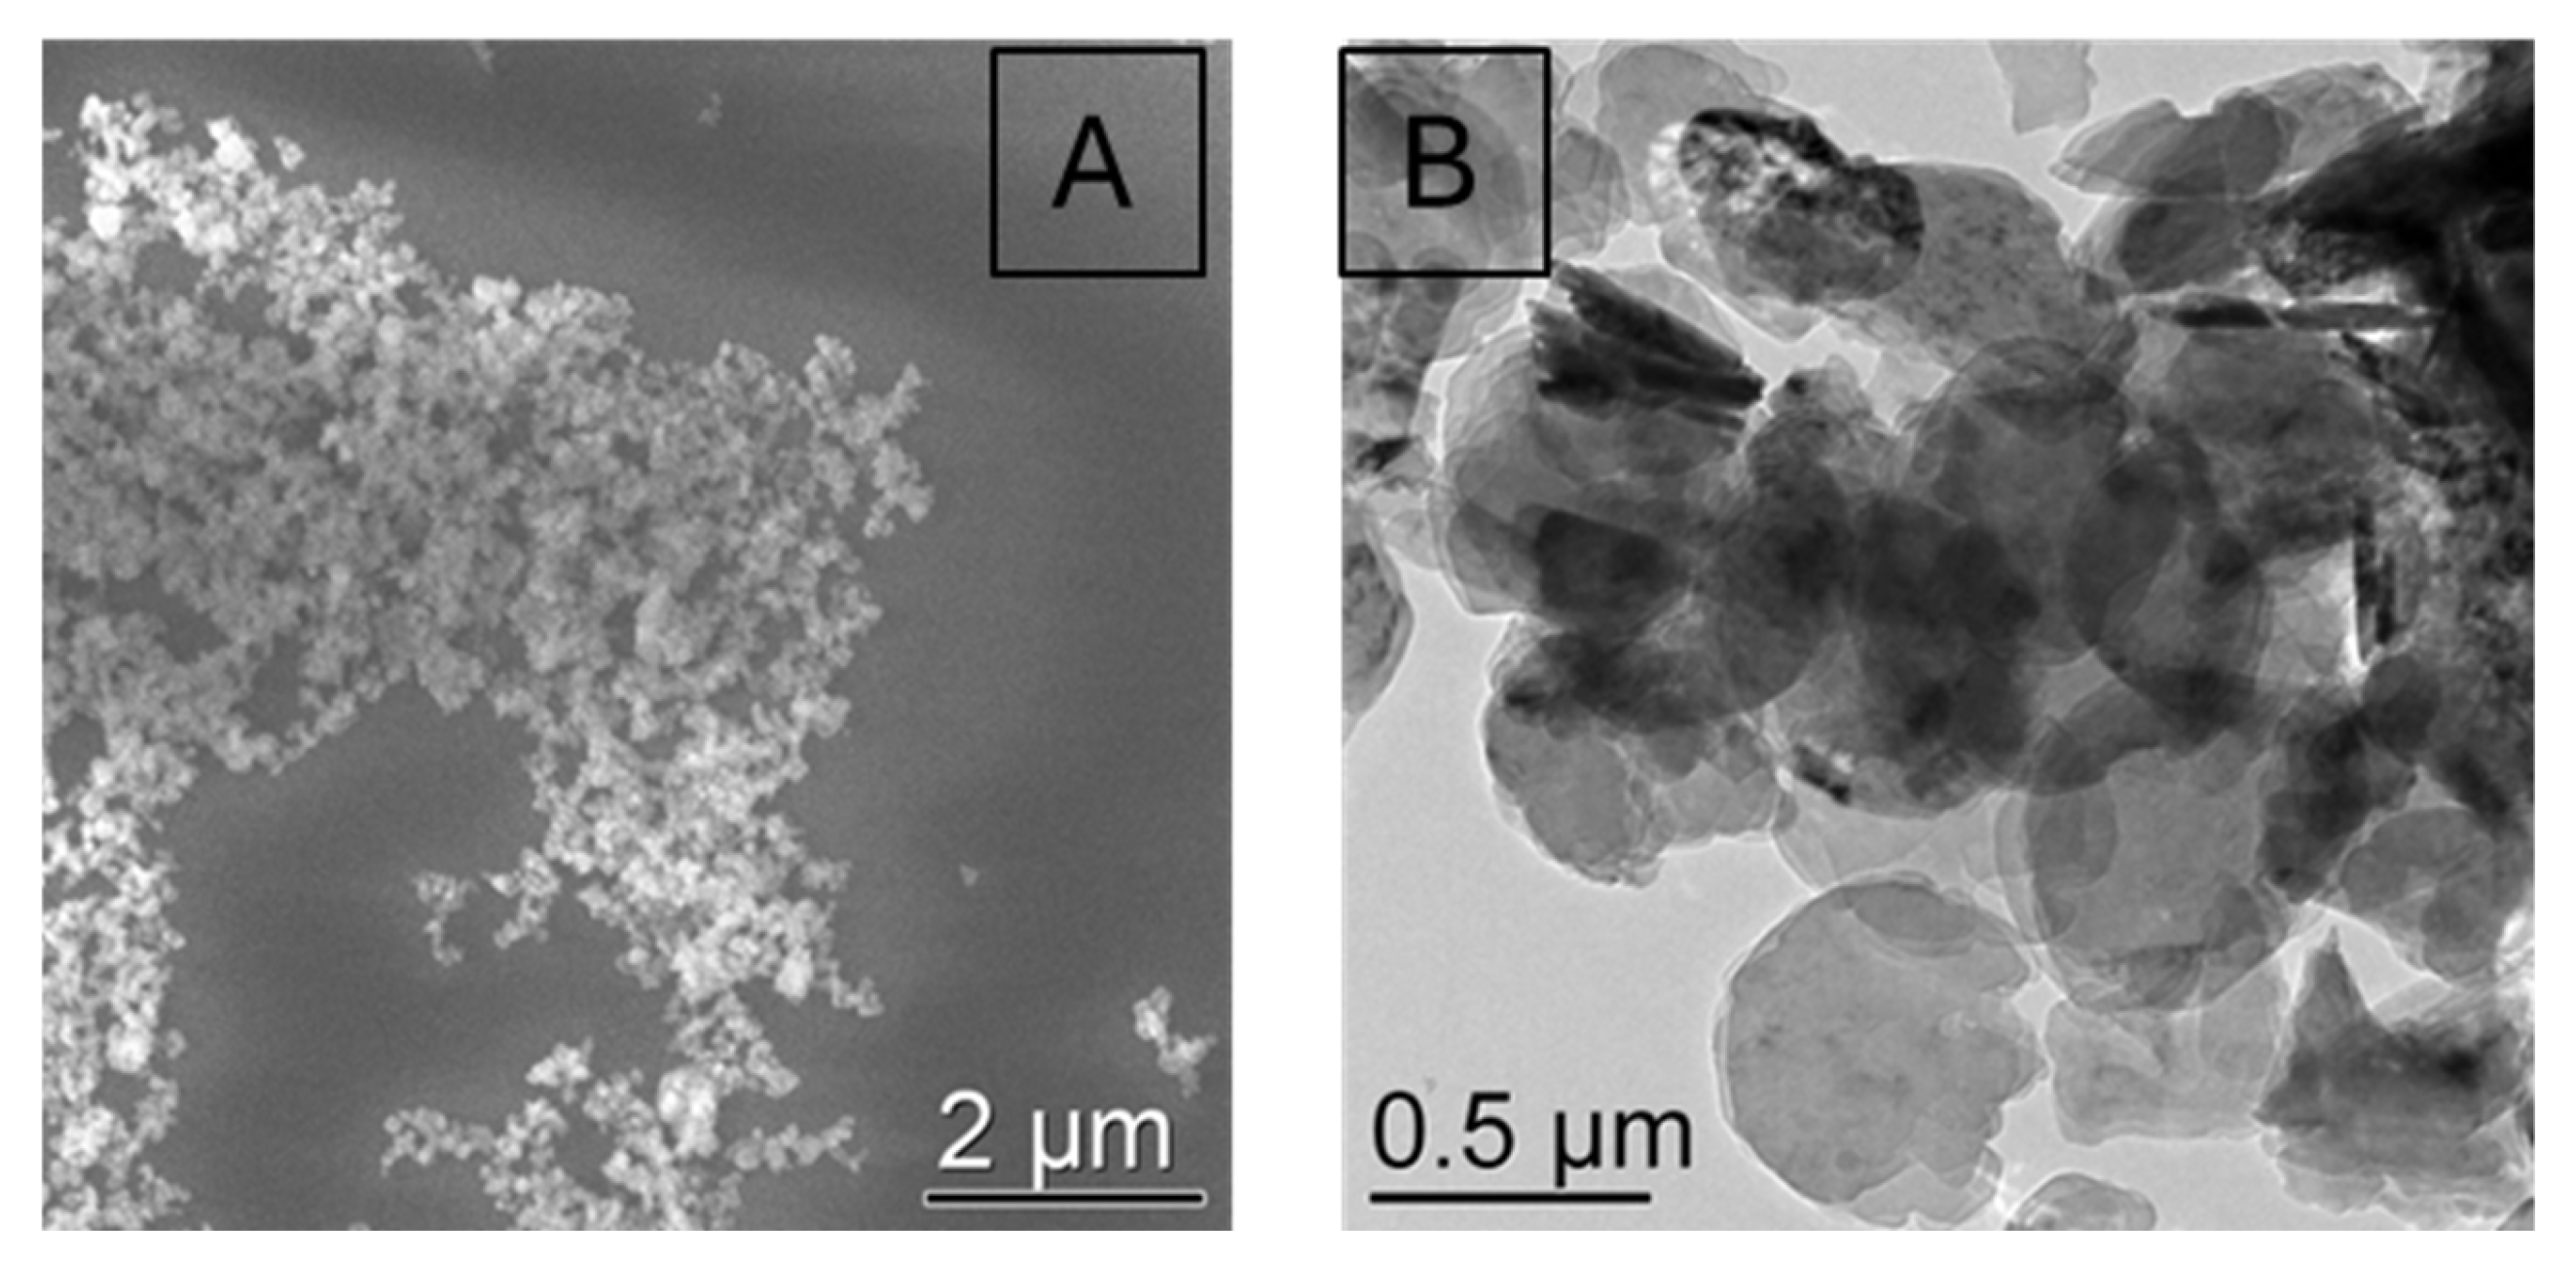
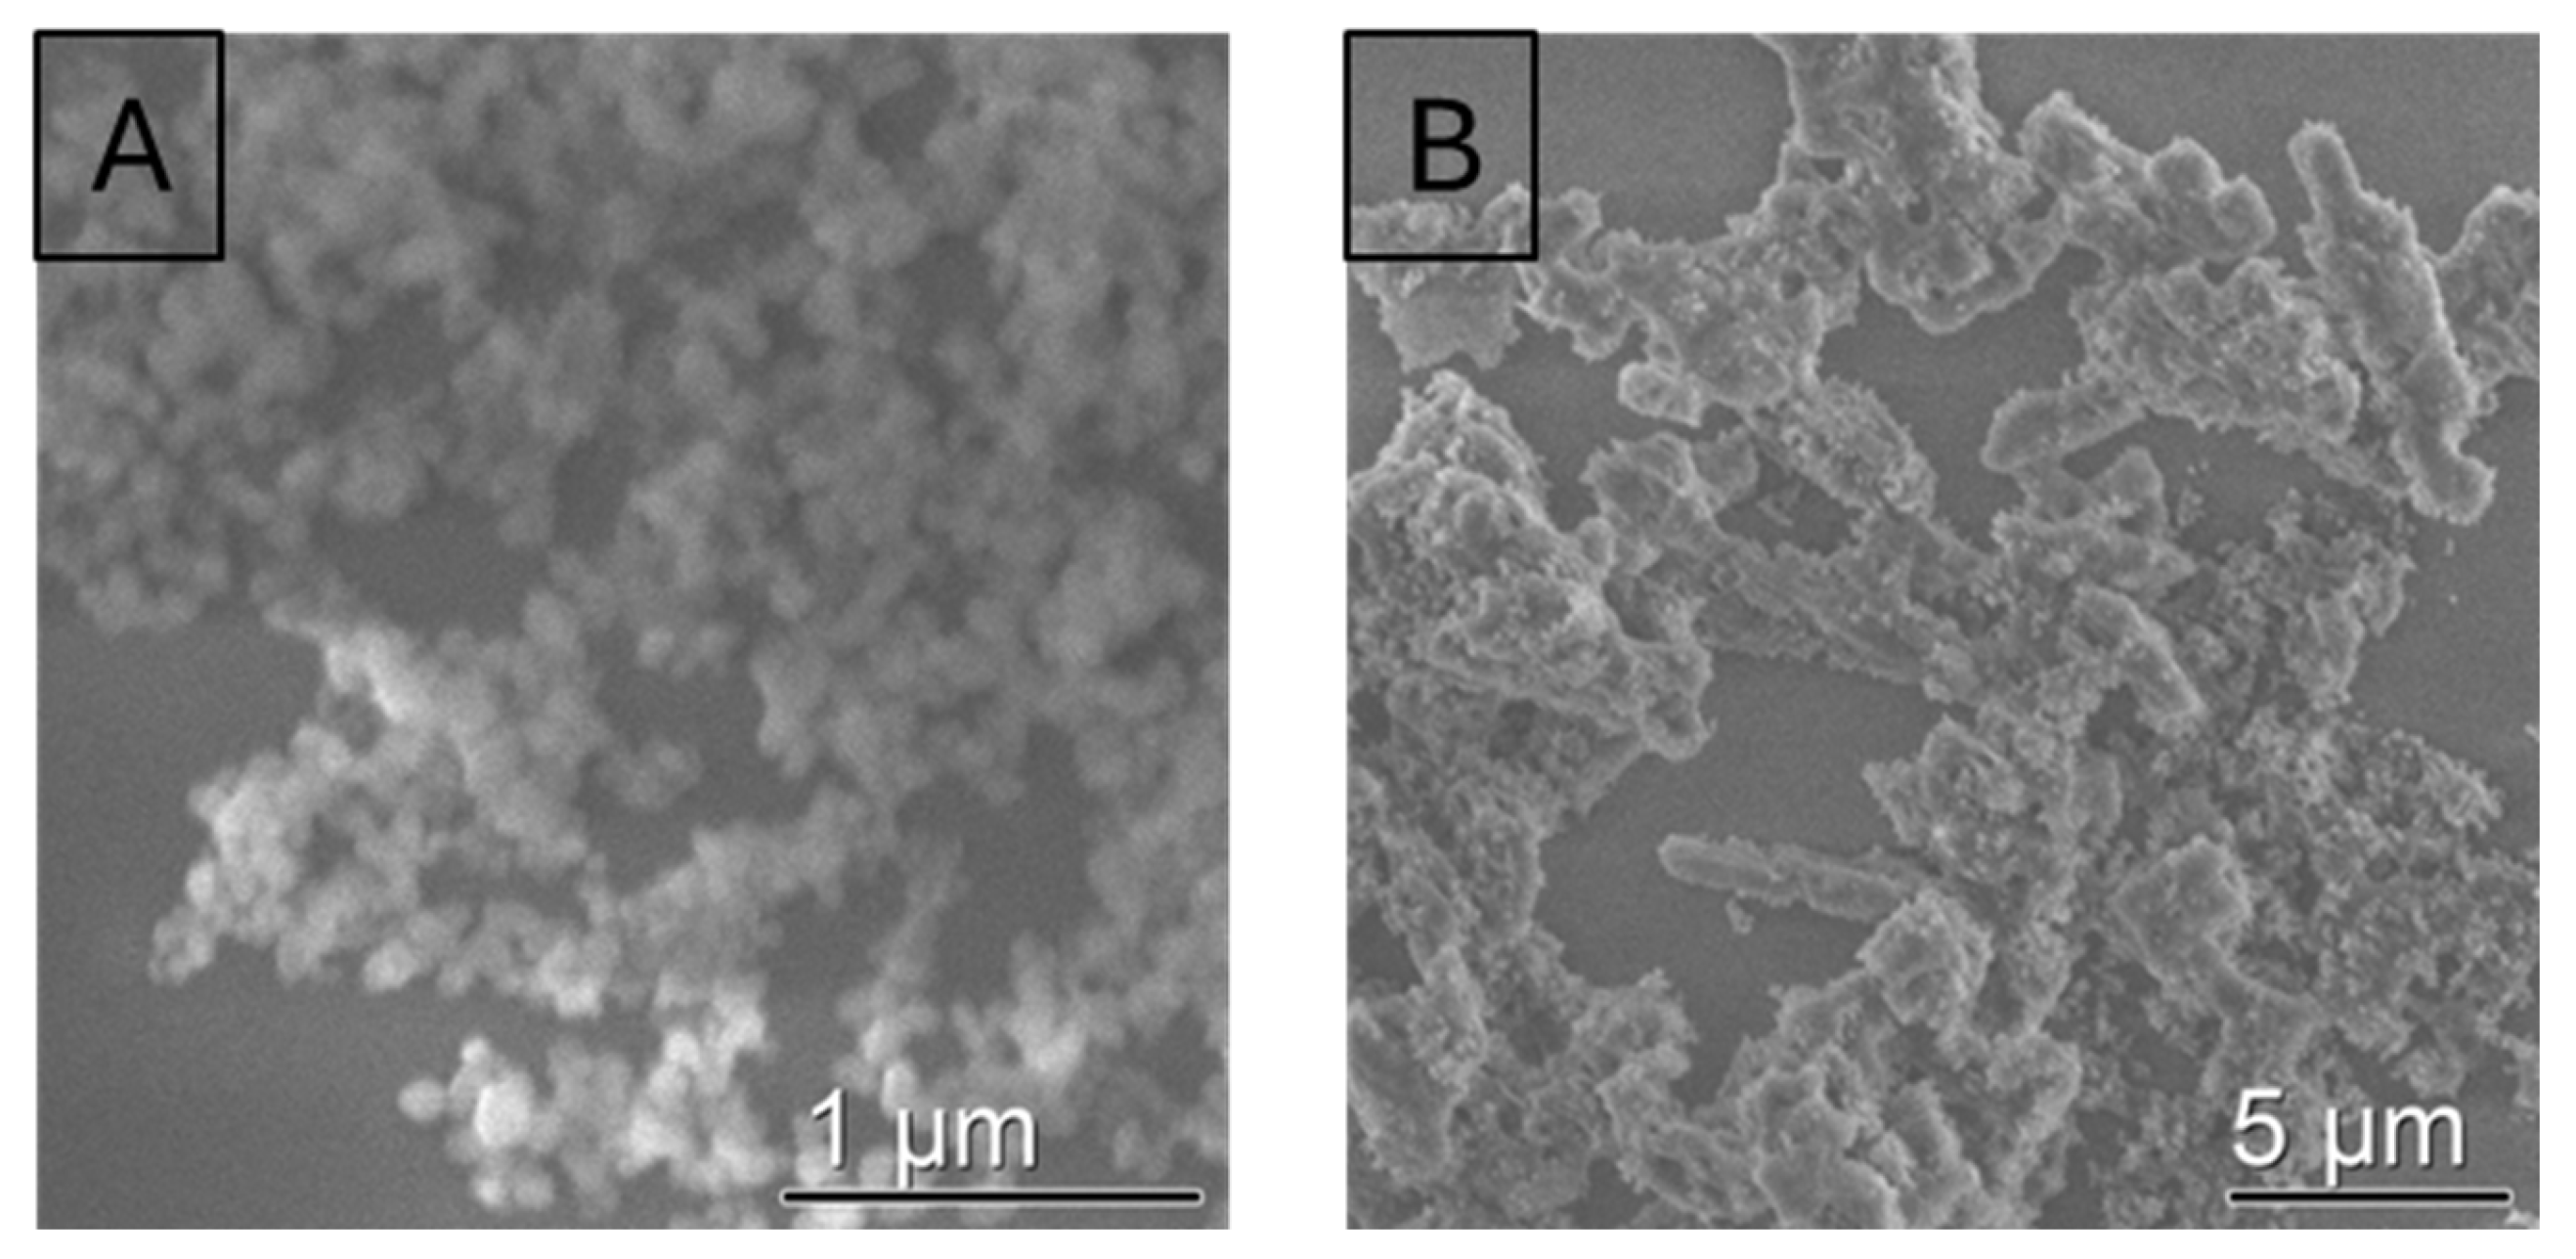
The figure presents complementary electron microscopy images of the baseline MgO sample, providing a direct visual assessment of the nanoparticles’ morphology and agglomeration state inferred from the acoustic spectroscopy data in
Figure 3.
The image from SEM (A) provides a topographical overview of the sample’s surface at a lower magnification. It reveals large, micron-scale, sintered agglomerates with an irregular, rocky morphology. It confirms the existence of the secondary “micro-size” population (~6.1 µm) detected by acoustic spectroscopy, showing that the nanoparticles have fused into much larger, dense clusters.
The micrograph (B) taken by TEM offers a high-resolution, close-up view of the primary particles within those agglomerates. At this higher magnification, the individual MgO nanoparticles are resolved, showing they possess a polyhedral or near-spherical shape with distinct facets, characteristic of the crystalline periclase phase. This image directly corresponds to the primary “nano-size” population (~80 nm) identified in the acoustic data. Furthermore, the TEM clearly shows the points of contact and “necking” between particles, visually explaining the sintering process that leads to the agglomerates seen in the SEM image.
Figure 3 and
Figure 4 together define the core problem (agglomeration) and establish the key metrics for evaluating subsequent experimental variations.
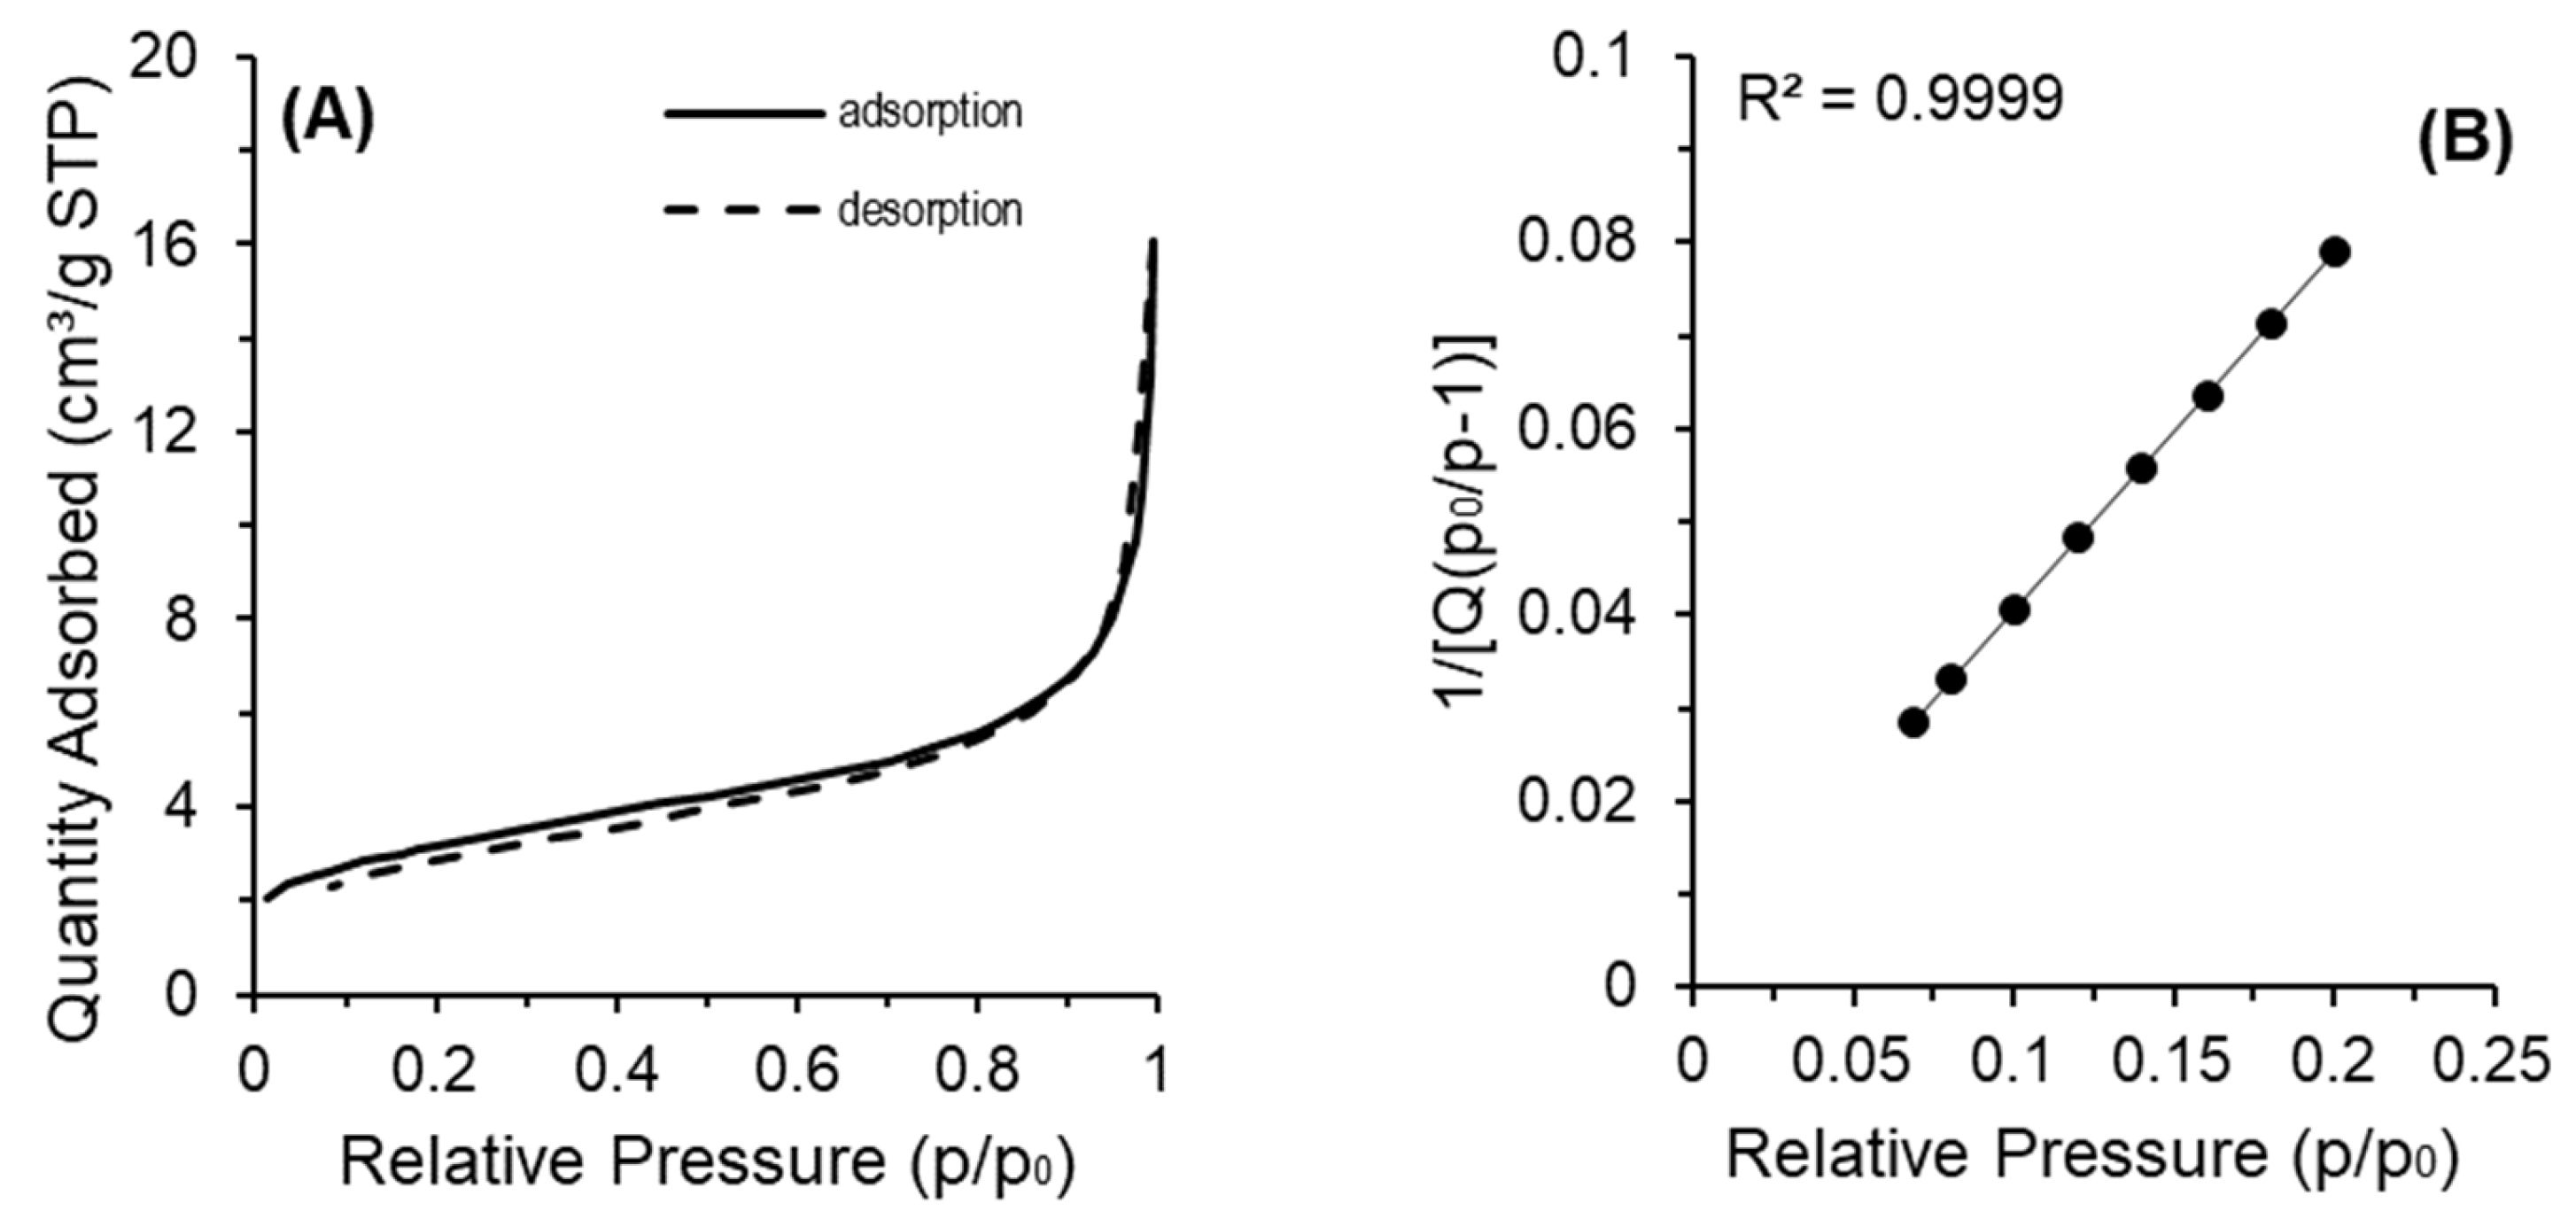
The specific surface area of the reference MgO sample, determined by nitrogen physisorption, was 11.3 m
2/g (BET correlation coefficient 0.99997). For non-porous spherical MgO particles (density 3.58 g/cm
3) with a diameter of 80 nm—the primary crystallite size established by acoustic spectroscopy and confirmed by TEM (
Figure 4B)—the geometric surface area is approximately 21 m
2/g. The lower experimental value is attributed to extensive inter-particle sintering evident in TEM micrographs: sinter necks between adjacent crystallites render part of the surface inaccessible to the adsorbate. The secondary micro-agglomerate population (~6.1 µm, mode 2,
Figure 4A) contributes negligibly to the total surface area owing to its large size. The N
2 adsorption–desorption isotherm (
Figure 5) exhibits type IV character with an H3 hysteresis loop, characteristic of slit-shaped mesopores formed by aggregates of sintered particles, in full agreement with the observed morphology. The t-plot analysis confirmed the essentially non-microporous nature of the material (micropore volume < 0.001 cm
3/g, external surface area 9.4 m
2/g). The small mesopore volume of 0.024 cm
3/g with an average pore width of 8.8 nm (BJH, adsorption branch) corresponds to inter-particle voids within the sintered agglomerates. These textural characteristics provide a quantitative baseline for evaluating the effects of synthesis parameters in the subsequent sections.
The bimodal distribution identified in the baseline sample (
Figure 3 and
Figure 4) revealed significant agglomeration, presenting a primary challenge for achieving a homogeneous nanomaterial. To address this, the role of the polymeric nanoreactor’s structure was investigated.
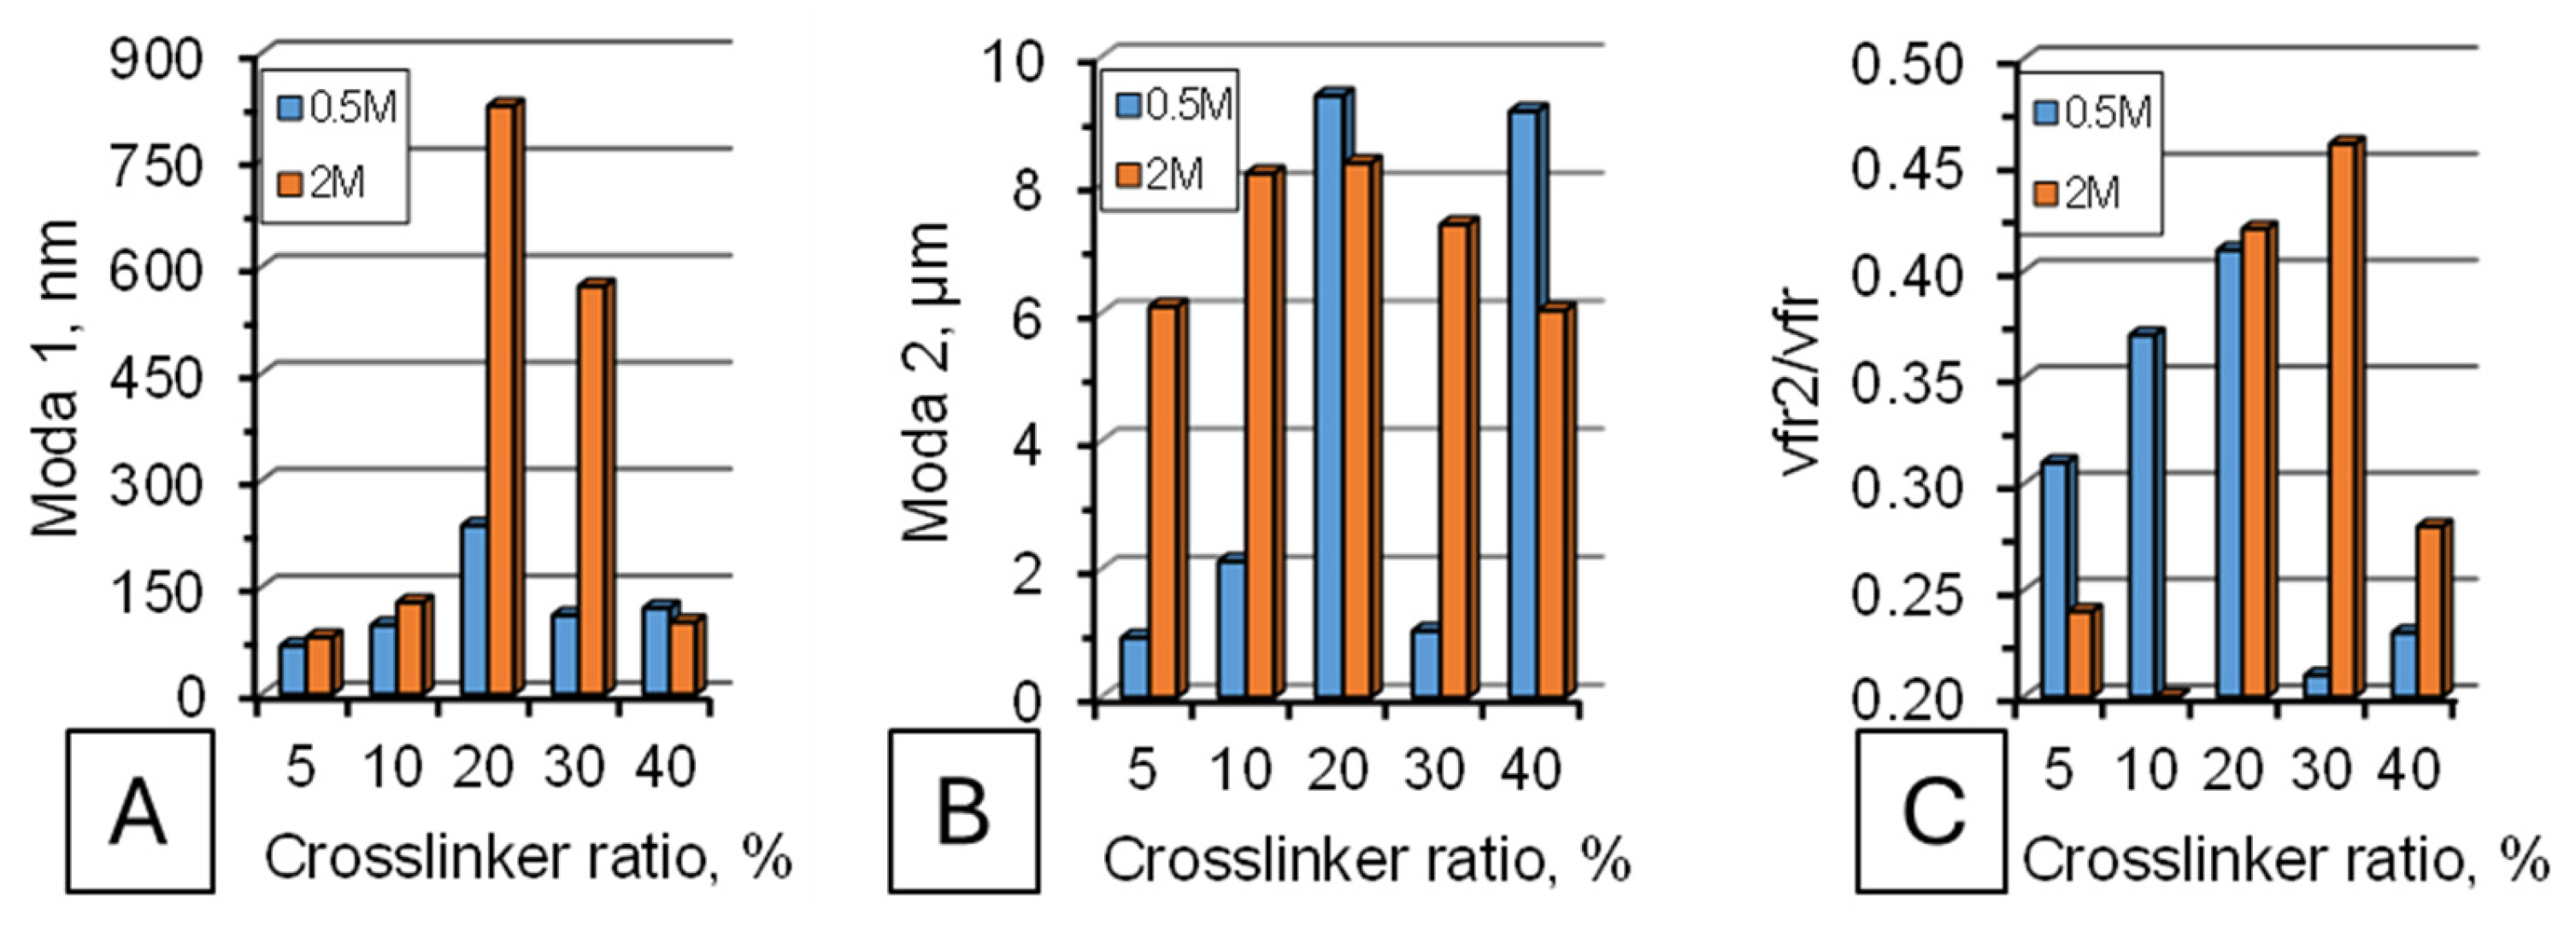
Figure 6 analyzes how the crosslinker ratio, a key determinant of gel pore size and rigidity, impacts this agglomeration.
Figure 6 consists of two sets of three histograms (bar charts), one set for a low precursor concentration (0.5 M) and another set for a high precursor concentration (2 M). For each concentration, three histograms are presented, plotting the following metrics against the crosslinker ratio (from 5% to 40%):
Average Nano-Size (moda 1). The size (in nm) of the primary population of nanoparticles.
Average Micro-Size (moda 2). The size (in µm) of the secondary population of larger, agglomerated particles.
Percentage of Micro-Size. The proportion of particles that are larger than 200 nm (micro-size) compared to the nano-size population.
The data in
Figure 6 reveals a significant and non-linear influence of the crosslinker ratio on both the average size and the size distribution (homogeneity) of the MgO nanoparticles.
At both low (0.5 M) and high (2 M) precursor concentrations, the average size of the nanoparticles does not change monotonically with the crosslinker ratio. Instead, it shows a clear maximum in the intermediate range (20–30% crosslinker).
This indicates that a moderately crosslinked polymer network (not too loose and not too tight) creates an environment that is optimal for the growth of larger nanocrystals within the gel’s “nanoreactors.”
The most striking result is the dramatic increase in the percentage of micro-size particles at the 20–30% crosslinker ratio. This trend is especially pronounced at the higher precursor concentration (2 M), where the problem of agglomeration is exacerbated.
This means that while the primary nanoparticles are at their largest at this ratio, the sample is also at its least homogeneous. A significant portion of the material has agglomerated into much larger microparticles.
This behavior is a direct consequence of the changing polymeric cell volume and crosslinking density within the gel:
At low crosslinker ratios (5%), the loose network provides less confinement, allowing nanoparticles to sinter together during calcination. At intermediate ratios (20–30%), the moderate crosslinking density creates an environment optimal for the growth of larger nanocrystals, but the forming particles are close enough to easily agglomerate. At high crosslinker ratios (40%), the rigid and dense network with small cell volumes highly confines the metal cations, leading to numerous nucleation sites, smaller primary nanoparticles, and a more homogeneous sample with reduced agglomeration.
In summary,
Figure 6 demonstrates a critical trade-off in the synthesis: optimizing for larger individual nanocrystals (at ~20–30% crosslinker) comes at the cost of severe agglomeration and poor sample homogeneity. Conversely, optimizing for a homogeneous sample of small, discrete nanoparticles requires a highly crosslinked gel (40%), which strongly limits crystal growth. Precursor concentration amplifies these effects, with higher concentrations promoting more agglomeration across all conditions.
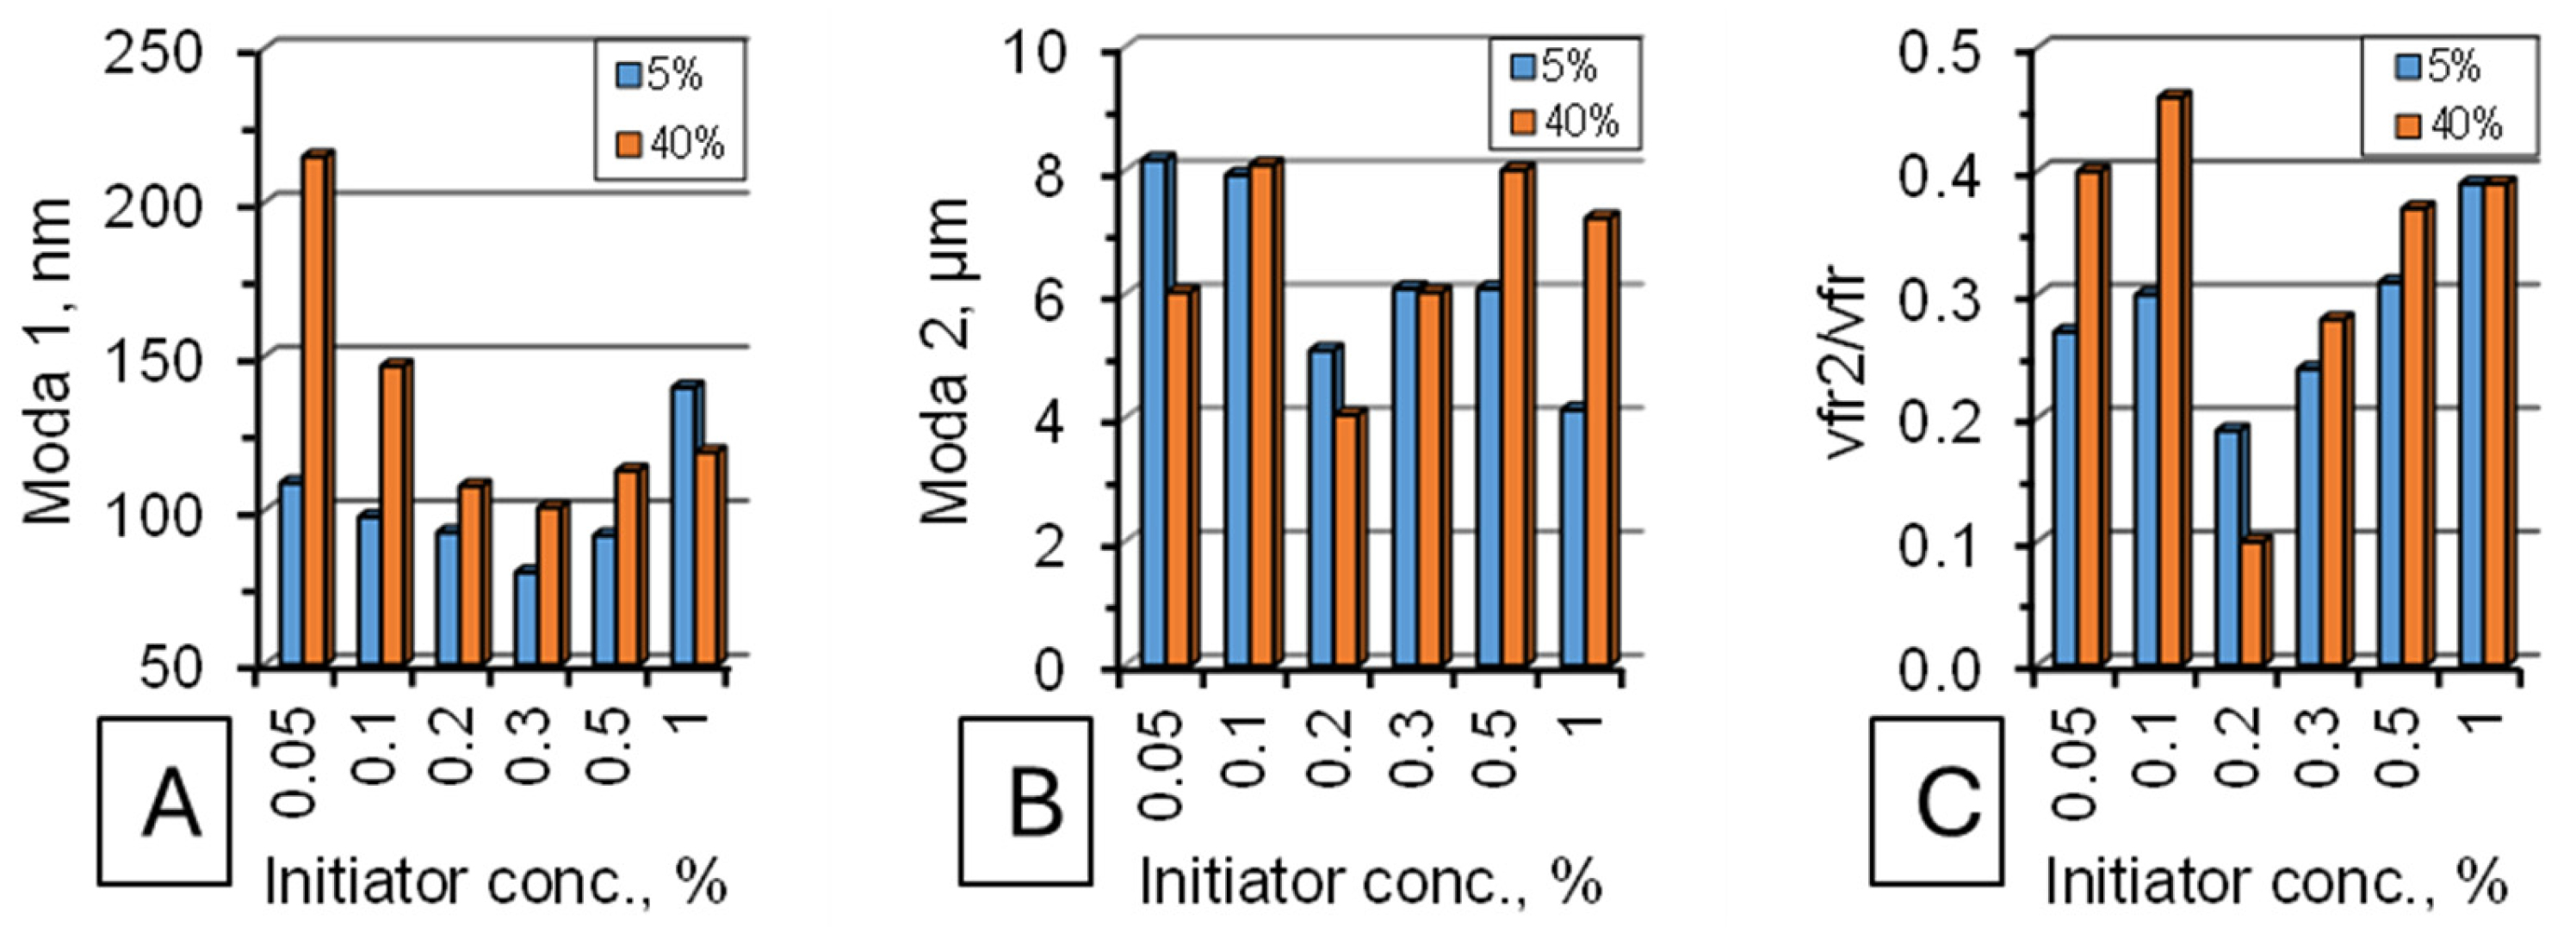
For a complete analysis of the effect of the polymeric cell volume we analyzed the same parameters according to the initiator concentration. The results of the analyses are described in the following diagrams in
Figure 7.
Like
Figure 6, this figure consists of two sets of three histograms (bar charts). One set is for a low crosslinker ratio (5%) and the other for a high crosslinker ratio (40%). For each crosslinker condition, three histograms plot the following metrics against the initiator (APS) concentration (from 0.05% to 1% wt.).
The data in
Figure 7 reveals that the initiator (APS) concentration has a significant and non-linear impact on the size and homogeneity of the MgO nanoparticles, and this impact is further modulated by the crosslinker ratio.
A clear minimum in the average nano-size is observed at the intermediate initiator concentration range of 0.2–0.3% wt., particularly evident at the high crosslinker ratio (40%). This indicates that this specific initiator concentration is optimal for producing the smallest primary nanoparticles.
At the low crosslinker ratio (5%), the average nano-size is generally larger and remains more stable across different initiator concentrations, except for a significant increase at the lowest initiator concentration (0.05% wt.)
The most important finding is the minimum in the percentage of micro-sized particles at 0.2% wt. initiator concentration. This trend is consistent for both crosslinker ratios, indicating that this parameter is ideal for minimizing agglomeration and producing the most homogeneous sample.
This behavior is a direct consequence of the role the initiator plays in defining the architecture of the polymer network.
At low initiator concentration (0.05 wt.%), fewer free radicals result in longer polymer chains and a looser, less crosslinked gel, allowing greater crystal growth and easier agglomeration. At high initiator concentration (1 wt.%), an overabundance of free radicals leads to very short chains and an extremely dense gel network, where the vast number of closely packed nanoparticles are highly susceptible to sintering upon gel combustion during calcination.
In summary,
Figure 7 demonstrates that the initiator concentration is a critical parameter for optimizing homogeneity. The key finding is that an initiator concentration of 0.2% wt. is the optimal value for minimizing agglomeration (lowest % micro-size), producing the most homogeneous sample. This effect is strongest within a rigid gel matrix (high crosslinker ratio), which also enables the production of the smallest primary nanoparticles at this initiator concentration.
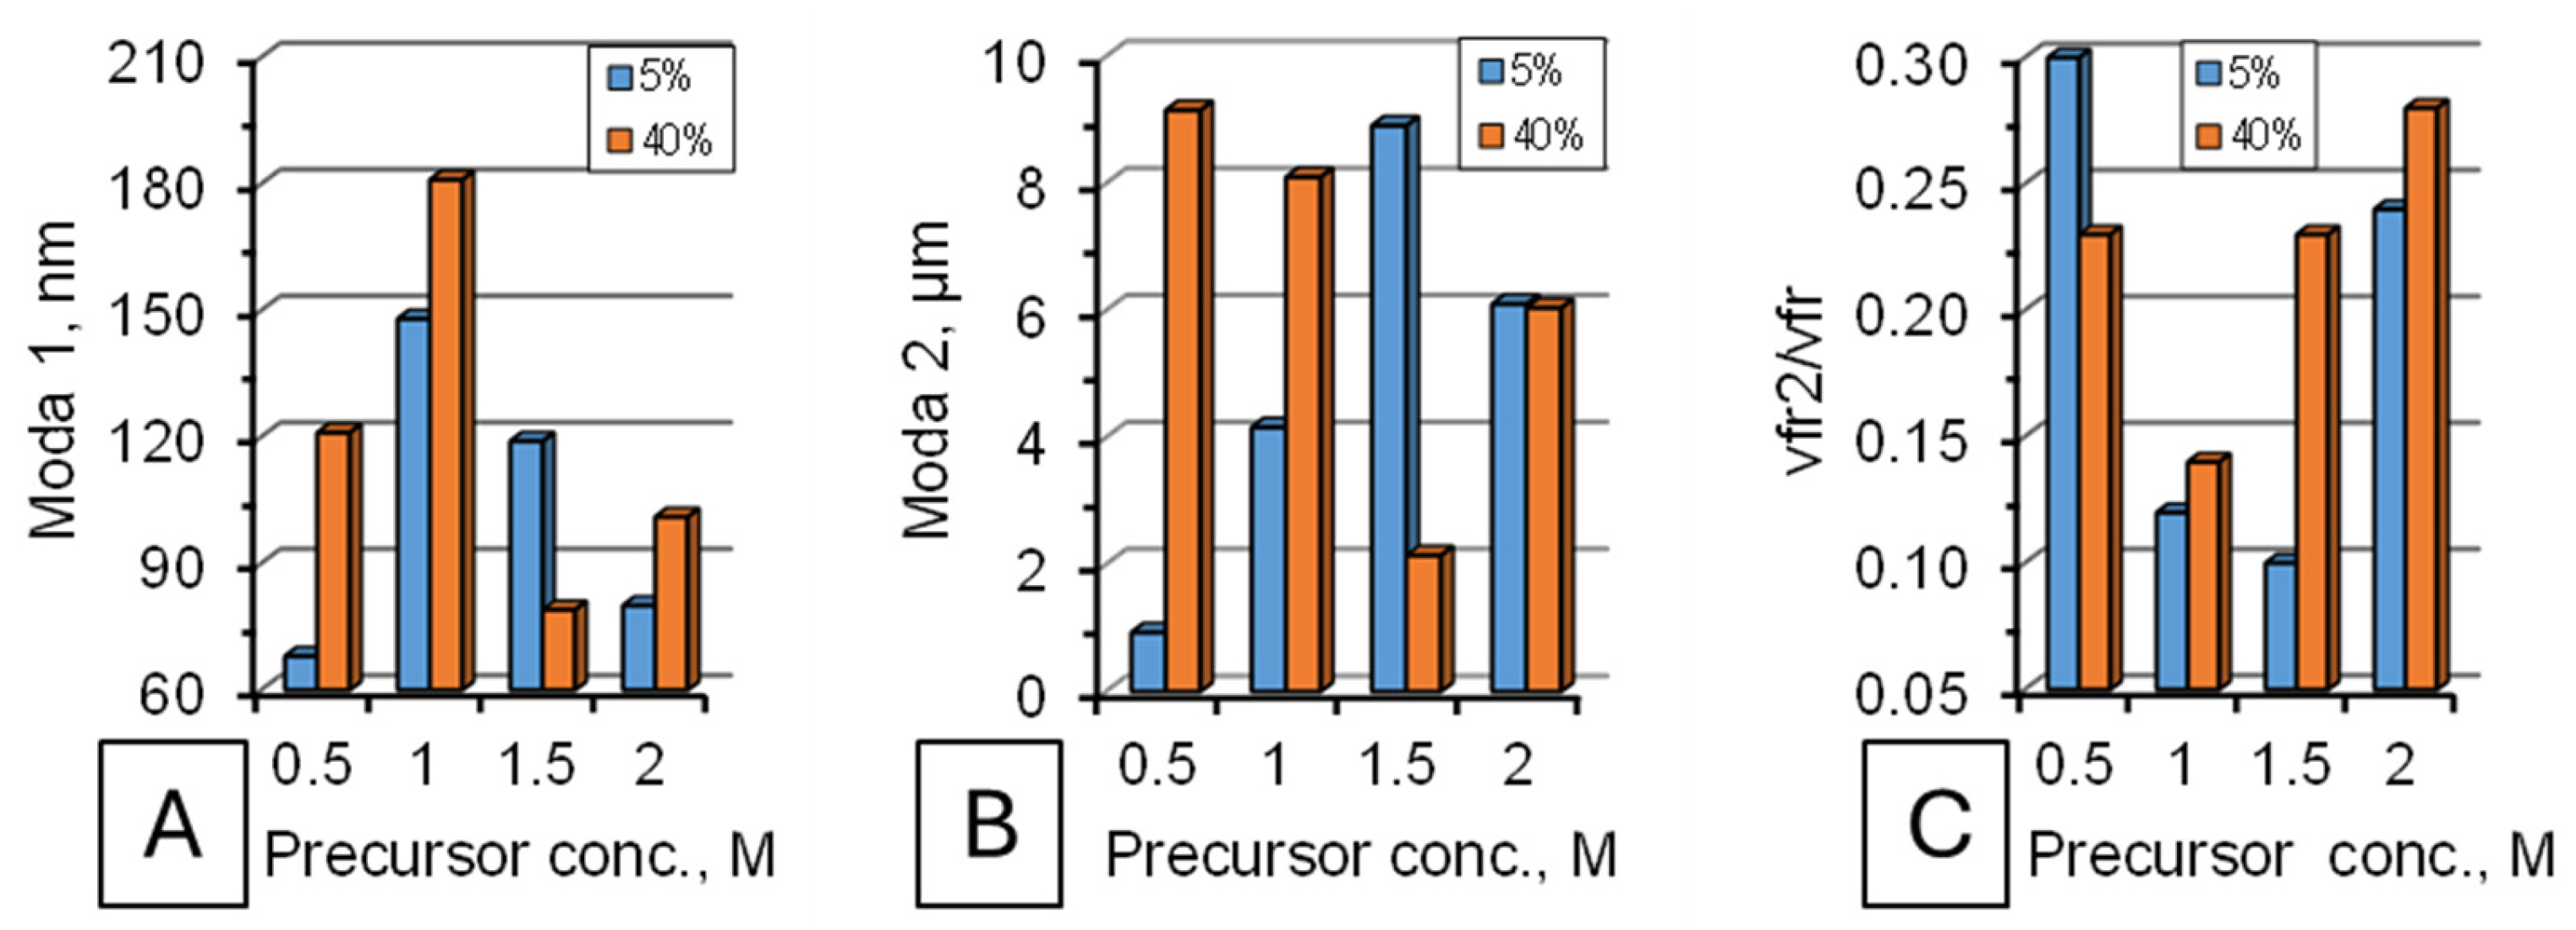
Figure 8 is structured similarly to the previous ones; it reveals that precursor concentration is a primary driver of both nanoparticle size and, most importantly, the degree of agglomeration.
The average size of the primary nanoparticles shows a complex, non-linear relationship with concentration, thus a minimum in nano-size is observed at the extreme concentrations (0.5 M and 2 M), meaning the primary particles are smallest at the lowest and highest loadings.
The percentage of micro-sized particles is minimized at moderate precursor concentrations (1.0–1.5 M). This indicates that these concentrations produce the most homogeneous samples with the least agglomeration.
A low ion distribution in the gel network leads to a low density of nucleation sites during calcination. While the resulting primary particles can be small due to limited growth material, the large distances between them minimize sintering, resulting in moderate agglomeration.
An overloaded gel creates an extremely high density of nucleation sites and crystals forming. During calcination, as the polymer burns away, these numerous nanoparticles are packed so closely together that they inevitably sinter and fuse into massive agglomerates (microparticles). This explains the paradox of small primary nano-size (moda 1) but catastrophic agglomeration (high % micro-size) at 2 M. The rigid, high-crosslinker gel (40%) exacerbates this by trapping more precursors, making the problem even worse.
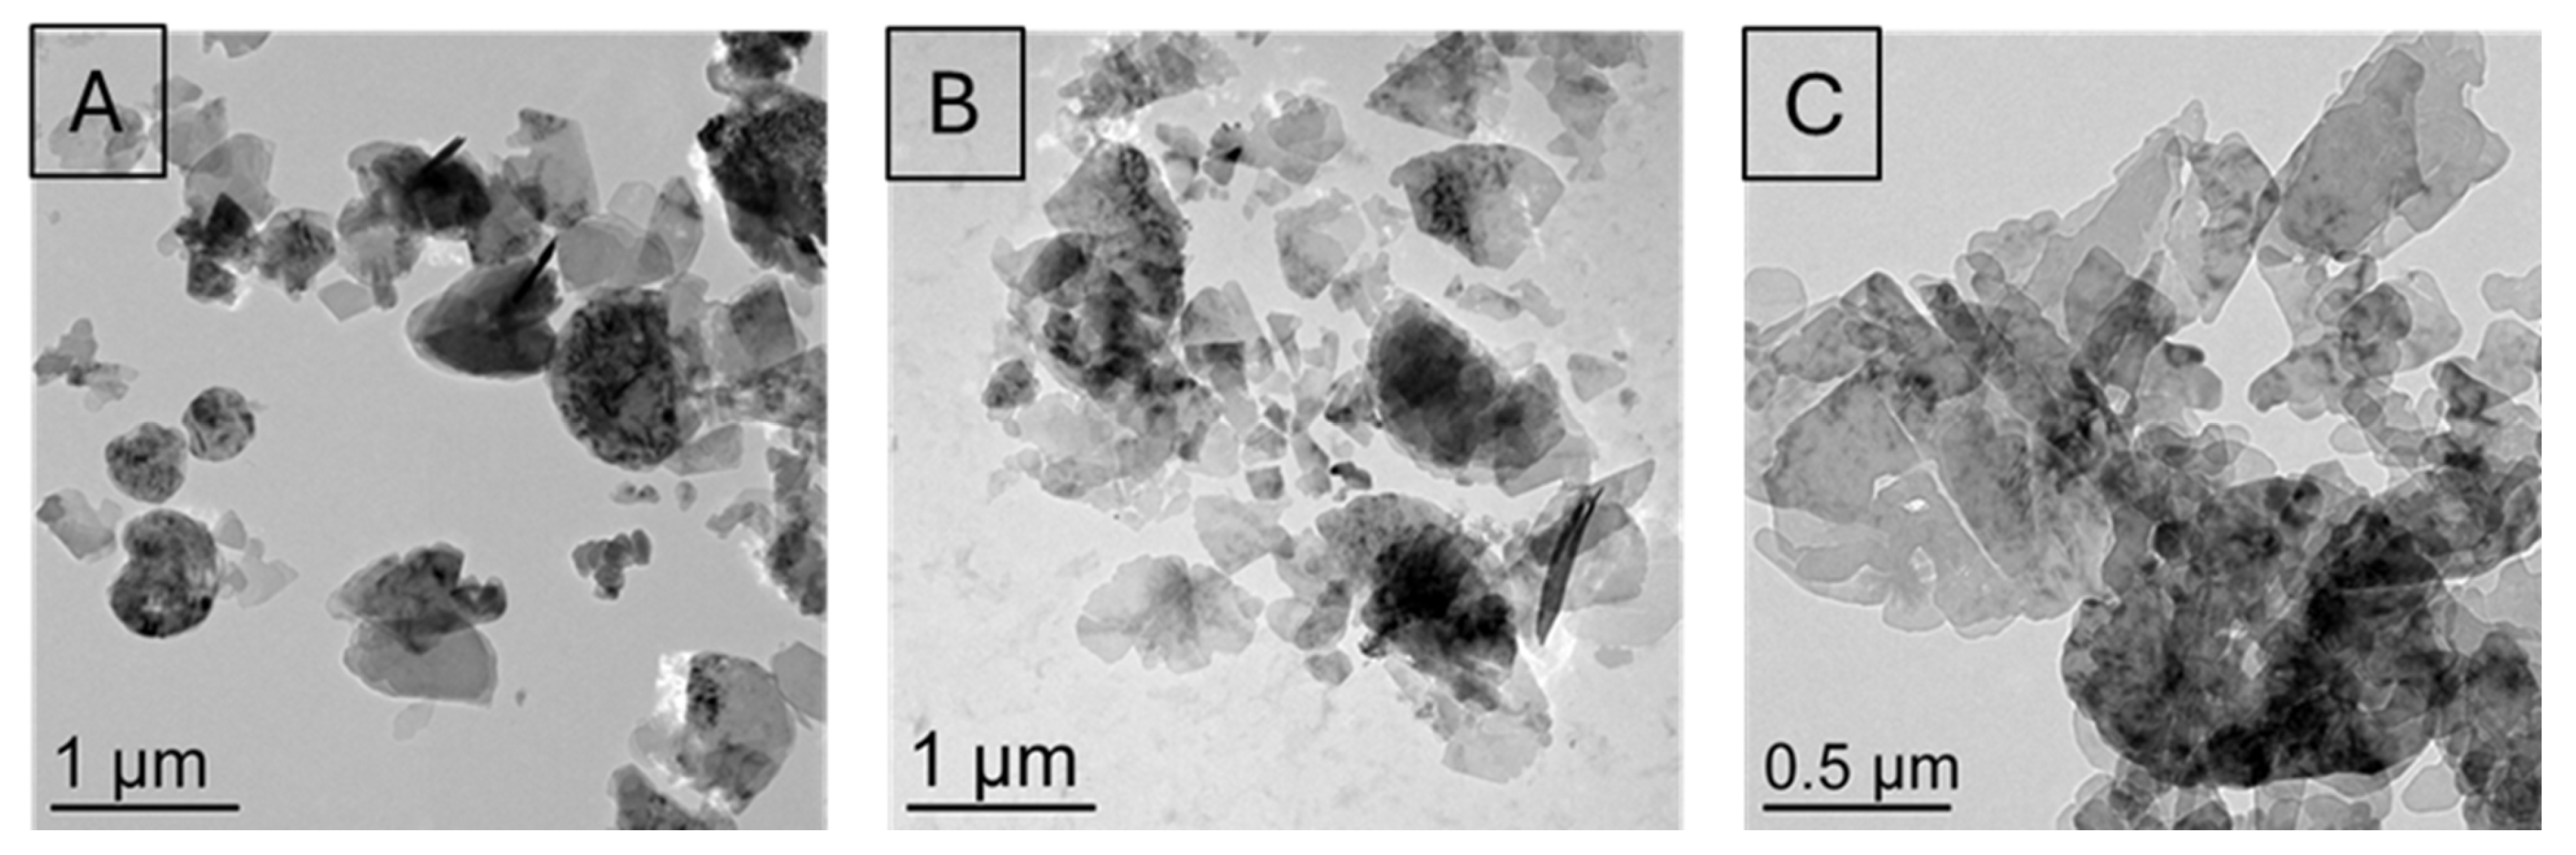
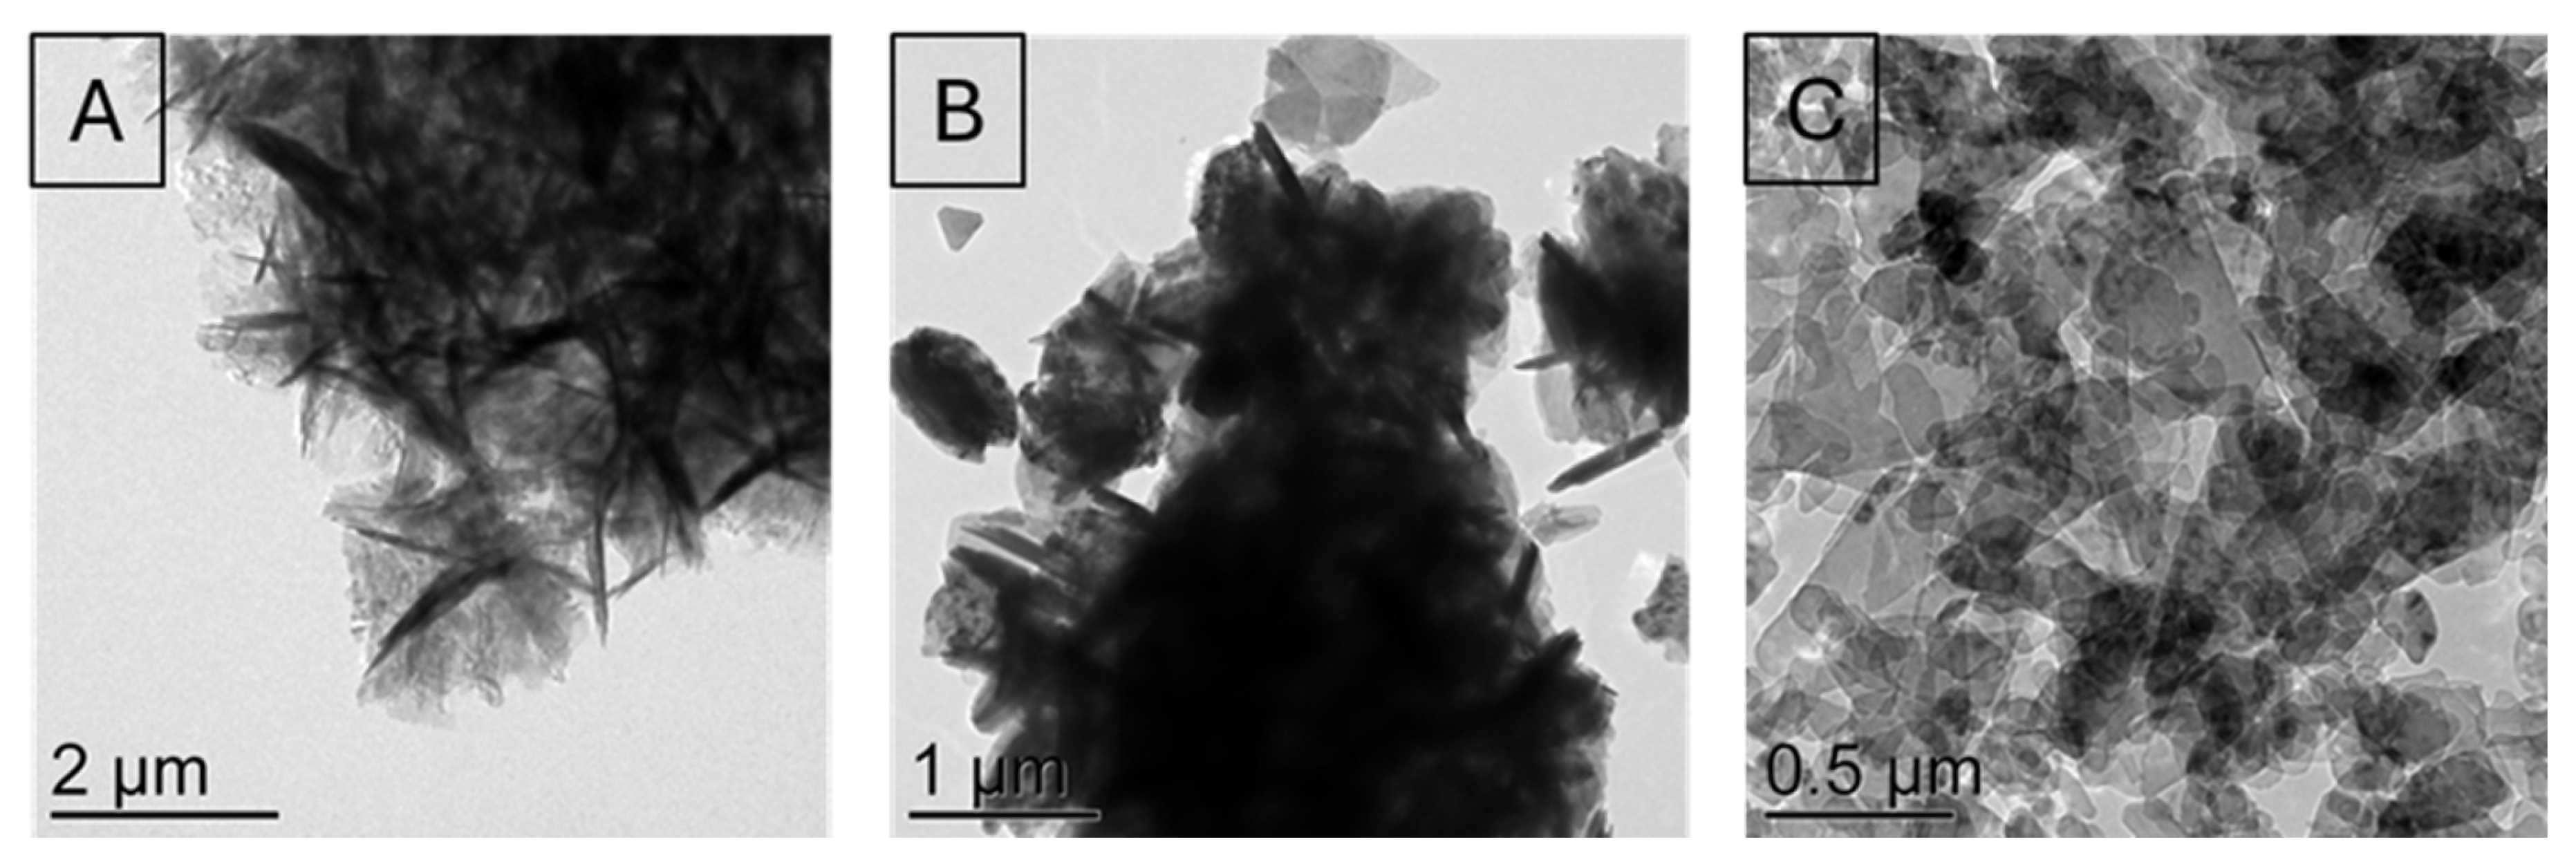
The TEM images in
Figure 9 provide direct visual evidence that supports the complex, non-linear relationship between precursor concentration and nanoparticle morphology previously inferred from acoustic spectrometer data.
The primary particles across all three samples exhibit a characteristic irregular, near-spherical morphology, consistent with the crystal habit of periclase-phase MgO. This shared morphology suggests that the fundamental crystal structure and growth mechanics are not fundamentally altered by the precursor concentration. The defining difference between the samples is not the shape of the individual units, but their spatial arrangement and degree of connectivity.
At low precursor concentration micrograph (A), the scarcity of Mg2+ precursor ions within the vast polymer network results in a low density of nucleation sites. While the large “cells” of the gel could theoretically allow for significant crystal growth, the limited amount of available material restricts the growth process. The forming nanoparticles consume the sparse precursor, resulting in a final population of crystals that are small due to resource limitation. The moderate agglomeration occurs because the few particles that form are still able to move and sinter slightly within the large polymeric pores during calcination.
The gel is highly overloaded with precursor at this concentration micrograph (C). During calcination, this forces a vast number of simultaneous nucleation events to occur in very close proximity. The polymeric nanoreactor becomes packed with nascent crystals, and with so many nuclei competing for the available space and material, the growth of each individual crystal is severely restricted by spatial confinement. This results in the formation of very small primary crystallites. However, as the polymer burns away, these countless tiny, high-energy particles are instantly in intimate contact and undergo rapid, extensive sintering, fusing into the large, dense agglomerates observed in the image.
In summary, the precursor concentration primarily controls the degree of agglomeration and sintering by determining the initial spatial density of nucleation sites within the gel, rather than directing a change in the intrinsic crystal shape of the resulting MgO.
The above results establish a quantitative relationship between gel crosslinking density and particle size distribution. Increasing the crosslinker ratio from 5 to 40% at 0.5 M precursor loading reduced the primary nanoparticle size from ~95 to ~55 nm and decreased the micro-agglomerate fraction from ~25% to ~5%, corresponding to a fivefold improvement in homogeneity. At high precursor loading (2 M), the same trend persisted but with elevated agglomeration levels (~60% to ~35%), demonstrating the superimposed effect of precursor concentration. For the initiator, a distinct minimum in both primary particle size (~30–40 nm) and micro-agglomerate fraction (~5%) was observed at 0.2 wt.% APS under high crosslinking (40%), with deviations to lower or higher APS concentrations causing a twofold or greater increase in both parameters. Thus, the combination of 40% crosslinker and 0.2% initiator constitutes the optimum for minimizing particle size and agglomeration, providing a predictive quantitative basis for tuning the size distribution via gel formulation.
In conclusion, this systematic investigation into the effects of the polymeric cell volume and precursor loading has established their critical and interconnected roles in governing the properties of MgO nanoparticles synthesized via the polyacrylamide gel route. The crosslinker ratio and initiator concentration were identified as primary levers controlling the architecture of the polymeric nanoreactor, directly influencing nanoparticle size and agglomeration by modulating nucleation density and spatial confinement. A clear trade-off was observed: intermediate crosslinker ratios (~20–30%) promoted the growth of larger primary nanocrystals but at the cost of severe agglomeration, while a high ratio (40%) and an optimal initiator concentration (0.2% APS) were essential for producing a homogeneous sample of small, discrete nanoparticles.
Simultaneously, the precursor loading fraction was revealed as a dominant factor, with high concentrations (>1.5 M) inevitably leading to catastrophic sintering and the formation of micro-sized agglomerates, despite yielding small primary crystallites due to confined nucleation. A moderate concentration (1.0–1.5 M) was found to be optimal for achieving a well-dispersed population of nanoparticles.
The acoustic spectroscopy data provided the most sensitive measure for evaluating the impact of the polymeric synthesis parameters on particle size distribution and homogeneity, while the dispersion stability profiles for these parameters were largely consistent and are discussed in subsequent sections.
3.2. Effect of Parameters of Calcination (Temperature, Time and Heating Rate)
The calcination process is the critical stage in the polyacrylamide gel route where the precursor-loaded polymer matrix is transformed into the desired metal oxide. This thermal treatment must achieve the simultaneous complete combustion of the organic polymer framework and the thermal decomposition of the metal precursor into a pure, crystalline oxide [
11,
23]. For the sulfate-based precursor (MgSO
4) used in this study, selected to mitigate the explosion risks associated with nitrates during scaling [
25,
38], this decomposition is particularly challenging and energy-intensive, often requiring higher temperatures than nitrate counterparts [
10,
21].
The calcination parameters (maximum temperature, dwell time, and heating rate) exert fundamental kinetic and thermodynamic control over the chemical reaction and the subsequent nucleation and growth of MgO crystals [
16]. Their choice directly dictates the chemical purity, crystallinity, particle size, and morphology of the final product [
11,
16,
45], which in turn governs functional performance in applications such as adsorption [
12] or antimicrobial action [
3,
5].
To evaluate these effects comprehensively, we employed two complementary analytical techniques:
X-ray fluorescence (XRF) to quantify the bulk elemental composition (Mg and S) and thus the chemical purity.
X-ray diffraction (XRD) to identify the crystalline phases present and follow the evolution of MgSO4 decomposition and MgO crystallinity according to the temperature of calcination.
As established in
Section 3.1, the polymeric network successfully templates the precursor. However, the efficacy of this templating is ultimately realized during calcination. This section investigates the individual and combined effects of the thermal parameters, focusing on overcoming the decomposition challenges of the sulfate anion. We first present the paramount factor of chemical purity, as governed by the completion of the MgSO
4 decomposition reaction, quantified by XRF (
Table 4). Subsequently, the structural evolution from residual MgSO
4 to crystalline MgO is elucidated by XRD (
Figure 10), revealing that even when XRF shows significant residual sulfur, the crystalline sulfate may have already disappeared, indicating the presence of amorphous intermediates.
The XRF data reveal a strong positive correlation between calcination temperature and the normalized Mg mass fraction. The measured Mg mass fraction increases markedly from ~40% at 650 °C to ~80% at 850 °C.
The most pronounced increase in Mg mass fraction occurs between 750 °C (~62%) and 800 °C (~78%), indicating that this is the critical temperature range for near-complete decomposition of the sulfate precursor.
The chemical purity trends derived from XRF (
Table 4) are directly reflected in the structural evolution observed by X-ray diffraction.
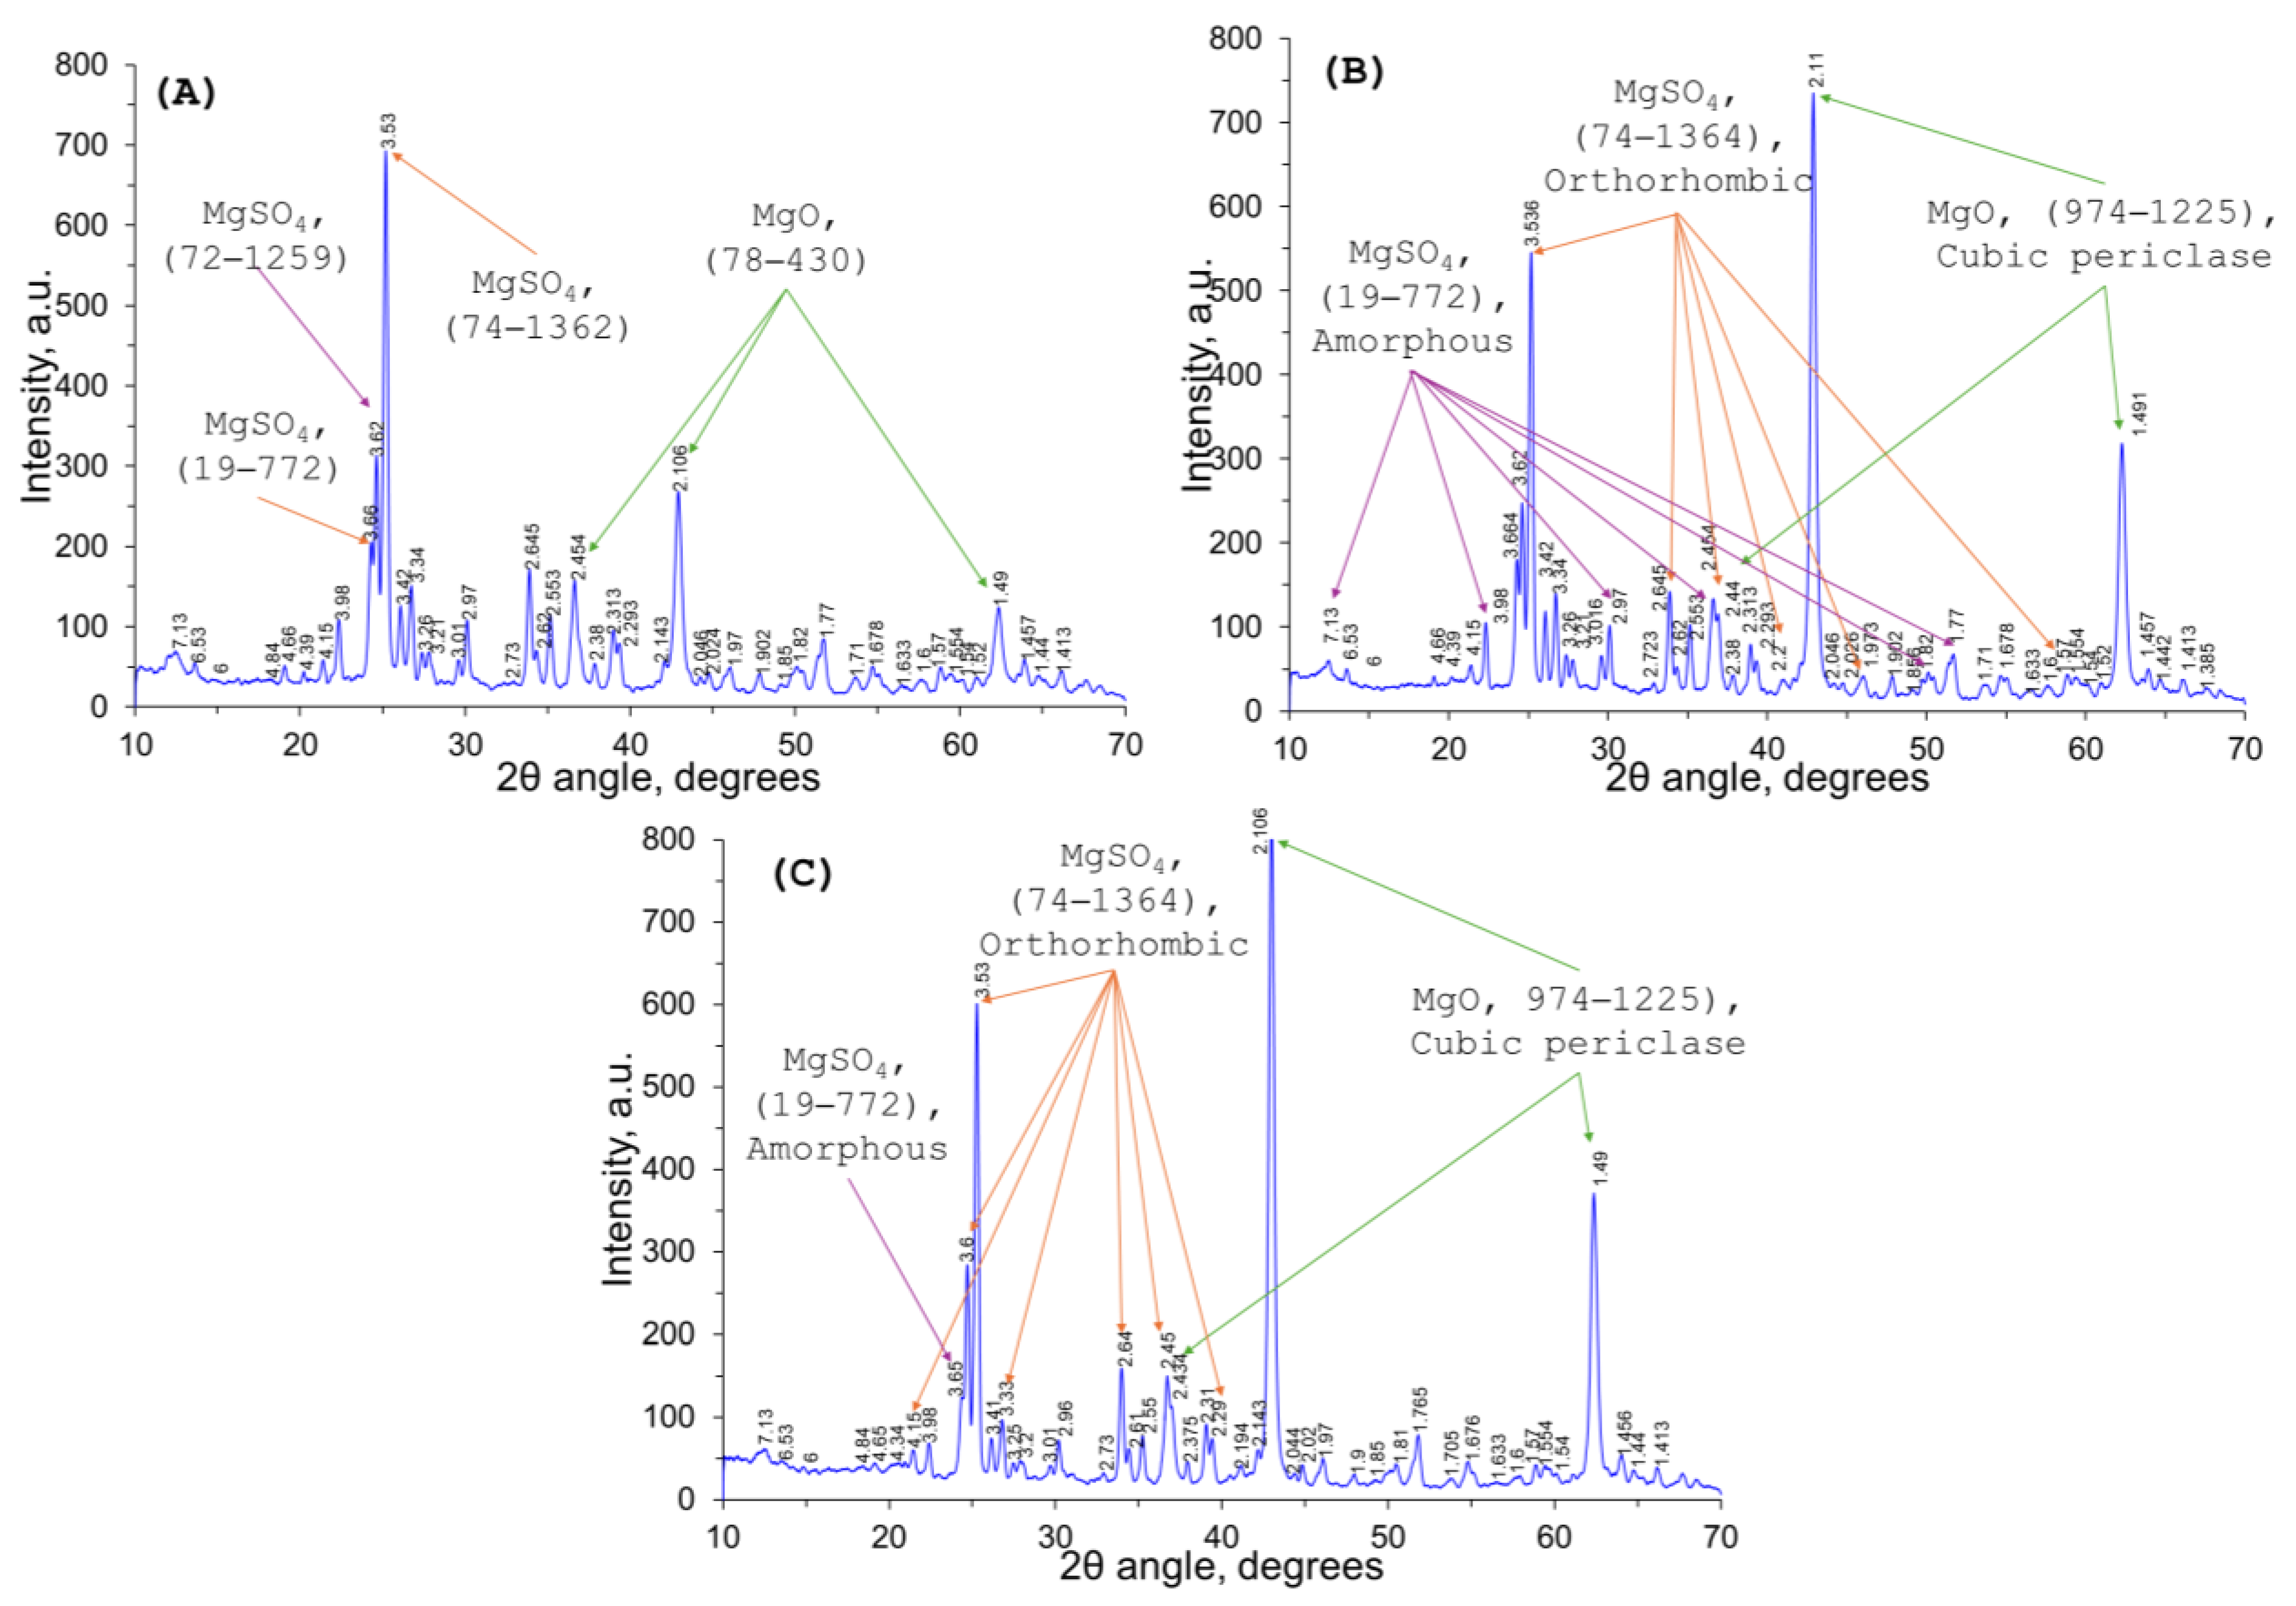
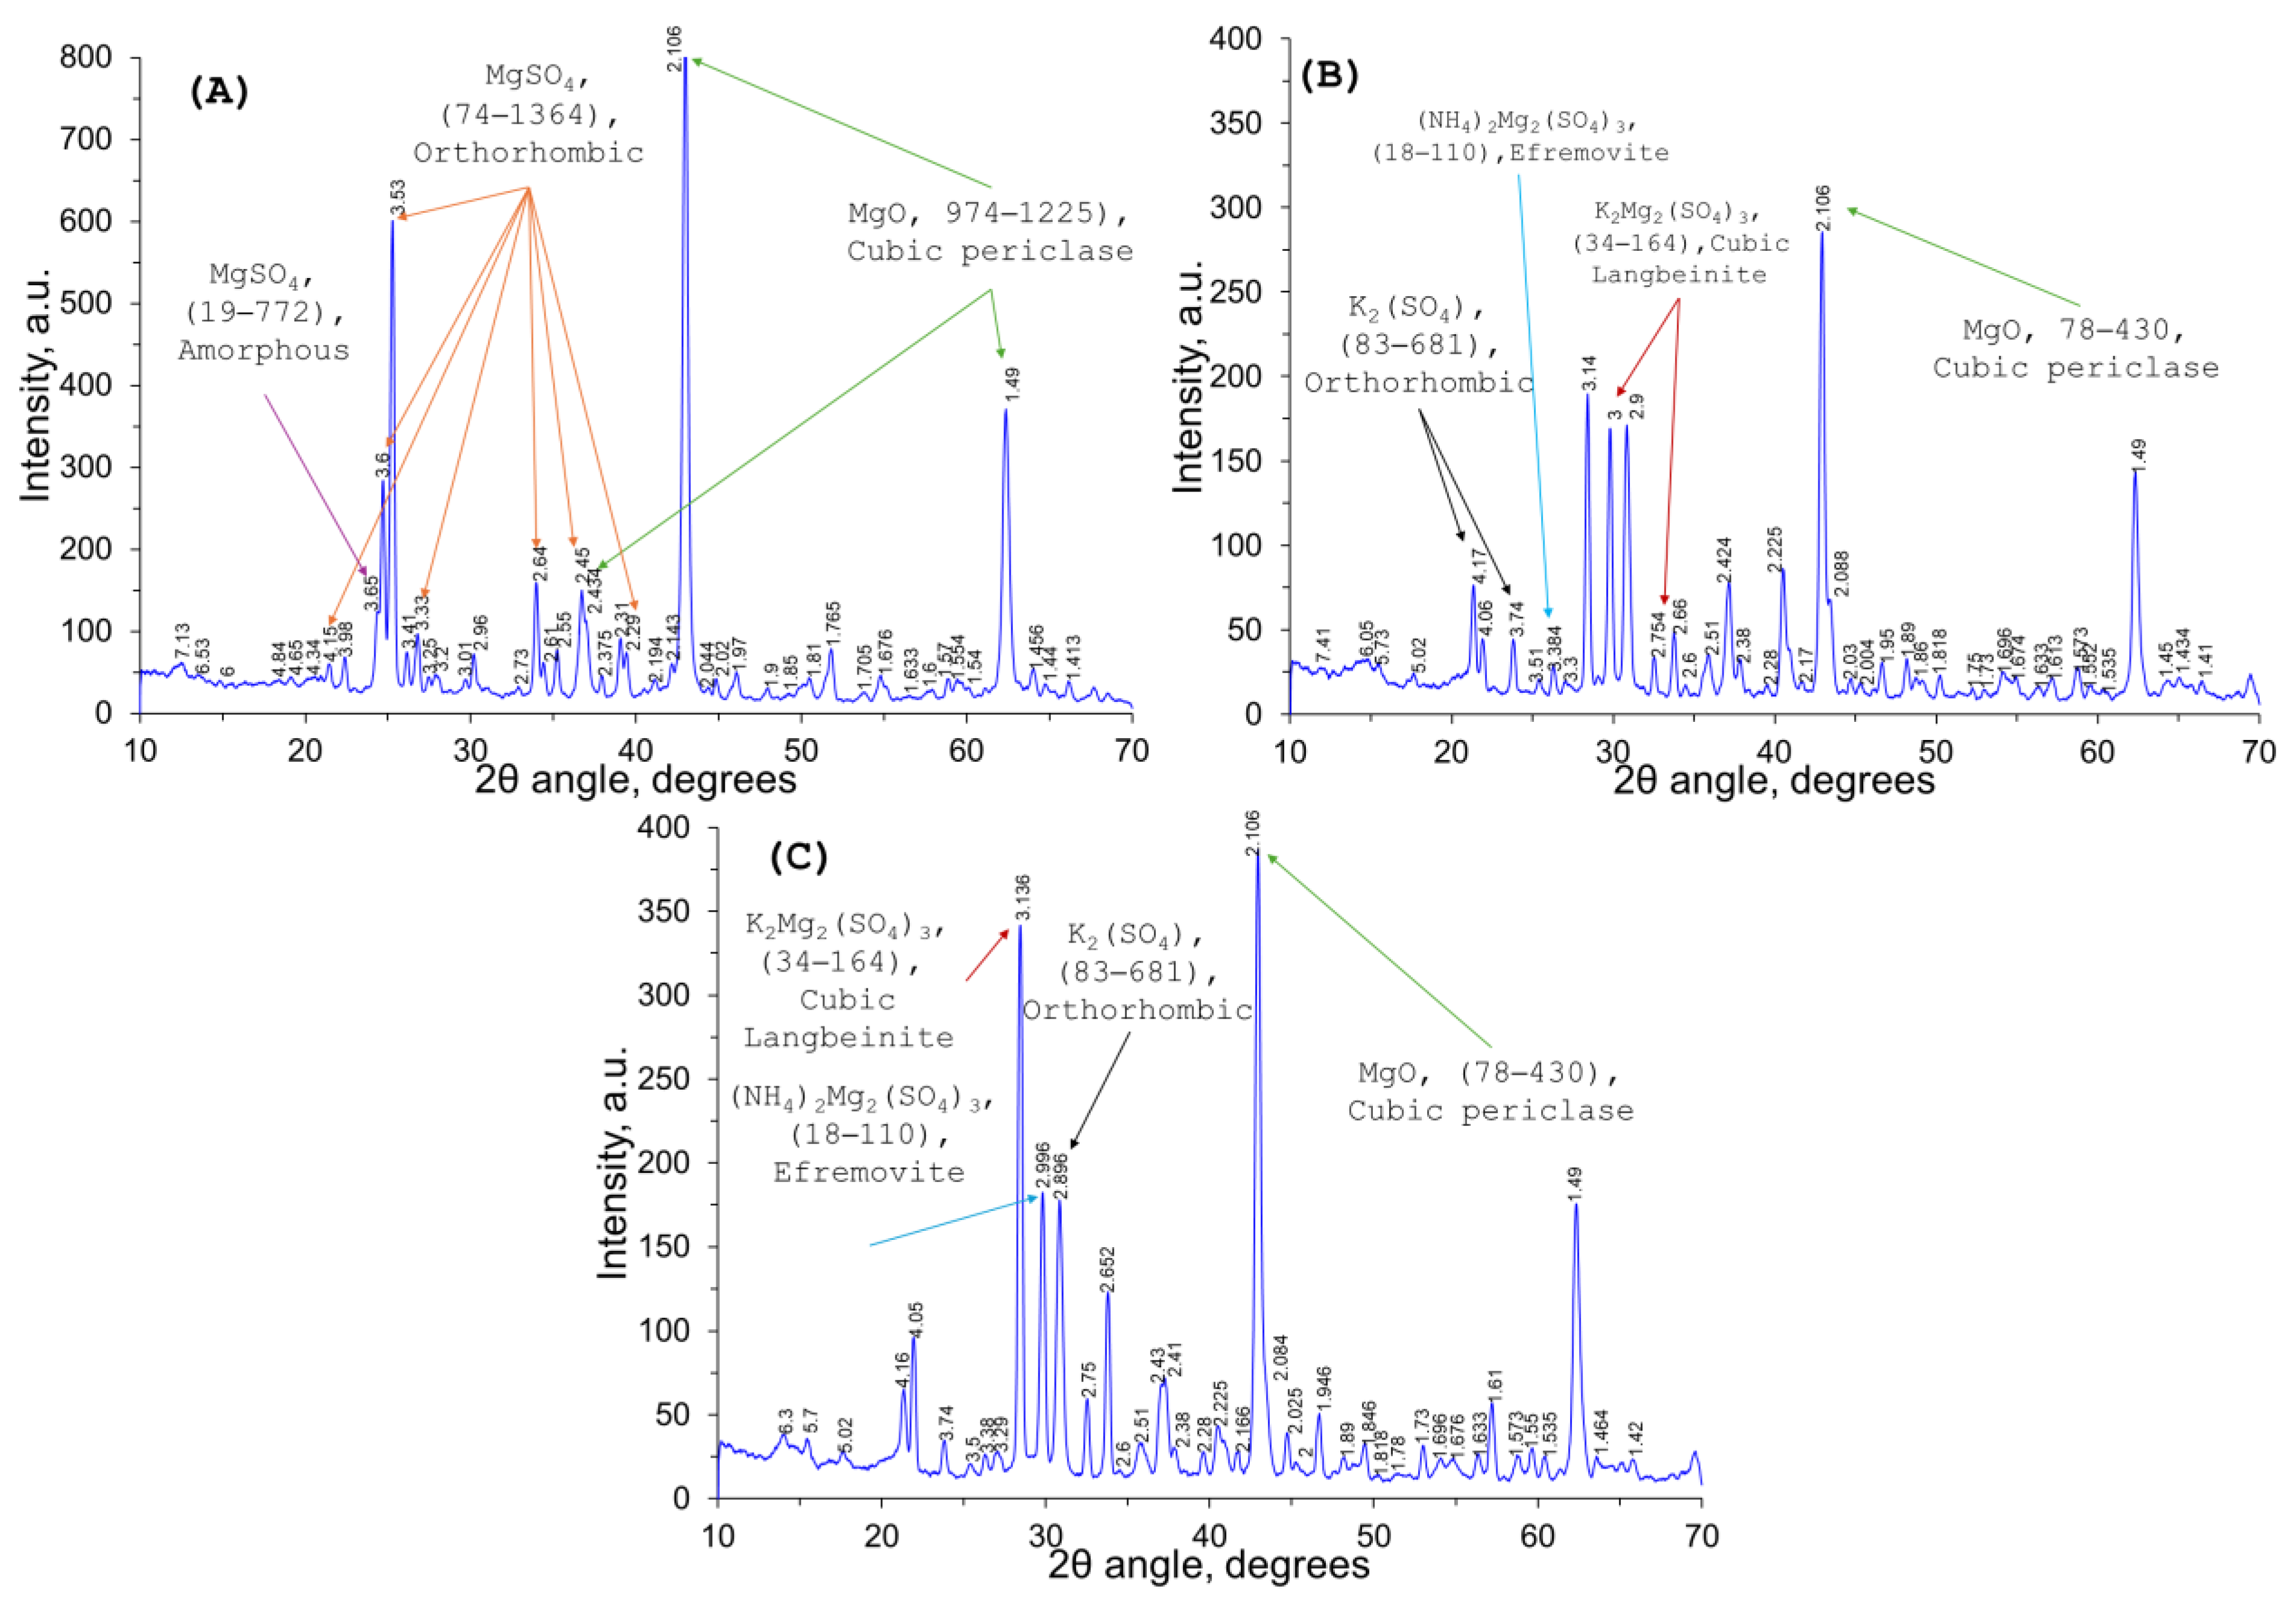
Figure 10 presents the XRD patterns of powders calcined at 650 °C, 750 °C, and 800 °C.
At 650 °C (pattern A), the diffractogram shows intense reflections characteristic of anhydrous MgSO4 (orthorhombic, 72–1259). Weak but distinct MgO peaks are also visible (e.g., the (200) reflection near 42.9° 2θ), indicating that the decomposition has already initiated at this temperature. However, the XRF analysis reveals a low magnesium content (40.6%) and high sulfur (58.0%), meaning that the bulk of the material remains as sulfate.
At 750 °C (pattern B), MgSO4 peaks are still present but notably reduced in intensity. MgO peaks have grown significantly and become sharper, indicating a higher mass fraction and larger crystallite size. The XRF data confirm this trend: magnesium content rises to 62.3%, while sulfur drops to 36.2%. The coexistence of both crystalline phases confirms that the decomposition is proceeding but is still incomplete.
At 800 °C (pattern C), the XRD pattern is dominated by sharp, intense MgO peaks. MgSO4 reflections are no longer detectable, suggesting that the crystalline sulfate phase has completely decomposed. However, XRF still detects 20.2% sulfur. This apparent discrepancy is resolved by recognizing that the remaining sulfur resides in an amorphous or poorly crystalline phase (e.g., an intermediate oxysulfate or sulfate trapped inside MgO particles), which is invisible to XRD. Thus, while XRD shows a phase-pure MgO pattern, the product is not chemically pure, a clear demonstration of the complementary nature of the two techniques.
Calcination time had a less pronounced effect than temperature, with Mg content rising from ~73% at 30 min to ~86% at 240 min.
The heating rate has a pronounced inverse effect on MgO content. A slow heating rate of 2.5 °C/min yields a Mg mass fraction of ~92%, whereas a fast rate of 20 °C/min results in a value of only ~36%.
The results are explained by the kinetics and thermodynamics of the thermal decomposition of magnesium sulfate (MgSO4) within the polymer matrix.
The low Mg mass fractions below 800 °C reflect the high activation energy barrier for sulfate decomposition, which is overcome only in the 750–800 °C range.
The heating rate controls the competition between polymer removal and precursor decomposition. A possible explanation is that the slow heating rate allows more gradual polymer burnout, which may facilitate SO
x escape. A similar heating-rate dependence for pure MgSO
4 decomposition was reported in [
43,
44].
The maximum MgO purity achieved in this work (~82% which corresponds to 91.6% Mg (%) at 2.5 °C/min, 800 °C) compares favorably with literature reports for sulfate-derived MgO via alternative routes: ~88% via co-precipitation [
46], ~90% via sol-gel [
17], and ~93% via hydrothermal synthesis [
47]. While nitrate-based polyacrylamide gel routes can achieve slightly higher initial purity (~95–98%) due to more facile decomposition [
25], the present sulfate-based approach offers a critical safety advantage for scale-up with only a modest trade-off in final purity, well within acceptable limits for most industrial applications (catalysis, adsorption, EOR) where surface area and dispersion stability are often more critical than absolute phase purity.
The high relative Mg mass fraction (>95% Mg by XRF) combined with the observation of well-faceted, polyhedral particles by TEM (
Figure 4 and Figure 14) provides mutually reinforcing evidence for the formation of crystalline periclase-phase MgO. This cross-validation approach, combining elemental composition with direct morphological imaging, is consistent with characterization strategies employed in recent high-impact studies of gel-derived metal oxides [
38,
40], where XRF/ICP-OES paired with electron microscopy was deemed sufficient to establish phase purity when XRD was not the primary focus.
To summarize,
Table 4 demonstrates that for a sulfate-based precursor, the calcination parameters are not just about crystallizing the oxide; they are primarily about ensuring complete precursor decomposition and efficient by-product removal. A slow heating rate is the most critical factor for achieving high purity, followed by a sufficient maximum temperature (≥800 °C) and an adequate dwell time.
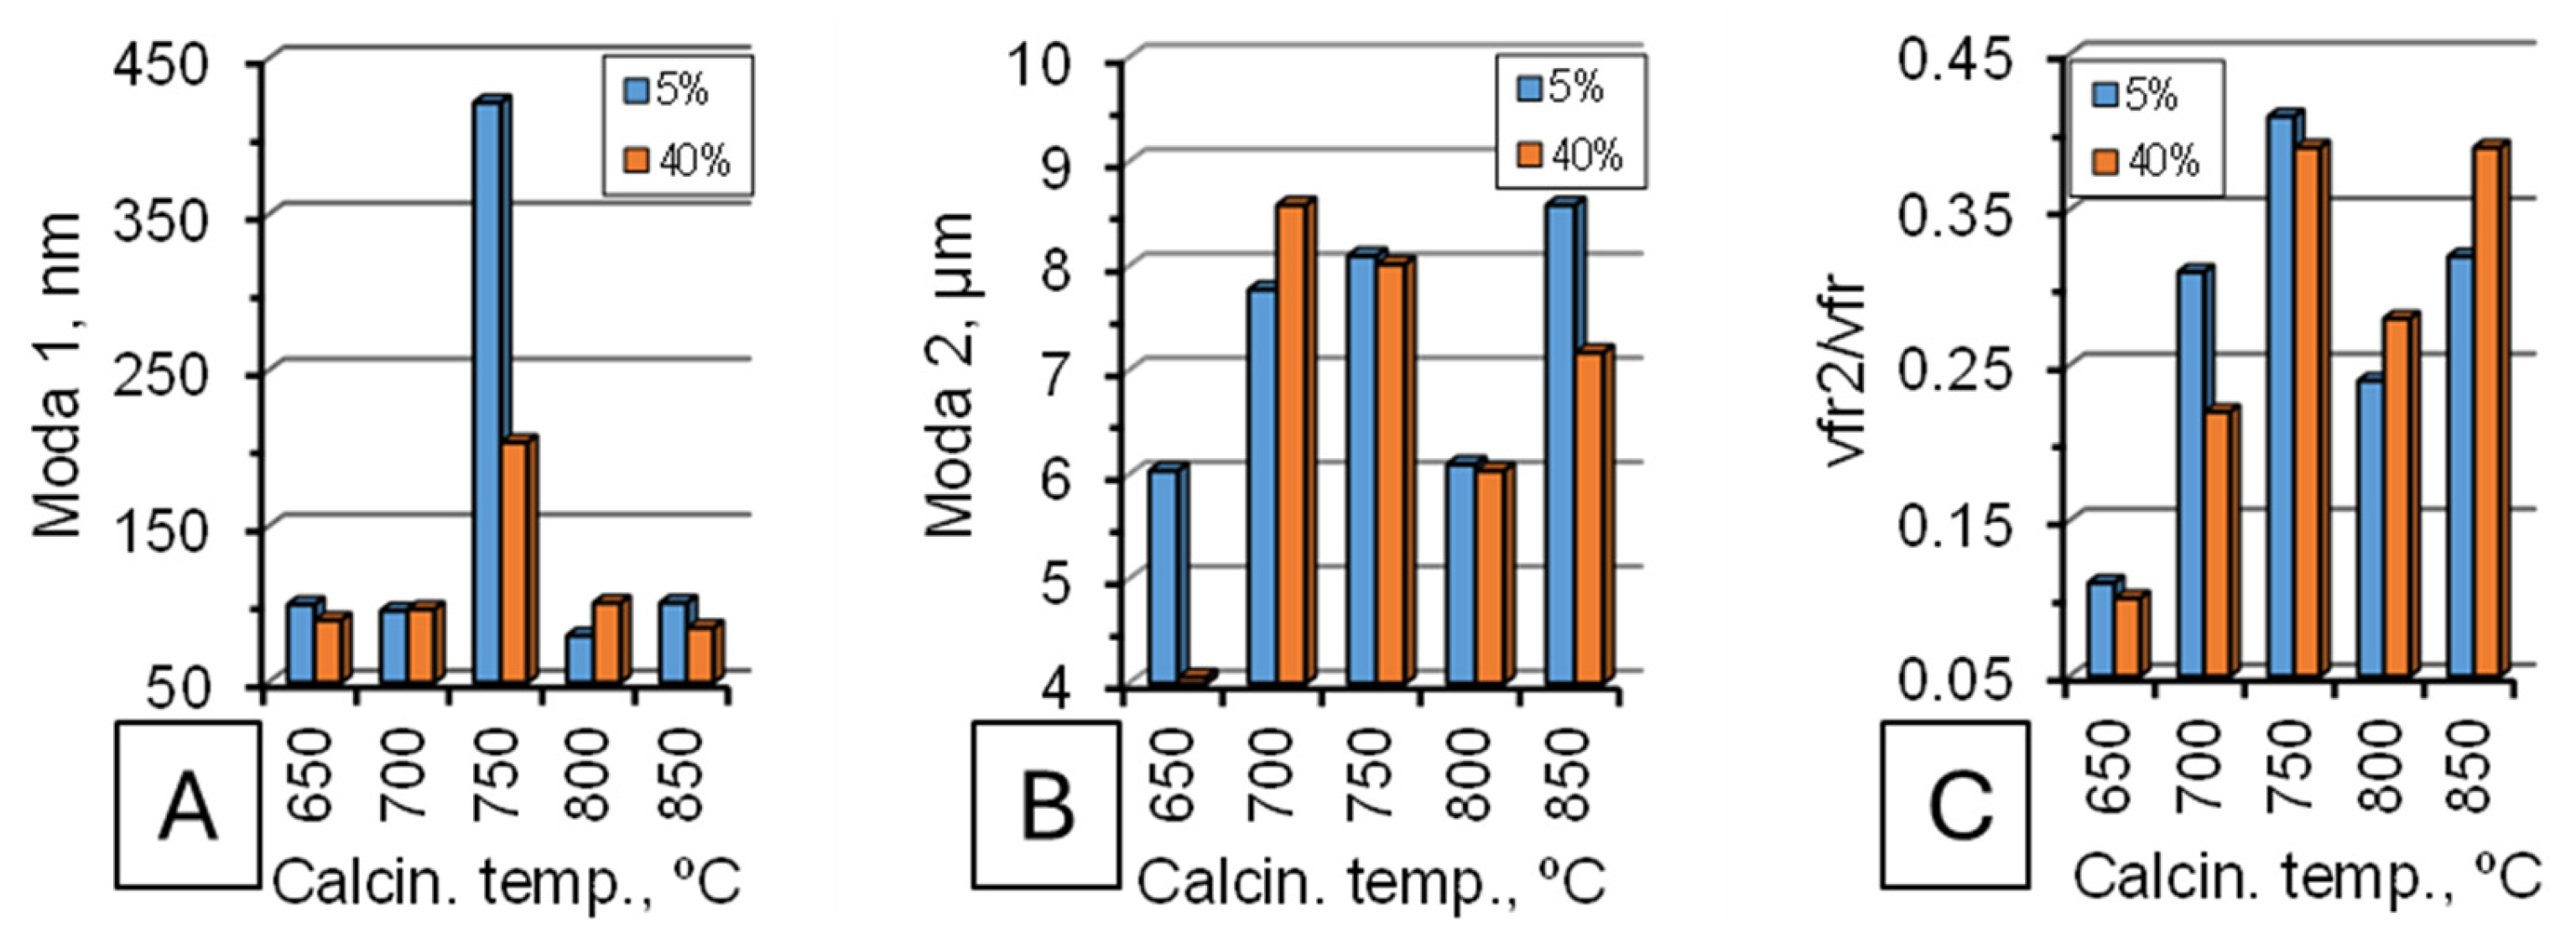
The characterization of nanoparticles by electroacoustic spectrometers was realized. The nanoparticles size distribution according to calcination temperature is shown in the diagrams of
Figure 11.
The data in
Figure 11 reveals that calcination temperature has a significant impact on the particle size distribution, but its effect is secondary to its primary role of enabling the chemical formation of MgO, as established by
Table 4.
The most striking trend is the stabilization of the average nano-size above 800 °C. For both crosslinker ratios, the primary particle size remains relatively constant and stable once the temperature reaches 800 °C and 850 °C.
At the critical formation temperature of 750 °C, the average nano-size is more variable, suggesting an inconsistent and ongoing crystallization process where some crystals have formed fully while others have not.
The percentage of micro-sized particles is minimized at 800 °C for both crosslinker ratios. This indicates that this temperature yields the most homogeneous sample with the least agglomeration. At both lower (750 °C) and higher (850 °C) temperatures, the percentage of micro-size particles increases. This creates a “sweet spot” for homogeneity at 800 °C.
Thus, 800 °C is the optimal compromise, providing complete conversion while minimizing agglomeration and stabilizing the primary nanoparticle size.
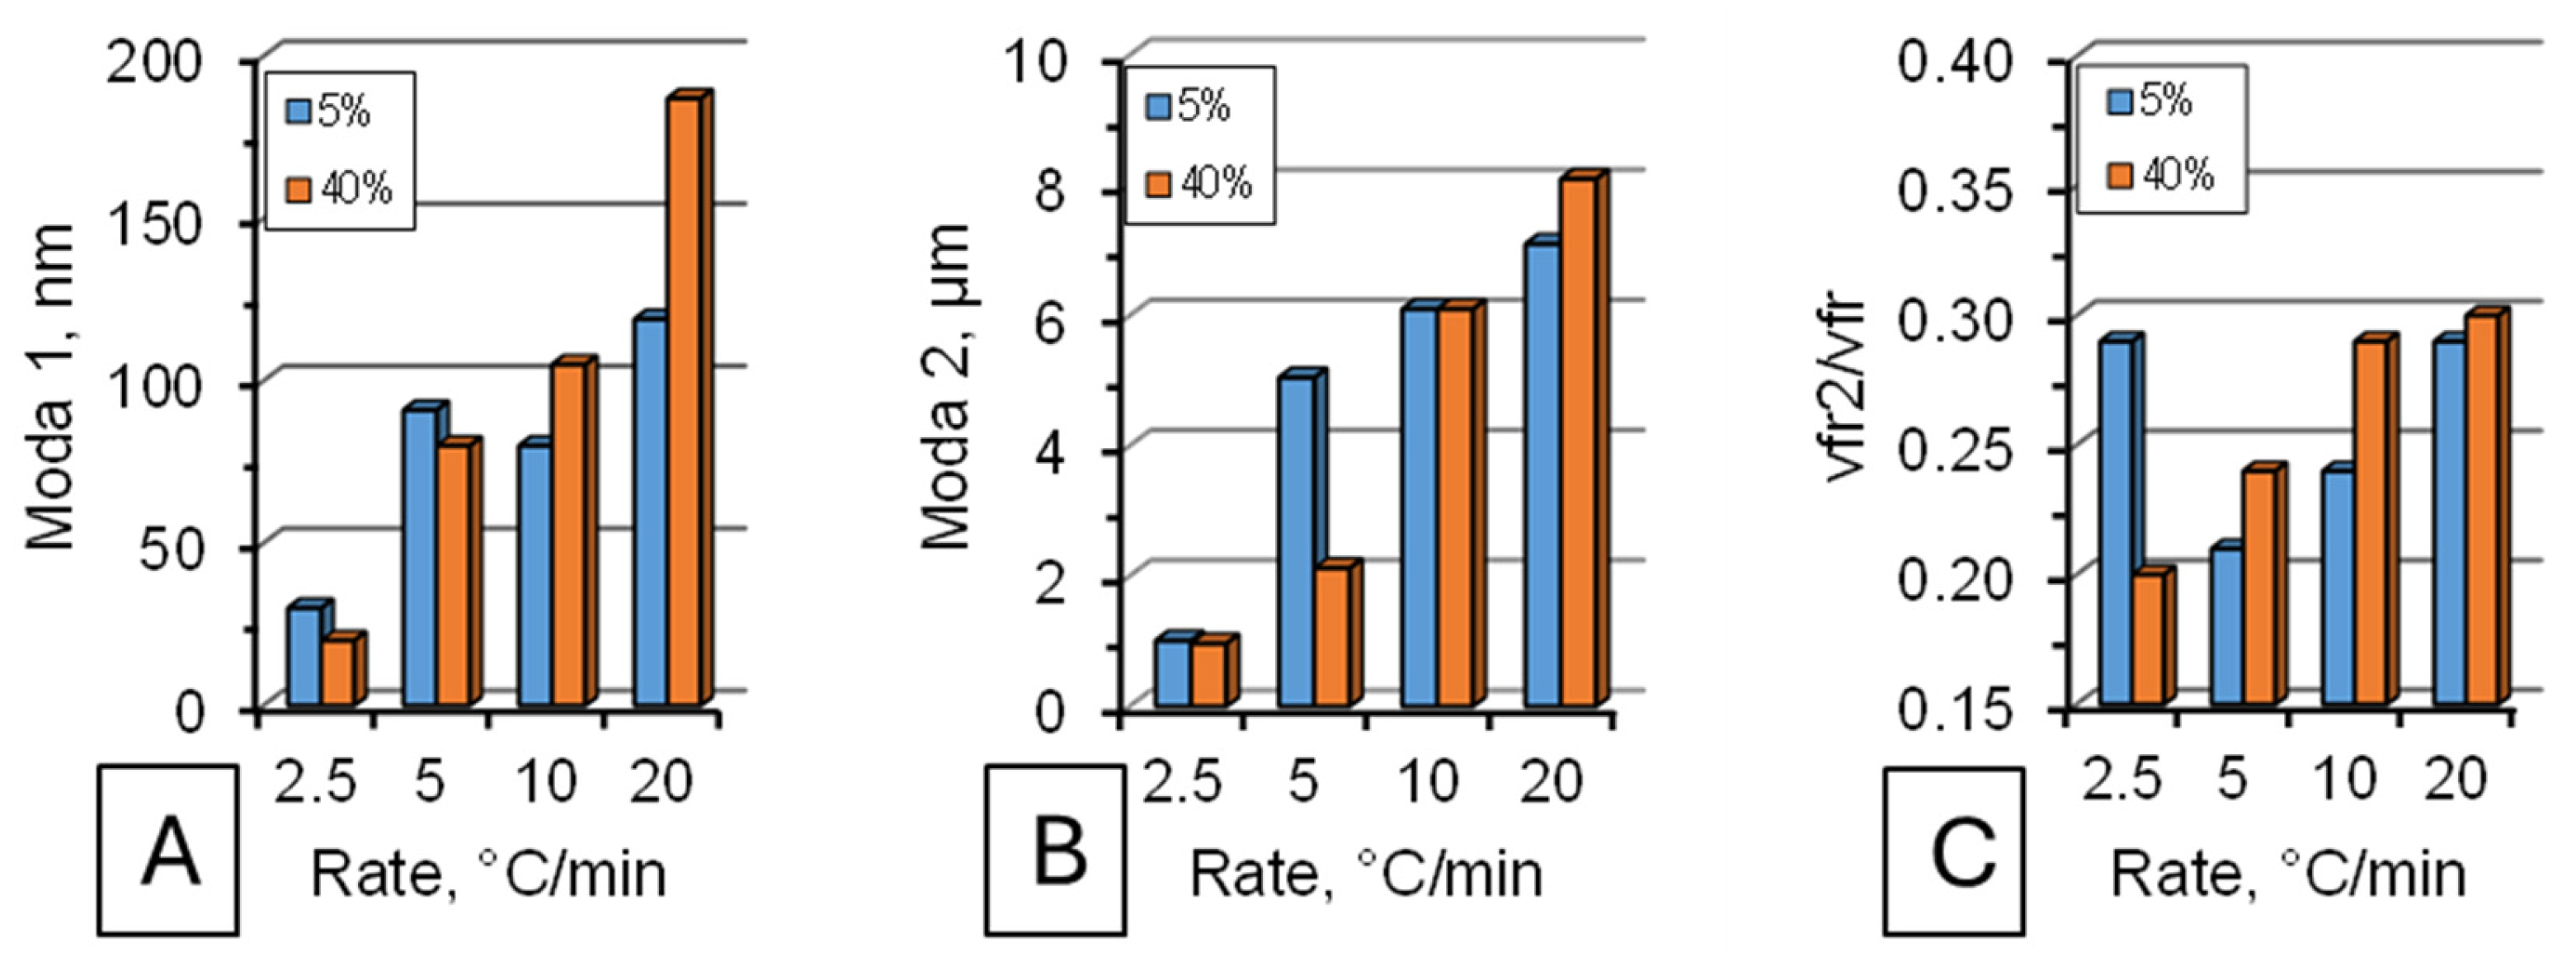
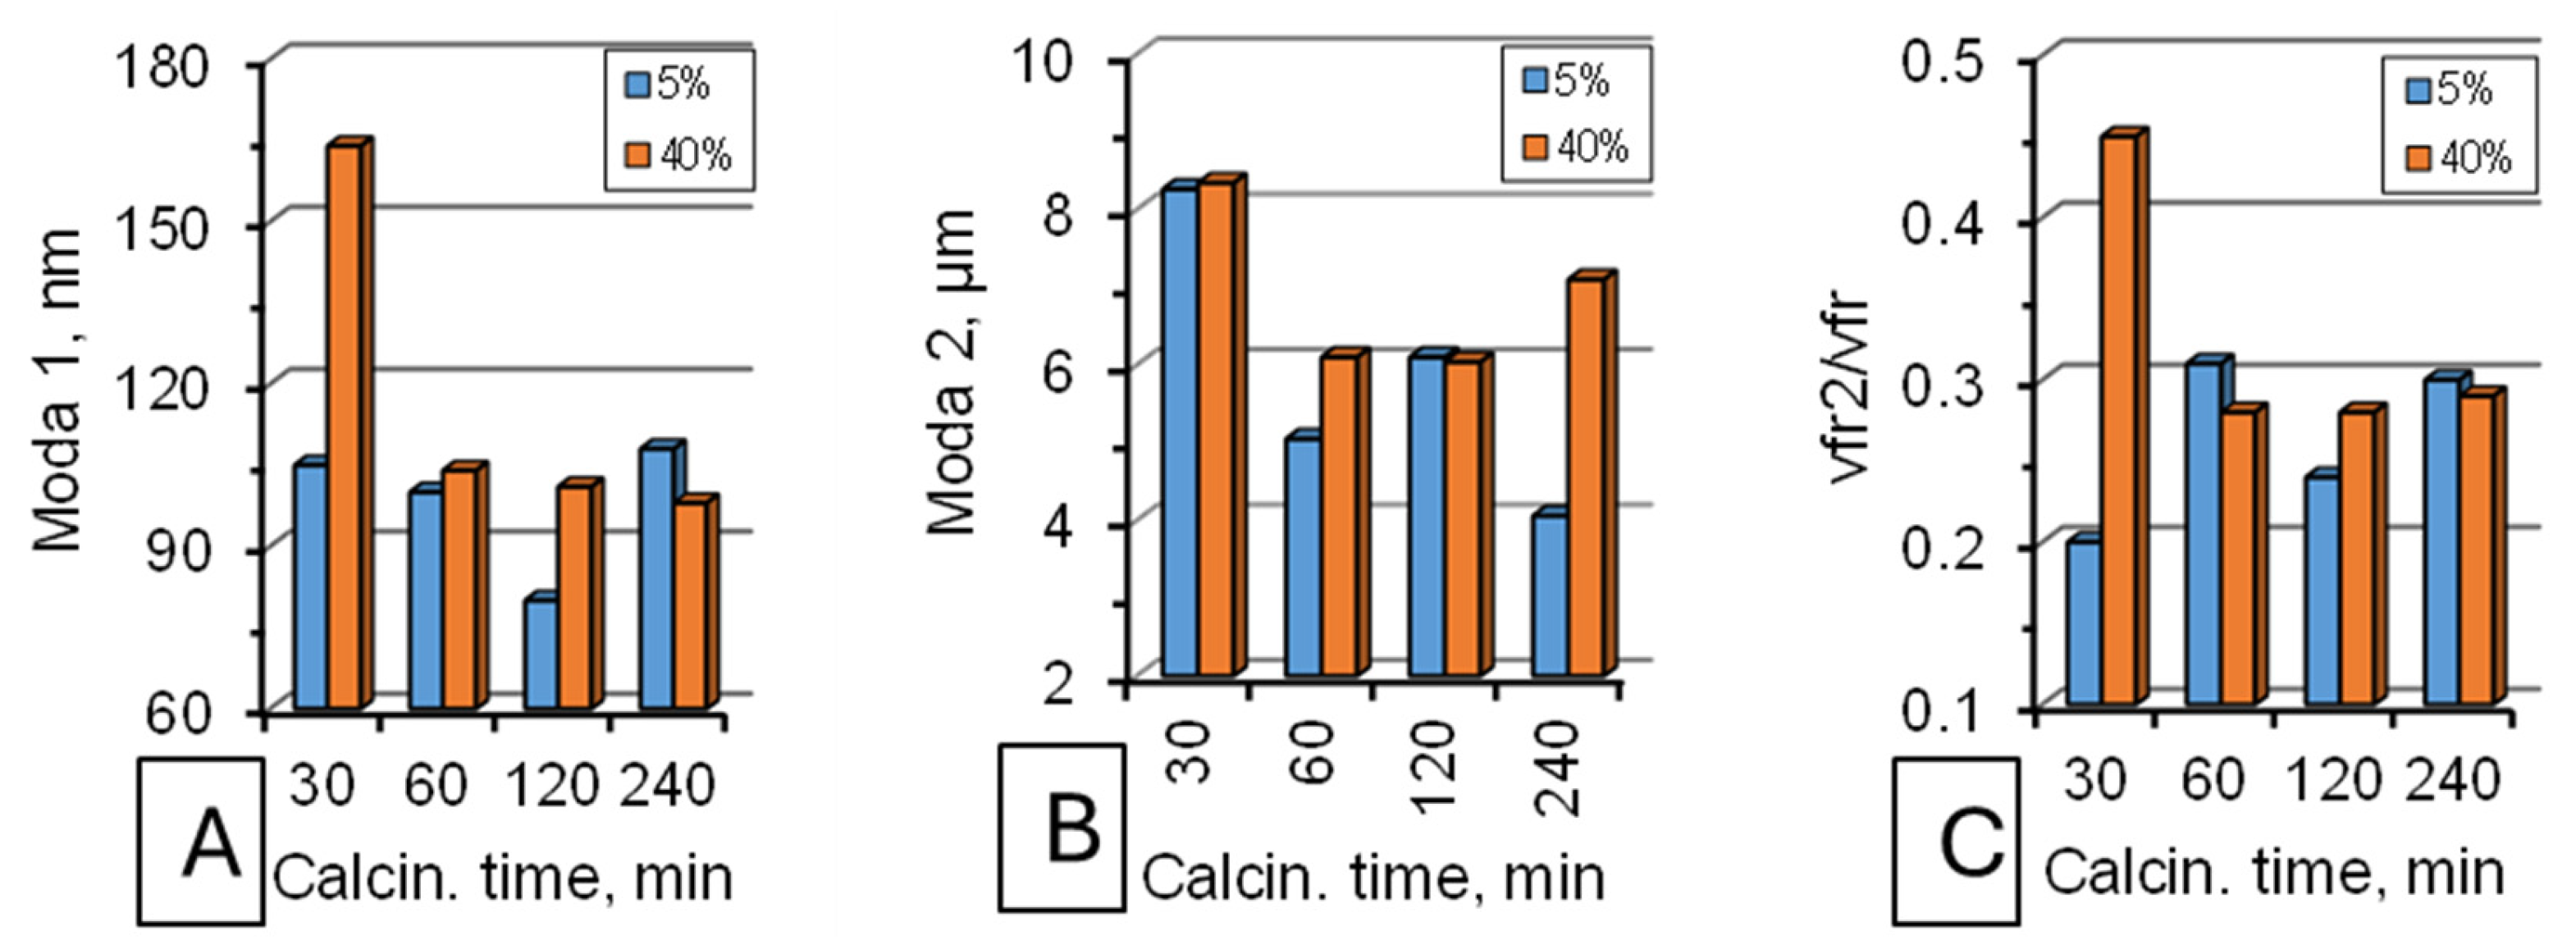
The effects of dwell time and heating rate on particle size distribution are shown in
Figure 12 and
Figure 13, respectively.
Figure 12 and
Figure 13 analyze the impact of two critical temporal parameters in the calcination process. Dwell time at maximum temperature (
Figure 12) and heating/cooling rate (
Figure 13). While related, their effects on the final MgO nanoparticles are fundamentally different, revealing distinct aspects of the formation mechanism.
Figure 12 demonstrates that once the crucial decomposition temperature is reached (800 °C, as established previously), the dwell time has a relatively minor influence on the nanoparticle size and distribution. The most significant change is observed between 30 and 120 min, where the percentage of micro-size agglomerates decreases, indicating a more complete reaction and stabilization of the product. Beyond 120 min, the parameters remain largely stable, suggesting the system reaches a state of completion where extended time offers no further benefit and risks unnecessary energy consumption.
Figure 13 reveals that the heating rate is not merely a procedural parameter but a primary factor exerting kinetic control over the nucleation and growth processes, with a dramatic impact on the average size of the primary nanoparticles (Moda 1).
The average nano-size is inversely proportional to the heating rate. A very slow heating rate of 2.5 °C/min results in significantly smaller primary nanoparticles (~30 nm) compared to the standard 10 °C/min (~80 nm) or fast 20 °C/min (~90 nm) rates.
Interestingly, the heating rate has a limited effect on homogeneity (percentage of micro-size particles), which remains relatively constant across different rates. This suggests that the heating rate is the dominant factor controlling the primary particle size, whereas the agglomeration of these primary particles is governed by other factors, such as the precursor loading and polymeric cell volume previously studied.
The electroacoustic data from the previous sections have established two critical, independent trends governing the final state of the MgO nanoparticles (calcination temperature and heating rate).
TEM micrographs of MgO nanoparticles calcined at 650, 750, and 850 °C are presented in
Figure 14.
Figure 14 presents three Transmission Electron Microscopy (TEM) images, each corresponding to a sample calcined at a different temperature.
Figure 14A (650 °C) shows a largely amorphous and fused mass with no distinct, recognizable particle morphology. The structure appears porous but chaotic, with undefined shapes and a “melted” or sintered appearance. There are no clear individual crystals.
A hybrid or transitional morphology can be observed in image B (750 °C), emergence of some defined, sharp-edged structures hinting at crystal formation (likely MgO). However, these are embedded within and connected by a vast amount of a smoother, secondary phase that lacks clear crystalline features, suggesting unreacted or intermediate material.
The image C (850 °C) shows a clear and distinct crystalline morphology. The nanoparticles are well-defined, separate, and exhibit sharp geometric shapes and facets, indicative of successful crystal growth and high crystallinity. The particles appear to be predominantly polyhedral or near spherical and are visibly sintered together at their boundaries, forming a network.
The images provide a visual explanation for the low Mg yield (40.57%) at 650 °C. The amorphous mass in Image A is not pure MgO; it is a composite of decomposed polymer carbon and, most crucially, unreacted magnesium sulfate (MgSO4) and/or its intermediate decomposition products (e.g., MgSO3). The energy at this temperature is insufficient to drive the full decomposition reaction to completion, leaving a contaminated product.
Figure 14B perfectly illustrates the “hybrid morphology” mentioned in the text and explains the intermediate purity value of 62.33% from
Table 4. The sample is a physical mixture of newly formed MgO crystals and a large volume of remaining unreacted sulfate precursor. This incomplete reaction results in the poor and unstable size distribution observed in
Figure 11 for this temperature.
Figure 14C confirms that a temperature of 850 °C is sufficient for complete chemical conversion to MgO, correlating with the high purity value (80.3%) in
Table 4. However, it also visually demonstrates the trade-off of using high temperature: significant particle sintering. The primary nanoparticles have grown and fused together at their boundaries, forming a porous but interconnected network. This directly explains the increase in the “Percentage of Micro-Size” agglomerates observed at 850 °C in
Figure 11, what the spectrometer detects as “micro-size” particles are these large, sintered clusters.
This visual evidence solidifies the conclusion from
Figure 11 that 800 °C is the optimal compromise, providing complete conversion likely without the excessive sintering seen at 850 °C.
As the heating rate highly influences the size of the nanoparticles as shown in
Figure 13, the heating rate influences the form of the nanoparticles. SEM images in
Figure 15 show that a heating rate of 10 °C/min yields well-faceted, near-spherical particles, whereas 2.5 °C/min produces sponge-like, porous agglomerates.
The figure presents two Scanning Electron Microscopy (SEM) images, each corresponding to a sample synthesized with a different heating rate during the calcination stage, both processed at the optimal temperature of 800 °C.
Figure 15A (10 °C/min) shows a population of distinct, hexagonal and pentagonal (near spherical) shape, characteristic of the crystal habit of periclase MgO. They are largely separate but show signs of loose agglomeration and some necking sintering at points of contact. The size distribution appears relatively uniform.
The sample shown in
Figure 15B (2.5 °C/min) consists of amorphous, sponge-like, and highly porous agglomerates. These agglomerates are not composed of distinct, faceted primary particles. Instead, they appear as a continuous, low-density mass with a vast network of pores and voids, lacking the defined crystalline facets seen in Image A.
Acoustic spectroscopy data indicated that a slow heating rate (2.5 °C/min) yielded a primary particle size of ~30 nm, while a faster rate (10 °C/min) resulted in particles of ~80 nm. Image B seems to contradict this, showing large agglomerates. The key to resolving this is understanding what the spectrometer measures. The acoustic technique can detect the primary particle size (~30 nm) within the large, fragile, porous agglomerates seen in Image B. The SEM shows the macrostructure, while the spectrometer probes the nanostructure.
The slow heating allows for the gradual and complete burn-out of the polymer framework at low temperatures before the precursor fully decomposes. The nascent MgO nanoparticles (~30 nm) form and nucleate without a supporting matrix. These tiny, high-surface-energy particles are highly unstable and immediately undergo rapid and extensive agglomeration to minimize their surface energy, forming the large, porous, sponge-like masses shown in the image. They sinter together in an uncontrolled way, losing their individual faceted morphology.
In summary, the heating rate is a critical parameter that controls not only the primary particle size but also the fundamental nucleation pathway and ultimate macro-morphology of the product. It reveals a critical trade-off:
The 10 °C/min process is preferable for applications requiring stable dispersions or defined crystal facets (e.g., catalysis), while the 2.5 °C/min material, if properly dispersed, might be useful where high surface area is paramount.
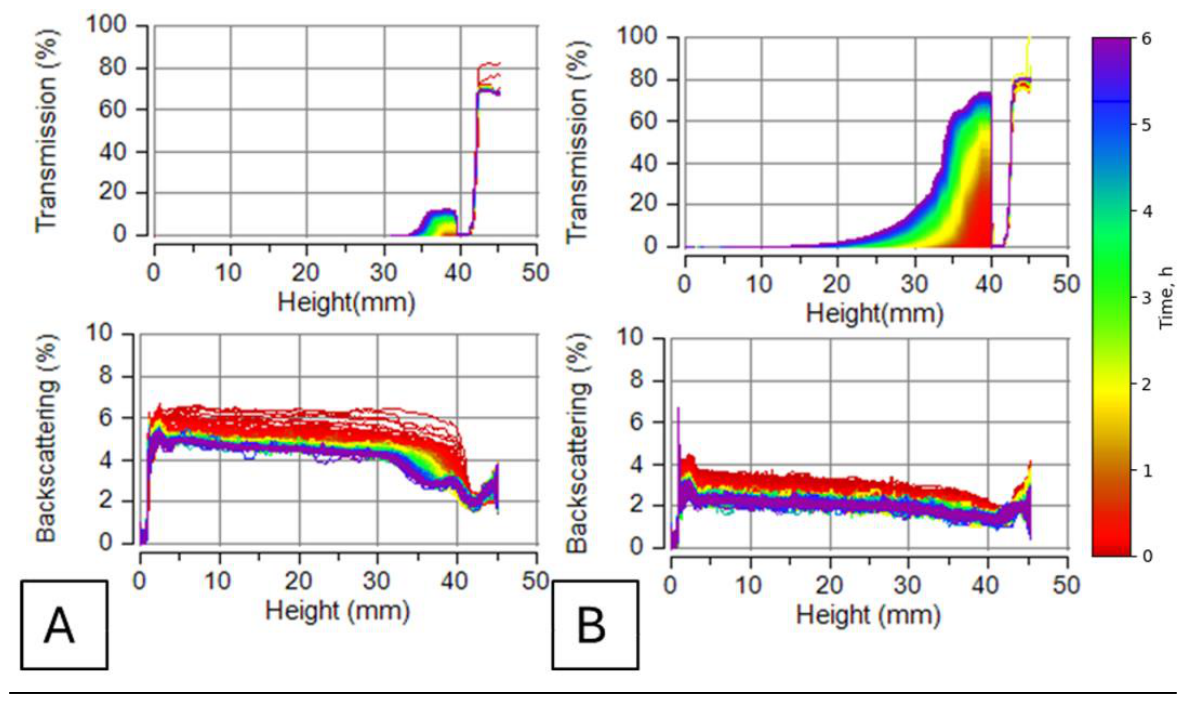
Figure 16 presents two graphs from a Dispersion Stability Analysis System (Multiscan), each tracking the stability of a nanoparticle suspension over time (6 h). Each graph plots two complementary signals against time:
Transmission (%T): The amount of light that passes through the suspension from the top. A decrease in transmission indicates increased light scattering, typically due to particle migration (sedimentation or creaming).
Backscattering (%BS): The amount of light scattered back from the suspension from the top. A change in backscattering indicates a change in particle concentration at the top of the sample, such as the formation of a sediment layer.
The flat, stable profiles in Graph A confirm that the well-faceted, robust nanoparticles produced at 10 °C/min (seen in
Figure 15A) form a stable colloidal suspension. The minimal change in signals indicates that the particles remain uniformly dispersed in the solvent over a long period, with no significant sedimentation or creaming. This suggests the particles are well-suited for applications requiring a stable nanofluid, such as in enhanced oil recovery or catalytic slurries.
The sharp, dramatic changes in backscattering in Graph B are a classic signature of rapid sedimentation. This visually confirms that the large, fragile, and amorphous agglomerates produced at the slow heating rate (seen in
Figure 15B) are colloidally unstable. The weak, porous agglomerates quickly settle out of the suspension under gravity. This result aligns perfectly with the challenging morphology observed via SEM.
This figure resolves the seeming paradox between
Figure 13 (which showed a smaller primary size for the 2.5 °C/min sample) and the instability issue. The acoustic spectrometer (
Figure 13) detected the small primary crystallites (~30 nm) within the agglomerates. However, the Multiscan analyzer (
Figure 16) and the SEM (
Figure 15) show that these nanocrystallites are bound into large, settling aggregates. The effective hydrodynamic size governing stability is that of the large agglomerate, not the primary crystallite.
3.3. Effect of Chelating Agents and pH
To exert finer control over these characteristics within the polyacrylamide gel framework, we investigated the role of chelating agents and solution pH. Chelating agents, such as citric acid (CA) and ethylenediaminetetraacetic acid (EDTA), are known to form stable coordination complexes with metal ions like Mg
2+ [
33,
35,
40]. Their incorporation can significantly alter the kinetics of metal release from the gel matrix, modify the thermal decomposition pathway of the polymer-precursor composite, and ultimately dictate the nucleation and growth dynamics of the oxide crystals during calcination.
Furthermore, the pH of the precursor-monomer solution is a critical factor that influences the polymerization kinetics, the gel’s network structure, and the chemical state of the metal species. An alkaline pH, for instance, favors the formation of magnesium hydroxide species, which can be more homogeneously incorporated into the gel [
48]. This section examines the individual and synergistic effects of these chemical parameters on the purity, morphology, and colloidal stability of the synthesized MgO nanoparticles.
We first present the impact of pH and chelating agents on the chemical purity of the final product, as quantified by X-ray fluorescence (XRF) spectroscopy and expressed as the weight percentage of magnesium (assumed to be in the form of MgO). The results are presented in
Table 5 below.
A strong positive relationship is observed between pH and normalized Mg mass fraction. The measured Mg mass fraction increases significantly from ~78% at pH 3 to ~94% at pH 9. This demonstrates that an alkaline environment during polymerization is highly favorable for achieving a pure MgO product after calcination.
A low pH can protonate the acrylamide monomers and affect the polymerization kinetics, potentially leading to a less optimal gel structure. More importantly, it promotes the formation of soluble, protonated magnesium species (e.g., [Mg(H2O)6]2+) that are less effectively bound and homogenized within the gel network. This poor integration can lead to precursor segregation and incomplete decomposition during calcination, leaving behind more residue and lowering purity.
In contrast, a high pH favors the formation of magnesium hydroxide species (Mg(OH)
2 or hydroxy-complexes) [
48], which have lower solubility and can be more easily incorporated into the growing polymer network. This creates a more homogeneous distribution of the precursor within the gel. During calcination, this homogeneity allows for a more uniform and complete decomposition reaction, resulting in a higher purity final product.
An alkaline pH (9) is the single most important factor for maximizing purity. The addition of chelating agents, particularly citric acid, provides a secondary refinement, leading to the highest possible Mg value (~97%).
XRF data (
Table 5) show that at pH 9, the Mg mass fraction rises from 93.9% (no chelator) to 95.6% (EDTA) and 96.6% (citric acid), while the S content drops from 5.79% to 4.24% and 3.06%, respectively. The XRD patterns (
Figure 17) identify the crystallographic fate of this residual sulfur. In the chelator-free sample, the secondary phase is simple orthorhombic MgSO
4. This is a direct consequence of freely available Mg
2+ ions reacting with sulfate anions during calcination. The presence of K
+ (from KOH) and NH
4+ (from the persulfate initiator) is not manifested in the XRD, because Mg
2+ is the dominant counter-ion for sulfate under these conditions. The absence of K- or NH
4-containing crystalline phases in XRD does not exclude their presence. They may exist as amorphous residues or in quantities below the detection limit. Phase identification of such impurities would require TGA-FTIR or SEM-EDS mapping, as suggested for similar sulfate systems [
43].
When EDTA or citric acid is introduced, the XRD patterns no longer show MgSO4. Instead, the secondary reflections correspond to K2Mg2(SO4)3 (langbeinite, JCPDS 83-0681), K2SO4, and (NH4)2Mg2(SO4)3 (efremovite, JCPDS 18-0110). This dramatic change in impurity speciation proves that the chelators effectively sequester Mg2+, minimizing the concentration of free magnesium ions. Consequently, sulfate anions are forced to crystallize with the more readily available cations, namely K+ (from the added KOH) and NH4+ (from the decomposed ammonium persulfate initiator). The chelator-assisted syntheses thus redistribute the sulfur impurity into complex ternary sulfates rather than simple MgSO4.
Furthermore, this correlation indicates that the most effective chelator citric acid with its tridentate coordination achieves the highest MgO purity and the most extensive crystal-size refinement by maximally suppressing the availability of free Mg2+. The near-identity between XRD crystallite sizes and DLS average particle sizes further confirms that each MgO crystal is a single, discrete nanoparticle, with negligible inter-particle sintering.
In summary, the combination of KOH and ammonium persulfate supplies the cations K+ and NH4+, while the chelating agent dictates whether sulfur precipitates as MgSO4 or as ternary K/NH4 magnesium sulfates. Citric acid is superior in both reducing the total sulfur content and converting the unavoidable residue into phases that are less thermodynamically stable and more easily removed, while simultaneously confining MgO crystallites to the sub-20 nm scale.
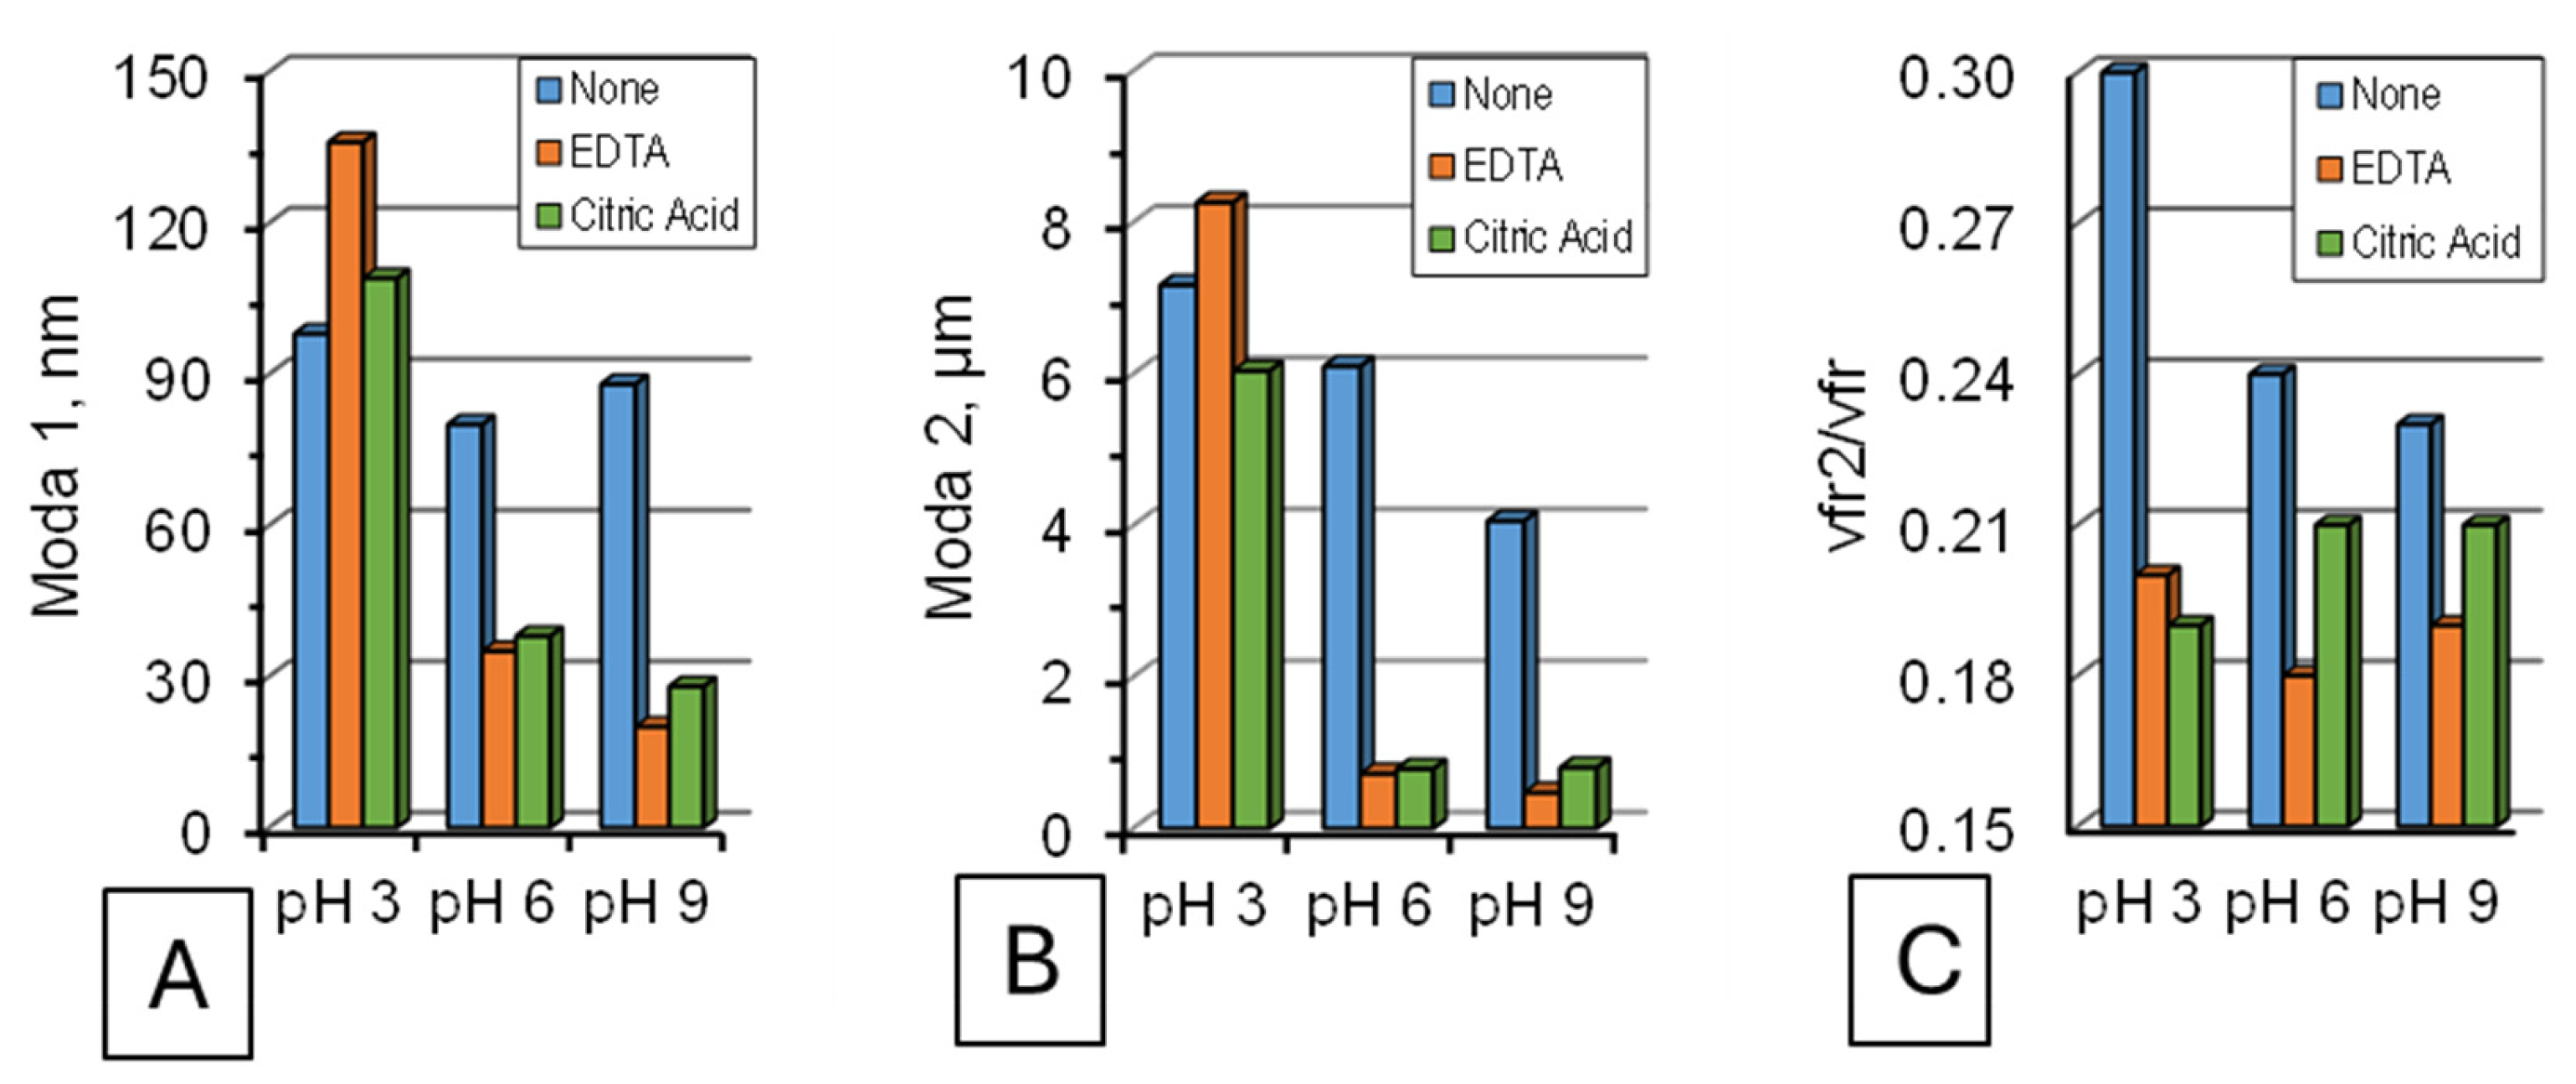
The effect of pH and chelating agents on particle size distribution is shown in
Figure 18. The diagrams show that the pH has no effect on the average size of nanoparticles without the use of chelating agents. However, we can notice that with citric acid as well as EDTA the average size of nanoparticles of MgO highly decreases with the increasing pH of polymeric solutions during the syntheses from 80 to 100 nm at acidic to 30–40 nm at neutral and 20 nm at alkaline environment.
The results in
Figure 18 reveal that pH and chelating agents play distinct and powerful roles, pH Controls Chemistry, Chelators Control Physics: The data confirms the conclusion from
Table 5 that an alkaline pH is crucial for achieving high chemical purity (by promoting precursor incorporation into the gel). However,
Figure 18 shows that pH alone does not dictate physical size. The dramatic size reduction is exclusively triggered by the chelating agents.
As indicated in
Table 5, agents like CA and EDTA form stable complexes with Mg
2+ ions, ensuring a perfectly uniform distribution of precursor throughout the polymer network [
40]. This creates a vast number of equally spaced nucleation sites during calcination. With so many sites competing for the available precursor material, crystal growth is severely restricted, resulting in smaller primary nanoparticles.
The large organic molecules of the chelator act as physical barriers between forming crystals during the calcination process. This steric hindrance prevents Oswald ripening and particle coalescence, further ensuring the formation of small, discrete crystals.
The Mg-chelates have different thermal decomposition pathways compared to simple Mg-salts. The organic ligands (citrate, EDTA) burn away in a controlled manner, potentially creating a more porous intermediate structure that facilitates the release of decomposition products and prevents the trapping of residues, thus yielding purer and smaller MgO particles.
Chelating agents are the primary tool for exerting precise morphological control over MgO nanoparticles synthesized via the polyacrylamide gel route. While an alkaline pH is essential for purity, it is the addition of chelators that enables the synthesis of truly nanometric, homogeneous particles.
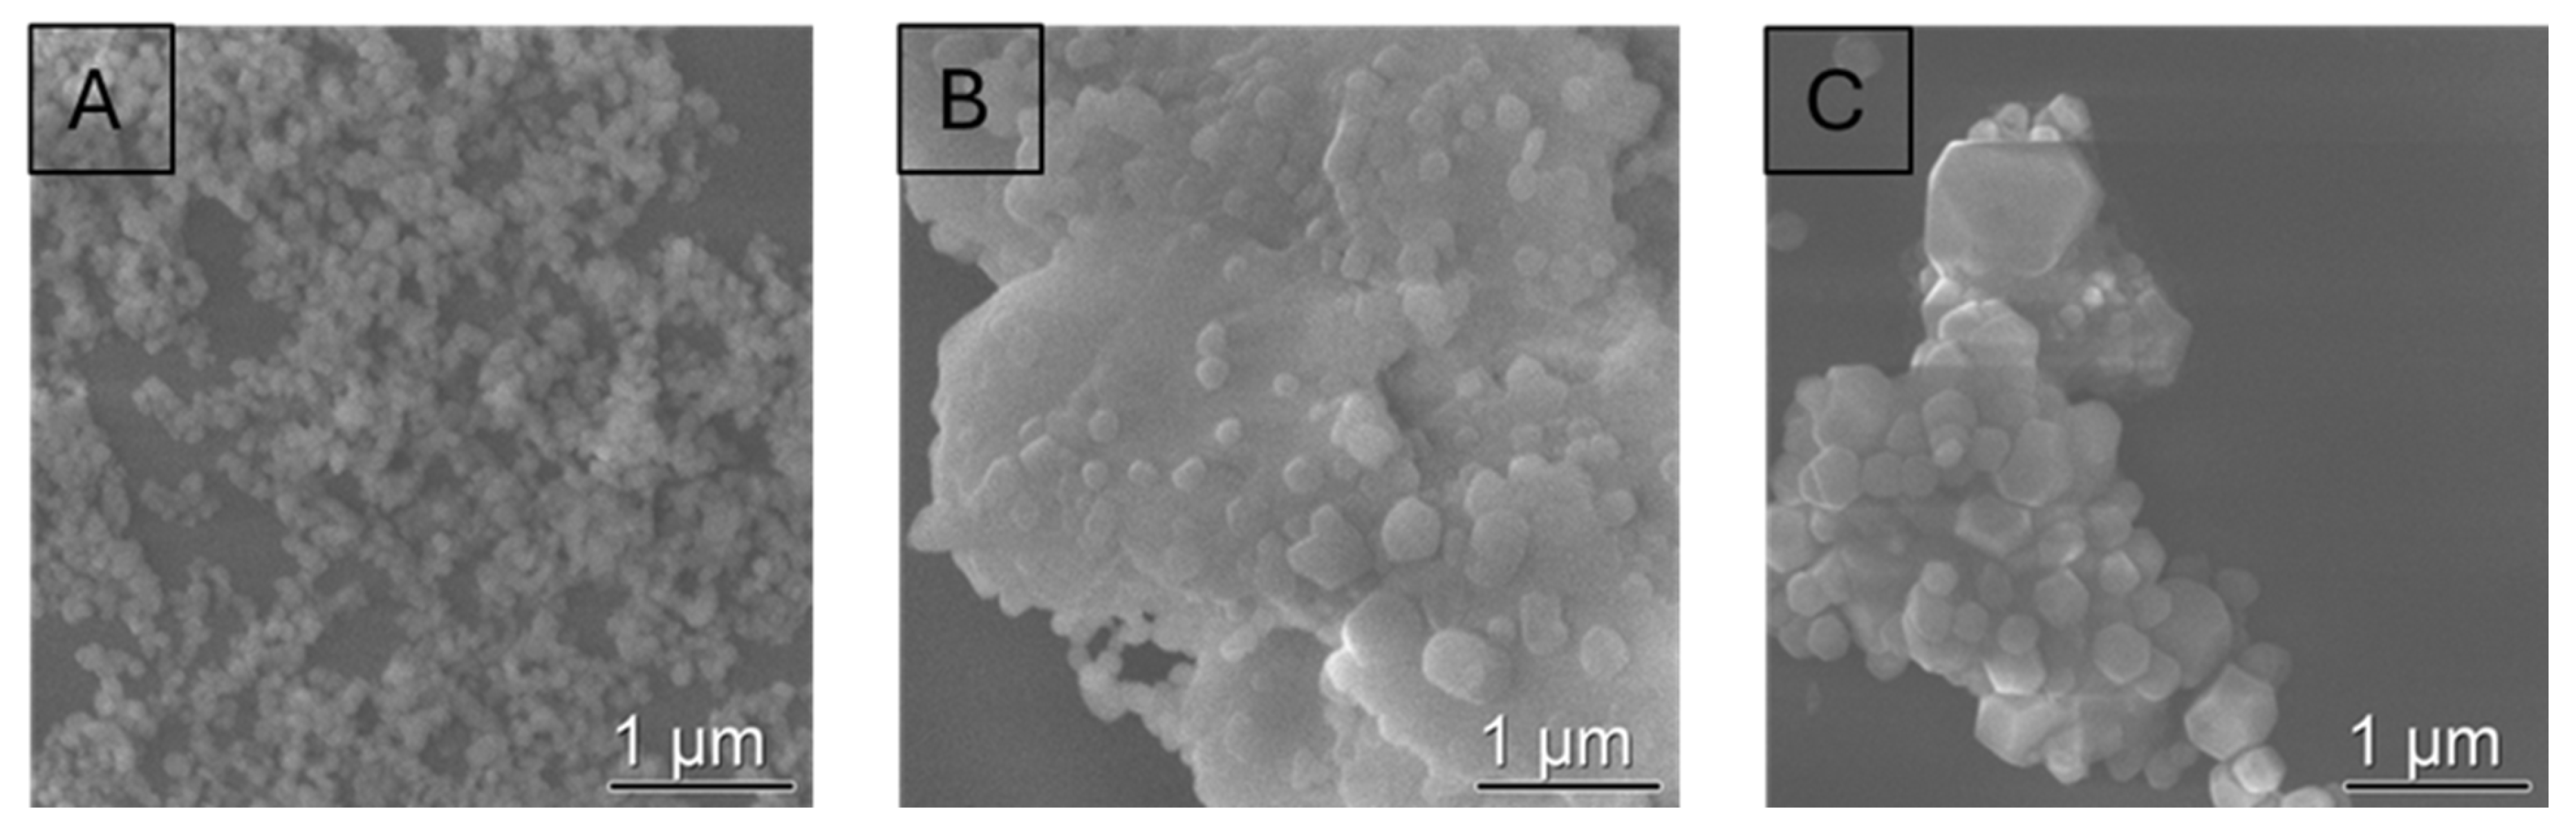
To confirm these size differences by direct visualization, scanning electron microscopy (SEM) analysis was performed, as shown in
Figure 19.
The figure presents three Scanning Electron Microscopy (SEM) images, each corresponding to a sample synthesized at alkaline pH (9) with a different chelating condition:
Figure 19A (no chelating) shows a similar profile as in
Figure 15, indicating a low influence of the pH on the morphology of the MgO particles.
The sample shown in
Figure 19B (EDTA) consists of smaller, plate-like or flake-like structures that are aggregated into larger, open clusters. The particles have a flatter, two-dimensional platelet habit visibly thinner and smaller than in the reference sample.
The nanoparticles in
Figure 19C (citric acid) are highly agglomerated but are composed of very fine, irregular or polygonal grains. These primary grains are the smallest of the three samples, appearing as tiny, sharp fragments forming porous, sponge-like agglomerates of ultrafine crystallites.
The chelating agents do not just reduce size. They dictate the fundamental crystal growth habit by modifying the precursor’s decomposition pathway and acting as structure-directing agents [
40].
It is hypothesized that the strong chelation of Mg2+ by EDTA favors anisotropic growth, resulting in platelets. Direct evidence of plane-selective adsorption requires further surface analysis (e.g., FTIR). This anisotropic growth results in the formation of platelets or nanoflakes instead of an isotropic sphere.
Citric acid appears to be the most effective agent at inhibiting crystal growth entirely. It promotes such a high density of nucleation sites that the resulting crystals are extremely small, irregular, and unable to develop well-defined facets, resulting in a fine, polygranular morphology.
This demonstrates that the choice of chelator allows for not just size control, but also selection of the nanoparticle’s shape, which has profound implications for its surface area, reactivity, and ultimate application performance.
However, the SEM images also revealed a critical secondary characteristic: all samples, regardless of morphology, exhibited a tendency to form agglomerates. The nature of these agglomerates, including whether they are strongly sintered networks (
Figure 19A), loosely stacked platelets (
Figure 19B), or fragile, porous assemblies of nanocrystallites (
Figure 19C) has profound implications for how the material will behave in any application requiring dispersion, such as in catalysis, nanofluids, or composite formation.
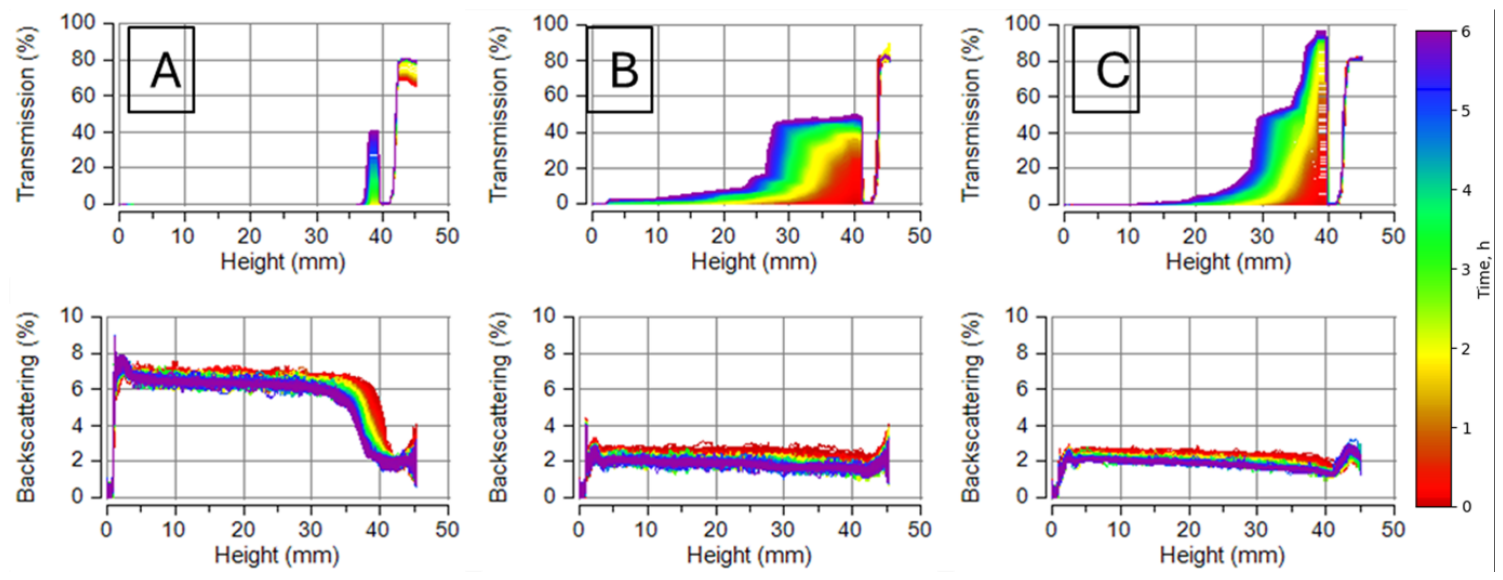
To evaluate the dispersion behavior of these morphologically distinct nanoparticles, colloidal stability was assessed by Multiscan analysis (
Figure 20). This technique probes the dynamic behavior of particles in suspension, complementing the static morphological information provided by SEM.
The figure presents three graphs from a Dispersion Stability Analysis System (Multiscan), each tracking the stability of a nanoparticle suspension over time. Each graph corresponds to a sample synthesized at pH 9 with a different chelating condition:
No chelator (
Figure 20A). The transmission and backscattering lines show moderate instability. There is a clear, gradual change in the signals over time, indicating ongoing sedimentation. However, the rate of change is not extremely rapid.
With EDTA (
Figure 20B). The transmission and backscattering lines show significant and rapid instability. A sharp, steep change in the signals is observed, indicating very fast sedimentation.
With citric acid (
Figure 20C). The transmission and backscattering lines show the most severe and rapid instability of the three. The signals change extremely sharply and quickly, indicating instantaneous and complete sedimentation or clarification.
The highly unstable profile
Figure 20B matches the SEM image (
Figure 19B) showing stacked platelets. While the primary platelets are thin, their flat, plate-like morphology and tendency to form loose, open aggregates give them a highly effective hydrodynamic size and volume, causing them to sediment very rapidly.
The extreme instability shown in
Figure 20C is a direct result of the morphology shown in the SEM image (
Figure 19C): ultrafine, polygranular aggregates. These agglomerates are composed of the smallest primary particles (~20 nm) with very high surface energy. They are fragile and porous, but when placed in suspension, they likely break apart slightly and then rapidly re-agglomerate into large, dense flocks that settle out of suspension instantly. This creates the sharp, vertical profile seen in the graph.
This data is critical for application selection. It indicates that the no chelator sample, while composed of larger particles, may offer the most predictable and manageable dispersion behavior for creating stable suspensions.
The chelator-derived samples, despite their superior nanometric size and high purity, would require post-processing to break apart these weak agglomerates and achieve a stable nanofluid.
In summary,
Section 3.3 demonstrates that pH and chelating agents are independent levers for tailoring MgO nanoparticles. Alkaline pH is non-negotiable for high purity, while chelating agents are powerful tools for engineering size and shape. However, this nano-structural control introduces a macro-scale challenge: the smallest particles form the least stable colloids. Thus, the optimal synthesis parameters must be chosen based on the target application, prioritizing colloidal stability (no chelator) or nanoscale properties (with chelators, accepting the need for post-dispersion protocols). This understanding is vital for the targeted design of MgO nanoparticles for specific technological uses. Beyond their use as templating matrices for oxide nanoparticle synthesis, polyacrylamide-based hydrogels also serve as effective solid support for catalytically active metal nanoparticles, as demonstrated by Ganguly et al. [
49]. Together with the present work, this highlights the versatility of polyacrylamide-based platforms in nanomaterials science.
Having systematically established the synthesis-structure relationships governing MgO nanoparticles via the sulfate-based polyacrylamide gel route, it is instructive to contextualize these capabilities within the broader landscape of MgO synthesis methods.
Table 6 provides a comparative overview that highlights a distinguishing feature of the present approach: process-driven morphological versatility. Unlike conventional techniques where morphology is largely dictated by thermodynamic constraints (e.g., fixed flowerlike structures in hydrothermal synthesis [
47] or polycrystalline agglomerates in co-precipitation [
46]), the polyacrylamide gel framework enables dynamic engineering of particle shape and size platelets, polyhedral grains, or hexagonal particles through simple parameter adjustments (chelator type, heating rate) without altering the precursor chemistry. Furthermore, while nitrate-based polyacrylamide gel routes achieve fine particle sizes [
25], they rely on hazardous precursors unsuitable for large-scale industrial adoption due to exothermic decomposition risks. In contrast, the sulfate-based route demonstrated here offers a unique combination of safety, high chemical purity (>95%), and tunable morphology, positioning it as a robust platform for designing application-specific MgO nanomaterials.
Taken together, the results of this systematic study reveal that the properties of MgO nanoparticles synthesized via the sulfate-based polyacrylamide gel route are governed by a hierarchy of synthesis parameters. The calcination temperature and heating rate exert the most fundamental control, determining whether the product is predominantly MgSO
4 or MgO and setting the primary crystallite size. The crosslinker ratio and initiator concentration define the architecture of the polymeric nanoreactor and thus dictate the extent of agglomeration and the homogeneity of the final powder. The pH and the choice of chelating agent provide the finest level of control, enabling the tuning of chemical purity and the selection of particle morphology from polyhedral to platelet to ultrafine polygranular. The optimal combination of parameters depends on the intended application: high surface area and minimal crystallite size are favored by citric acid at pH 9 with a slow heating rate, whereas colloidal stability is maximized by omitting chelators and using a faster heating rate.
Table 7 provides a concise overview of these relationships as a practical guide for the tailored synthesis of MgO nanoparticles.




 ,
,