1. Introduction
Over the past two decades, magnetic fluid hyperthermia (MFH) has attracted considerable attention because of the feasibility of noninvasive cancer treatment. In this method, magnetic nanoparticles (MNPs) injected into cancerous tissue can cause local heating through exposure to a high-frequency alternating magnetic field (AMF), which reduce cancerous tissue by raising cell temperature up to 42–43 °C based on the difference in sensitivity of normal and cancerous tissue to the heat [
1,
2,
3]. As the heating mediators, MNPs must be directly introduced into the body to effectively kill cancer cells. Consequently, they must have low toxicity, generate heat efficiently in small amounts, and be easily excreted. Iron oxide (magnetite and maghemite) and other ferrite nanoparticles (NPs) have been primarily investigated as heating mediators due to their high biocompatibility with the human body [
4,
5]. While iron oxide NPs have low toxicity, their heating efficiency is limited, necessitating higher dosages. In principle, heating efficiency can be enhanced by increasing the magnetic field amplitude and AMF frequency. However, in clinical settings, these parameters are constrained due to potential adverse effects on the human body. According to the biomedical guidelines, the product of frequency (
f) and AMF amplitude (
H) should be less than 5 × 10
9 A/(m·s) to avoid harmful effects on the human body [
6]. Therefore, maximizing the amount of heat generated under these conditions is crucial. The heating efficiency of NPs in an AMF is evaluated using a parameter called the specific absorption rate (SAR) or specific loss power (SLP), which represents the energy absorbed or heat generated per unit time per unit mass of MNPs exposed to the AMF. Increasing the SAR of MNPs can reduce the required dosage of particles and shorten their residence time in the body. As a result, extensive research has been conducted to develop MNPs with a high SAR. Several studies have reported that the SARs of MNPs depend not only on external factors, such as the strength and frequency of the AMF, but also on the properties of the MNPs themselves, such as particle size, shape, solvent, and magnetic anisotropy [
7,
8]. In addition to experimental studies, numerous theoretical investigations such as those employing the Monte Carlo method and Landau–Lifshitz–Gilbert (LLG) simulations have been conducted to evaluate the SAR as a function of external factors and the intrinsic properties of nanoparticles [
9,
10].
On the other hand, for successful clinical treatment, it is essential to maintain a constant local temperature in the affected area by controlling the heat generated and monitoring the temperature. To achieve this requirement, it is crucial to control the distribution of accumulated MNPs and monitor the temperature distribution within the body, which are major issues in MFH. To address these issues, MFH combined with magnetic particle imaging (MPI) has been proposed [
11,
12,
13,
14]. MPI is an emerging imaging technique that detects the signal of MNPs introduced into the body as tracers. An MPI scanner generates a spatial distribution of magnetic fields by applying opposing DC magnetic fields alongside the AMF, and scans regions where the DC magnetic field is not applied (known as the field-free point: FFP), selectively capturing the AC magnetization signals from MNPs at the FFP. Several experimental studies have investigated the heating efficiency of MNPs under the application of a static DC magnetic field superimposed on an AMF [
15,
16,
17,
18,
19]. In many cases, heating efficiency decreases under an applied DC magnetic field compared to when no DC magnetic field is present [
15,
16,
17]. However, some studies have reported an increase in heating efficiency when a DC magnetic field is combined with an AMF, due to the formation of a chain-like structure in the MNPs [
18,
19]. When heating efficiency decreases due to the application of a DC magnetic field, heat generation from the MNPs is suppressed in regions outside the FFP and is confined to the vicinity of the FFP. This effect can be utilized to control the temperature of the affected area by adjusting the amount of heat generated by the AMF through an external DC magnetic field. However, the effects of MNP magnetic properties, such as magnetic anisotropy, as well as the internal environment of the human body on the DC magnetic field dependence of SAR have not been thoroughly investigated and thus require further study.
For example, the magnetic anisotropy constant of magnetite nanoparticles with a particle size of 11 nm has been reported to be 41 kJ/m
3. In contrast, due to the strong spin–orbit interaction of Co ions, cobalt ferrite nanoparticles with a particle size of 12.7 nm have been reported to exhibit a value of 250 kJ/m
3, which is more than six times greater than that of magnetite [
20,
21]. As magnetic fluid samples containing MNPs with different magnetic anisotropy exhibit different orientation effects on the DC magnetic fields, it is interesting to inspect the effect of DC magnetic fields on the changes in SAR. In this study, the DC magnetic field dependence of SAR was investigated by superimposing a DC magnetic field with an AMF. The samples were Fe
3O
4 NPs, with moderate magnetic anisotropy, and CoFe
2O
4 NPs, with high magnetic anisotropy, dispersed in water and glycerol solutions, simulating the suppression of Brownian motion of MNPs accumulated in cells.
2. Materials and Methods
Fe
3O
4 NPs and CoFe
2O
4 NPs were synthesized by thermal decomposition [
22,
23]. For Fe
3O
4 NPs, Fe(acac)
3 (2 mmol), 1,2-hexadecanediol (8 mmol) (Sigma-Aldrich, Saint Louis, MO, USA), oleic acid (OA, 16 mmol), oleylamine (OAm, 4 mmol) (FUJIFILM Wako Pure Chemical, Osaka, Japan), and benzyl ether (20 mL) (Sigma-Aldrich, Saint Louis, MO, USA) were mixed and magnetically stirred under a flow of argon (Taiyo Nippon Sanso, Tokyo, Japan). The mixture was heated to 200 °C for 1 h and then under a blanket of argon was further heated to reflux (300 °C) for 1 h. For CoFe
2O
4 NPs, Fe(acac)
3 (1.4 mmol), Co(acac)
2 (1.6 mmol) (Sigma-Aldrich, Saint Louis, USA), 1,2-hexadecanediol (10 mmol), oleic acid (6 mmol), oleylamine (6 mmol), and benzyl ether (20 mL) were mixed and magnetically stirred under a flow of argon. The mixture was heated to 200 °C for 1 h and then under a blanket of argon was further heated to reflux (300 °C) for 1 h. After cooling to room temperature, the particles were separated by adding ethanol and were subsequently centrifuged. The resulting hydrophobic precipitate was dispersed in hexane. An aliquot of the sample was used for phase transfer. In brief, the MNPs coated with OA and OAm in hexane were mixed with dimethyl sulfoxide (DMSO)and dimercaptosuccinic acid (DMSA) (FUJIFILM Wako Pure Chemical, Osaka, Japan). The mixture was vigorously stirred overnight, resulting in the formation of black precipitates. The resulting sample was isolated by centrifugation and well dispersed in deionized water (Direct-Q, Merck Millipore, Barrington, IL, USA). The stock solution remained stable for several months or longer [
24].
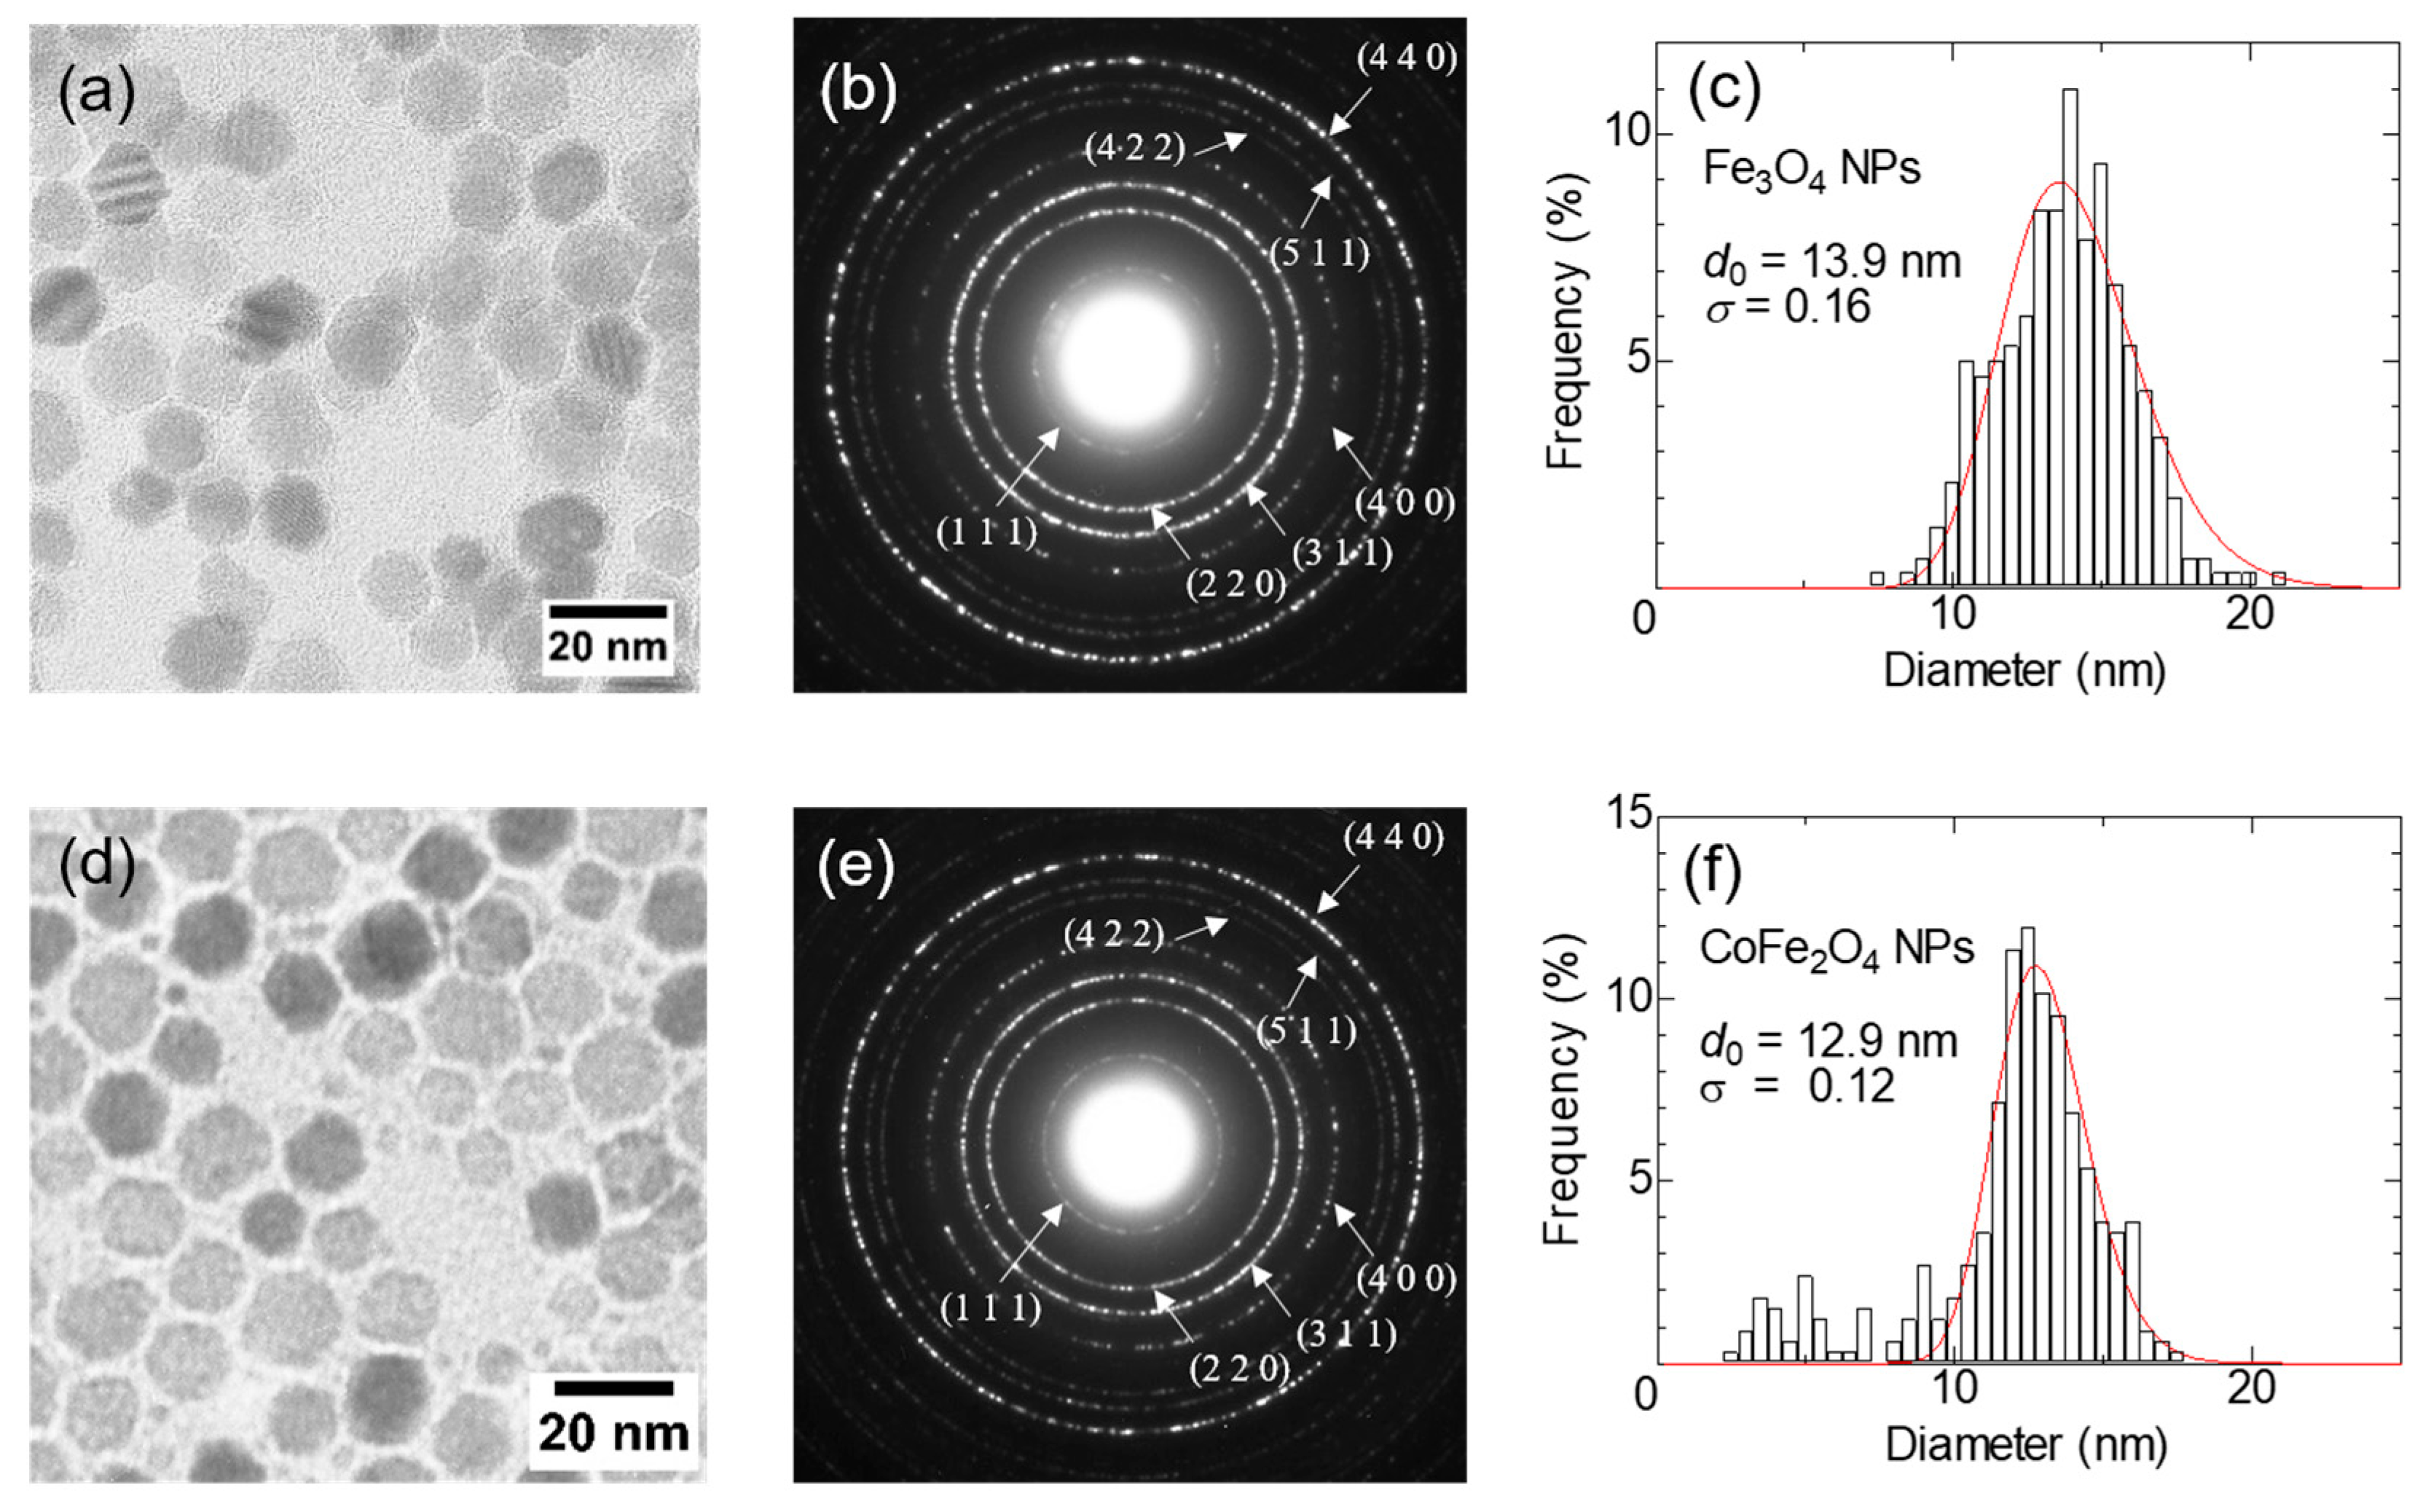
Figure 1a–f show TEM (JEM-2010, JEOL, Tokyo, Japan) images, selected-area electron diffraction (SAED) patterns, and size distribution histograms obtained by measuring the diameters of more than 200 particles of Fe
3O
4 and CoFe
2O
4 NPs. Well-separated monodispersed particles are observed. The solid line corresponds to the fitting result by a log-normal distribution. The median particle diameters of Fe
3O
4 NPs and CoFe
2O
4 NPs are
d0 = 13.9 nm (polydispersity index σ = 0.16) and
d0 = 12.9 nm (σ = 0.12), respectively. The crystal structure of the NPs was characterized by the selected area electron diffraction. All diffraction patterns were well matched with the spinel structure. The elemental analysis of the CoFe
2O
4 NPs sample using an energy dispersive X-ray spectroscopy (EDS) confirmed a Co:Fe stoichiometry of 1:2.2, indicating the successful formation of CoFe₂O₄ NPs. For experiments, samples were dispersed in 0.5 mL of solvent (deionized water and 75 wt% glycerol solution (FUJIFILM Wako Pure Chemical, Osaka, Japan)) in PP test tubes with an inner diameter of
ϕ7.3 mm. The nanoparticle concentration in the sample was determined by measuring the iron concentration using the 1,10-phenanthroline colorimetric method.
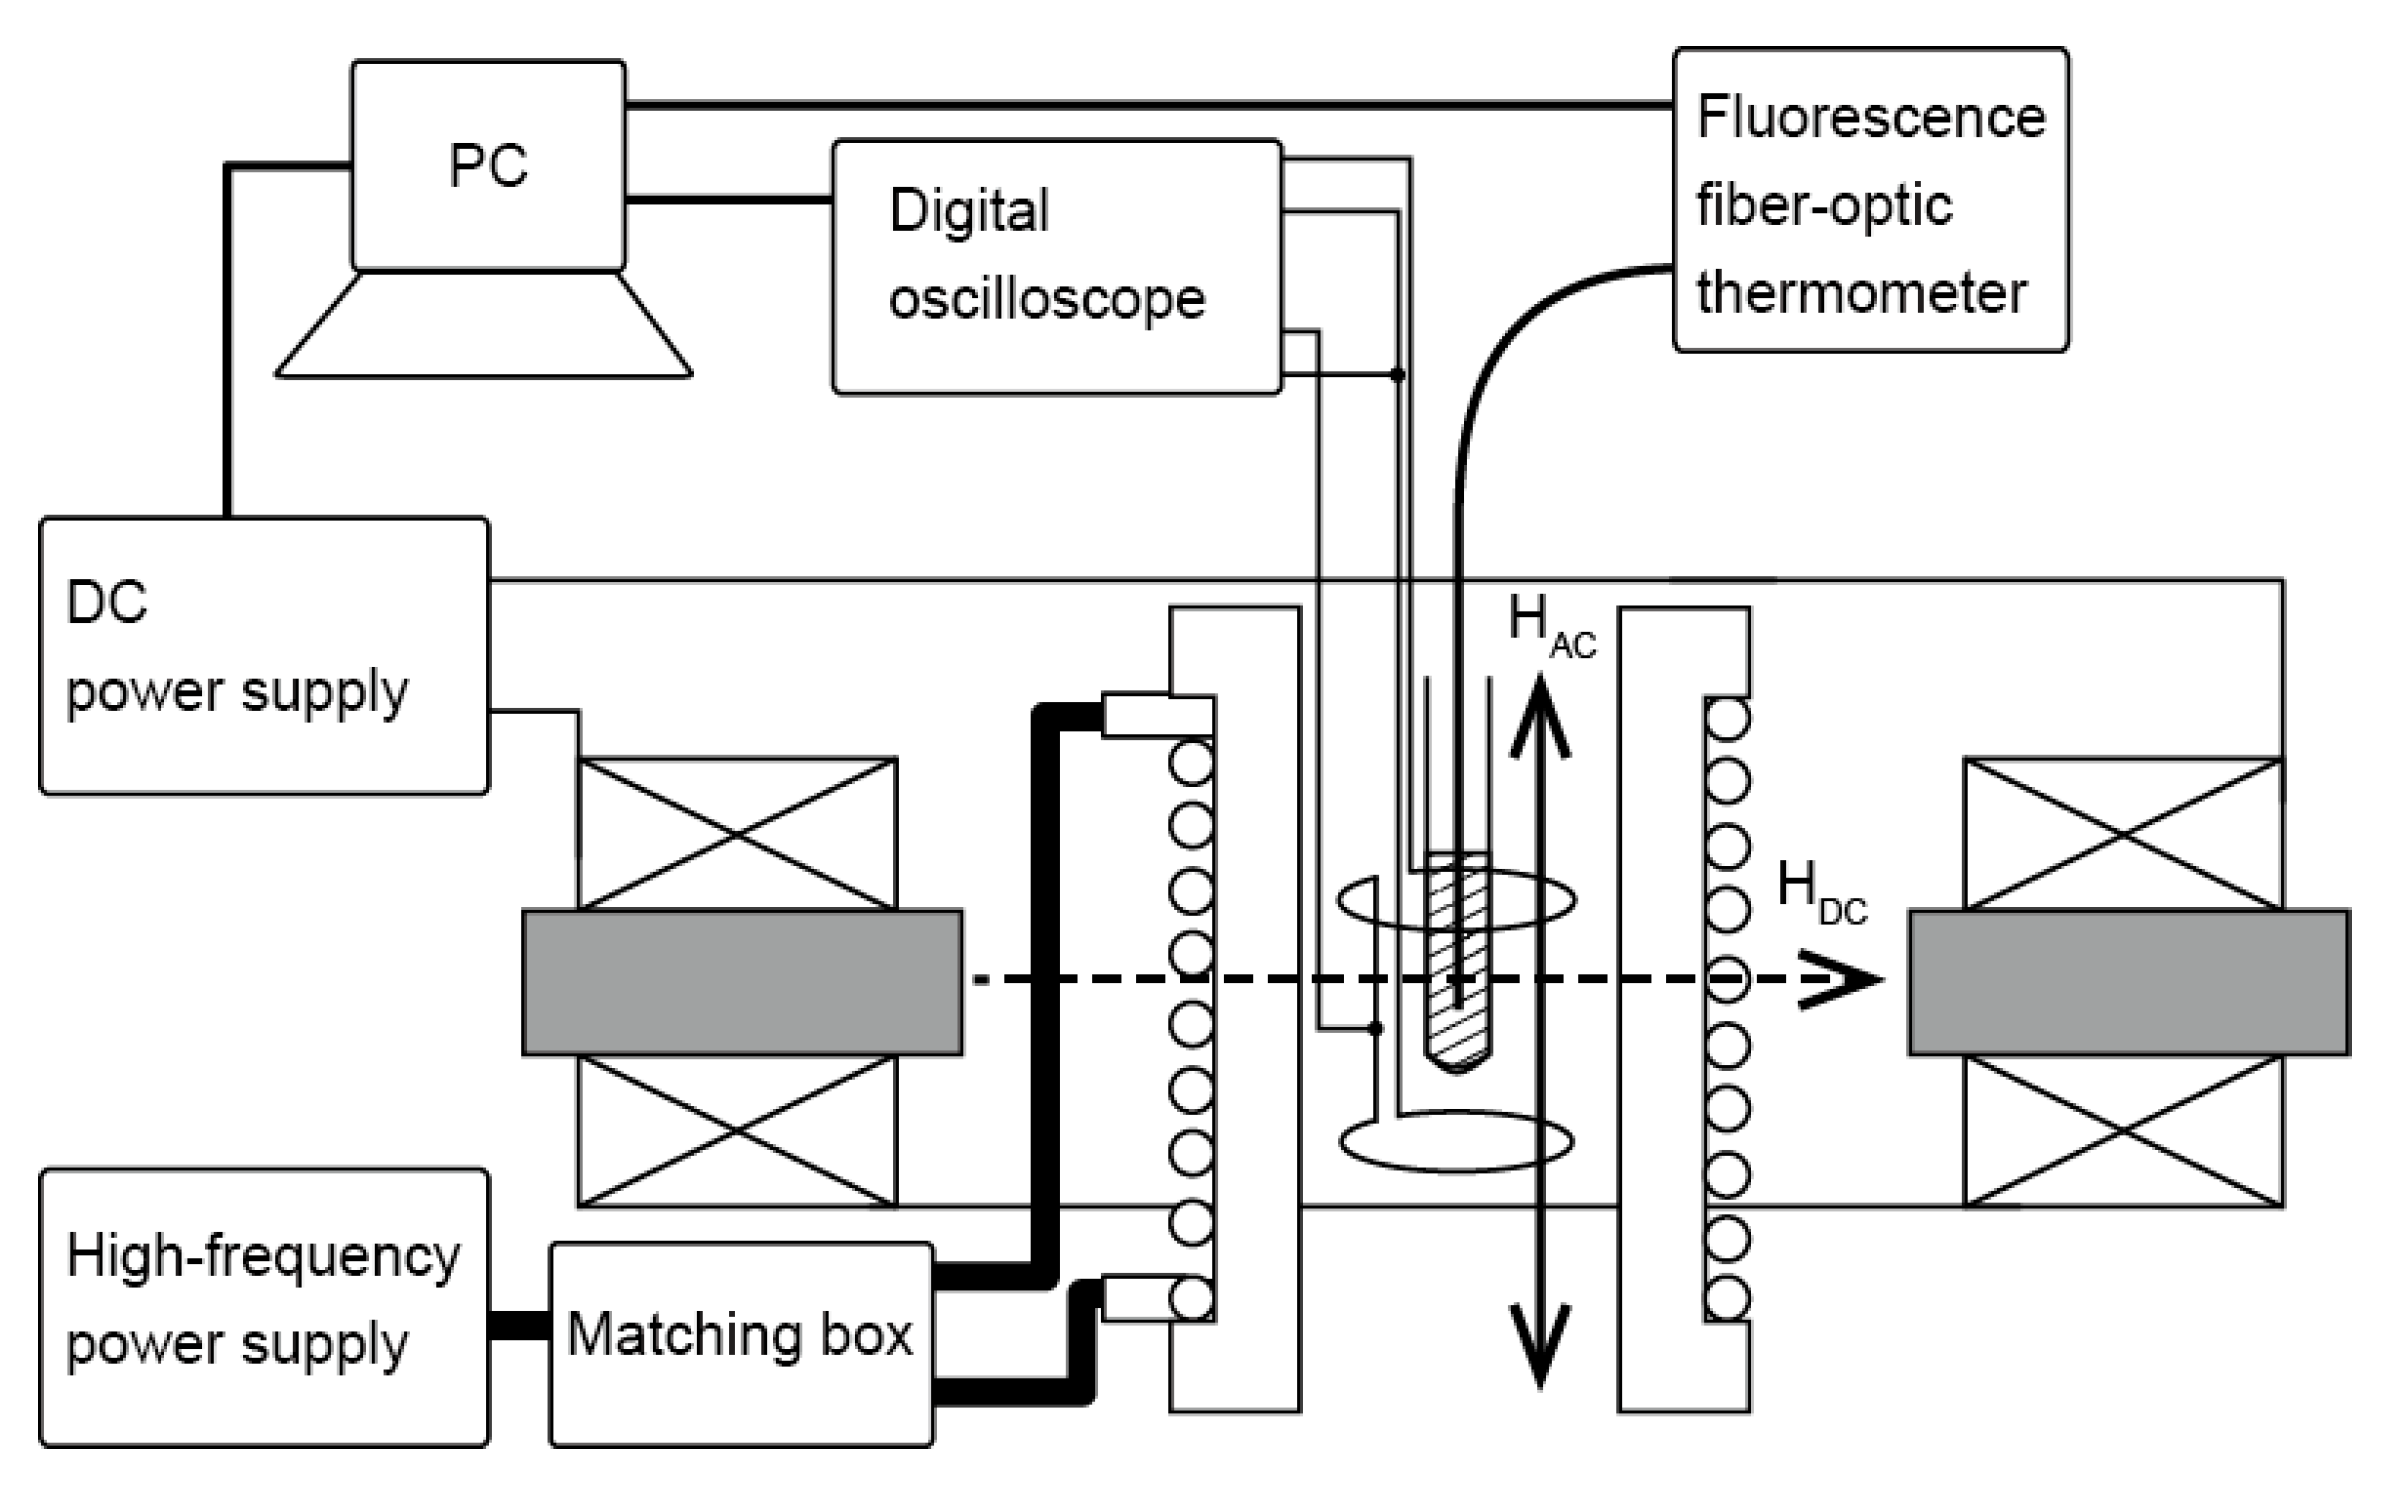
Figure 2 shows a schematic of a home-built experimental apparatus for magnetically induced heating, which is a modified version of the apparatus used in previous studies [
25,
26]. As shown in the figure, an alternating current was applied from a high-frequency power supply (300 W, 200 kHz–3 MHz, T162-5524A, Thamway, Shizuoka, Japan) to an impedance-matched coil through a matching device (T020-5523B, Thamway, Shizuoka, Japan), comprising a variable capacitor connected in series and variable inductance connected in series and parallel to generate an AMF inside the coil. A test tube (polypropylene, ASONE, Osaka, Japan) filled with the sample suspension was placed inside the AMF coil to generate heat. The AMF coil comprised a copper pipe (
ϕ5, 14 turn), and cooling water was circulated inside the copper pipe to suppress the heat generated by the coil itself. The temperature of the suspension was measured using a fiber-optic thermometer (FL-2000, Anritsu, Tokyo, Japan), and data were recorded every second on a PC for the calorimetric evaluation of the SAR of the samples. Dynamic hysteresis of the sample was obtained by calculating the magnetization
M(t) and magnetic field
H(t) as a function of time by connecting a digital oscilloscope (TDS-3012, Tektronix, Beaverton, OR, USA) to two oppositely wound pickup coils connected in series inside the AMF coil bobbin (shown in the
Figure 2) and measuring the electromotive force induced in the coil. This measurement system is similar to the apparatus developed in Ref. [
27]. As shown in
Figure 2, the DC magnetic field was generated perpendicular to the AMF by placing coils with an iron core. The DC magnetic field coils comprised five layers of a polyurethane-coated copper wire (
ϕ1 mm) on bobbins. The coils were connected to a bipolar DC power supply (0–7.5 A, BWS40-7.5, Takasago, Kanagawa, Japan), and current could flow in the positive and negative directions. The variation in the AC and DC magnetic field strength 1 cm above and below the center of the sample was confirmed to be less than 1% using a search coil and Gauss meter (MG-3003SD, Lutron, Taipei, Taiwan).
3. Results and Discussion
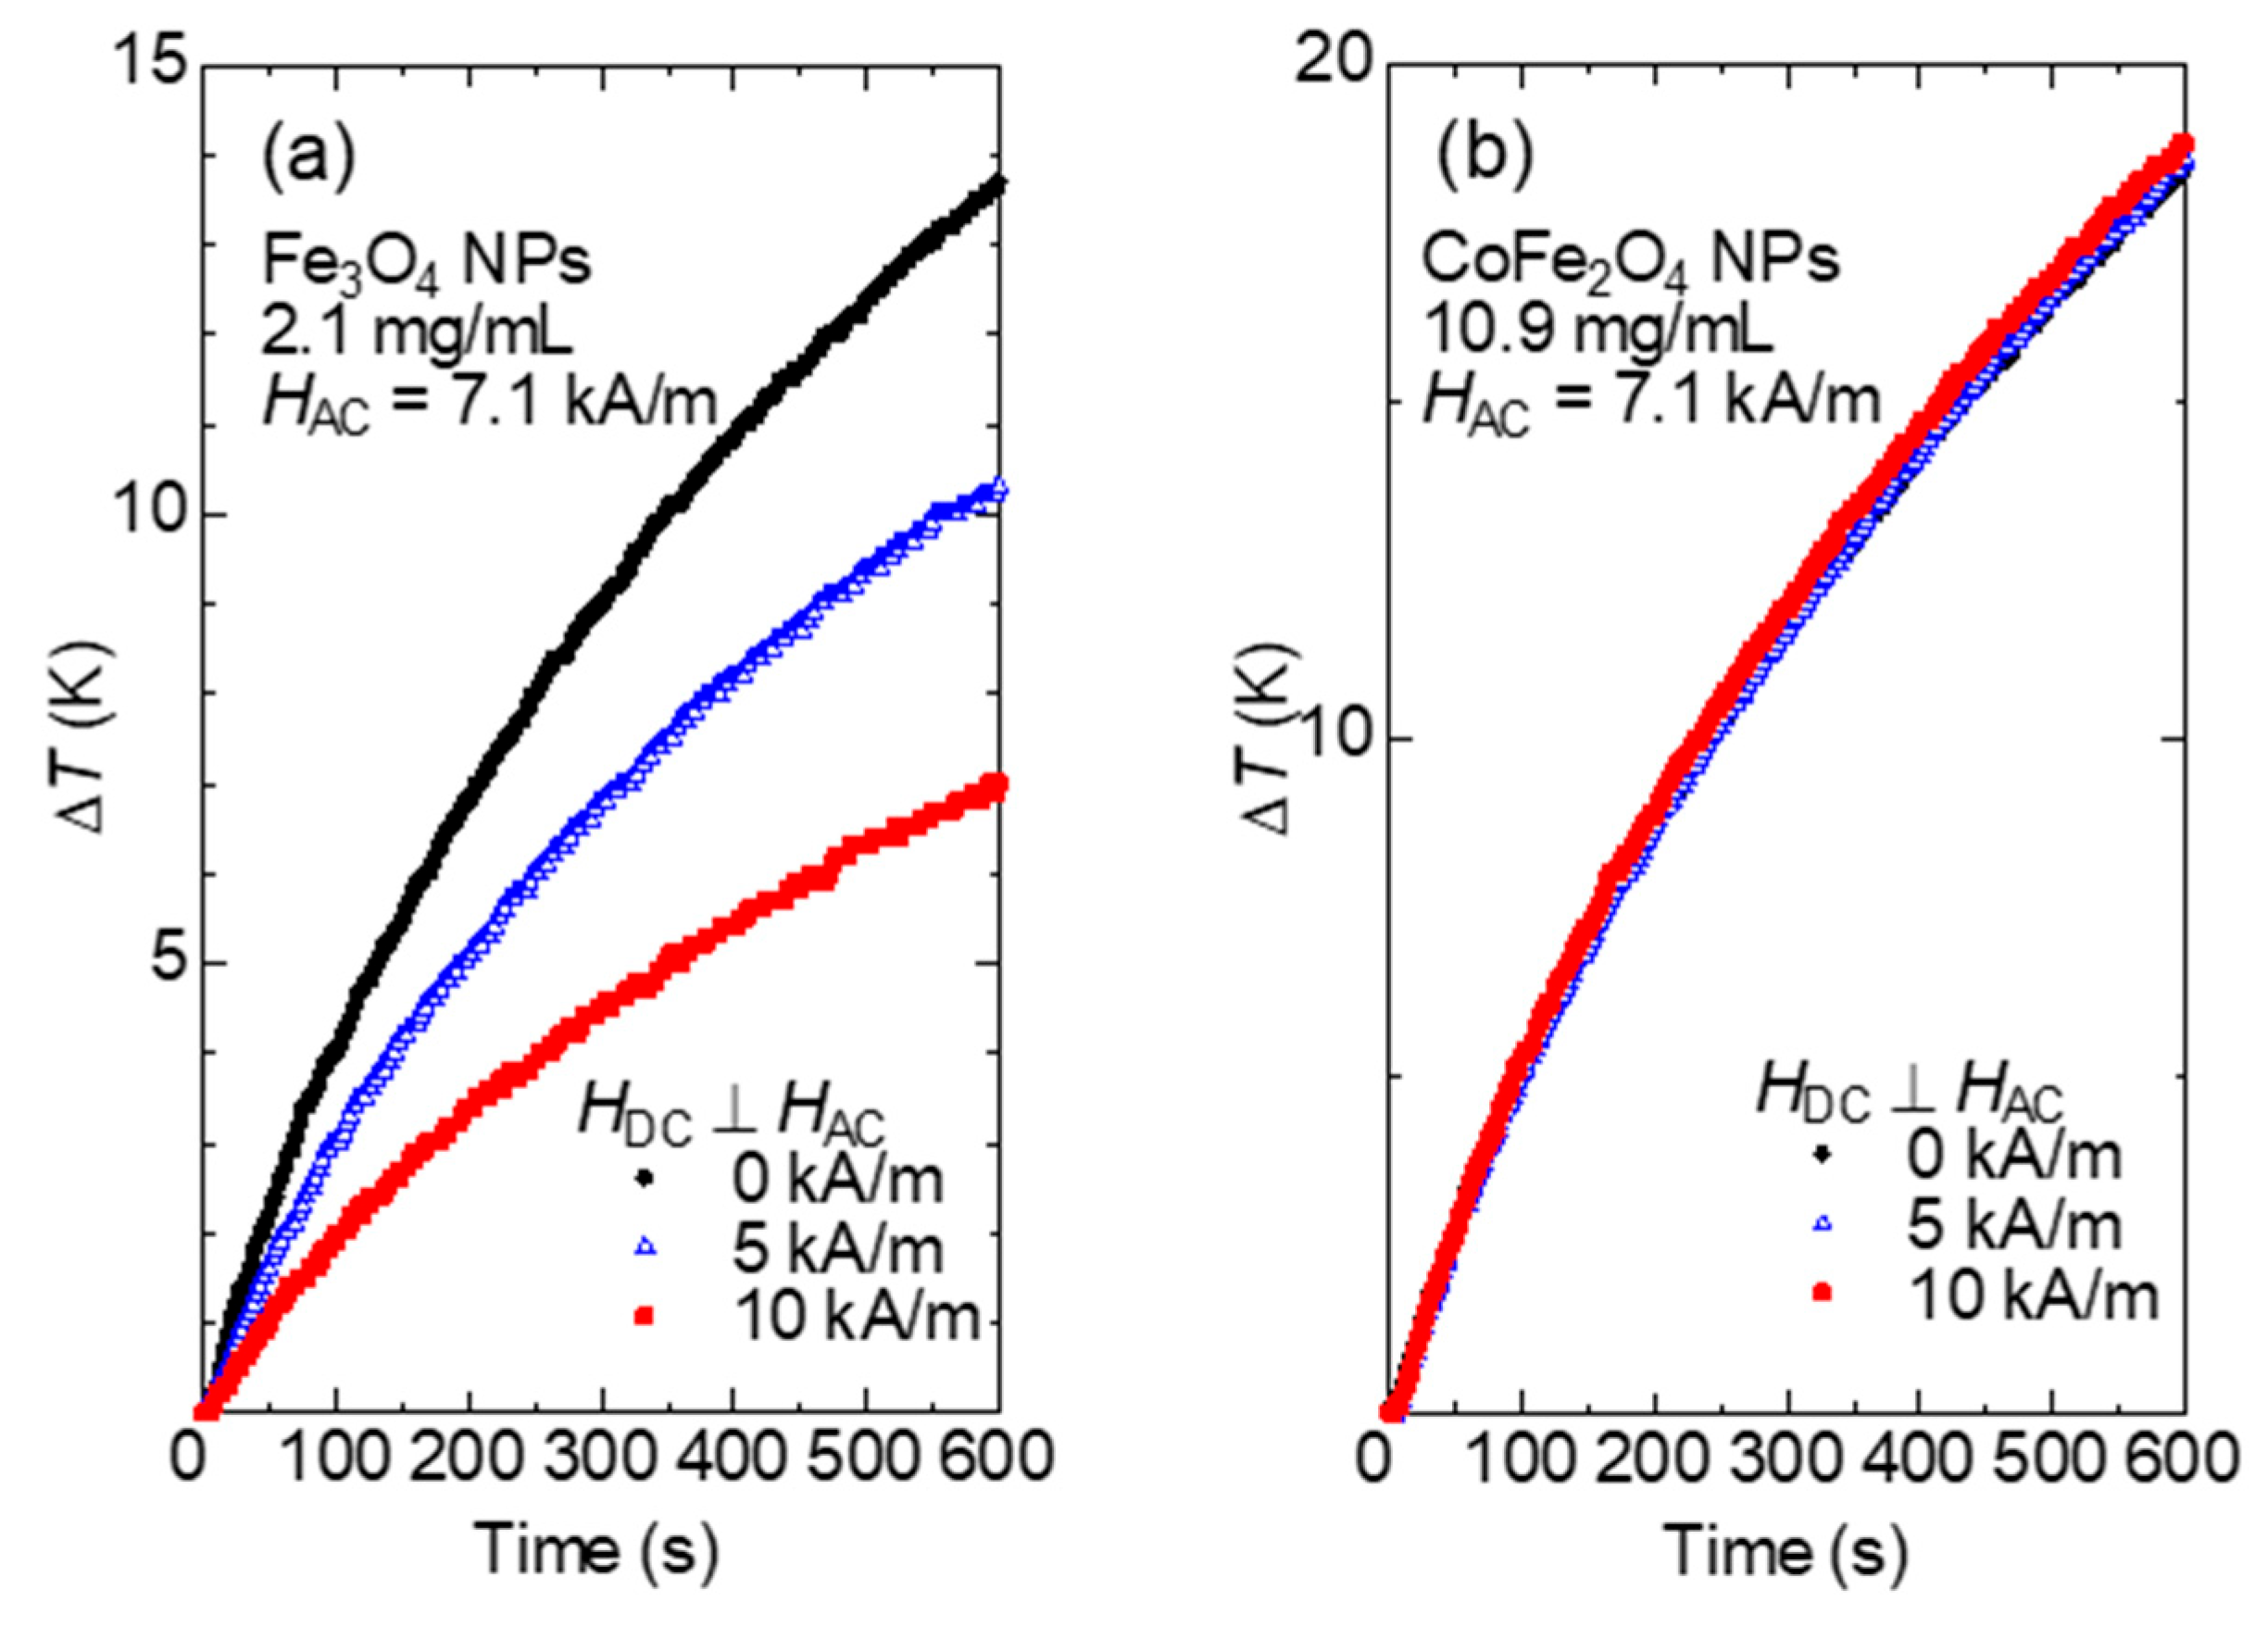
Magnetically induced heating experiments were carried out at a constant AMF frequency of 500 kHz and a constant AMF amplitude of 7.1 kA/m. The DC magnetic field strength
HDC was varied from 0 to 10.0 kA/m.
Figure 3a,b show the representative heating curves for Fe
3O
4 NPs and CoFe
2O
4 NPs, respectively. The initial temperature of the samples (
t = 0) was set to
T = 20 °C for all heating experiments. As shown in
Figure 3a, the temperature increase rate
(initial slope of the heating curve) for Fe
3O
4 NPs decreases significantly at 10 kA/m in comparison with that in the absence of the DC magnetic field, while for CoFe
2O
4 NPs, as shown in
Figure 3b, the heating curves are almost identical regardless of the magnitude of the DC magnetic field. Although the heating curves start to deviate at approximately
t = 200 s, due to differences in the external environment (e.g., room temperature), the SAR calculated by the calorimetric method uses the initial slope of the heating curve, so the SAR is expected to be almost constant regardless of the DC magnetic field. The SAR is calculated from the heating curve by the following equation:
where
C is the heat capacity of the magnetic fluid sample (
C = 2.09 J/K for 0.5 mL deionized water), and
m is the mass of the magnetic particles in the fluid (
m = 1.05 mg for Fe
3O
4 NPs, and
m = 5.45 mg for CoFe
2O
4 NPs). The slope obtained by linear fitting of the heating curve data up to 50 s after the application of the AMF was defined as
.
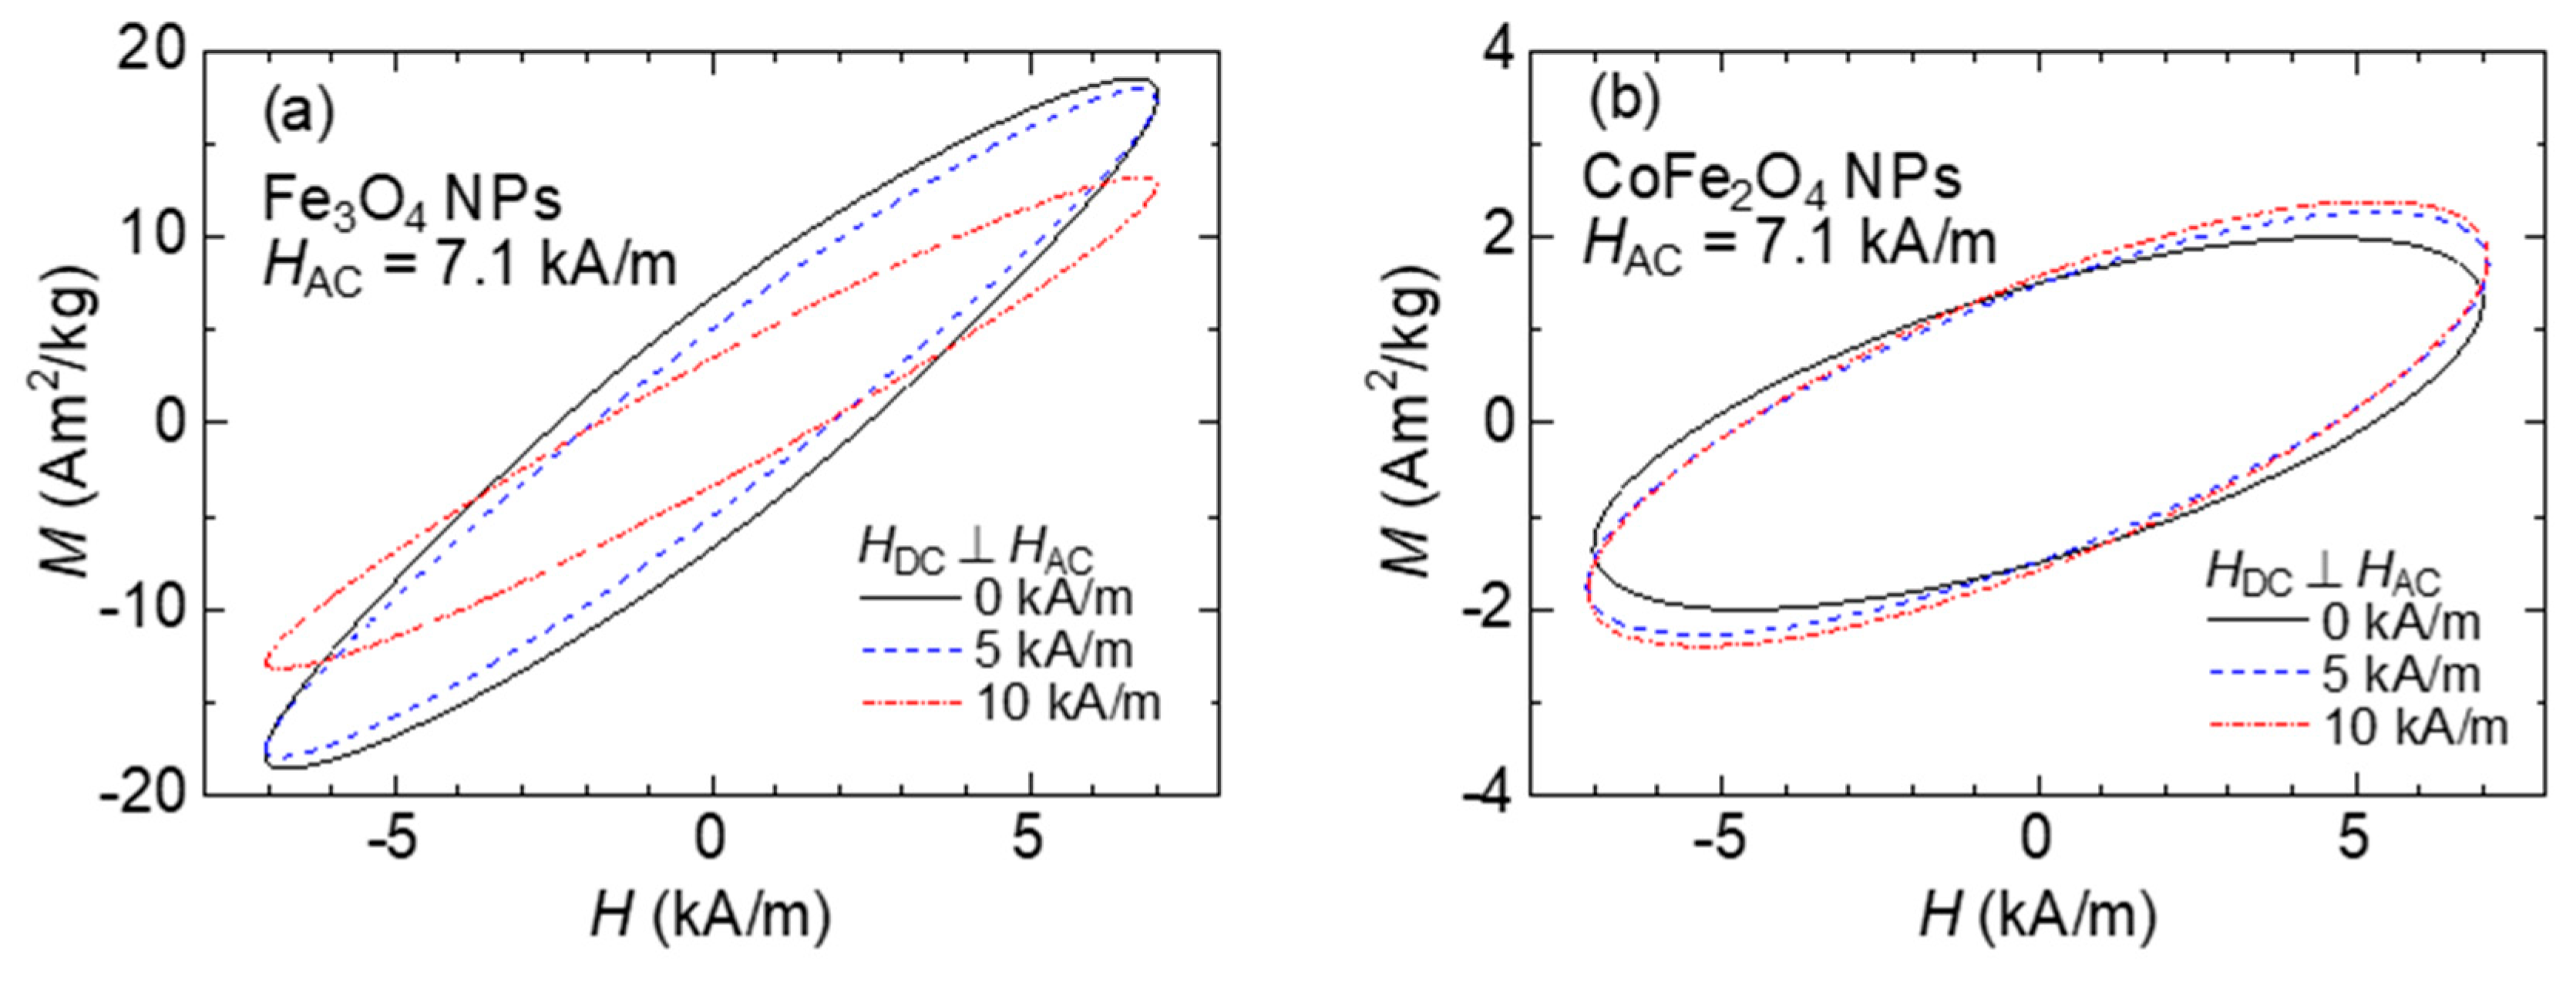
Figure 4 shows the dynamic hysteresis curves measured by the pickup coil. The dynamic hysteresis curves exhibit an elliptical shape with a tilted principal axis, indicating that the time variation of magnetization exhibits a phase lag relative to the magnetic field. Furthermore, the magnetization exhibits a linear response to the magnetic field up to the amplitude of 7.1 kA/m. In the case of CoFe
2O
4 NPs, the shape is almost independent of the magnitude of the DC magnetic field, with no significant change in the internal area of the hysteresis, which corresponds to the amount of heat per AMF cycle. The SAR is expressed by the following equation using the internal area
A of the hysteresis curve:
where
c is the concentration of the magnetic particles in the magnetic fluid, and
f is the AMF frequency.
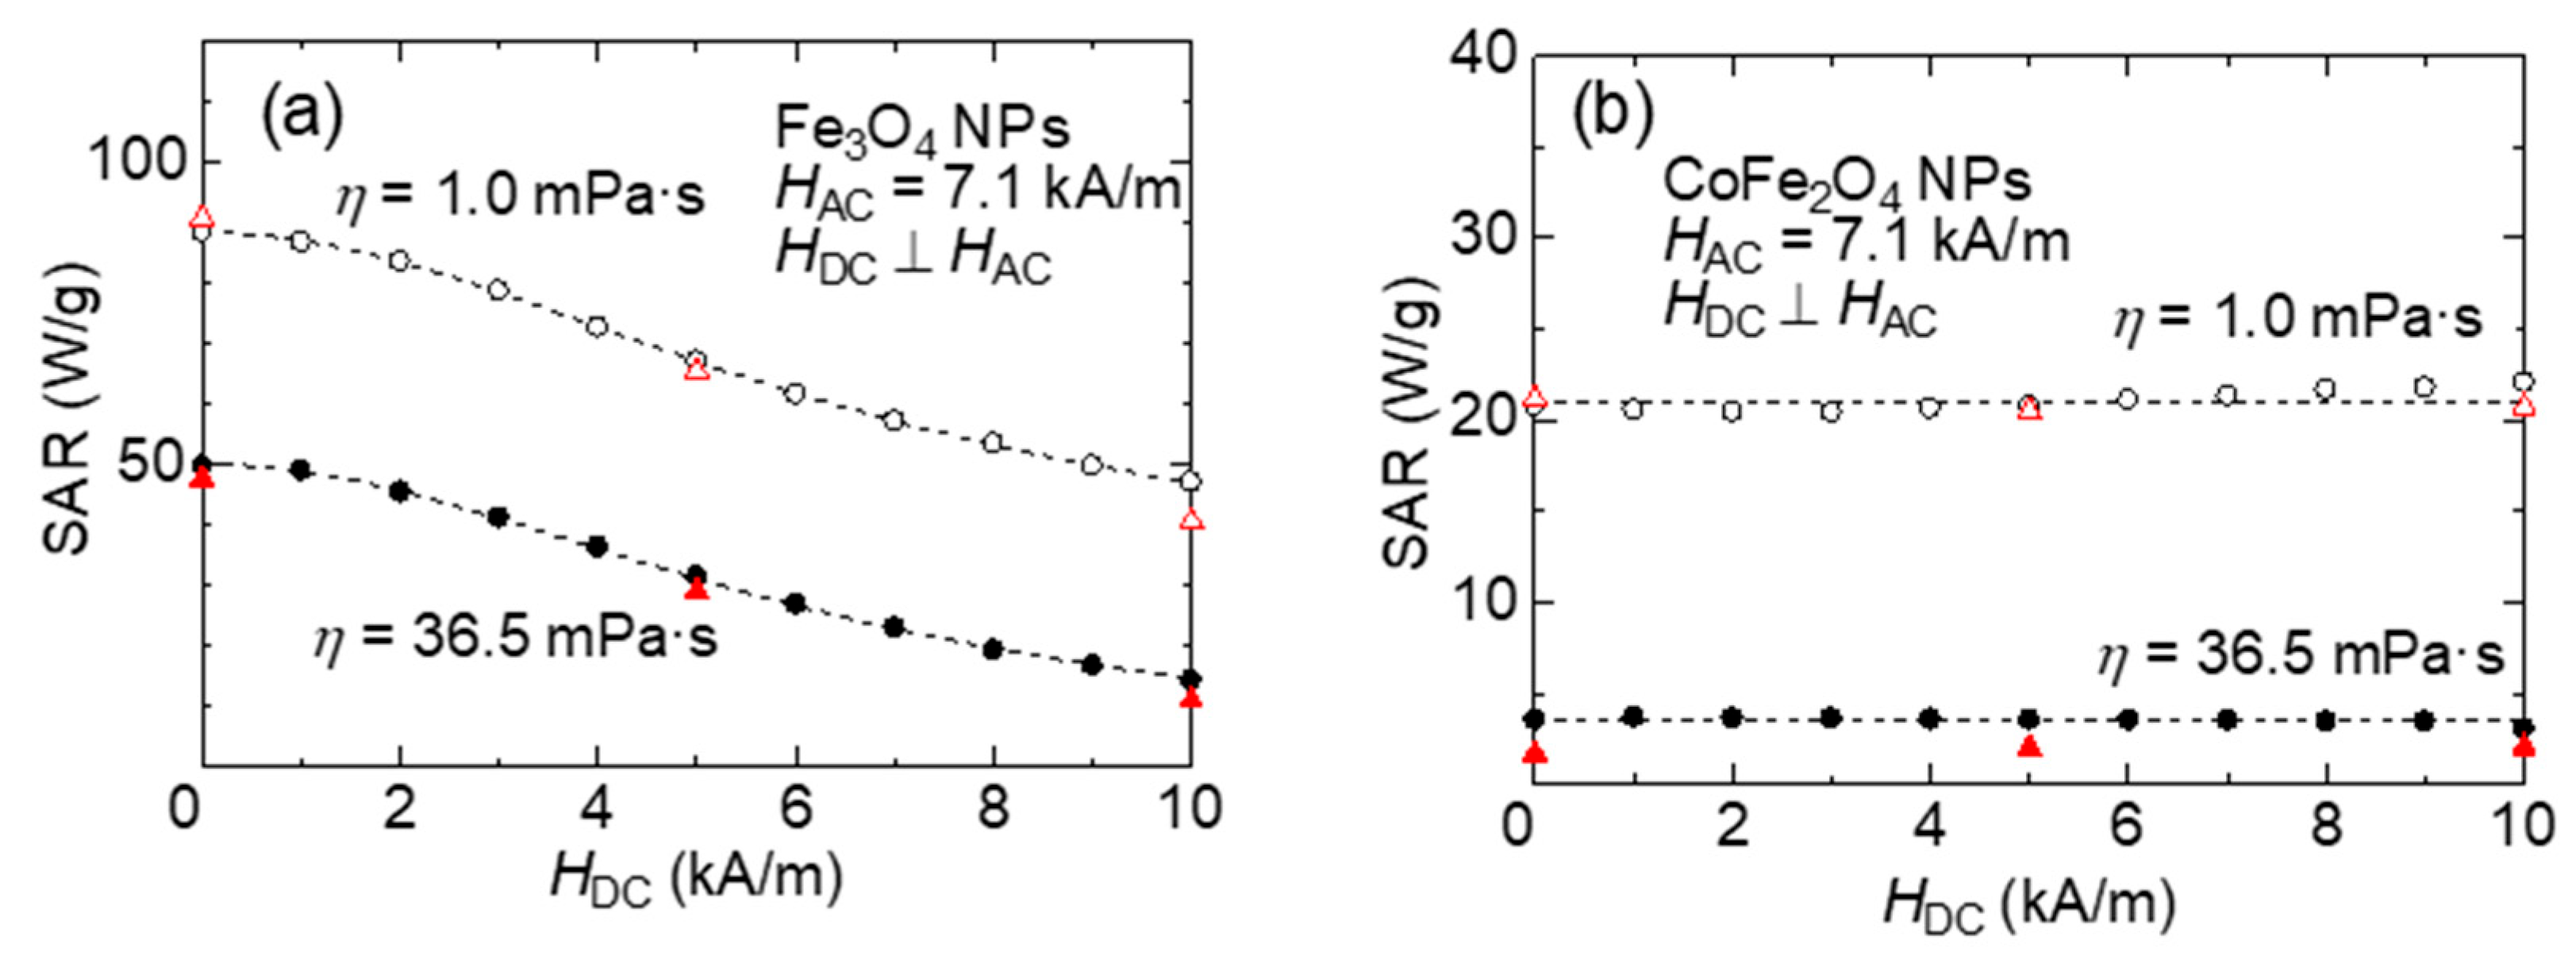
Figure 5a,b show the SARs obtained under each DC magnetic field strength from the above results and plotted against the DC magnetic field strength for Fe
3O
4 NPs and CoFe
2O
4 NPs, respectively. Open triangles and open circles correspond to the results obtained by the calorimetric method and magnetometric method, respectively. As shown in
Figure 5a, the SAR of Fe
3O
4 NPs decreases gradually with the increase in the DC magnetic field strength. The results obtained by the calorimetric and magnetic hysteresis methods were in good agreement. On the other hand, the SAR of CoFe
2O
4 NPs shown in
Figure 5b is almost independent of the DC magnetic field strength.
The heating mechanism of superparamagnetic NPs is explained by the linear response theory (LRT) in the range of low AMF amplitudes, where the magnetization exhibits a linear response to the magnetic field, using the Néel relaxation time
and the Brownian relaxation time
[
28].
and
are expressed as follows:
where
is the time constant, which is typically assumed to be
s,
is Boltzmann’s constant,
is the absolute temperature, and
is the magnetic anisotropy constant of the particle.
is the viscosity of the liquid media in which MNPs are dispersed.
and
are the magnetic and hydrodynamic volumes of the particles, where
is the magnetic diameter of NPs, and
is the thickness of the organic capping layer and nonmagnetic part of the NP. Herein,
nm for the capping layer was assumed.
is the effective relaxation time defined by
, and the maximum heating efficiency is obtained by satisfying
.
To simulate the accumulation of MNPs in cells, glycerol was mixed with the sample solvent, and the viscosity of the solvent was increased to limit the Brownian relaxation. The results obtained by magnetometry are denoted by closed circles, and those obtained by calorimetry are denoted by closed triangles in
Figure 5a,b. As shown in
Figure 5a, for the Fe
3O
4 NP sample dispersed in a 75 wt% glycerol solution (
η = 36.5 mPa·s), the SAR decreases by a constant amount of approximately 40 W/g regardless of the DC magnetic field strength. For the CoFe
2O
4 NP sample dispersed in a 75 wt% glycerol solution, the SAR is considerably reduced (
Figure 5b). This decrease in SAR is considered to be the contribution of Brownian relaxation to heat generation.
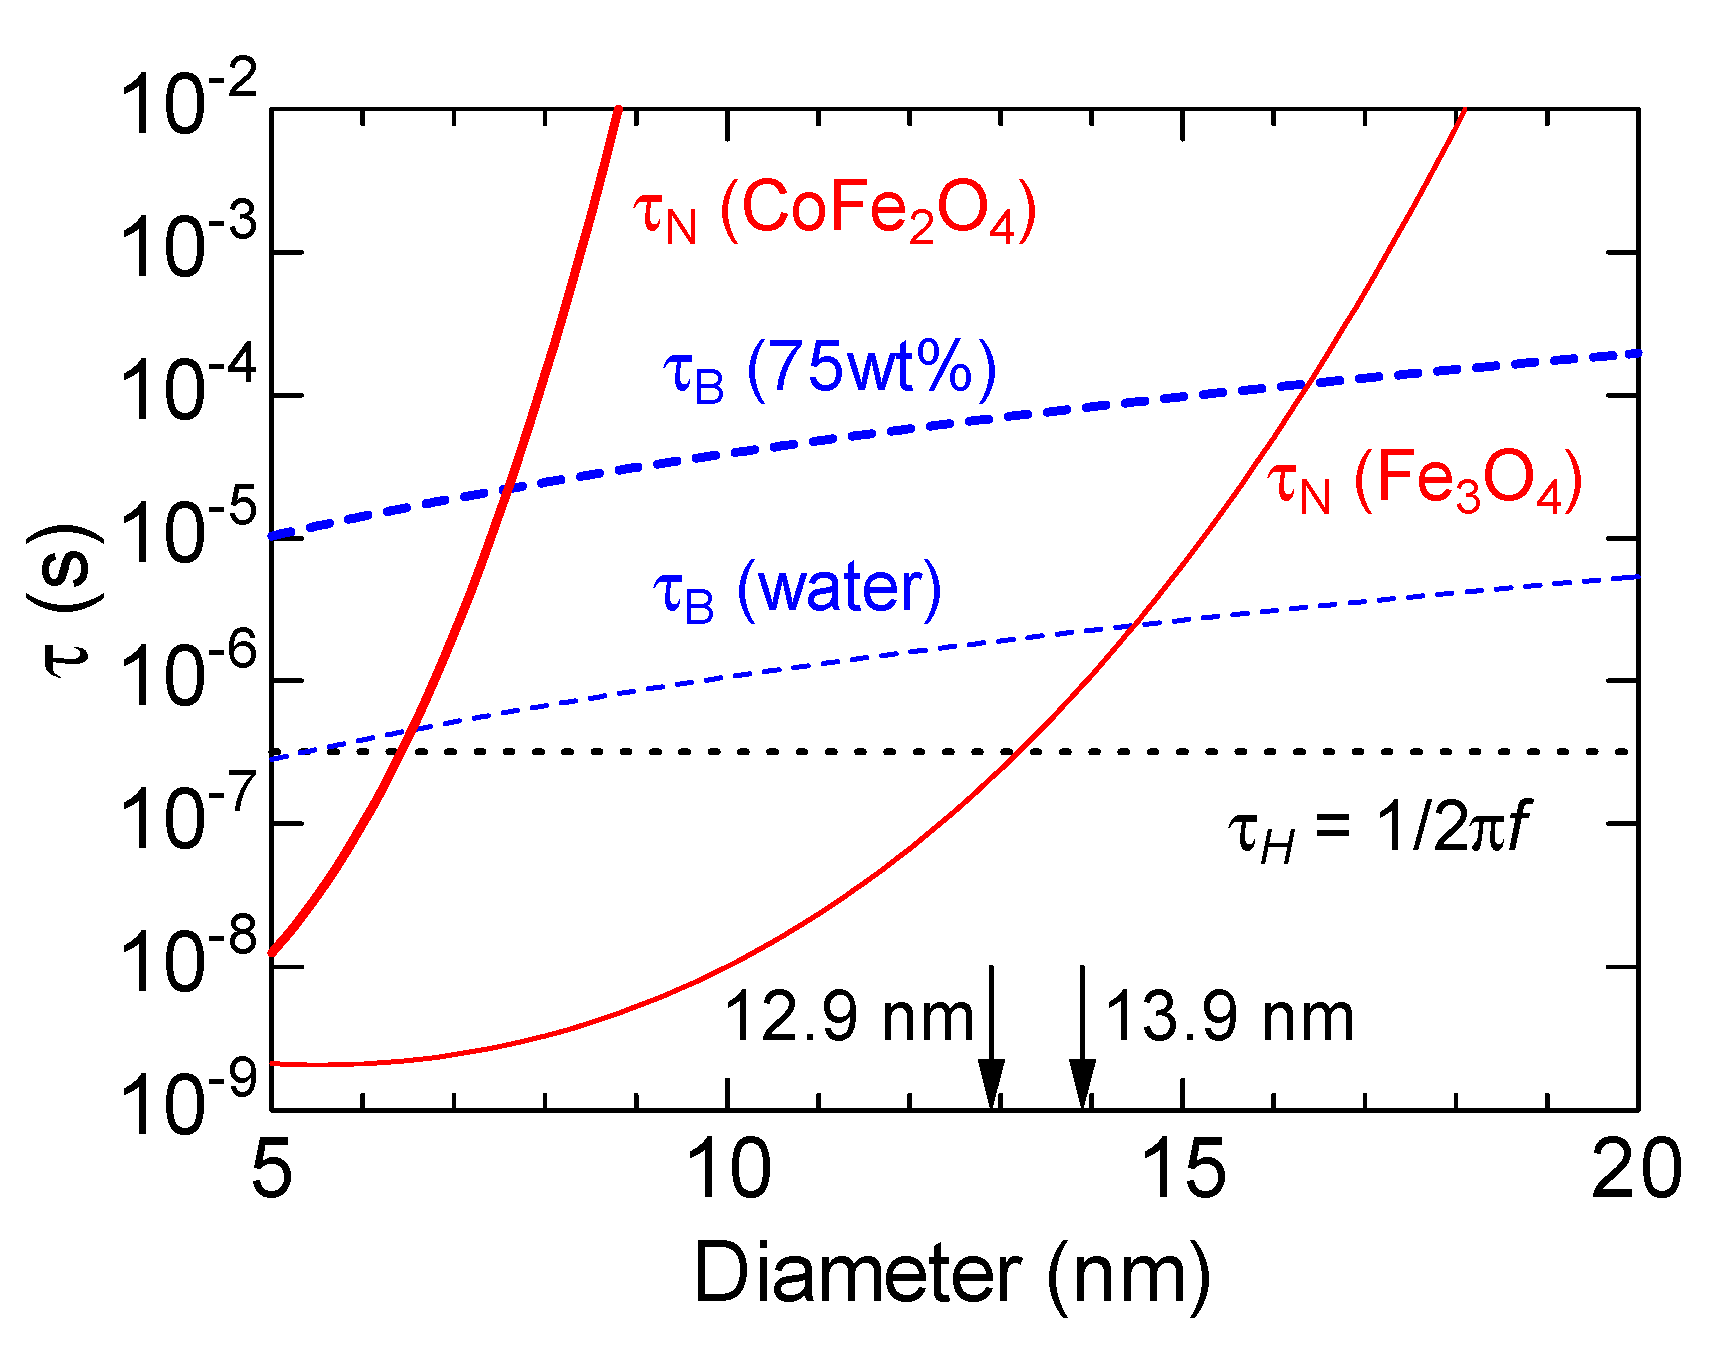
The above results are discussed in terms of the relaxation time.
Figure 6 shows the results obtained from the calculation of the size dependence of the Brownian and Néel relaxation times of the particles using the parameter in Ref. [
28]. The median particle size of the samples used in this experiment is indicated by the arrows in the figure. The AMF frequency used for the measurements was
kHz, and
(the characteristic time corresponding to the maximum heating efficiency condition for the measurement frequency) is indicated by the dotted horizontal line in the figure. The Brownian relaxation time τ
B is the same for the CoFe
2O
4 and Fe
3O
4 NPs as it depends only on the particle size, temperature, and solvent viscosity. The size dependence of τ
B, which is proportional to particle volume, is denoted by the broken lines in the figure for the case with water and 75 wt% glycerin solution as the solvents. The Néel relaxation time τ
N is exponentially dependent on the magnetic anisotropy of the sample; thus, it differs significantly between the two samples. As shown by the thick solid line, τ
N for CoFe
2O
4 NPs is very long even for sizes less than 10 nm owing to the high magnetic anisotropy constant, and at 12.9 nm, it far exceeds the characteristic time of the AMF. On the other hand, the τ
N of Fe
3O
4 NPs, represented by the thin solid line, is comparable to the characteristic time of the AMF even at 13.9 nm.
As the Néel relaxation time of CoFe
2O
4 NPs is sufficiently large relative to the AMF characteristic time, there is no relaxation of the magnetic moment due to thermal fluctuations on the AMF time scale. The Brownian relaxation time τ
B is slightly longer than τ
H for the median particle size of CoFe
2O
4 NPs. However, τ
B and τ
H are of the same order when the size distribution is considered. A part of CoFe
2O
4 NPs is considered to relax against AMF by particle rotation. If the Brownian relaxation time does not depend significantly on the static magnetic field, the SAR of CoFe
2O
4 NPs becomes almost constant regardless of the static magnetic field strength. When the amplitude of AMF is sufficiently small for the magnetization to respond linearly, the Brownian relaxation time
for randomly distributed particles under a DC magnetic field perpendicular to the AMF is expressed by the following equation using
in the absence of a DC magnetic field:
where
is a dimensionless magnetic field parameter,
is the permeability of the vacuum,
is the saturation magnetization of the particle, and
is the Langevin function [
29]. Calculations under the conditions of this experiment (particle diameter
; saturation magnetization
) reveal that
at a maximum magnetic field of
HDC = 10 kA/m, indicative of a small change in
. Furthermore, for samples with a high viscosity solvent, represented by the thick broken line in the figure,
is greater than one order of magnitude longer than the AMF characteristic time; thus, the relaxation owing to particle rotation does not occur, which is consistent with the fact that the heat generation in CoFe
2O
4 NPs dispersed in the glycerol solution almost disappears. These properties of CoFe
2O
4 NPs are disadvantageous in comparison with those of Fe
3O
4 NPs in terms of heat generation control by static magnetic fields. In addition, the CoFe
2O
4 NPs are not suitable for MFH because their heat generation is suppressed in the in vivo environment, where the viscosity is high, and particle rotation is often suppressed.
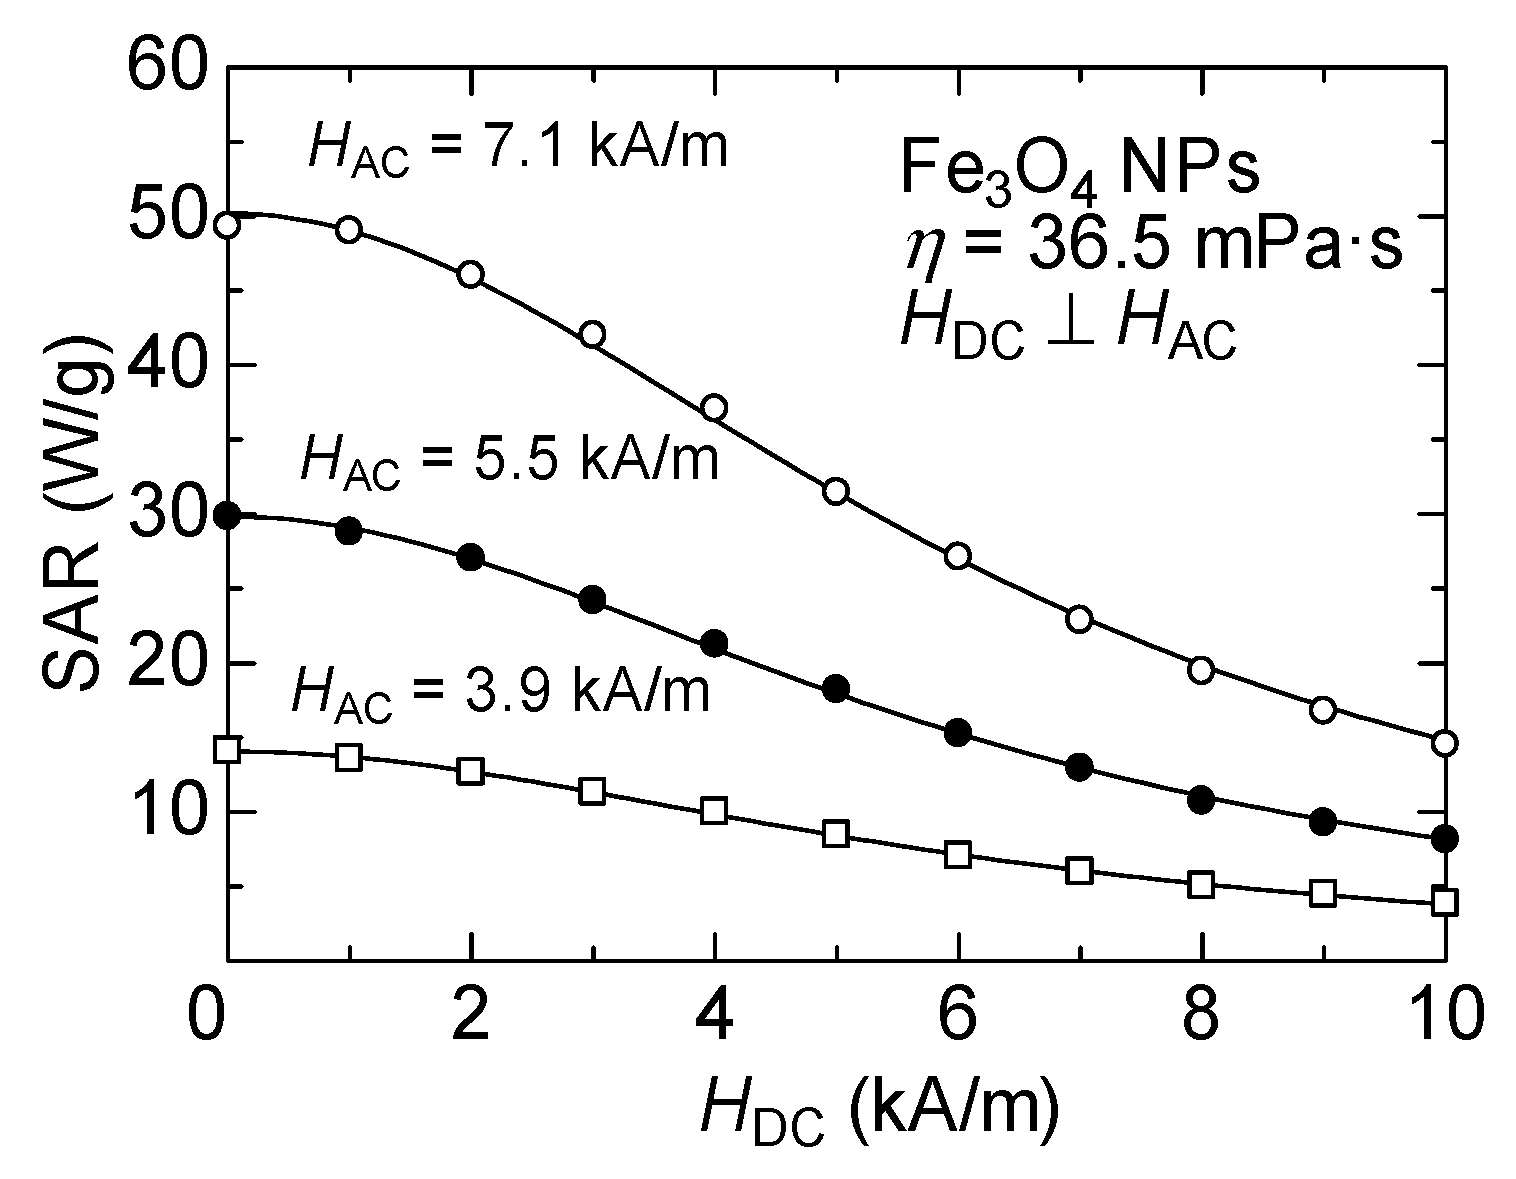
Figure 7 shows the results of the DC magnetic field dependence of SAR measured by varying the AMF amplitude for a Fe
3O
4 NP sample dispersed in a high-viscosity solvent, i.e., where Brownian relaxation is suppressed, and heating only occurs due to Néel relaxation. As shown in the figure, the SAR decreases gradually with the increase in the DC magnetic field strength under all AMF amplitudes. Theoretically, the static DC magnetic field dependence of the Néel relaxation time is even more complicated than Brownian relaxation, and an analytical expression is not obtained for the sample with the random distribution of the easy axis [
30]. However, this DC magnetic field dependence of SAR can be phenomenologically well fitted by the following equation:
where
a corresponds to the SAR value without the DC magnetic field, and
Ha is the fitting parameter. The
Ha obtained from the fits shown by the solid lines in
Figure 7 are
Ha = 6.5, 6.1, and 6.1 kA/m for AMF amplitude
HAC = 7.1, 5.5, and 3.9 kA/m, respectively. In a similar phenomenological analysis conducted by Murase et al. [
16], it was assumed that
Ha =
HAC under the application of a magnetic field with a gradient, rather than a uniform DC magnetic field. In contrast, the present results show a slight dependence of
Ha on the AMF amplitude. This parameter is considered to be intricately related to the dynamic magnetic properties of the nanoparticle materials. Therefore, to discuss the DC magnetic field dependence quantitatively, analysis by numerical simulations using the LLG equation is essential [
31,
32].
Notably, the SAR of Fe
3O
4 NPs is a single-valued function that monotonically decreases with respect to the DC magnetic field, suggesting that the heat generation can be easily controlled by the DC magnetic field while maintaining the AMF amplitude constant. Several techniques have been proposed for noninvasive temperature measurement of the affected area during MFH via the detection of the harmonic magnetization signal, attributed to the nonlinearity of the magnetization of the NPs under the application of a large AMF [
33,
34,
35]. Although it is possible to control the affected area to a specific temperature during treatment by changing the AMF amplitude, changing the AMF amplitude may not provide a sufficient signal intensity as required by these techniques. Therefore, stabilizing the temperature of the affected area by controlling the amount of heat generated under the application of a DC magnetic field may be beneficial for future MFH applications combined with noninvasive thermometry.


