Abstract
This work addresses a critical challenge in microscale computational electromagnetics for liquid crystal-based reconfigurable components: the inadequate capability of current software to accurately identify and simulate higher-order modes (HoMs) in complex electromagnetic structures. Specifically, commercial simulators often fail to capture modes such as Transverse Electric (TE11) beyond the fundamental transverse electromagnetic (TEM) mode in coaxial liquid crystal phase shifters operating in the terahertz (THz) regime, leading to inaccurate performance predictions and suboptimal designs for telecommunication engineering applications. To address this limitation, we propose a novel diagnostic methodology incorporating three lossless assumptions to enhance the identification and analysis of pseudo-HoMs in full-wave simulators. Our approach theoretically eliminates losses associated with metallic conductivity, dielectric dissipation, and reflection effects, enabling precise assessment of frequency-dependent HoM power propagation alongside the primary TEM mode. We validate the methodology by applying it to a coaxially filled liquid crystal variable phase shifter device structure, underscoring its effectiveness in advancing the design and characterization of THz devices. This work provides valuable insights for researchers and engineers utilizing closed-source commercial simulators in micro- and nano-electromagnetic device development. The findings are particularly relevant for microscale engineering applications, including millimeter-wave (mmW), sub-mmW, and THz systems, with potential impacts on next-generation communication technologies.
1. Introduction
Through strategic partnerships across academia, industry, and society, the engineering simulation code Ansys has established a significant global presence, serving over 2900 universities across 86 countries as of 2023 [1]. This extensive customer portfolio highlights Ansys’ considerable reach and appeal, surpassing many competitors in the electronic design automation (EDA) software market. One of its flagship products is the high-frequency structure simulator (HFSS) [2], a commercially available, proprietary software renowned for its versatility in full-wave numerical simulations of modern electronics [3,4], including components and systems [5,6], across the microwave (MW) [7,8], millimeter wave (mmW) [9,10], and beyond (e.g., sub-mmW [11] and THz [12]).
A major challenge in past simulations and computations with this closed-source software has been the lack of transparency regarding the computational methodologies employed, particularly due to reliance on commercial off-the-shelf software rather than custom in-house solutions. This lack of clarity has resulted in a series of interconnected “black boxes”, undermining the accuracy and reliability of numerical predictions. For example, there has been longstanding uncertainty about whether higher-order modes (HoMs) are included and how they couple with the conventionally assumed transverse electromagnetic (TEM) single-mode operation in MW and mmW transmission lines [12,13] of microscales when accommodating liquid crystal (LC) [9] for compact reconfigurable applications [12], other than using bulky, power-consuming, and non-planar waveguides. Although HoMs can be useful in some specialized applications (e.g., certain types of waveguides or resonators), in most transmission line applications, the lines are generally designed to operate below the dominant mode cut-off frequency to avoid HoM propagation, aiming for cleaner, simpler signal transmission. The presence of HoMs can distort the transmitted signal (dispersion due to diverse propagation speeds) and incur additional insertion losses (high attenuation) and return loss (due to impedance mismatching) issues, all of which lead to undesirable performance degradation.
Electromagnetic simulations play a crucial role in the development of advanced THz technologies, particularly for LC-based phase shifters [14,15]. These devices are integral to numerous applications, including wireless communication and radar systems, due to their unique ability to manipulate electromagnetic waves with high precision. However, the accurate simulation of such devices remains a significant challenge, particularly in the context of HoMs that emerge in real-world implementations. In real devices, the presence of misalignments, material defects, and imperfections in single TEM structures can induce HoM propagation. This phenomenon is especially pronounced in systems operating at higher frequencies, e.g., the THz or sub-THz regimes. The design of transmission lines with HoM suppression features—such as dampers and specialized waveguides [16]—is a well-established practice. However, as frequency increases, these suppression methods become less effective, underlining the importance of reliable simulation frameworks. The accurate modeling of HoM behavior is particularly critical for THz applications, where traditional suppression techniques encounter fundamental physical limitations. In this context, without confidence in the computational capability to predict HoMs, the validity of principal (TEM)-mode results from transmission line models is questionable, and the conclusions drawn from these simulations may need re-evaluation unless the HoM-free assumption is justified. This gap in scientific understanding significantly impedes the progress of research and development in next-generation LC-incorporated MW [17], mmW [9], and THz [12] applications (e.g., 5G and 6G communications [18,19]), which are critical to meeting project deadlines and budgets in a rapidly evolving field [20,21].
To address this issue, engineering and reverse-engineering efforts in modeling are required to enhance understanding and practical experience with detailed computational treatments of HoMs by simulations, including excitation, propagation, and coupling, particularly within the default single-mode operation settings commonly used. This paper investigates the classic TEM-enabled coaxial cable structure—an ideal model for rigorous analysis due to its simplicity and effective interference shielding [22]—using HFSS simulations to determine whether HoMs are automatically excited when the frequency exceeds the cut-off frequency () but only a single mode is set by default. In the coaxial structure, the potential generation of HoMs affects the forward transmission coefficient (), while ohmic losses in the metal conductor, dielectric losses in the filling medium, and return loss () also influence the insertion loss (). To this end, the main theoretical innovations of this work lie in the methodological efforts to isolate the impact of HoMs, and hence formulate a diagnostic approach for HoM identification. To be more specific, we first eliminate the effects of ohmic and dielectric losses on by using idealized conditions: perfect electric conductors (PECs) for the coaxial cable’s inner and outer conductors (roughness-free assumption), and vacuum as the filling medium instead of the functional but lossy liquid crystals, which serve as tunable dielectrics for phase-shifting applications in our previously established works [9,12,17]. Under these ideal conditions, the forward transmission parameter will be influenced solely by HoMs, with being further excluded by a non-renormalization approach, as outlined in Section 2.2.
2. Materials and Methods
A novel lossless modeling strategy is introduced to facilitate the diagnostic detection of HoMs for the first time. As illustrated in Figure 1, a specified amount of electromagnetic (EM) wave energy, initially in the TEM mode—standard for 50 Ω applications—is injected into the transmission line (specifically, a coaxial topology in this study). The output power () is measured with the assumption that it is detectable solely through a TEM-mode connector and cable, which is standard for industry applications. To create a lossless environment for the fundamental TEM mode, material losses from the conductor and dielectric, as well as reflection losses, are mitigated. Detailed implementations of these considerations are discussed in Section 2.1 and Section 2.2 In this controlled environment, if an HoM is generated within the coaxial transmission line, the energy of the fundamental mode () will be diminished by the HoM, in accordance with the principle of energy conservation. A finite-element method (FEM)-based numerical solution is developed using geometry-conformal meshing with adaptive refinement, tailored to the geometry and material properties described above. This approach translates Maxwell’s equations into a computational framework. The initial meshing is performed by refining based on the wavelength, with a default target of one-third of a wavelength for first-order-basis functions. The convergence threshold is consistently set to a maximum delta S of 0.01 throughout the analysis. Figure 2 illustrates the iterative procedures employed to achieve the broadband solution in this study.
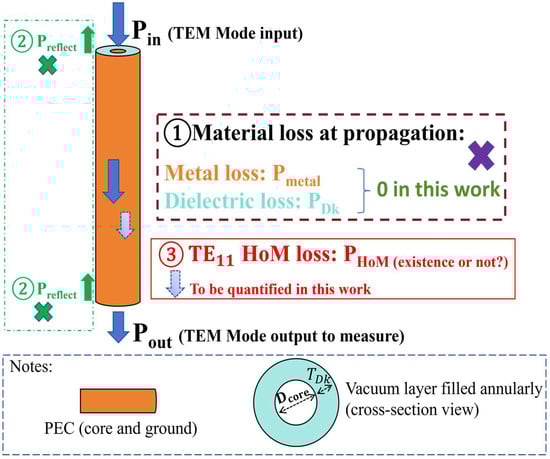
Figure 1.
Illustration of power flow in a lossless coaxial transmission line phase shifter model under computational electromagnetic tests in this work (note that replacing the liquid crystal-filled dielectric layer with vacuum in the model serves a diagnostic purpose for HoMs in this study). The arrows indicate the direction of power flow.
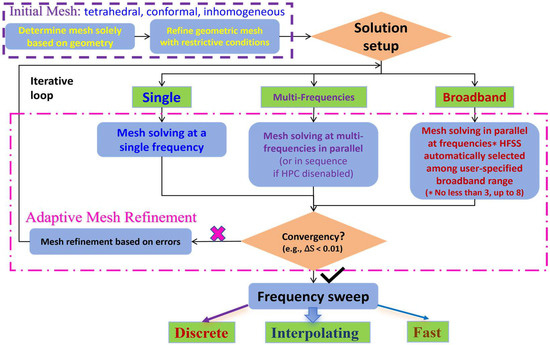
Figure 2.
Flow charts of the finite-element procedure for numerically solving our tunable dielectric-filled coaxial phase shifter using broadband and single-frequency adaptive meshing refinement paradigms.
When using HFSS (version 2022 R1) for simulations, the integral line of the wave port is typically aligned with the direction of the electric field of the fundamental mode. The presence of an HoM may alter the directionality of the electric field component along the integral line or reduce its intensity compared to the fundamental mode-only scenario. The characteristic impedance () of the fundamental TEM mode, and the cut-off frequency () for the first HoM, i.e., TE11 mode [23,24], are described by the equations provided in (1) and (2), respectively, which can be found in canonical books or lectures, and confirmed mathematically from our previous studies on LC-combined coaxial phase shifters [9,12]. Here, the denoted critical geometry parameters (as shown in Figure 1) are the core line diameter () and the dielectric thickness () of the filler material between the two conductors. represents the effective dielectric constant (Dk) of the transmission line structure, and c is the speed of light.
This study examines two coaxial geometries (designs): one with a cut-off frequency () of 375 GHz for THz applications and another with an of 60 GHz for mmW applications. The comparative analysis and cross-benchmarking of these designs are intended to highlight the susceptibility of HoM excitation within the traditionally single-mode TEM setting of the simulator. Interestingly, this susceptibility is expected to be more pronounced when operating the 60 GHz cut-off design within the 375 GHz frequency band. The numerical quantification focus is on the forward transmission coefficient () across the spectrum from 325 GHz to 425 GHz. Section 2.1 and Section 2.2 propose methodologies to enforce a lossless environment, isolating any remaining losses as attributable solely to HoMs.
2.1. Eliminating Metal and Dielectric Losses Through PEC and Vacuum Approximations
To eliminate metal and dielectric losses, perfect electric conductor (PEC) boundaries are employed for the conductors, and a vacuum dielectric is used to fill the coaxial line. This approach effectively removes contributions from metal and dielectric losses, leaving reflections and HoMs as the remaining potential sources of losses. The relative permittivity () is set to 1, corresponding to the dielectric constant of vacuum, due to the complete wave occupancy [9] in the single dielectric-embedded TEM structure.
For the industry-standard 50 Ω design, we derive the cross-sectional sizes, i.e., core diameter () and dielectric thickness (), using Equations (1) and (2) for a cut-off frequency () of 375 GHz. The calculations yield = 154.18 µm and = 100.29 µm, with the coaxial line length fixed at 1 cm as per the per-unit-length paradigm. It is important to note that the guard band design, as initially proposed in [12], introduces a conservatism that may obscure the detection of pseudo-HoMs. This design strategy [12], which includes additional margins to accommodate manufacturing tolerances or modeling inaccuracies, can adversely impact the figure of merit (FoM) and complicate manufacturing processes, thus increasing costs. Consequently, we have opted to omit the guard band assumption in the current HoM-identifying capability analysis with HFSS. Following the analysis of the coaxial line with a TE11 mode cut-off frequency of 375 GHz, we proceed to examine an ideal coaxial line with a TE11 mode cut-off frequency of 60 GHz. This comparison is performed across the same frequency sweep range of 325 GHz to 425 GHz to amplify HoM vulnerability. Using Equations (1) and (2) for an of 60 GHz, the resulting dimensions are = 626.83 µm and = 963.62 µm, while maintaining the coaxial line length at 10 mm. Table 1 summarizes the dimensions of both designs.

Table 1.
Geometrical configurations designed for HoM existence and TEM-mode purity analysis.
For simulating both designs in HFSS, the maximum allowable S-parameter error for convergence is uniformly set at 0.01 (maximum delta S), and the maximum number of iterations before forced termination is capped at 20. The broadband adaptive solution covers the frequency range from 325 GHz to 425 GHz, employing interpolation sweeping. The frequency sweep consists of 401 discrete points with a step size of 0.25 GHz.
2.2. Minimizing Reflection Losses Through Non-Renormalization Techniques
In accordance with the power dissipation mechanism depicted in Figure 1, reflection loss (return loss) must be disabled (or minimized) to isolate the potentially excited HoM from the dominant TEM mode. This can be achieved computationally by deactivating the renormalization function of the wave ports during the post-processing phase in HFSS, as detailed in Table 2 for the difference.
Table 2.
Impact of wave port renormalizations (or not) on reflection loss and hence HoM power.
It is important to note that while disabling the renormalization for both wave ports (input and output at ports 1 and 2, respectively) eliminates reflections at the interfaces of these ports, it may not fully eradicate reflections associated with HoM propagation within the line. To assess the impact of these reflections, we compare non-renormalized results with renormalized results. This comparison aims to verify the complete removal of return loss effects, which arise from impedance mismatches both at the port interfaces for the TEM mode and during the propagation of HoMs (geometry or dielectric discontinuities).
2.3. Benchmarking Uncertainties and Revealing Mode Purity to Improve Predictive Accuracy
Although HoMs can be isolated and quantified using the methods proposed in Section 2.1 and Section 2.2, there are still uncertainties inherent in numerical simulations that may lead to false positives. Specifically, an identified HoM might result from computational noise rather than genuine excitation. To address this issue, we implement an additional countermeasure by comparing the results with a convergence gauge, specifically the maximum delta S used to terminate the iterative calculations (set to less than 0.01 in this work). If the numerically measured HoM power (in dB or W) exceeds the maximum delta S (in dB or W accordingly), it is considered that the HoM is truly excited and propagated. Conversely, if the HoM power quantified is significantly lower than the maximum delta S, this discrepancy may be attributed to computational tolerances, suggesting that the HoM excitation has not been fully substantiated. To aid in understanding, we also define the direct ratio of output power to input power, which represents the purity of the TEM mode. This ratio serves as an alternative interpretation of but scaled differently.
3. Results
3.1. Design Analysis of a 375 GHz Cut-Off Frequency Component Operating Within the 325 GHz to 425 GHz Range
Adaptive meshing was refined at discrete frequencies of 325 GHz, 337.5 GHz, 350 GHz, 362.5 GHz, 375 GHz, 387.5 GHz, 400 GHz, and 425 GHz within the iterative simulation loop, with up to eight frequencies solved concurrently. A frequency sweep was performed across the entire study range (325 GHz to 425 GHz) using interpolation, adhering to the specified error tolerance once the field solution achieved convergence. Convergence was defined by a maximum delta S of less than 0.01 after four iterations. Figure 3 illustrates the progression of the meshing refinement process until convergence was reached. Post-convergence mesh statistics, including edge length and volume, are presented in Table 3, detailing the minimum (Min.), maximum (Max.), root-mean-square (RMS), and standard deviation (Std Dev.) values.
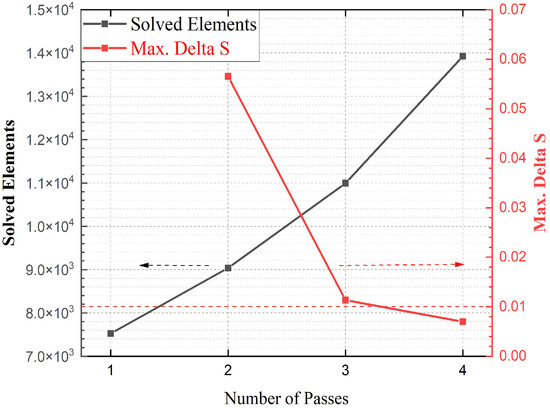
Figure 3.
Solution statistics (evaluated from 325 GHz to 425 GHz) for a vacuum-filled coaxial delay line designed with a 375 GHz cut-off frequency ( = 154.18 µm, = 100.29 µm, L = 1 cm), constructed using PEC for core and ground conductors. The red dotted line represents the convergence threshold, defined as a maximum delta S of 0.01. The dotted arrows indicate the association of the results with their respective axes.
Table 3.
Mesh statistics (post-convergence) of the vacuum-filled dielectric volume for an = 375 GHz coaxial delay line design ( = 154.18 µm, = 100.29 µm, L = 1 cm) across the 325 GHz to 425 GHz evaluation range.
The S-parameter results, displayed in Figure 4, span the frequency range from 325 GHz to 425 GHz, revealing a pronounced dip in the parameter near 409 GHz (for which more discrete frequency points around this are run to capture the dramatic change precisely). This anomaly is likely influenced by the behavior of the parameter, which shows a sharp rise from −50 dB to −10 dB at the same frequency. However, this observation alone is insufficient to definitively conclude whether HFSS is capable of automatically incorporating higher-order modes (HoMs) into the solution model. Further investigation and validation, such as decoupling the interaction with , are necessary to assess the software’s ability to account for these modes in the simulation process.
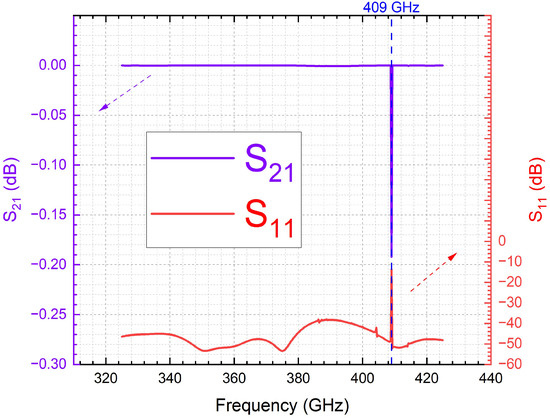
Figure 4.
S-parameters (evaluated from 325 GHz to 425 GHz) of a vacuum-filled coaxial delay line designed with a 375 GHz cut-off frequency ( = 154.18 µm, = 100.29 µm, L = 1 cm), constructed in PEC (for core and ground conductors), with non-renormalized post-processing to minimize reflection losses. The dotted arrows indicate the association of the results with their respective axes.
To further validate this, we employ the 60 GHz cut-off geometry design as a cross-benchmark, operating within the same frequency range of 325 GHz to 425 GHz (see Section 3.2). This approach is intended to maximize the exposure of the structure’s vulnerability to the excitation of HoMs.
3.2. Analysis of a 60 GHz Cut-Off Frequency Design Operating Across 325 GHz to 425 GHz
For numerically investigating this design, adaptive meshing was refined at frequencies of 325 GHz, 337.5 GHz, 350 GHz, 362.5 GHz, 375 GHz, 387.5 GHz, 400 GHz, and 425 GHz within the iterative process, with up to eight frequencies solved in parallel. A frequency sweep, utilizing interpolation, was conducted across the entire range of 325 GHz to 425 GHz, ensuring compliance with the specified error tolerance once the field solution achieved convergence. Convergence was defined as a maximum delta S of less than 0.01 after seven iterations. The meshing refinement process leading to convergence is illustrated in Figure 5. Detailed post-convergence meshing statistics, including relevant parameters, are presented in Table 4.
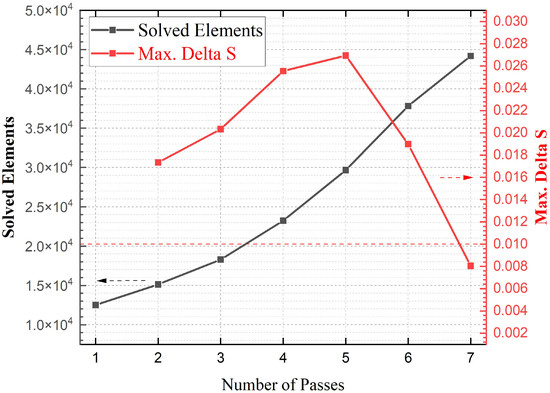
Figure 5.
Solution statistics (evaluated from 325 GHz to 425 GHz) for a vacuum-filled coaxial delay line designed with a 60 GHz cut-off frequency ( = 626.83 µm, = 963.62 µm, L = 1 cm), constructed using PEC (for core and ground conductors). The dotted arrows indicate the association of the results with their respective axes.
Table 4.
Post-convergence meshing statistics of the vacuum-filled dielectric volume for the = 60 GHz coaxial delay line design ( = 626.83 µm, = 963.62 µm, L = 1 cm) evaluated over the 325 GHz to 425 GHz frequency range.
The reduction in the cut-off frequency from 375 GHz to 60 GHz leads to a significant increase in the cross-sectional geometry and, consequently, a larger dielectric volume. This results in a substantial rise in the number of meshed elements and mesh sizes, as demonstrated in Table 4 in comparison to Table 3, both covering the frequency range evaluated from 325 GHz to 425 GHz. Consequently, the iterative convergence process is extended, requiring an increased number of passes (from four to seven cycles) to achieve convergence (as evidenced by the comparison between Figure 3 and Figure 5).
The S-parameter results (Figure 6 below) reveal five distinct dips in the parameter, with the minimum values occurring at 342.5 GHz, 408.75 GHz, 415.25 GHz, 420.75 GHz, and 423.5 GHz. Notably, the dips at 408.75 GHz and 420.75 GHz coincide with the prominent peaks in the parameter, suggesting a strong correlation between reflection and transmission behavior at these frequencies. In contrast, the dips at 342.5 GHz, 415.25 GHz, and 423.5 GHz occur without corresponding peaks in , indicating that these anomalies in may arise from other factors, such as the HoM excitation (and modal interactions) of our current investigation interest.
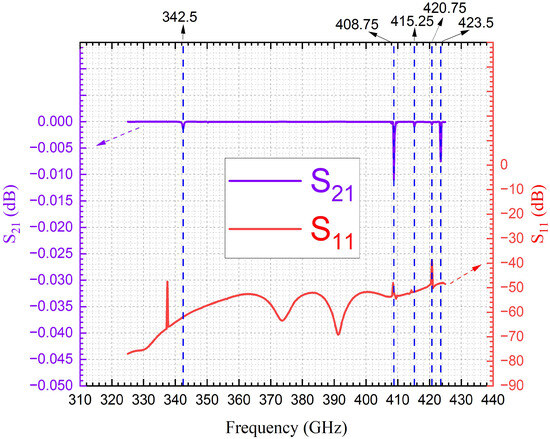
Figure 6.
S-parameters (evaluated from 325 GHz to 425 GHz) for a vacuum-filled coaxial delay line designed with a 60 GHz cut-off frequency ( = 626.83 µm, = 963.62 µm, L = 1 cm), constructed using PEC (for core and ground conductors), with non-renormalized post-processing to minimize reflection losses. The dotted arrows indicate the association of the results with their respective axes.
The presence of the peaks at 408.75 GHz and 420.75 GHz suggests a relatively strong reflection at these frequencies, which may be attributed to impedance mismatches or resonant conditions that disrupt efficient signal transmission. This is further supported by the simultaneous occurrence of deep troughs in the parameter, indicating significant attenuation in the transmitted signal. In contrast, the absence of peaks at 342.5 GHz, 415.25 GHz, and 423.5 GHz, despite the presence of dips in , suggests that other mechanisms are at play. These could include HoM interactions that do not strongly reflect into the system, or subtle shifts in the mode structure that affect transmission without causing a pronounced reflection. Further simulation and experimental validation, including a thorough analysis of mode content and field distribution, would be essential to determine whether these dips in are indeed the result of HoM excitation or other complex electromagnetic interactions.
When the results of the 375 GHz cut-off design are compared with those of the 60 GHz cut-off design and combined in Figure 7 (by merging Figure 4 and Figure 6), several noteworthy observations emerge. Specifically, a comparison reveals that the parameter of the ideal coaxial line with a cut-off frequency of 60 GHz exhibits a trough at 408.75 GHz, whereas the parameter of the ideal coaxial line with a cut-off frequency of 375 GHz shows a trough at 409 GHz. The difference between these two frequencies is only 0.25 GHz, which corresponds precisely to the frequency resolution of the simulation, given that the sweep range includes 401 points, resulting in a sweep step size of 0.25 GHz. The close alignment of the troughs in for the two designs suggests that despite the significant difference in cut-off frequencies, both configurations exhibit a strong resonance or mode interaction near 409 GHz. This minor frequency offset (0.25 GHz) may be attributed to the resolution limitations imposed by the sweep step size. While this difference is small, it raises important considerations regarding the precision of the wideband frequency sweep in capturing subtle resonant phenomena.
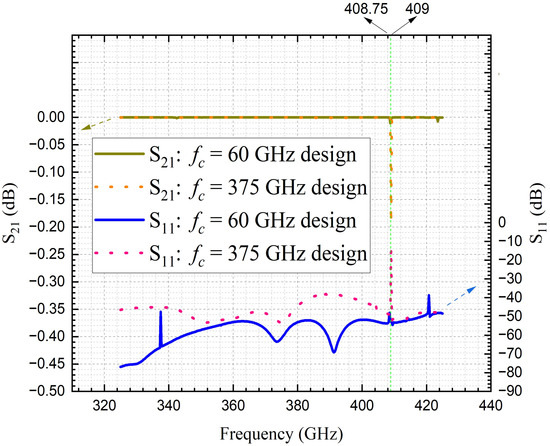
Figure 7.
S-parameters (evaluated from 325 GHz to 425 GHz) for vacuum-filled coaxial delay lines designed with cut-off frequencies of 60 GHz and 375 GHz, respectively, constructed using PEC (for core and ground conductors), with non-renormalized post-processing to minimize reflection losses. The dotted arrows indicate the association of the results with their respective axes.
The comparison also underscores the potential impact of HoMs or other waveguide modes, which may be excited under different cut-off conditions. The near-identical troughs suggest that certain electromagnetic interactions—likely influenced by the waveguide geometry and boundary conditions—persist across designs with vastly different cut-off frequencies. This implies that the 409 GHz anomaly may be a robust feature of the system, potentially linked to inherent structural or modal characteristics rather than the specific cut-off frequency of the coaxial line. Further investigation, including higher-resolution frequency sweeps and a detailed modal analysis, would be necessary to clarify the origin of this consistent resonance. Additionally, exploring the field distributions at these frequencies could offer insight into whether the observed troughs result from HoM excitation or other complex electromagnetic interactions that are not immediately apparent from the S-parameter results alone.
3.3. Quantification of HoM Power and TEM-Mode Purity
To quantify the dissipated power associated with the potential excitation of higher-order modes (HoMs), denoted as (), the principle of energy conservation is applied, as illustrated in Figure 1 earlier and mathematically defined by (3) below:
where the input power () is set to 1 W, and both the output power () and the reflected power () are expressed in terms of the S-parameters, as given in (4) and (5), respectively:
By integrating (3), (4), and (5) with the S-parameter results shown in Figure 7, we derive the total power of forward transmission and reflection, as presented in Figure 8. The y-axis is labeled as the sum of and in terms of power (W). More precisely, this represents the sum of and , as indicated in the full title of the y-axis in Figure 8.
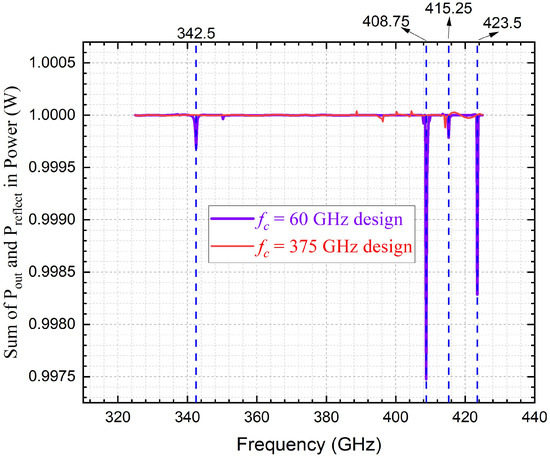
Figure 8.
Power sum of forward transmission and reflection (evaluated from 325 GHz to 425 GHz) for vacuum-filled coaxial delay lines designed with cut-off frequencies of 60 GHz and 375 GHz, respectively, constructed using PEC (for core and ground conductors), with non-renormalized S-parameters to minimize reflection losses.
As shown in Figure 8 above, when the frequency sweeping range is from 325 GHz to 425 GHz, the sum of and for the ideal coaxial line with a cut-off frequency () of 60 GHz exhibits peaks in both the low- and high-frequency bands. In contrast, for the ideal coaxial line with of 375 GHz, significant peaks in the sum of and are observed only in the high-frequency band above 375 GHz within the same sweep range. This behavior is likely attributed to the excitation of HoMs at the corresponding frequency points. However, given that the maximum peak amplitude is only 0.0026 W, the possibility that these peaks arise from simulation inaccuracies cannot be entirely ruled out.
To ensure a more rigorous analysis, the parameters of both ideal coaxial line models were kept unchanged while the frequency sweep range was adjusted downwards, to the zoomed-in range from 30 GHz to 90 GHz (see Figure 9 below). Under these conditions, for the coaxial line with of 375 GHz, the sum of and remains consistently 1 W throughout the frequency sweep, resulting in a horizontal straight line for the corresponding curve (as expected, because it is operating far below the cut-off frequency). In contrast, for the coaxial line with of 60 GHz, noticeable fluctuations in the sum of and appear in the frequency band above 60 GHz, further supporting the hypothesis that these fluctuations are related to the excitation of HoMs beyond the cut-off frequency.
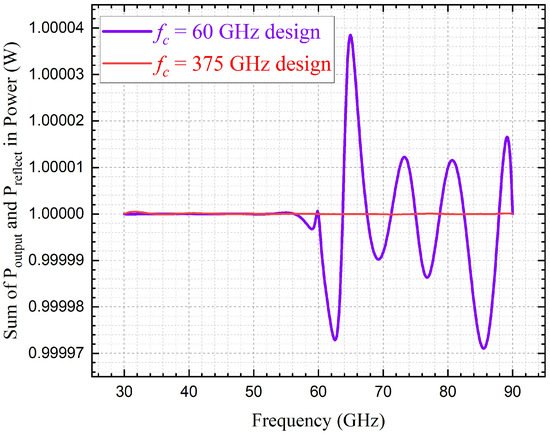
Figure 9.
Power sum of forward transmission and reflection (evaluated from 30 GHz to 90 GHz) for vacuum-filled coaxial delay lines designed with cut-off frequencies of 60 GHz and 375 GHz, respectively, constructed using PEC (for core and ground conductors), with non-renormalized S-parameters to minimize reflection losses.
By combining (3) with the data presented in Figure 8, the power dissipated by the HoM () can be calculated. This is achieved by subtracting the y-axis values in Figure 8 from 1 W, resulting in the derivation of Figure 10a (in W), which visually represents characterized from 325 GHz to 425 GHz. Similarly, by combining (3) with the data shown in Figure 9, for 30 GHz to 90 GHz can be derived in Figure 10b.
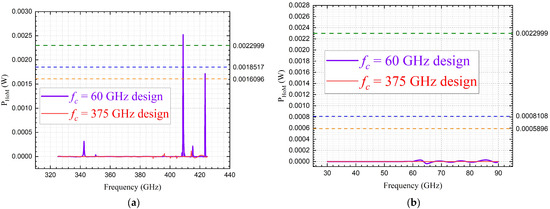
Figure 10.
Dissipated power of HoM in vacuum-filled coaxial delay lines designed with cut-off frequencies of 60 GHz and 375 GHz, respectively, constructed using PEC (for core and ground conductors): (a) analysis results from 325 GHz to 425 GHz; (b) analysis results from 30 GHz to 90 GHz.
In Figure 10a,b, the observed fluctuations (non-zero values) suggest the potential excitation of HoMs. Specifically, in Figure 10a, which represents the case most susceptible to HoM excitation, two distinct peaks in for the 60 GHz cut-off design were observed at 408.75 GHz and 423.5 GHz. These peaks exceed the computational convergence error (represented by dashed lines, which are derived from the maximum renormalized delta S in amplitude observed at convergence and subsequently converted into the corresponding power deviation from the 1 W input), indicating that the fluctuations are primarily due to the emergence of HoMs rather than statistical errors. Significantly, this analysis represents the first instance in which the power associated with HoM excitation has been quantitatively measured under the default single-mode simulation environment.
Correspondingly, the power associated with the TEM mode (i.e., the non-HoM component) can be expressed as a percentage (by calculating the proportion relative to the input power of 1 W). Similarly, the percentage representation of the total power, obtained by summing and , is calculated as its proportion relative to the input power of 1 W. This is illustrated in Figure 11 for four distinct cases: (1) the 375 GHz cut-off design evaluated over the 325 GHz to 425 GHz range (Figure 11a), (2) the 60 GHz cut-off design evaluated over the 325 GHz to 425 GHz range (Figure 11b), (3) the 375 GHz cut-off design evaluated over the 30 GHz to 90 GHz range (Figure 11c), and (4) the 60 GHz cut-off design evaluated over the 30 GHz to 90 GHz range (Figure 11d). The lowest TEM-mode purities recorded for these four cases are as follows: (1) 95.67298%, (2) 99.74695%, (3) 99.99654%, and (4) 99.99474%. The four different cases examined in Figure 11 demonstrate varying levels of vulnerability to HoM excitation, resulting in both significant outcomes (e.g., 95.67298% in case 1) and negligible effects (e.g., 99.99654% in case 3).
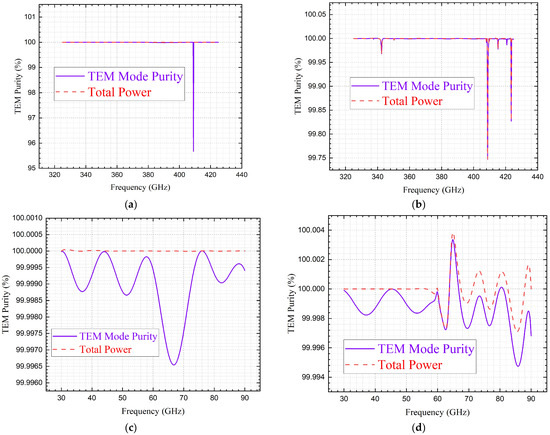
Figure 11.
TEM-mode purity analysis results for vacuum-filled coaxial delay lines constructed using PEC (for core and ground conductors): (a) simulated from 325 GHz to 425 GHz for the 375 GHz cut-off design; (b) simulated from 325 GHz to 425 GHz for the 60 GHz cut-off design; (c) simulated from 30 GHz to 90 GHz for the 375 GHz cut-off design; (d) simulated from 30 GHz to 90 GHz for the 60 GHz cut-off design.
Last but not least, Table 5 presents the memory usage and computational time recorded for the aforementioned four cases analyzed, using HFSS version 2022 R1’s default single-mode option, based on a workstation equipped with an 11th generation Intel Core i5-1155G7 CPU running at 2.50 GHz and 16 GB of random-access memory. Arguably, our computational analysis implies that HoM co-simulation is not inherently automated by default in HFSS when the number of modes is set to 1. This limitation is due to HFSS being configured to simulate only the fundamental mode unless explicitly adjusted to accommodate additional modes. Thus, achieving accurate co-simulation of HoMs necessitates modifying the simulation settings to include multiple modes, which can require additional computational resources and setup modifications.
Table 5.
Computational resources for vacuum-filled coaxial delay lines designed with cut-off frequencies of 60 GHz and 375 GHz, respectively, numerically analyzed across frequency ranges of 325–425 GHz and 30–90 GHz.
Nevertheless, the lossless countermeasures jointly implemented in the models simulated in this work manage to expose the HoM power from the noise and statistical errors, particularly for the 60 GHz cut-off design evaluated over the 325–425 GHz range. A significant increase in computational memory and time required for this design case, compared to the other three cases, further supports this claim, as demonstrated in Table 5.
4. Discussion and Concluding Remarks
A thorough investigation was conducted in this work that identifies a critical limitation in state-of-the-art computational electromagnetics software: the inability to accurately simulate higher-order modes (HoMs), such as the TE11 mode, in designing liquid crystal-based coaxial phase shifters at terahertz frequencies for 5G/6G applications. HoMs can severely degrade device performance, necessitating robust diagnostic frameworks for their detection and mitigation. This limitation, if left unaddressed, may result in either exaggerated performance predictions or unduly conservative designs, especially in closed-source simulators where customization options are often limited.
To tackle this issue, theoretical and computational innovations are proposed in this work, i.e., we implemented three lossless assumptions, specifically designed to assess the pseudo-HoM identification capability of full-wave simulators. By focusing on a vacuum-filled coaxial transmission line constructed in PEC, our analysis revealed the frequency-dependent presence or absence of HoM power dissipation alongside the dominant TEM mode. The exclusion of metal, dielectric, and reflection losses from the device models enabled a more accurate examination of the simulator’s performance. These findings offer fundamental yet significant insights for both the academic and engineering communities, emphasizing the necessity of early diagnostic evaluations in simulation tools. Furthermore, they underscore the importance of refining commercial simulators to more accurately capture mode purity in advanced transmission line simulations.
Building on the diagnostic methodology proposed in this study, future work will focus on enhanced validation efforts. While experimental measurements, such as S-parameter analysis using a two-port vector network analyzer (VNA), present significant technical challenges—particularly in isolating and identifying the power of HoMs from the total signal power including other dissipation sources—these challenges can be addressed computationally. As part of our future work, building on the evaluation conducted within the 325 GHz to 425 GHz range, we aim to enhance the mesh resolution and conduct simulations within a narrower frequency range around the observed peaks, incorporating additional frequency points near these peaks. This approach will help capture the small values more accurately and provide a more precise representation of the peaks. Furthermore, we plan to extend the frequency range beyond 425 GHz, as exploring higher frequencies could offer further insights and results. Specifically, a cross-simulator benchmarking approach could be employed, applying the proposed diagnostic framework to an alternative simulation platform (e.g., CST Studio Suite) to enable comparative analysis and validation of results. As part of our future work, we plan to incorporate field monitors operating at the specific frequencies of interest to analyze the field distributions and identify the corresponding modes more effectively.
While this work takes coaxial line as an example, the proposed diagnostic methodology and framework also applies to other transmission line structures. Future research shall also expand these analyses by incorporating additional material losses [25,26,27] and addressing practical design constraints [28,29] associated with coaxial and other TEM transmission line phase shifters realized in liquid crystals [30,31,32] (in place of the vacuum state used in the current work) and other reconfigurable technologies (e.g., leveraging thin ferroelectric films [33,34] or graphene [35]). This will further validate and improve the reliability of these general-purpose full-wave simulation tools in practical applications in the sub-mmW and THz domains (the last dark region of the electromagnetic spectrum). The scope of these promising applications, as outlined in the spectrum planning, is summarized in Figure 12.
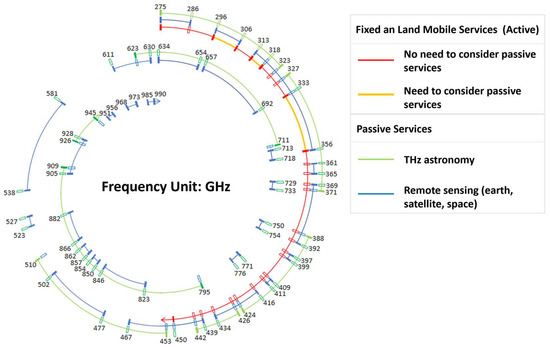
Figure 12.
Roadmap of THz spectrum planning, and applications underpinned and inspired by this work.
Arguably, the sub-mmW and THz industry is fast-moving at a breakneck pace towards a convergence of aerospace and wireless ecosystems. As technological demands grow, particularly in areas such as high-frequency signal processing and advanced communication systems incorporating microscale electromagnetic devices, the need for reliable, adaptable simulations becomes increasingly critical. By addressing the remaining challenges as identified in this work, the research community (including but not limited to material science, electronics engineering, optics and photonics) can further optimize the THz reconfigurable transmission line designs and enhance the overall performance of the underpinned system. Future research in this field will be instrumental in facilitating the integration of THz technologies into emerging aerospace and wireless applications, particularly in the convergence of sensing and communication functionalities. This advancement is expected to drive the continued evolution and innovation of these interconnected industries.
Author Contributions
Conceptualization, J.L.; methodology, H.L. and J.L.; software, H.L. and J.L.; validation and formal analysis, H.L. and J.L.; investigation and data curation, H.L. and J.L.; writing—original draft preparation, H.L. and J.L.; writing—review and editing, J.L.; visualization, H.L. and J.L.; supervision, J.L.; project administration and funding acquisition, J.L. All authors have read and agreed to the published version of the manuscript.
Funding
This research was funded by the National Natural Science Foundation of China, grant number 62301043, as well as the Fundamental Research Funds for the Central Universities (Beijing Institute of Technology Research Fund Program for Young Scholars), grant number 220502052024011.
Institutional Review Board Statement
Not applicable.
Informed Consent Statement
Not applicable.
Data Availability Statement
The original contributions presented in this study are included in the article. Further inquiries can be directed to the corresponding author.
Conflicts of Interest
The authors declare no conflicts of interest. The funders had no role in the design of the study; in the collection, analyses, or interpretation of data; in the writing of the manuscript; or in the decision to publish the results.
Abbreviations
The nomenclatures and their corresponding abbreviations used in this work are summarized below.
| Nomenclatures | Abbreviations |
| Higher-order mode | HoM |
| Transverse electromagnetic | TEM |
| Transverse Electric | TE |
| Microwave | MW |
| Millimeter wave | mmW |
| Gigahertz | GHz |
| Terahertz | THz |
| Fifth-generation wireless | 5G |
| Sixth-generation wireless | 6G |
| Electronic design automation | EDA |
| High-frequency structure simulator | HFSS |
| Cut-off frequency | fc |
| Perfect electric conductor | PEC |
| Scattering parameters | S-parameters |
| Forward transmission coefficient | S21 |
| Forward reflection coefficient | S11 |
| Core line diameter | Dcore |
| Dielectric thickness | TDk |
| Dielectric constant | Dk |
| Dissipation factor | DF |
| Effective dielectric constant | εr |
| Three-dimensional | 3D |
| Finite-element method | FEM |
| Figure of merit | FoM |
| High-performance computing | HPC |
| Output power | Pout |
| Input power | Pin |
| Reflected power | Preflect |
| Higher-order mode power | PHoM |
| Characteristic impedance | Zc |
| Speed of light | c |
| Minimum | Min. |
| Maximum | Max. |
| Root-mean-square | RMS |
| Standard deviation | Std Dev. |
| Central processing unit | CPU |
| Computer simulation technology | CST |
| Vector network analyzer | VNA |
References
- Gopal, A.S. Ansys 2023 Annual Report; Ansys Inc.: Canonsburg, PA, USA, 2023; pp. 1–118. [Google Scholar]
- Cendes, Z. The development of HFSS. In Proceedings of the 2016 USNC-URSI Radio Science Meeting, Fajardo, PR, USA, 26 June–1 July 2016; pp. 39–40. [Google Scholar]
- Han, Z.; Manafu, A. Simulation Application of Finite Element Analysis Software HFSS in Antenna Engineering Design Under the Background of Big Data. In Proceedings of the 2022 International Conference on Inventive Computation Technologies, Lalitpur, Nepal, 20–22 July 2022; pp. 710–713. [Google Scholar]
- Migalin, M.M.; Koshkid’ko, V.G.; Demshevsky, V.V. Automated SIW Slotted Waveguide Antenna Design Using ANSYS HFSS Scripts. In Proceedings of the 2023 Radiation and Scattering of Electromagnetic Waves, Divnomorskoe, Russia, 26–30 June 2023; pp. 188–191. [Google Scholar]
- Linkous, L.; Karincic, E.; Lundquist, J.; Topsakal, E. Automated Antenna Calculation, Design and Tuning Tool for HFSS. In Proceedings of the 2023 United States National Committee of URSI National Radio Science Meeting, Boulder, CO, USA, 10–14 January 2023; pp. 229–230. [Google Scholar]
- Makarushkin, G.G.; Klimov, K.N. Using the Ansys HFSS Software Package for 3D Numerical Electromagnetic Modeling of a Four-Channel Antenna. In Proceedings of the 2024 Systems of Signal Synchronization, Generating and Processing in Telecommunications, Vyborg, Russia, 1–3 July 2024; pp. 1–4. [Google Scholar]
- Kovacs, P.; Raida, Z. Dispersion analysis of planar metallo-dielectric EBG structures in Ansoft HFSS. In Proceedings of the MIKON 2008—17th International Conference on Microwaves, Radar and Wireless Communications, Wroclaw, Poland, 19–21 May 2008; pp. 1–4. [Google Scholar]
- Ahme, S. HFSS Helps Early Prediction of Gaseous Discharges in RF and Microwave Devices. In Proceedings of the 2023 IEEE International Conference on Plasma Science, Santa Fe, NM, USA, 21–25 May 2023; p. 1. [Google Scholar]
- Li, J.; Li, H. Liquid Crystal-Filled 60 GHz Coaxially Structured Phase Shifter Design and Simulation with Enhanced Figure of Merit by Novel Permittivity-Dependent Impedance Matching. Electronics 2024, 13, 626. [Google Scholar] [CrossRef]
- Ozturk, Y.; Hossain, M.M.S.; Arage, A.; Nahar, N.K.; Sertel, K. Printed Circuit Board-Based Thin-Film Dielectric Characterization Fixture for mmW Bands. In Proceedings of the 2024 IEEE INC-USNC-URSI Radio Science Meeting (Joint with AP-S Symposium), Florence, Italy, 14–19 July 2024; p. 32. [Google Scholar]
- Cabbia, M.; Fregonese, S.; Deng, M.; Curutchet, A.; Yadav, C.; Céli, D.; Matos, M.; Zimmer, T. Meander-Type Lines: An Innovative Design for On-Wafer TRL Calibration for mmW and Sub-mmW Frequencies Measurements. IEEE Trans. Terahertz Sci. Technol. 2021, 11, 367–374. [Google Scholar] [CrossRef]
- Li, J.; Li, H. Modeling 0.3 THz Coaxial Single-Mode Phase Shifter Designs in Liquid Crystals with Constitutive Loss Quantifications. Crystals 2024, 14, 364. [Google Scholar] [CrossRef]
- Oates, D.E.; Tolpygo, S.K.; Bolkhovsky, V. Submicron Nb Microwave Transmission Lines and Components for Single-Flux-Quantum and Analog Large-Scale Superconducting Integrated Circuits. IEEE Trans. Appl. Supercond. 2017, 27, 1–5. [Google Scholar] [CrossRef]
- Wang, K.; Wu, K. Liquid crystal enabled substrate integrated waveguide variable phase shifter for millimeter-wave application at 60ghz and beyond. In Proceedings of the 2015 IEEE MTT-S International Microwave Symposium, Phoenix, AZ, USA, 17–22 May 2015; pp. 1–4. [Google Scholar]
- Zhu, K.; Jiang, D.; Bai, T.; Zhang, W.; Zhang, T.; Gao, J. Design of a terahertz phase shifter based on liquid crystal. In Proceedings of the 2021 14th UK-Europe-China Workshop on Millimetre-Waves and Terahertz Technologies, Lancaster, UK, 13–15 September 2021; pp. 1–3. [Google Scholar]
- Kowalski, E.J.; Shapiro, M.A.; Temkin, R.J. Simple Correctors for Elimination of High-Order Modes in Corrugated Waveguide Transmission Lines. IEEE Trans. Plasma Sci. 2014, 42, 29–37. [Google Scholar] [CrossRef] [PubMed][Green Version]
- Li, J. Optically Steerable Phased Array Enabling Technology Based on Mesogenic Azobenzene Liquid Crystals for Starlink Towards 6G. In Proceedings of the 2020 IEEE Asia-Pacific Microwave Conference, Hong Kong, China, 8–11 December 2020; pp. 345–347. [Google Scholar]
- Neuder, R.; Späth, M.; Schüßler, M.; Sáez, A.J. Architecture for sub-100 ms liquid crystal reconfigurable intelligent surface based on defected delay lines. Commun. Eng. 2024, 3, 70. [Google Scholar] [CrossRef]
- Li, J.; Li, H. Computationally Sampling Surface and Volume Current Densities of Liquid Crystal Non-Planar Phase Shifters for Low-Loss 5G IoT and 6G AIoT. In Proceedings of the 2024 IEEE International Conference on Omni-Layer Intelligent Systems, London, UK, 29–31 July 2024; pp. 1–6. [Google Scholar]
- Chandramouli, D.; Maldonado, P.A.; Kolding, T. Evolution of Timing Services From 5G-A Toward 6G. IEEE Access 2023, 11, 35150–35157. [Google Scholar] [CrossRef]
- Guidotti, A.; Coralli, A.V.; Schena, V.; Chuberre, N.; Jaafari, M.; Puttonen, J.; Cioni, S. The path to 5G-Advanced and 6G Non-Terrestrial Network systems. In Proceedings of the 2022 11th Advanced Satellite Multimedia Systems Conference and the 17th Signal Processing for Space Communications Workshop, Graz, Austria, 6–8 September 2022; pp. 1–8. [Google Scholar]
- Li, J.; Li, H. Frequency Ripples Reduction in Differential Delay Time of Liquid Crystals Coaxial Delay Lines. In Proceedings of the 2024 IEEE INC-USNC-URSI Radio Science Meeting (Joint with AP-S Symposium), Florence, Italy, 14–19 July 2024; pp. 154–155. [Google Scholar]
- Green, H.E.; Cashman, J.D. Higher Order Mode Cutoff in Polygonal Transmission Lines. IEEE Trans. Microw. Theory Tech. 1985, 33, 67–69. [Google Scholar] [CrossRef]
- Liu, X.; Qi, W.; Mu, C. Analysis of higher-order modes in coaxial conical transmission line. In Proceedings of the 2017 International Workshop on Electromagnetics: Applications and Student Innovation Competition, London, UK, 30 May–1 June 2017; pp. 41–43. [Google Scholar]
- Kitabayashi, S.; Kuroki, F.; Kawahara, Y. Dielectric-tube-supported metal rod transmission line and its application to transition for 1mm coaxial connector at 80 GHz band. In Proceedings of the 2015 European Microwave Conference, Paris, France, 7–10 September 2015; pp. 355–358. [Google Scholar]
- Miller, C.M.; Sacks, R.C. Dielectric Loss in Coaxial Cables via Phase Delay Measurements. IEEE Trans. Instrum. Meas. 1974, 23, 447–454. [Google Scholar] [CrossRef]
- Walia, G.; Laforge, P.D.; Azam, S.; Paranthaman, R. Dielectric Characterization Using Reflected Group Delay of a Partially-Filled Coaxial Resonator. IEEE Access 2024, 12, 123581–123594. [Google Scholar] [CrossRef]
- Helszajn, J. Ridge, Coaxial, and Stripline Phase-shifters. In Microwave Polarizers, Power Dividers, Phase Shifters, Circulators, and Switches; IEEE: Piscataway, NJ, USA, 2019; pp. 81–93. [Google Scholar]
- Hensley, D.M.; Christodoulou, C.G.; Jackson, N. A Stretchable Liquid Metal Coaxial Phase Shifter. IEEE Open J. Antennas Propag. 2021, 2, 370–374. [Google Scholar] [CrossRef]
- Nose, T.; Ito, R.; Honma, M. Potential of Liquid-Crystal Materials for Millimeter-Wave Application. Appl. Sci. 2018, 8, 2544. [Google Scholar] [CrossRef]
- Garbvskiy, Y.; Zagoridnii, V.; Krivosik, P.; Lovejoy, J.; Camley, R.E.; Celinski, Z.; Glushchenko, A.; Dziaduszek, J.; Dabroeski, R. Liquid crystal phase shifter at millimeter wave frequencies. J. Appl. Phys. 2012, 111, 054504. [Google Scholar] [CrossRef]
- Nose, T.; Ito, R.; Honma, M. Characterization of Liquid Crystal Materials for Millimeter-Wave Wireless Communication. In Proceedings of the 2023 30th International Workshop on Active-Matrix Flatpanel Displays and Devices, Kyoto, Japan, 4–7 July 2023; pp. 20–23. [Google Scholar]
- Romanofsky, R.R.; Qureshi, A.H. A model for ferroelectric phase shifters. IEEE Trans. Magn. 2000, 36, 3491–3494. [Google Scholar] [CrossRef]
- Kremer, J.G.; Eltes, F.; Stark, P.; Stark, D.; Caimi, D.; Siegwart, H.; Offrein, B.J.; Fompeyrine, J.; Abel, S. A ferroelectric multilevel non-volatile photonic phase shifter. Nat. Photon. 2022, 16, 491–497. [Google Scholar] [CrossRef]
- Yasir, M.; Peinetti, F.; Savi, P. Enhanced Graphene Based Electronically Tunable Phase Shifter. Micromachines 2023, 14, 1877. [Google Scholar] [CrossRef] [PubMed]
Disclaimer/Publisher’s Note: The statements, opinions and data contained in all publications are solely those of the individual author(s) and contributor(s) and not of MDPI and/or the editor(s). MDPI and/or the editor(s) disclaim responsibility for any injury to people or property resulting from any ideas, methods, instructions or products referred to in the content. |
© 2025 by the authors. Licensee MDPI, Basel, Switzerland. This article is an open access article distributed under the terms and conditions of the Creative Commons Attribution (CC BY) license (https://creativecommons.org/licenses/by/4.0/).