
Innovative Elaboration of Polyvinylidene Fluoride Thin Films via Dip-Coating: Beta Phase Optimization, Humidity Control, Nanoparticles Addition, and Topographic Analysis


Abstract
1. Introduction
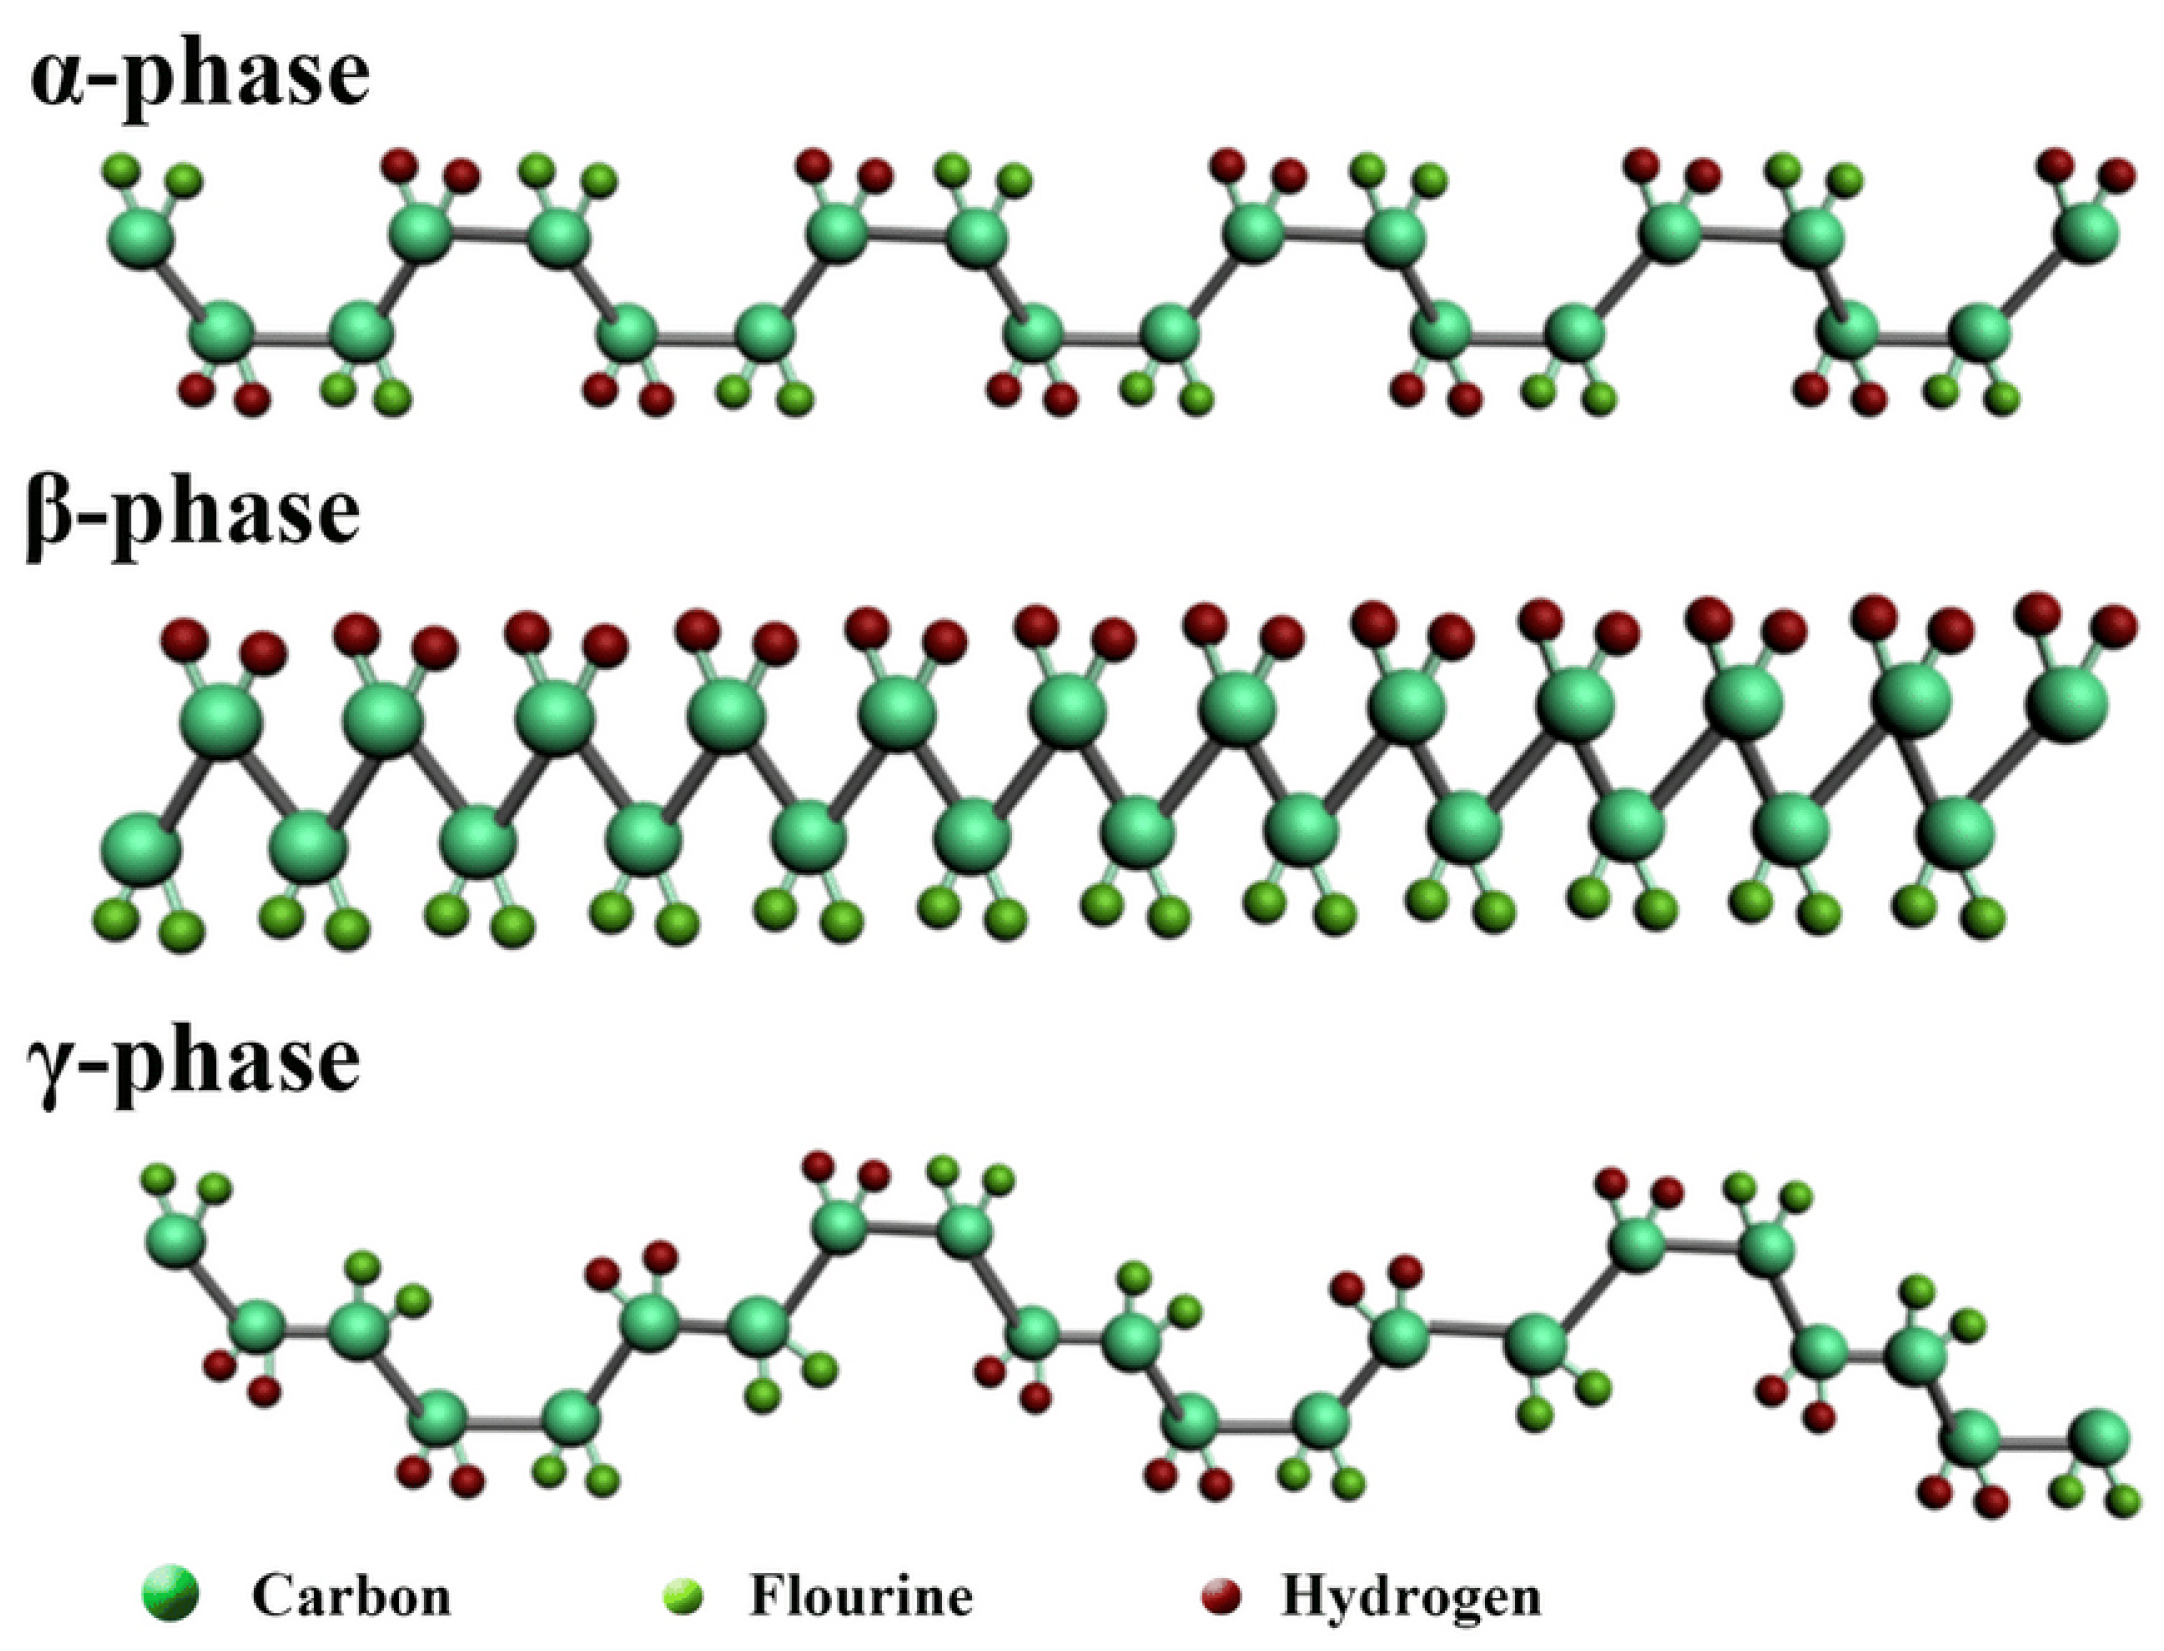
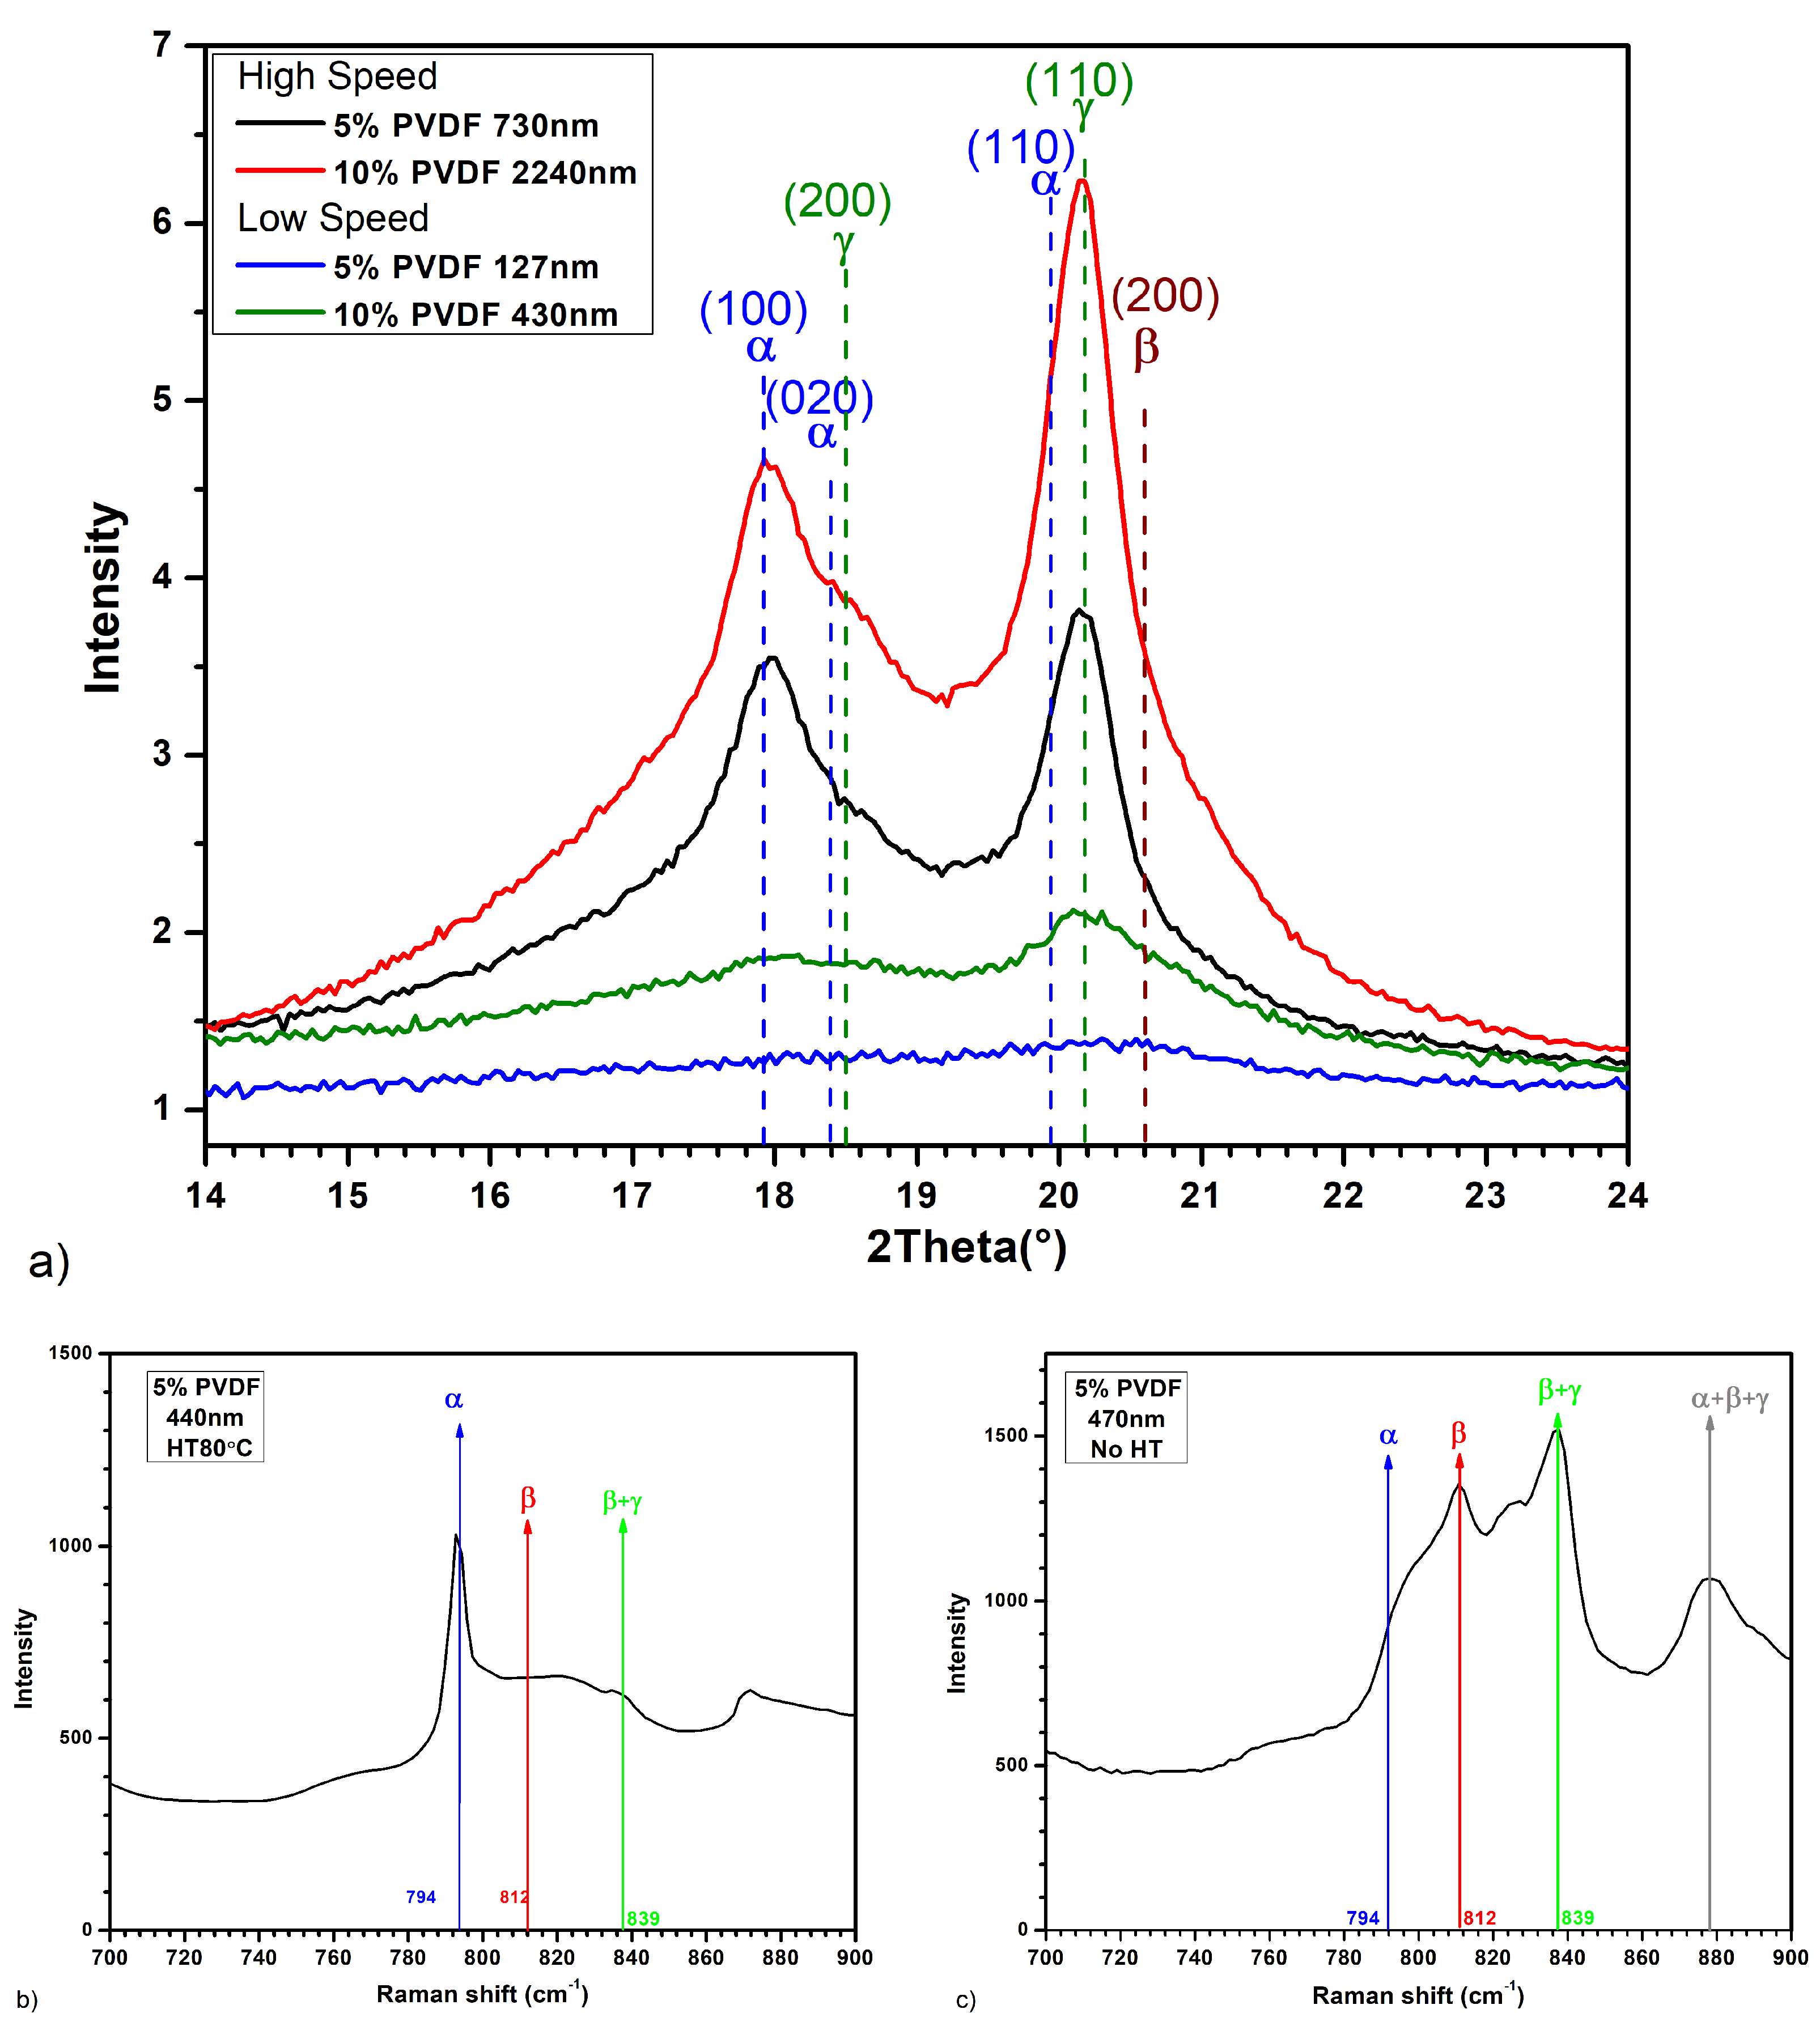
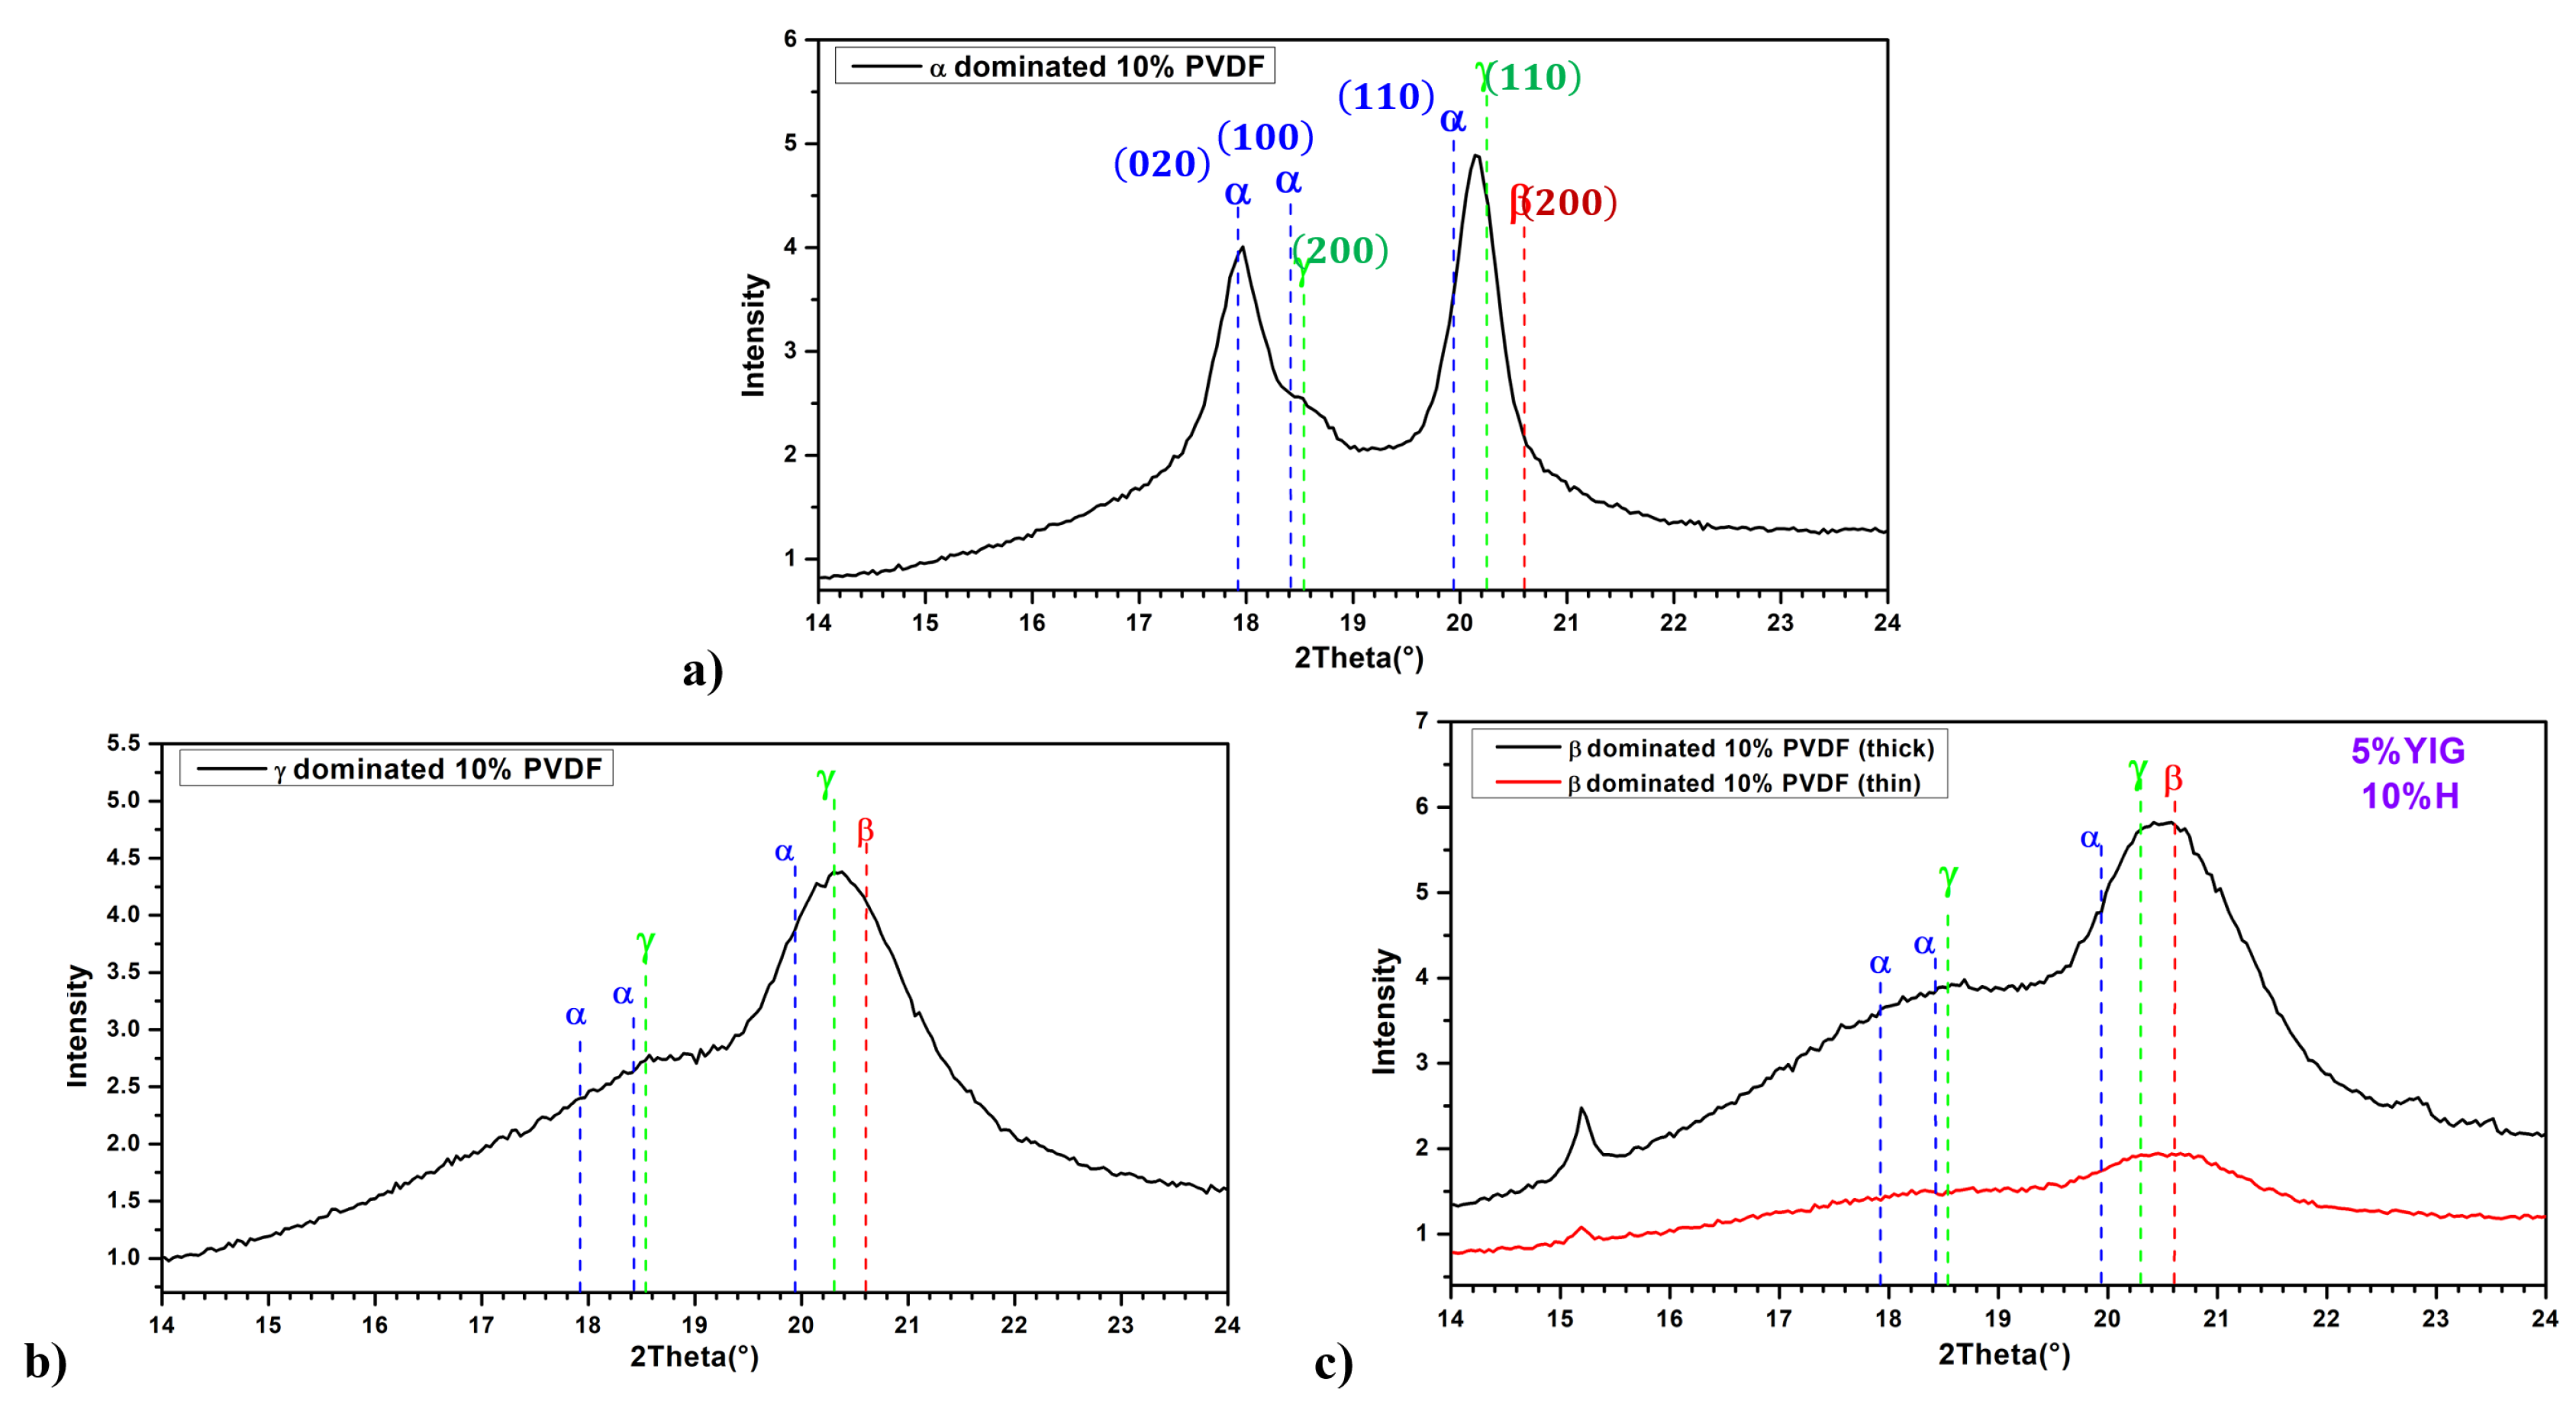
- Alpha () phase: This is the most common and least polar phase, characterized by a TGTG’ conformation where T stands for trans (180°) and G for gauche (±120°). This phase is non-polar and does not exhibit piezoelectric properties until it is mechanically or electrically manipulated.
- Beta () phase: The most relevant phase for piezoelectric applications, the -phase, exhibits all-trans planar zigzag chains. It is induced from the alpha phase via mechanical stretching or poling under an electric field. The -phase is highly polar and exhibits strong piezoelectric and pyroelectric properties [6].
- Gamma () phase: Characterized by a T3GTT3G’ conformation, this phase also exhibits piezoelectric properties but to a lesser extent than the beta phase.
- Delta () and Epsilon () phases: These are rare phases and can be obtained under special mechanical and thermal conditions.
- Thermal Stability: It has high thermal stability, capable of operating continuously at temperatures up to 170 °C [12].
- Mechanical Strength and Toughness: PVDF offers a good balance of mechanical properties, including strength, toughness, and flexibility [13].
- Electrical Properties: PVDF exhibits excellent dielectric properties and piezoelectric response [14].
2. Experimental Section
2.1. Deposition Techniques
2.1.1. Substrate Used and Preparation
2.1.2. Spin Coating
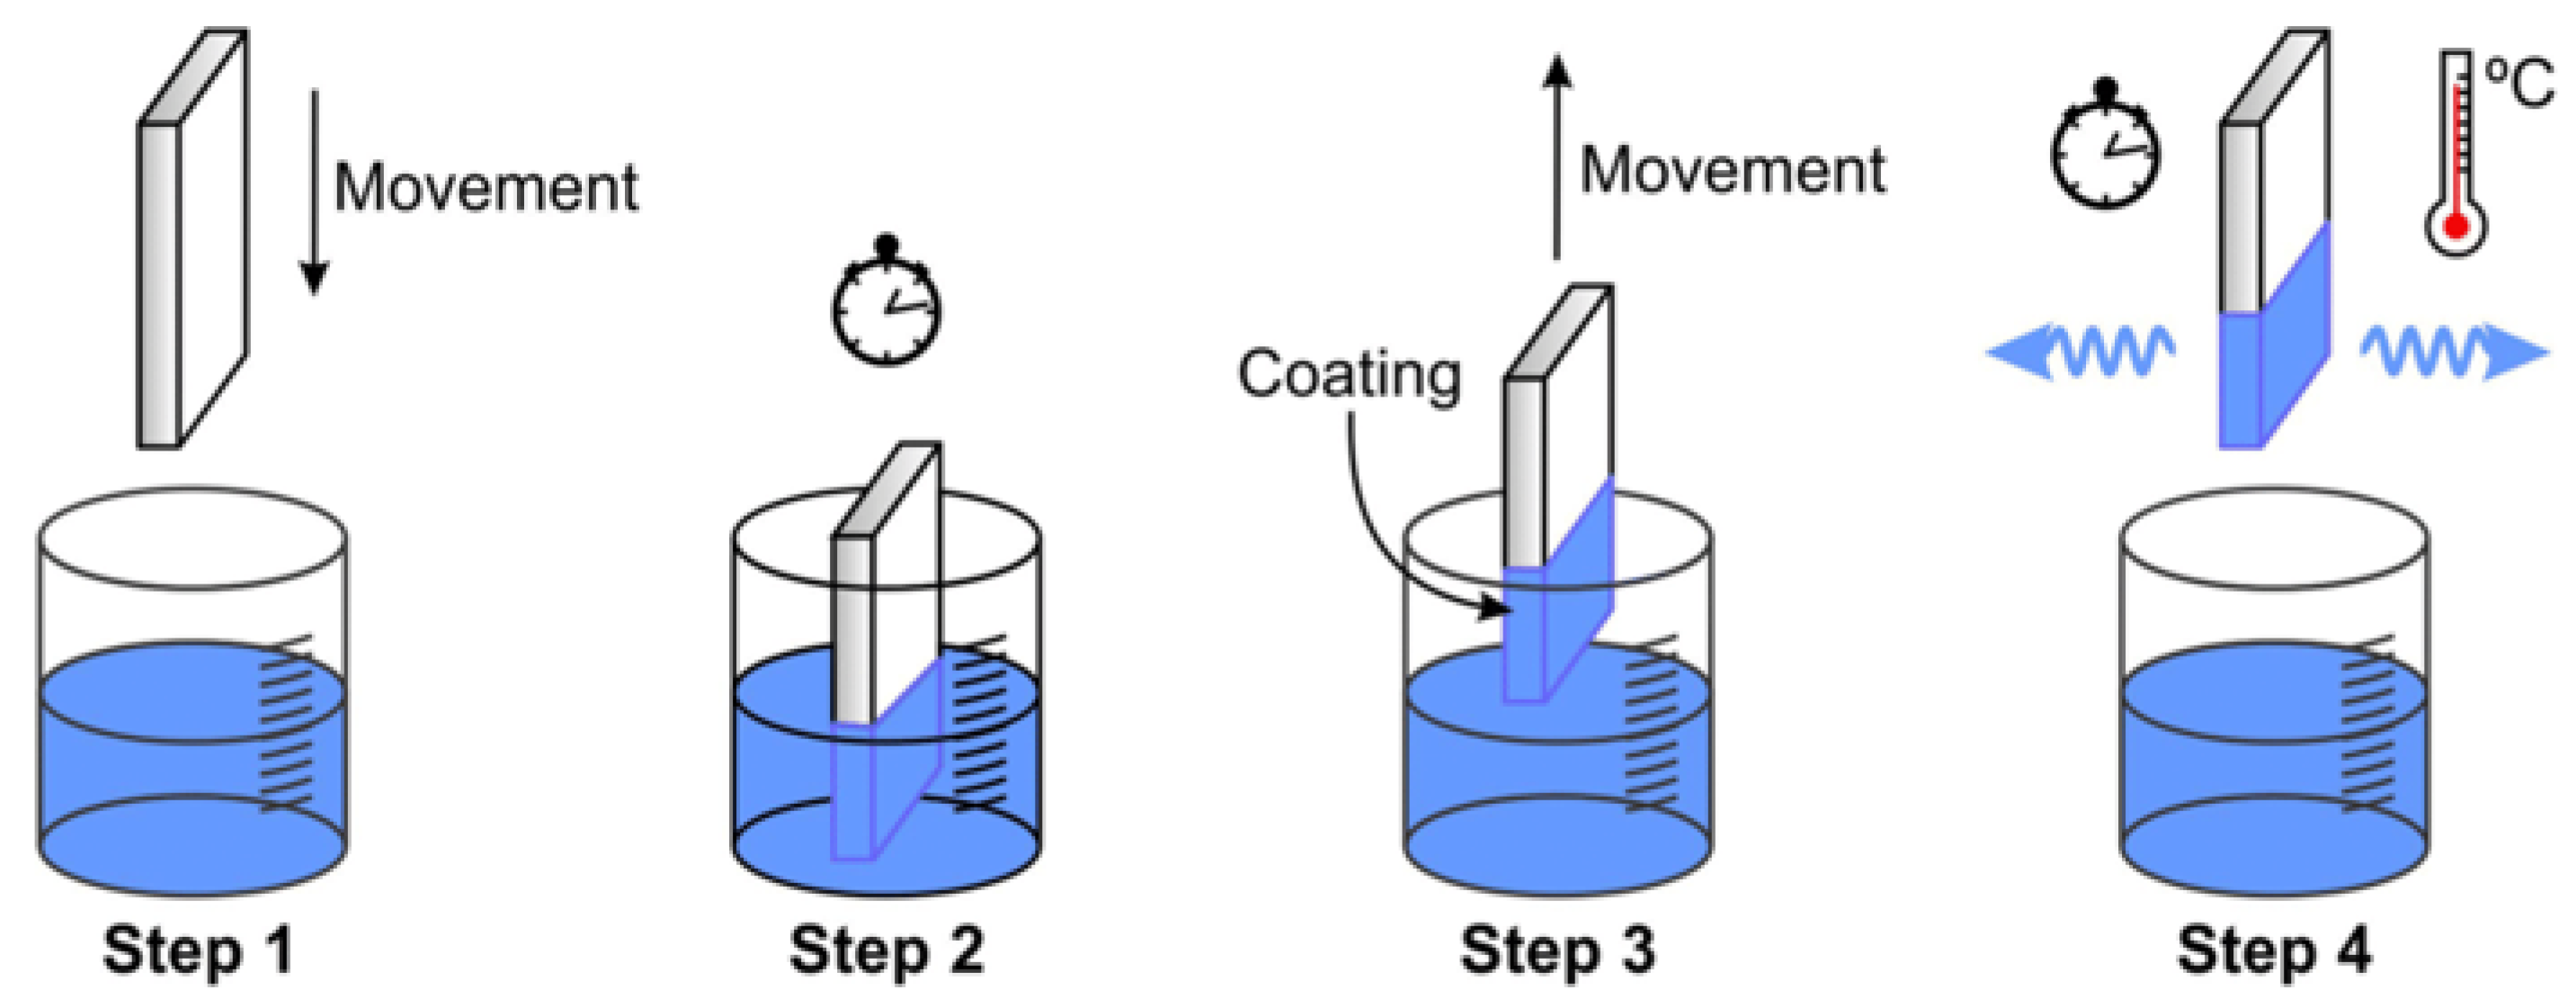
2.1.3. Dip Coating
- Immersion: A liquid solution containing the intended film material suspended or dissolved in a solvent is applied to the substrate.
- Dwell Time: The solution stabilizes and interacts equally with the surface while the substrate is submerged for a certain amount of time.
- Withdrawal: A liquid film is dragged behind the substrate as it is gradually removed at a regulated pace.
- Drainage and Evaporation: A thin film is left behind when the liquid layer thins as a result of gravity and solvent evaporation.
- Curing: In order to attain the required mechanical and chemical qualities, the film may go through further procedures like heat or UV curing.
2.1.4. Film Thickness Measurement
2.1.5. PVDF Phase Fraction Calculation and Formulas
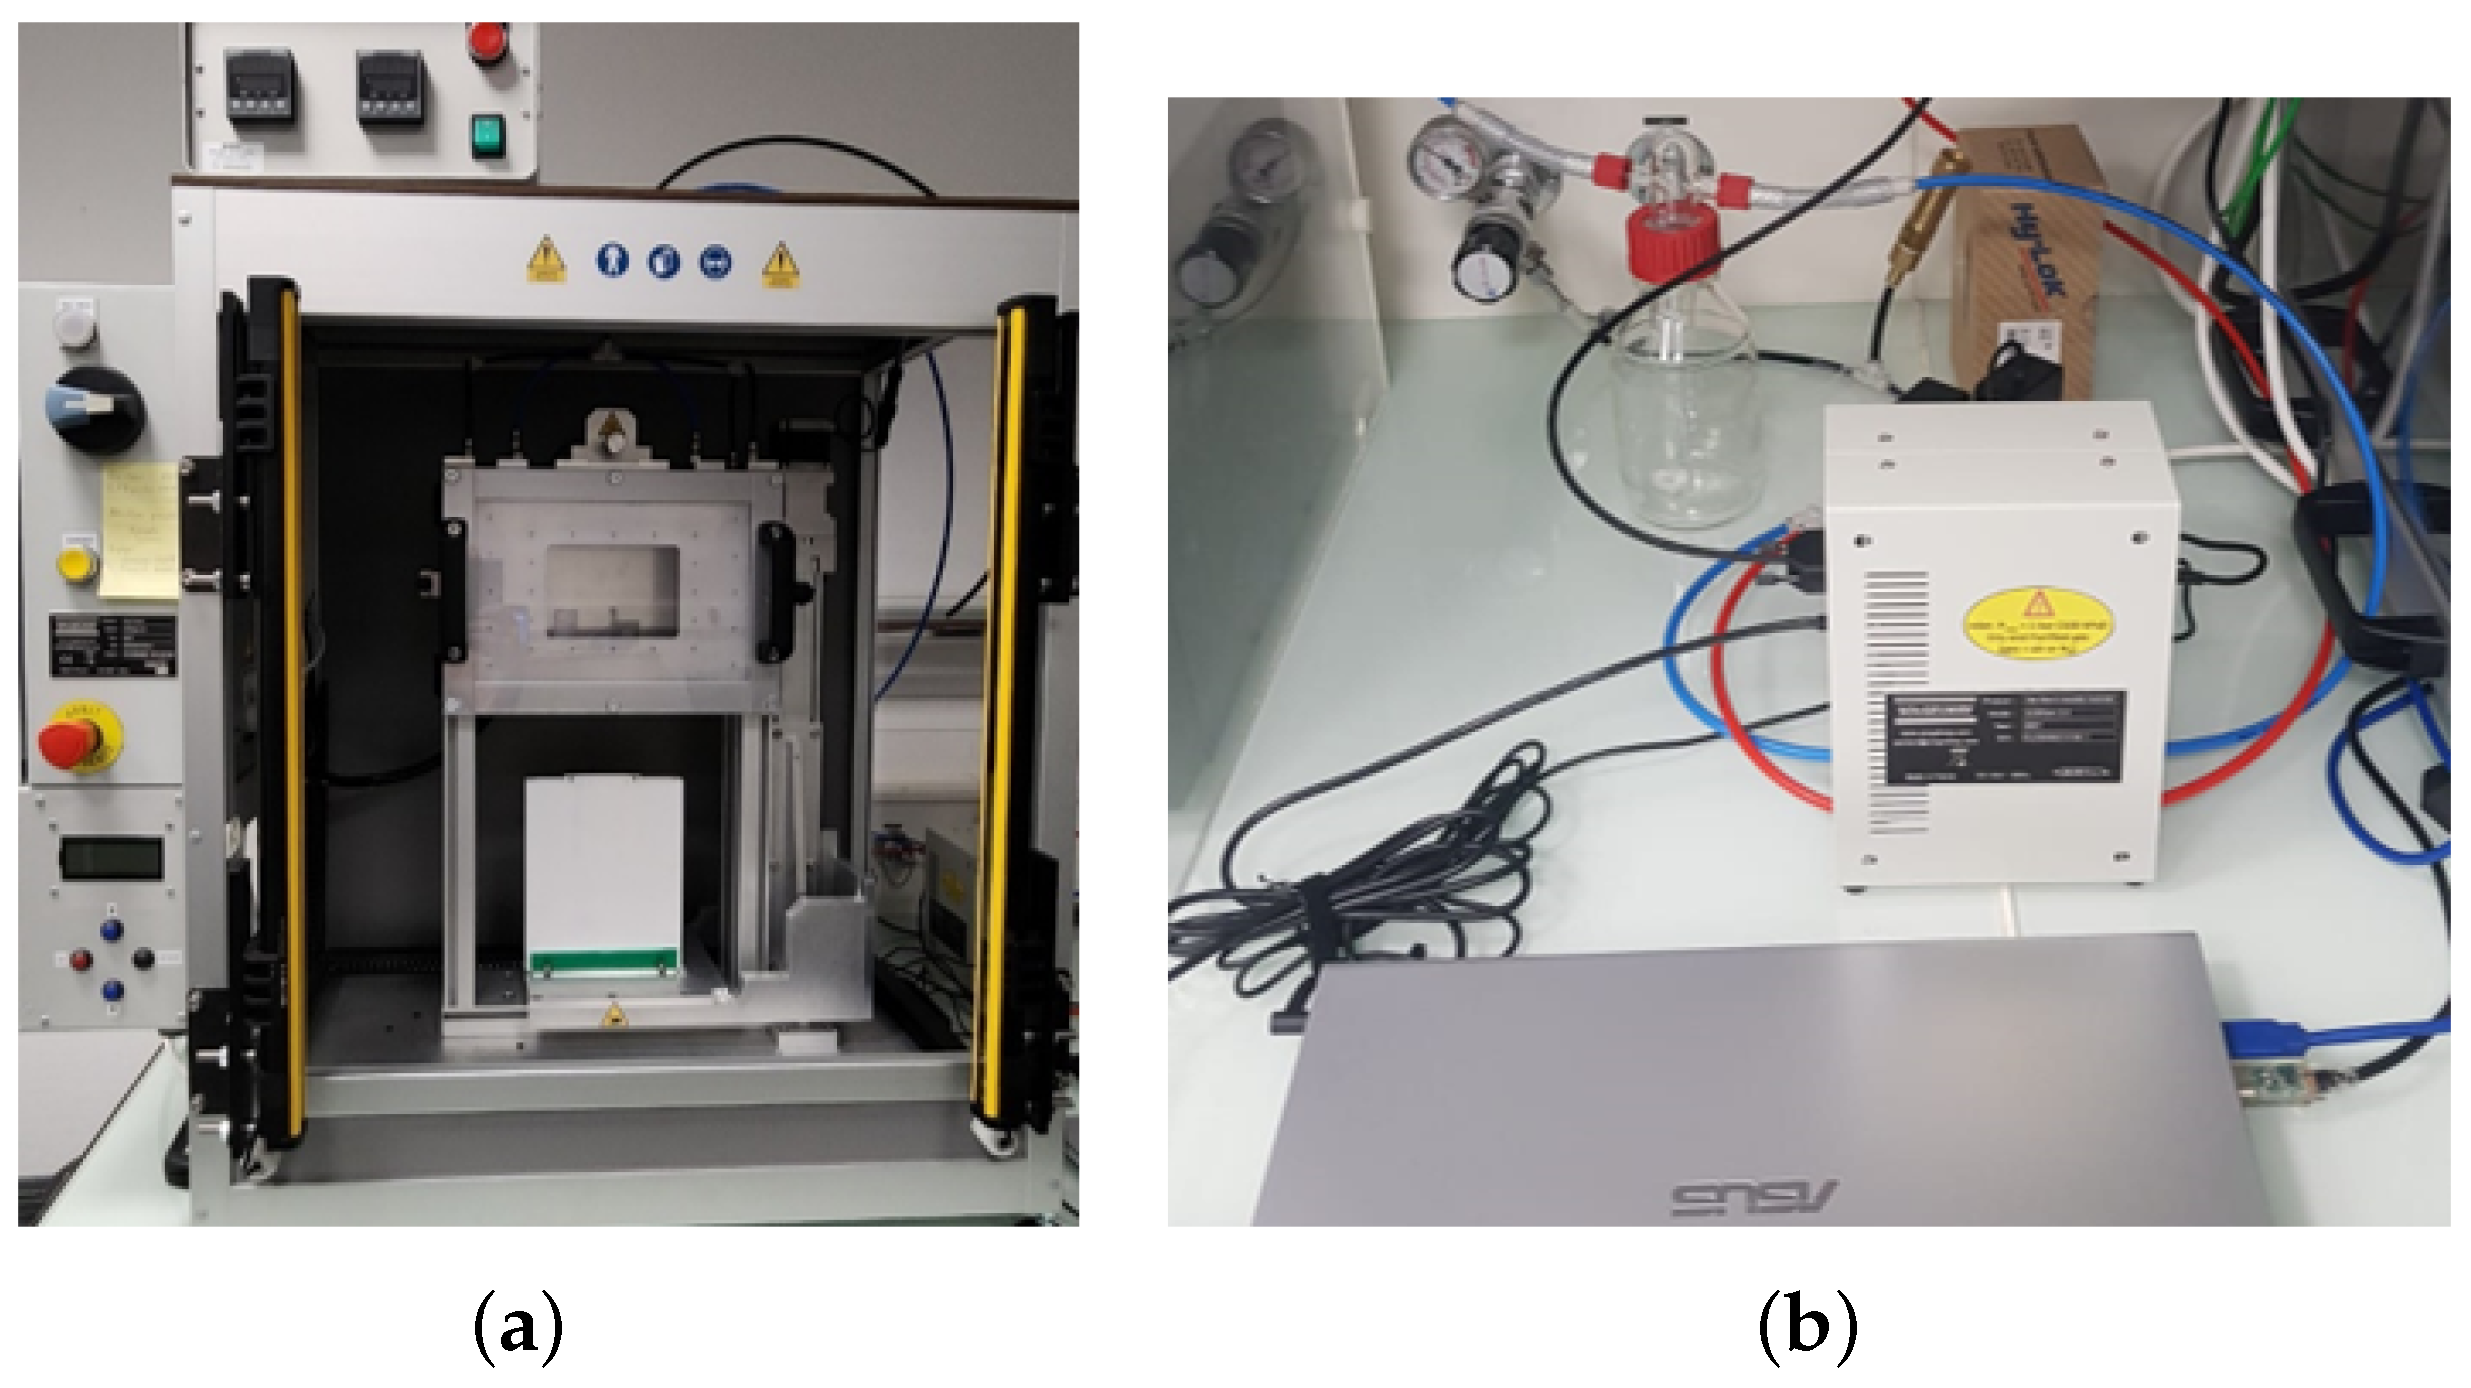
2.2. Equipment Used
2.3. NPs Addition
3. Results and Discussion
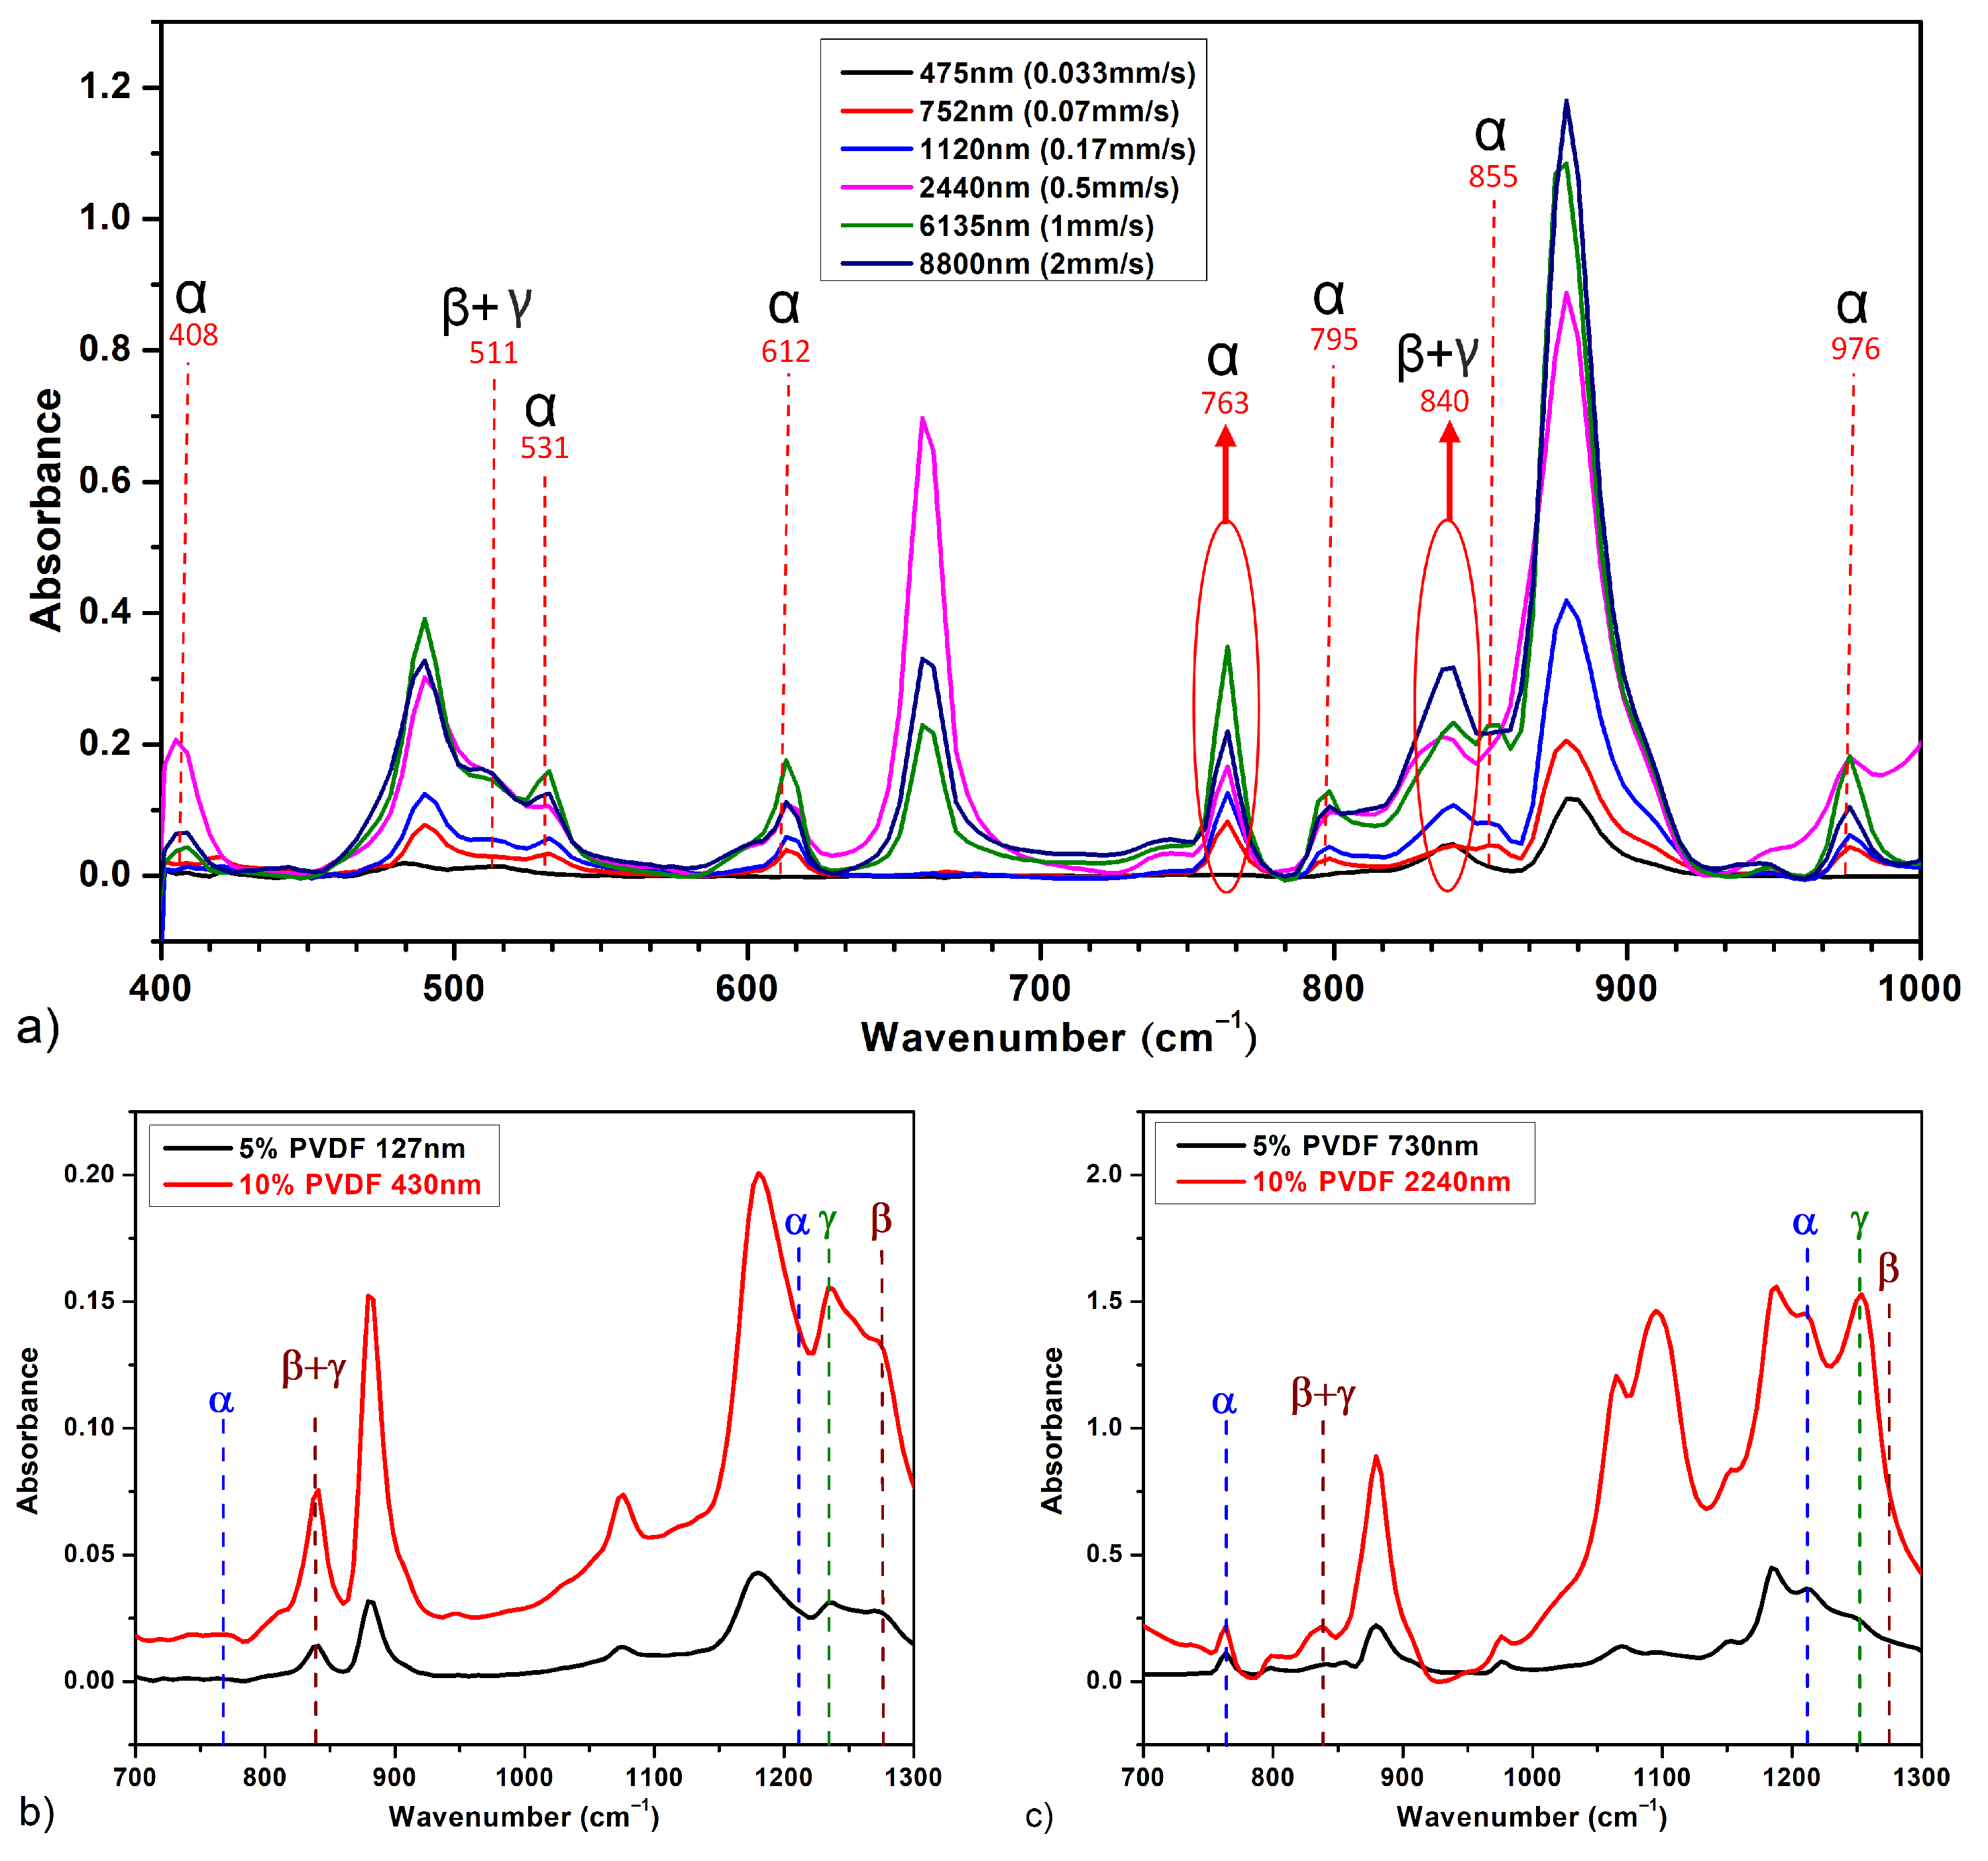
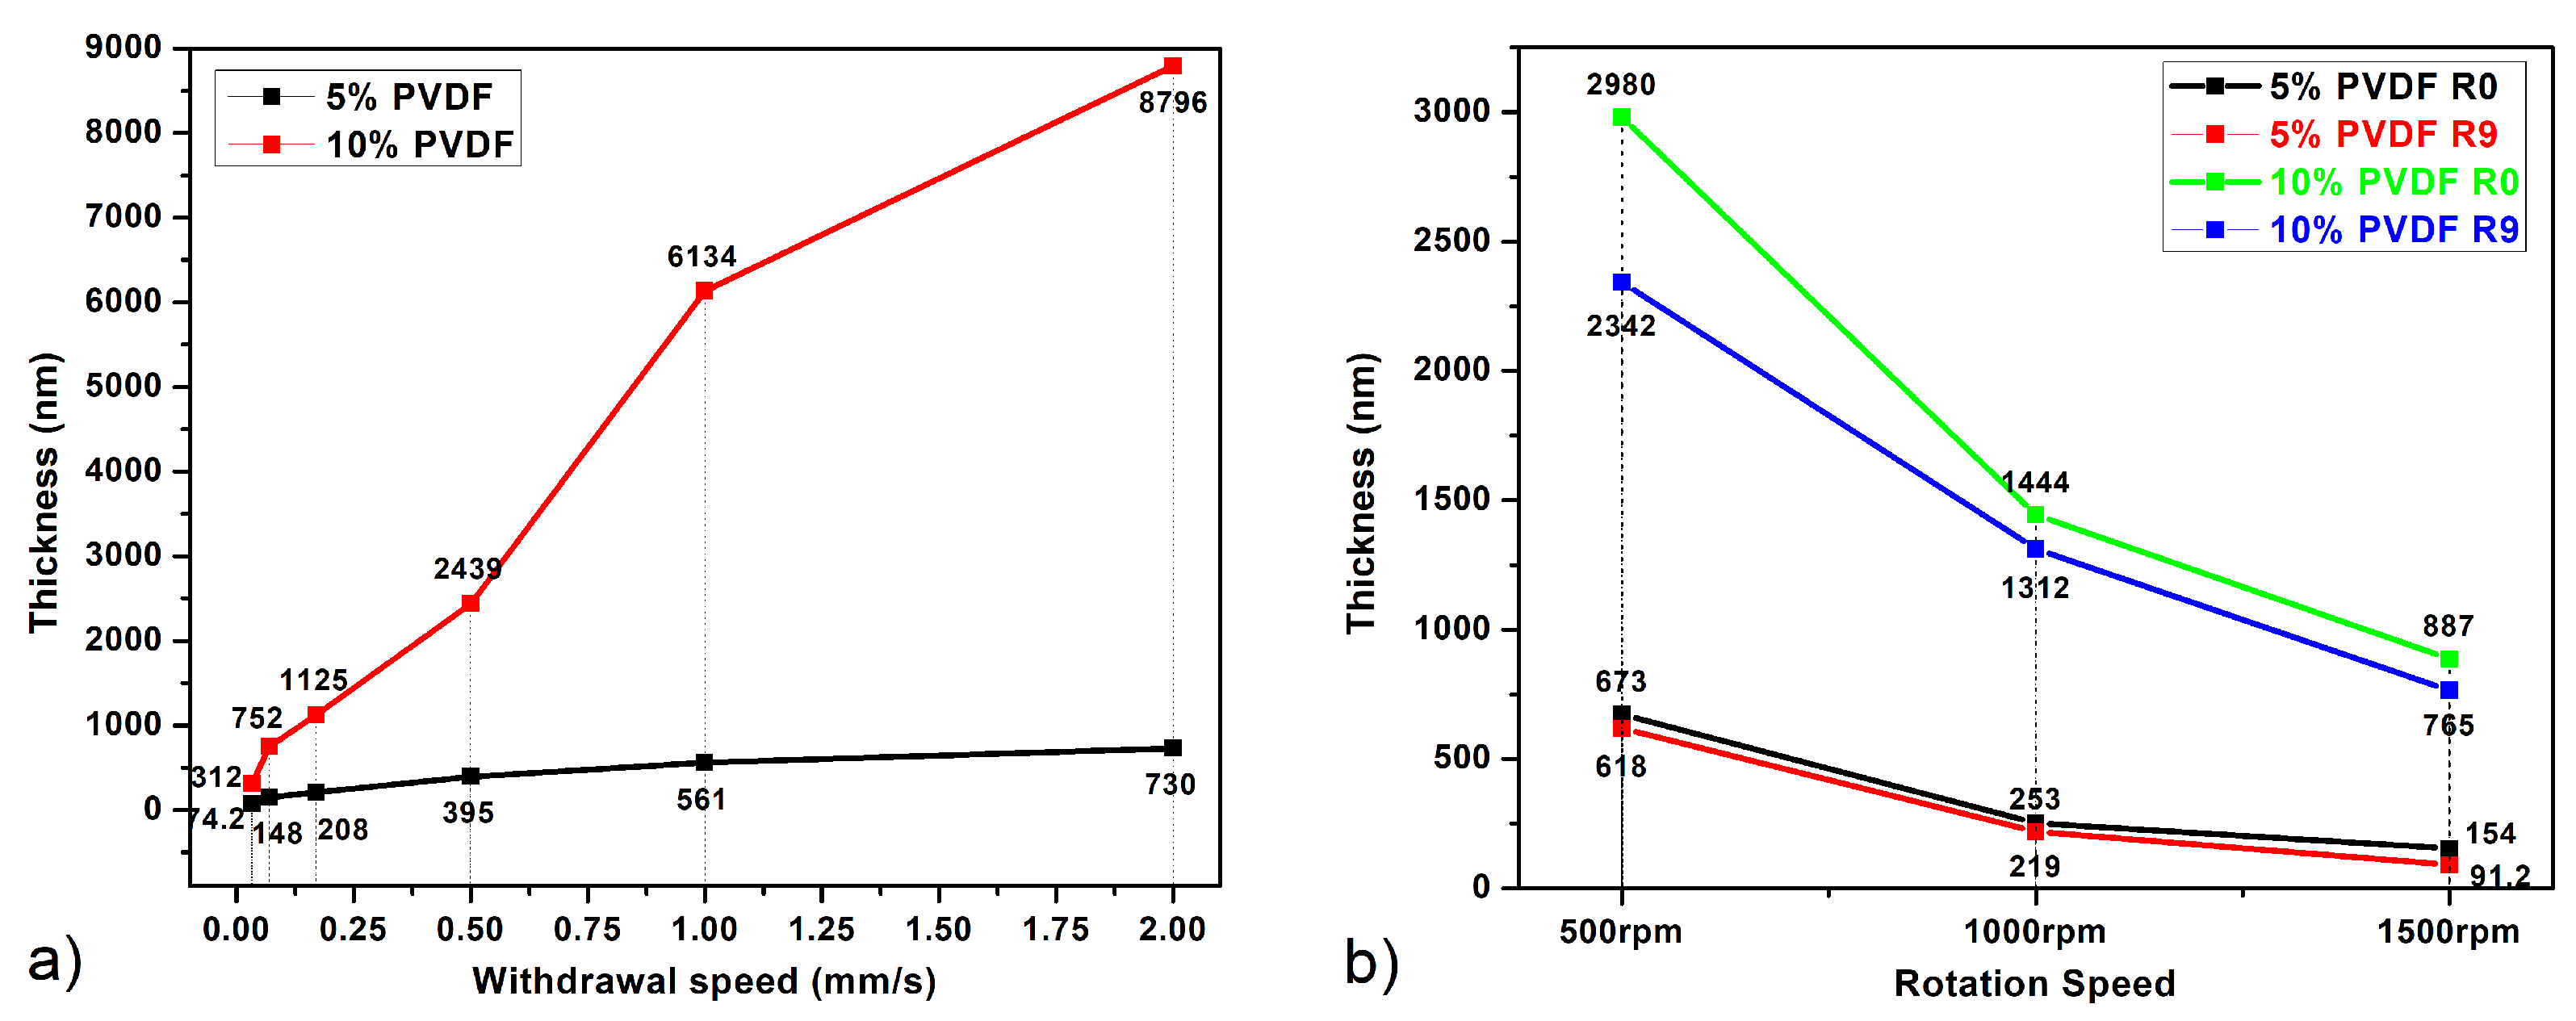
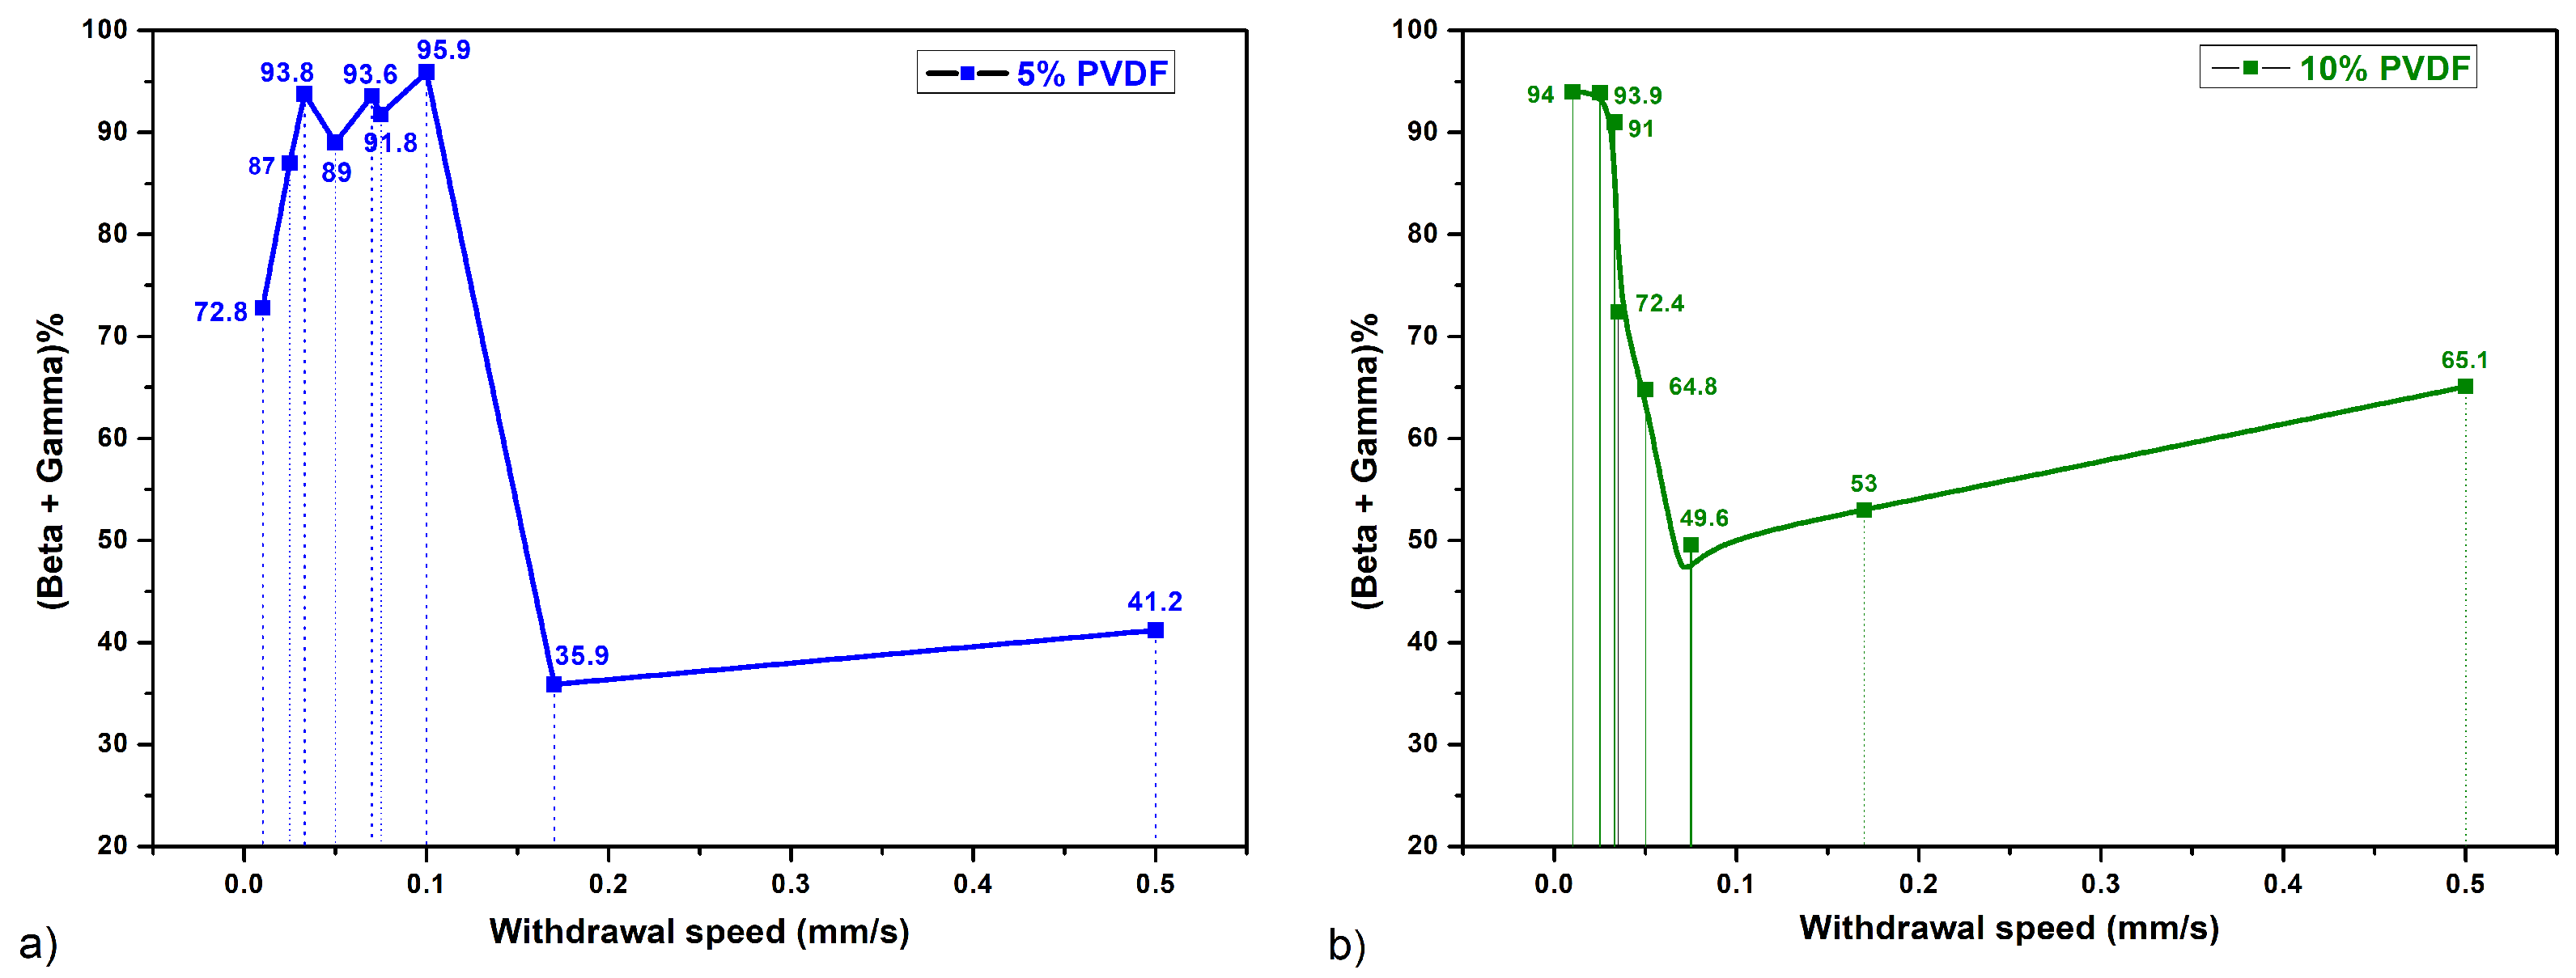
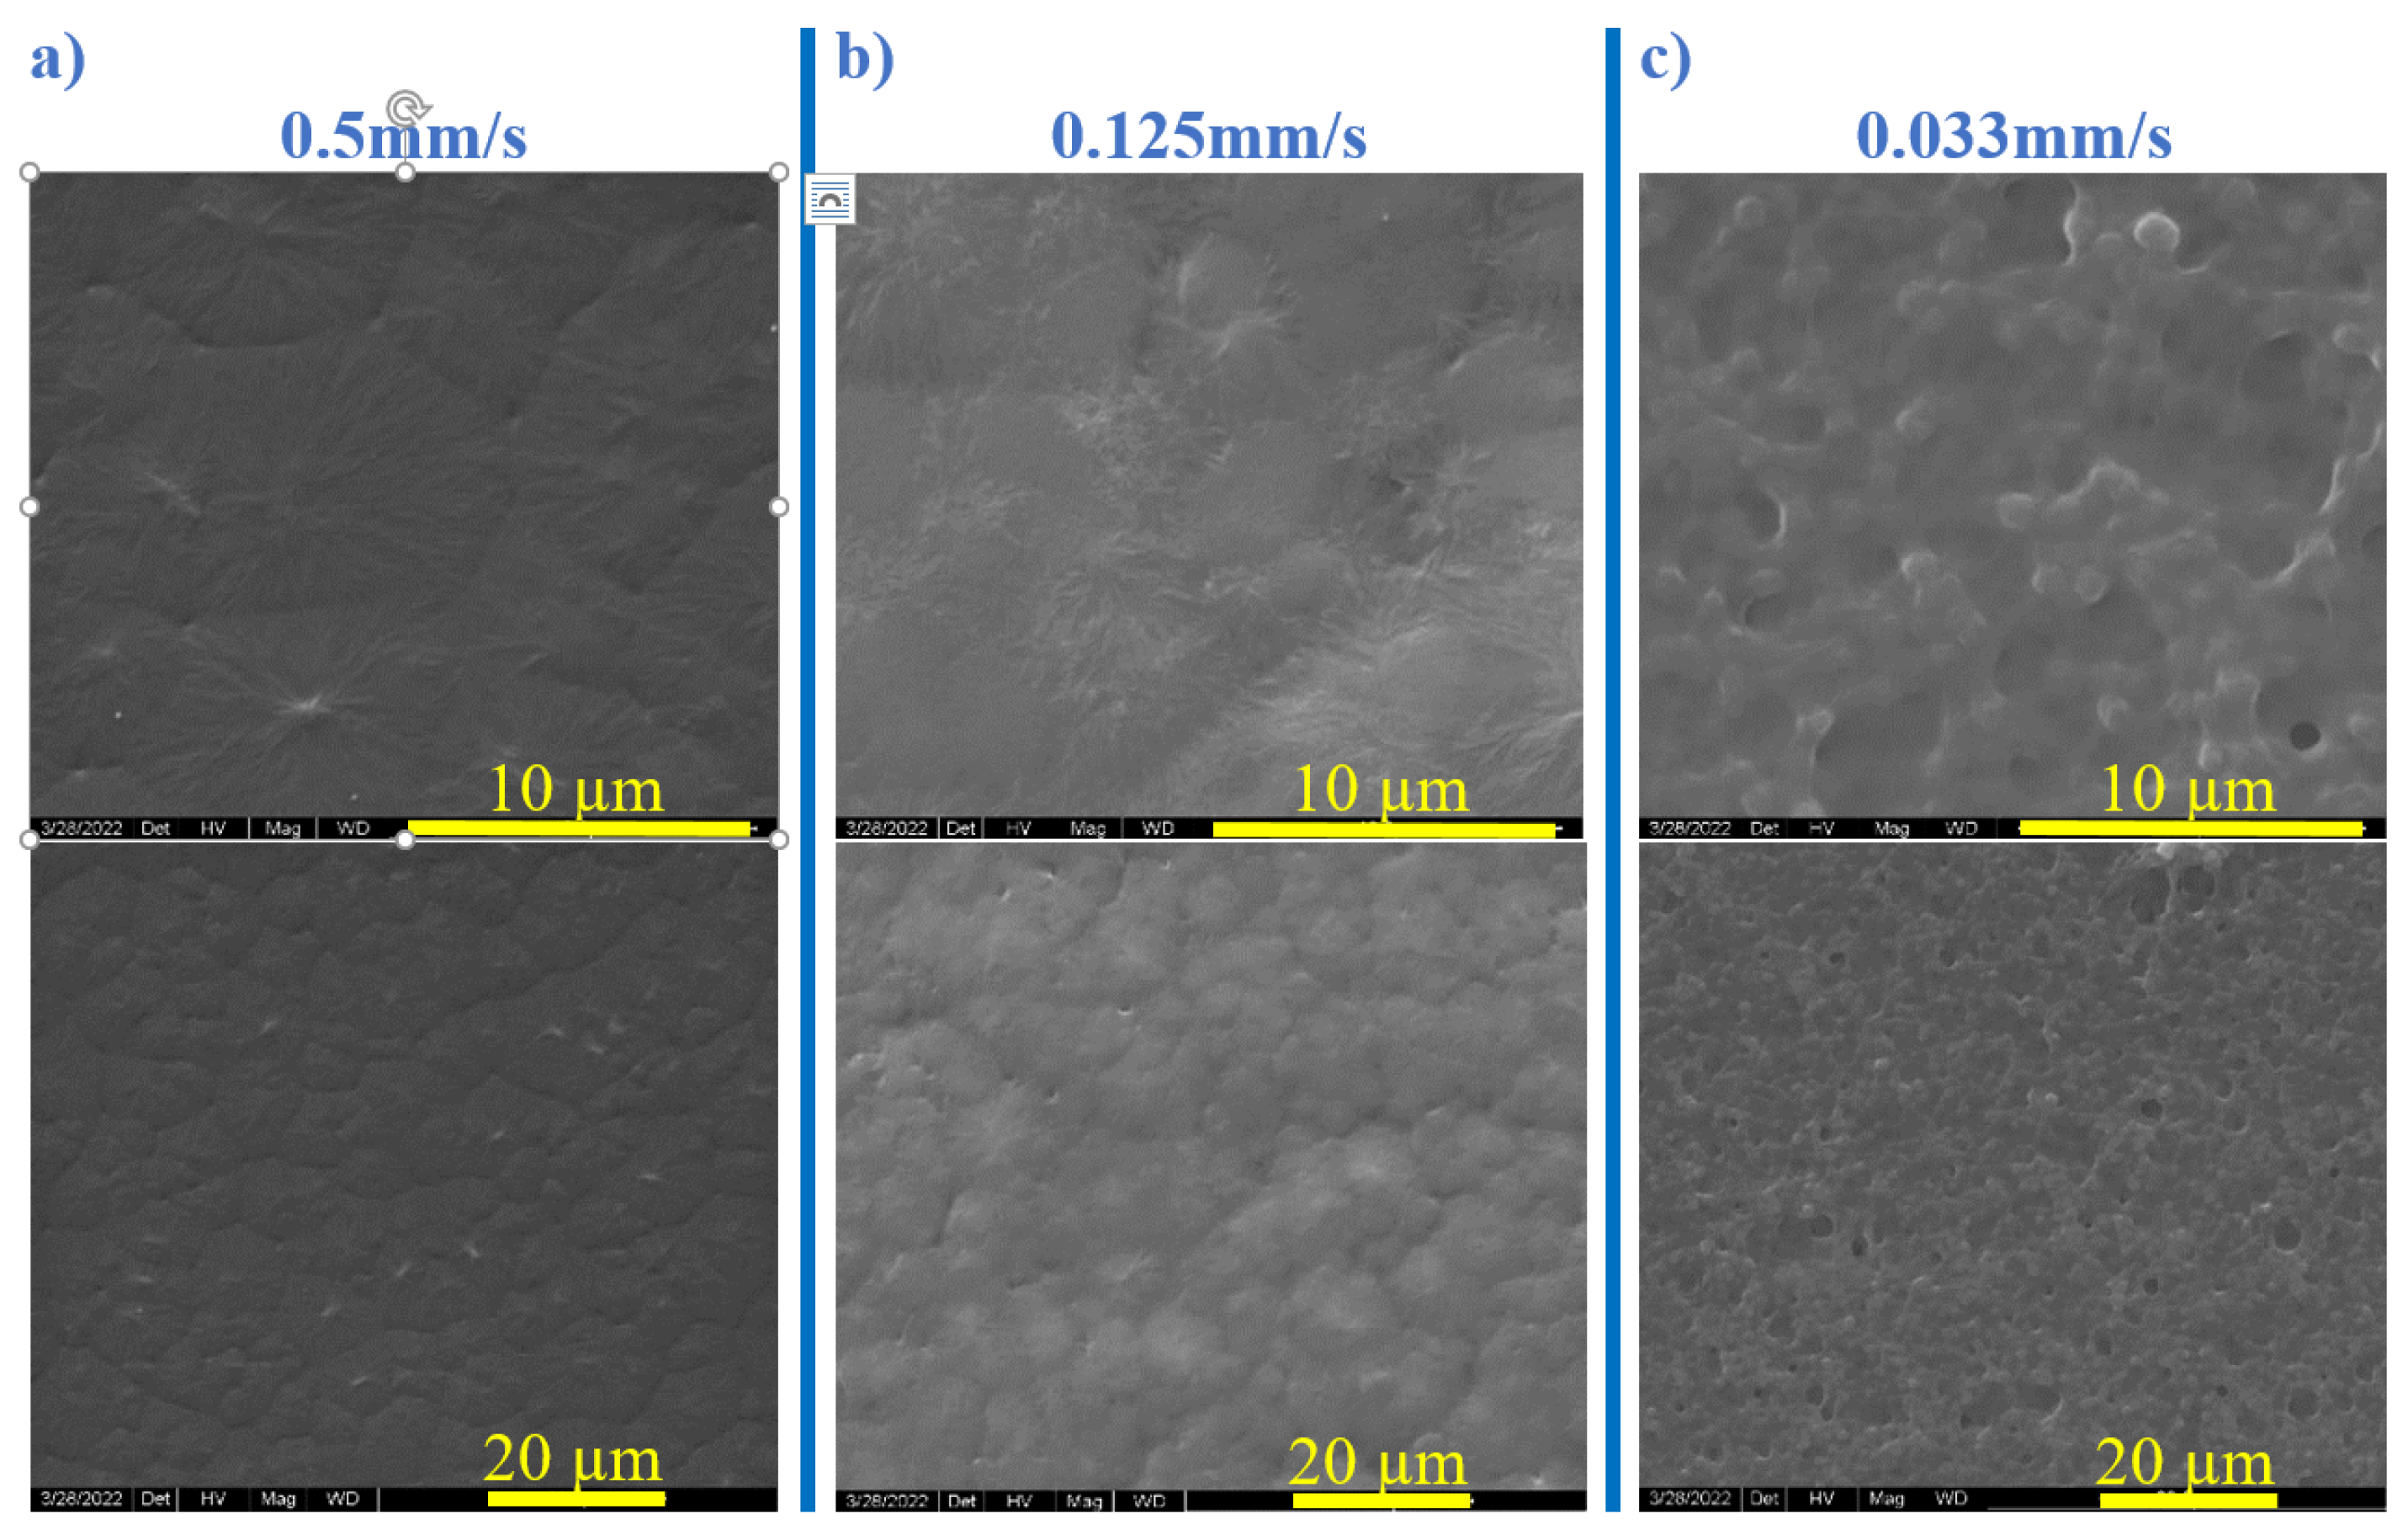
3.1. Dipping and Withdrawal Speed Impact
- Slow Withdrawal Speeds:
- Thin Film Formation: The slow movement enables a more uniform solvent evaporation, which gives polymer chains longer time to rearrange [23].
- High -phase and -phase Fractions: The slow evaporation rate enhances the formation of both and phases in PVDF. This slower solvent loss facilitates the necessary planar zigzag conformation for -phase formation and supports the distinct packing needed for -phase. The extended withdrawal time allows PVDF chains to align and pack efficiently into these electroactive structures.
- Enhanced Electroactivity: Higher - and -phase contents enhance electroactive properties. Slow solvent evaporation leads to fewer defects and better molecular ordering, improving the piezoelectric performance of PVDF.
- Intermediate Withdrawal Speeds:
- Moderate Film Thickness: At intermediate speeds, the solvent evaporation rate is faster, leading to less time for molecular rearrangement and thicker films than the ones obtained at slow speeds.
- Mixed Phases: The PVDF films obtained at these speeds typically contain a mixture of -, -, and -phases. The relatively rapid solvent evaporation forms the kinetically favored -phase. This rapid evaporation prevents the complete alignment of the polymer chains into the - and -phases.
- Balanced Properties: These films exhibit balanced properties but lower electroactivity compared to films formed at slower speeds.
- Fast Withdrawal Speeds:
- Thick Films: A very fast solvent evaporation rate occurs as the high withdrawal speeds lead to significantly thicker films [25].
- Predominantly -phase: The quick solvent loss favors the formation of the thermodynamically stable but non-polar -phase while hindering the alignment of PVDF chains into the - and -phases. The high rate of solvent evaporation produces more amorphous but less ordered structures.
- Reduced Electroactivity: The films are mechanically robust, but there is the predominance of the -phase results.
- Solvent Evaporation Kinetics: Slow withdrawal speeds where the solvent evaporation occurs gradually allow PVDF chains to attain the necessary planar zigzag conformation for the -phase and the distinct packing associated with the -phase.
- Chain Mobility: Sufficient mobility for the polymer chains to orient and crystallize is provided by the extended drying time, leading to the - and -phases’ formation.
- Surface Effects: Thin films have a higher surface-to-volume ratio, and due to the preferential alignment of PVDF chains near the interface, the surface interactions with the substrate can promote the - and -phase formation.
- Transversal Forces: By promoting chain alignment and phase transformation, the application of transversal forces during slow withdrawal can further enhance the formation of electroactive phases.
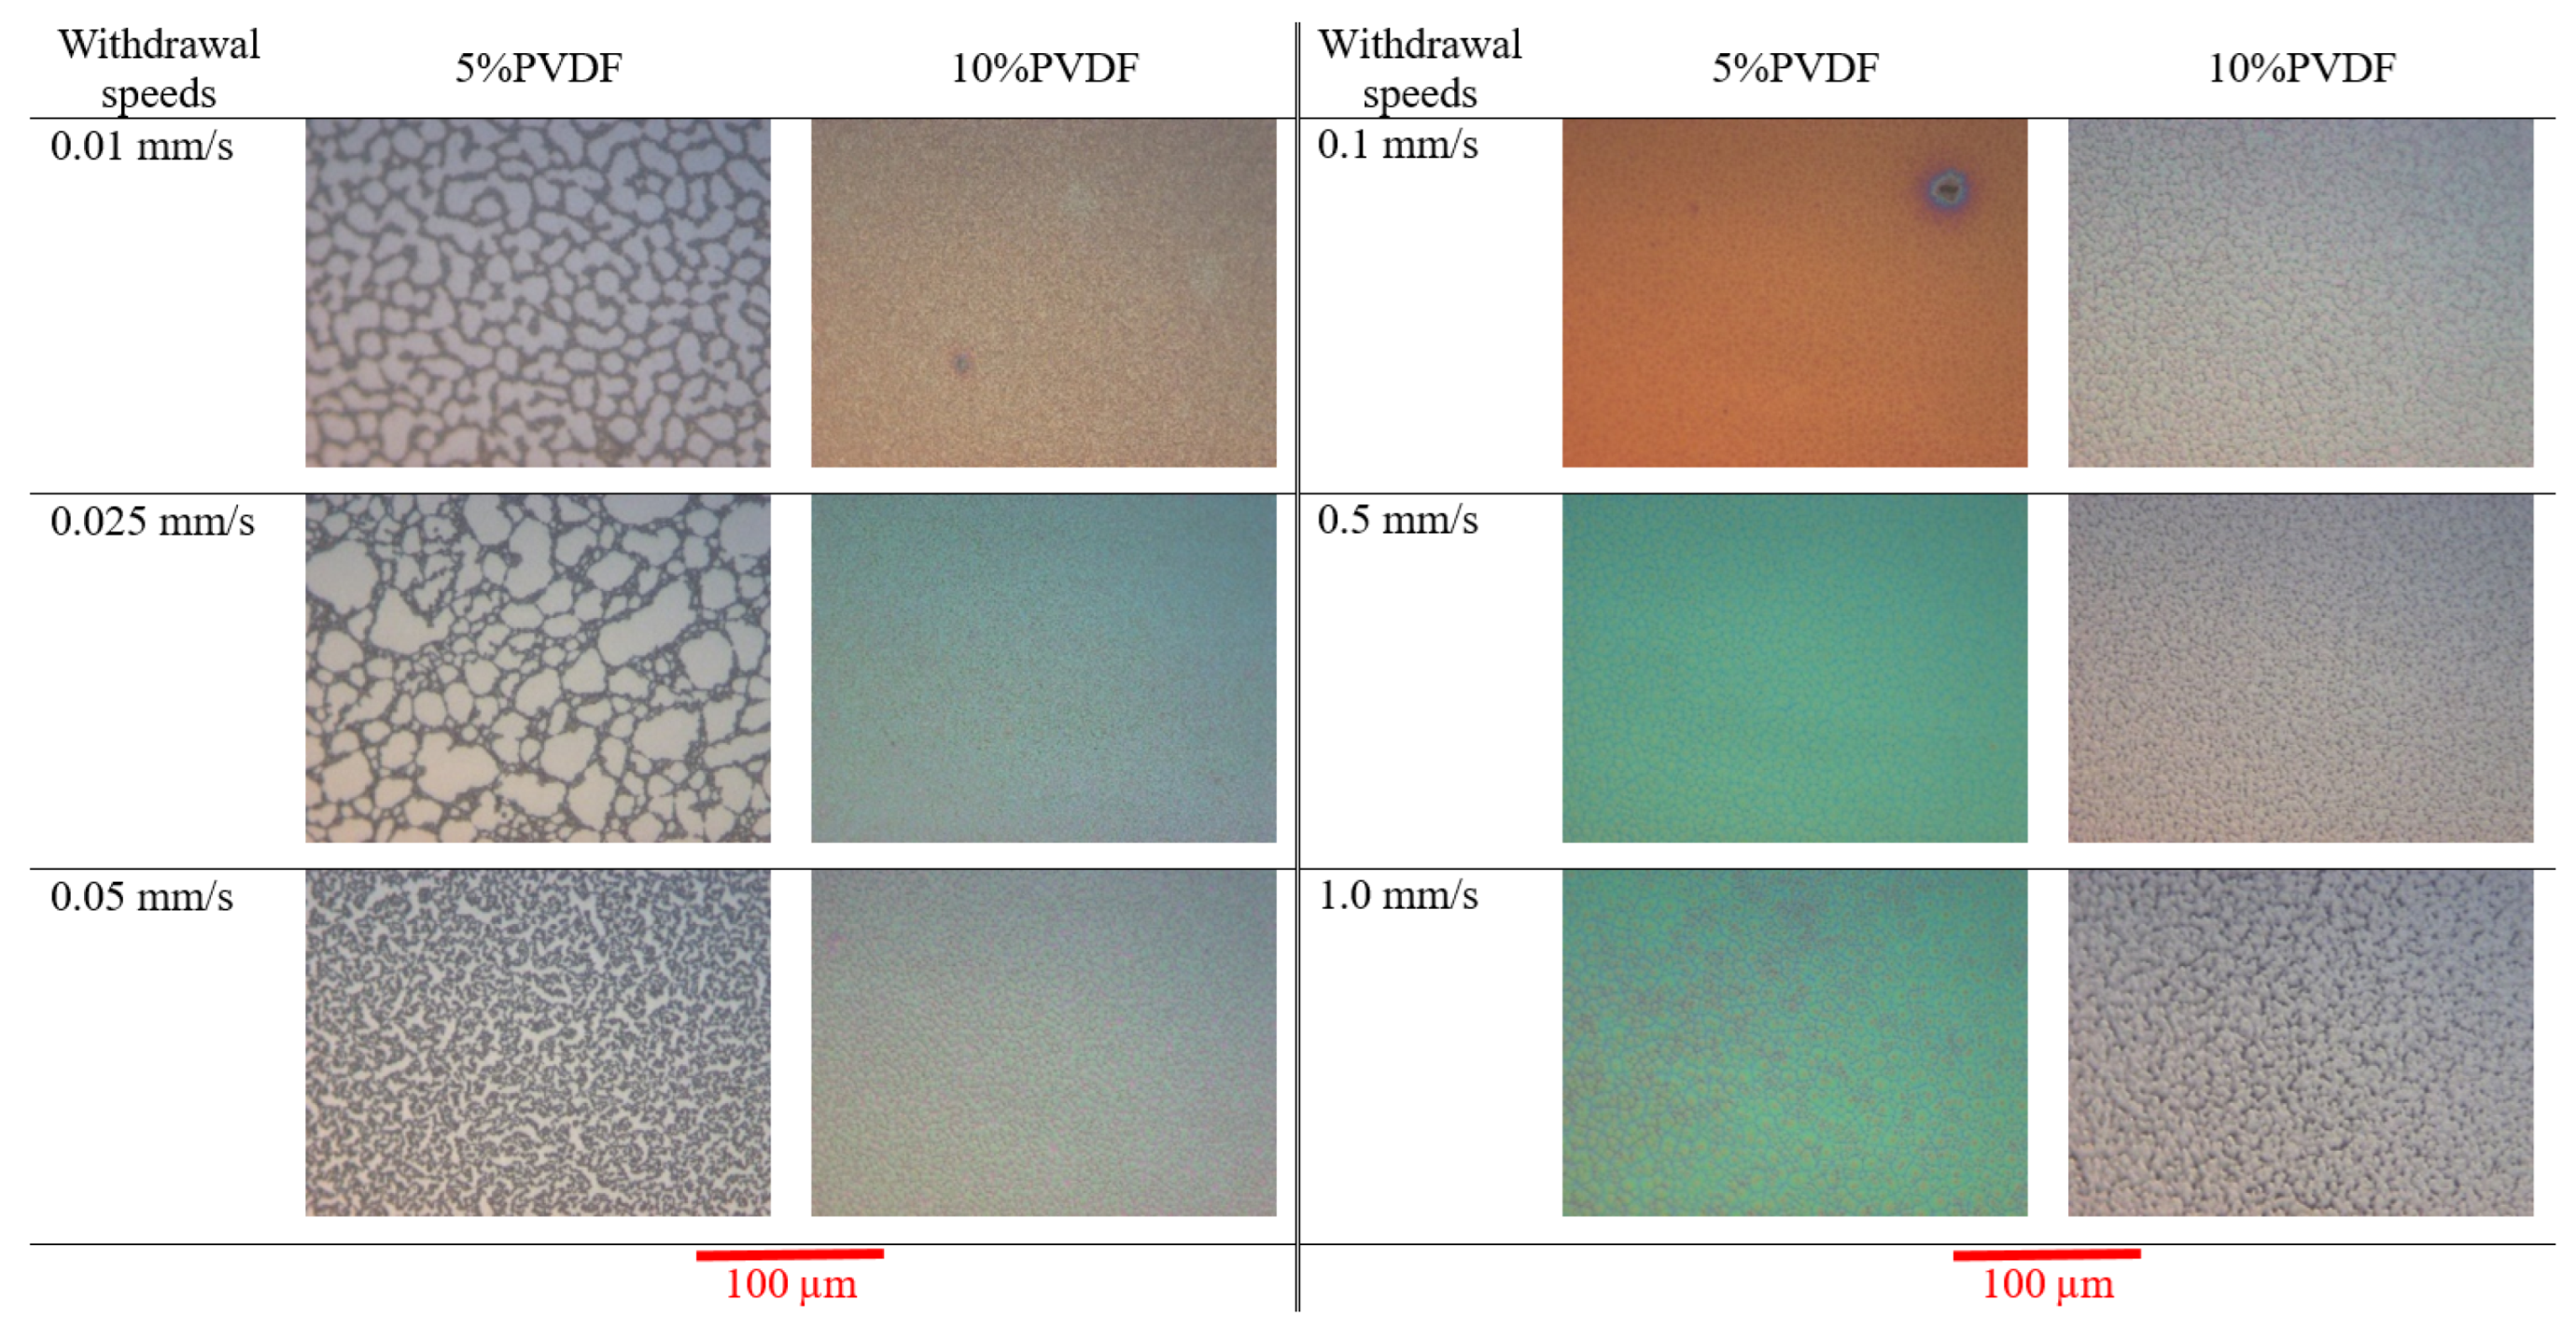
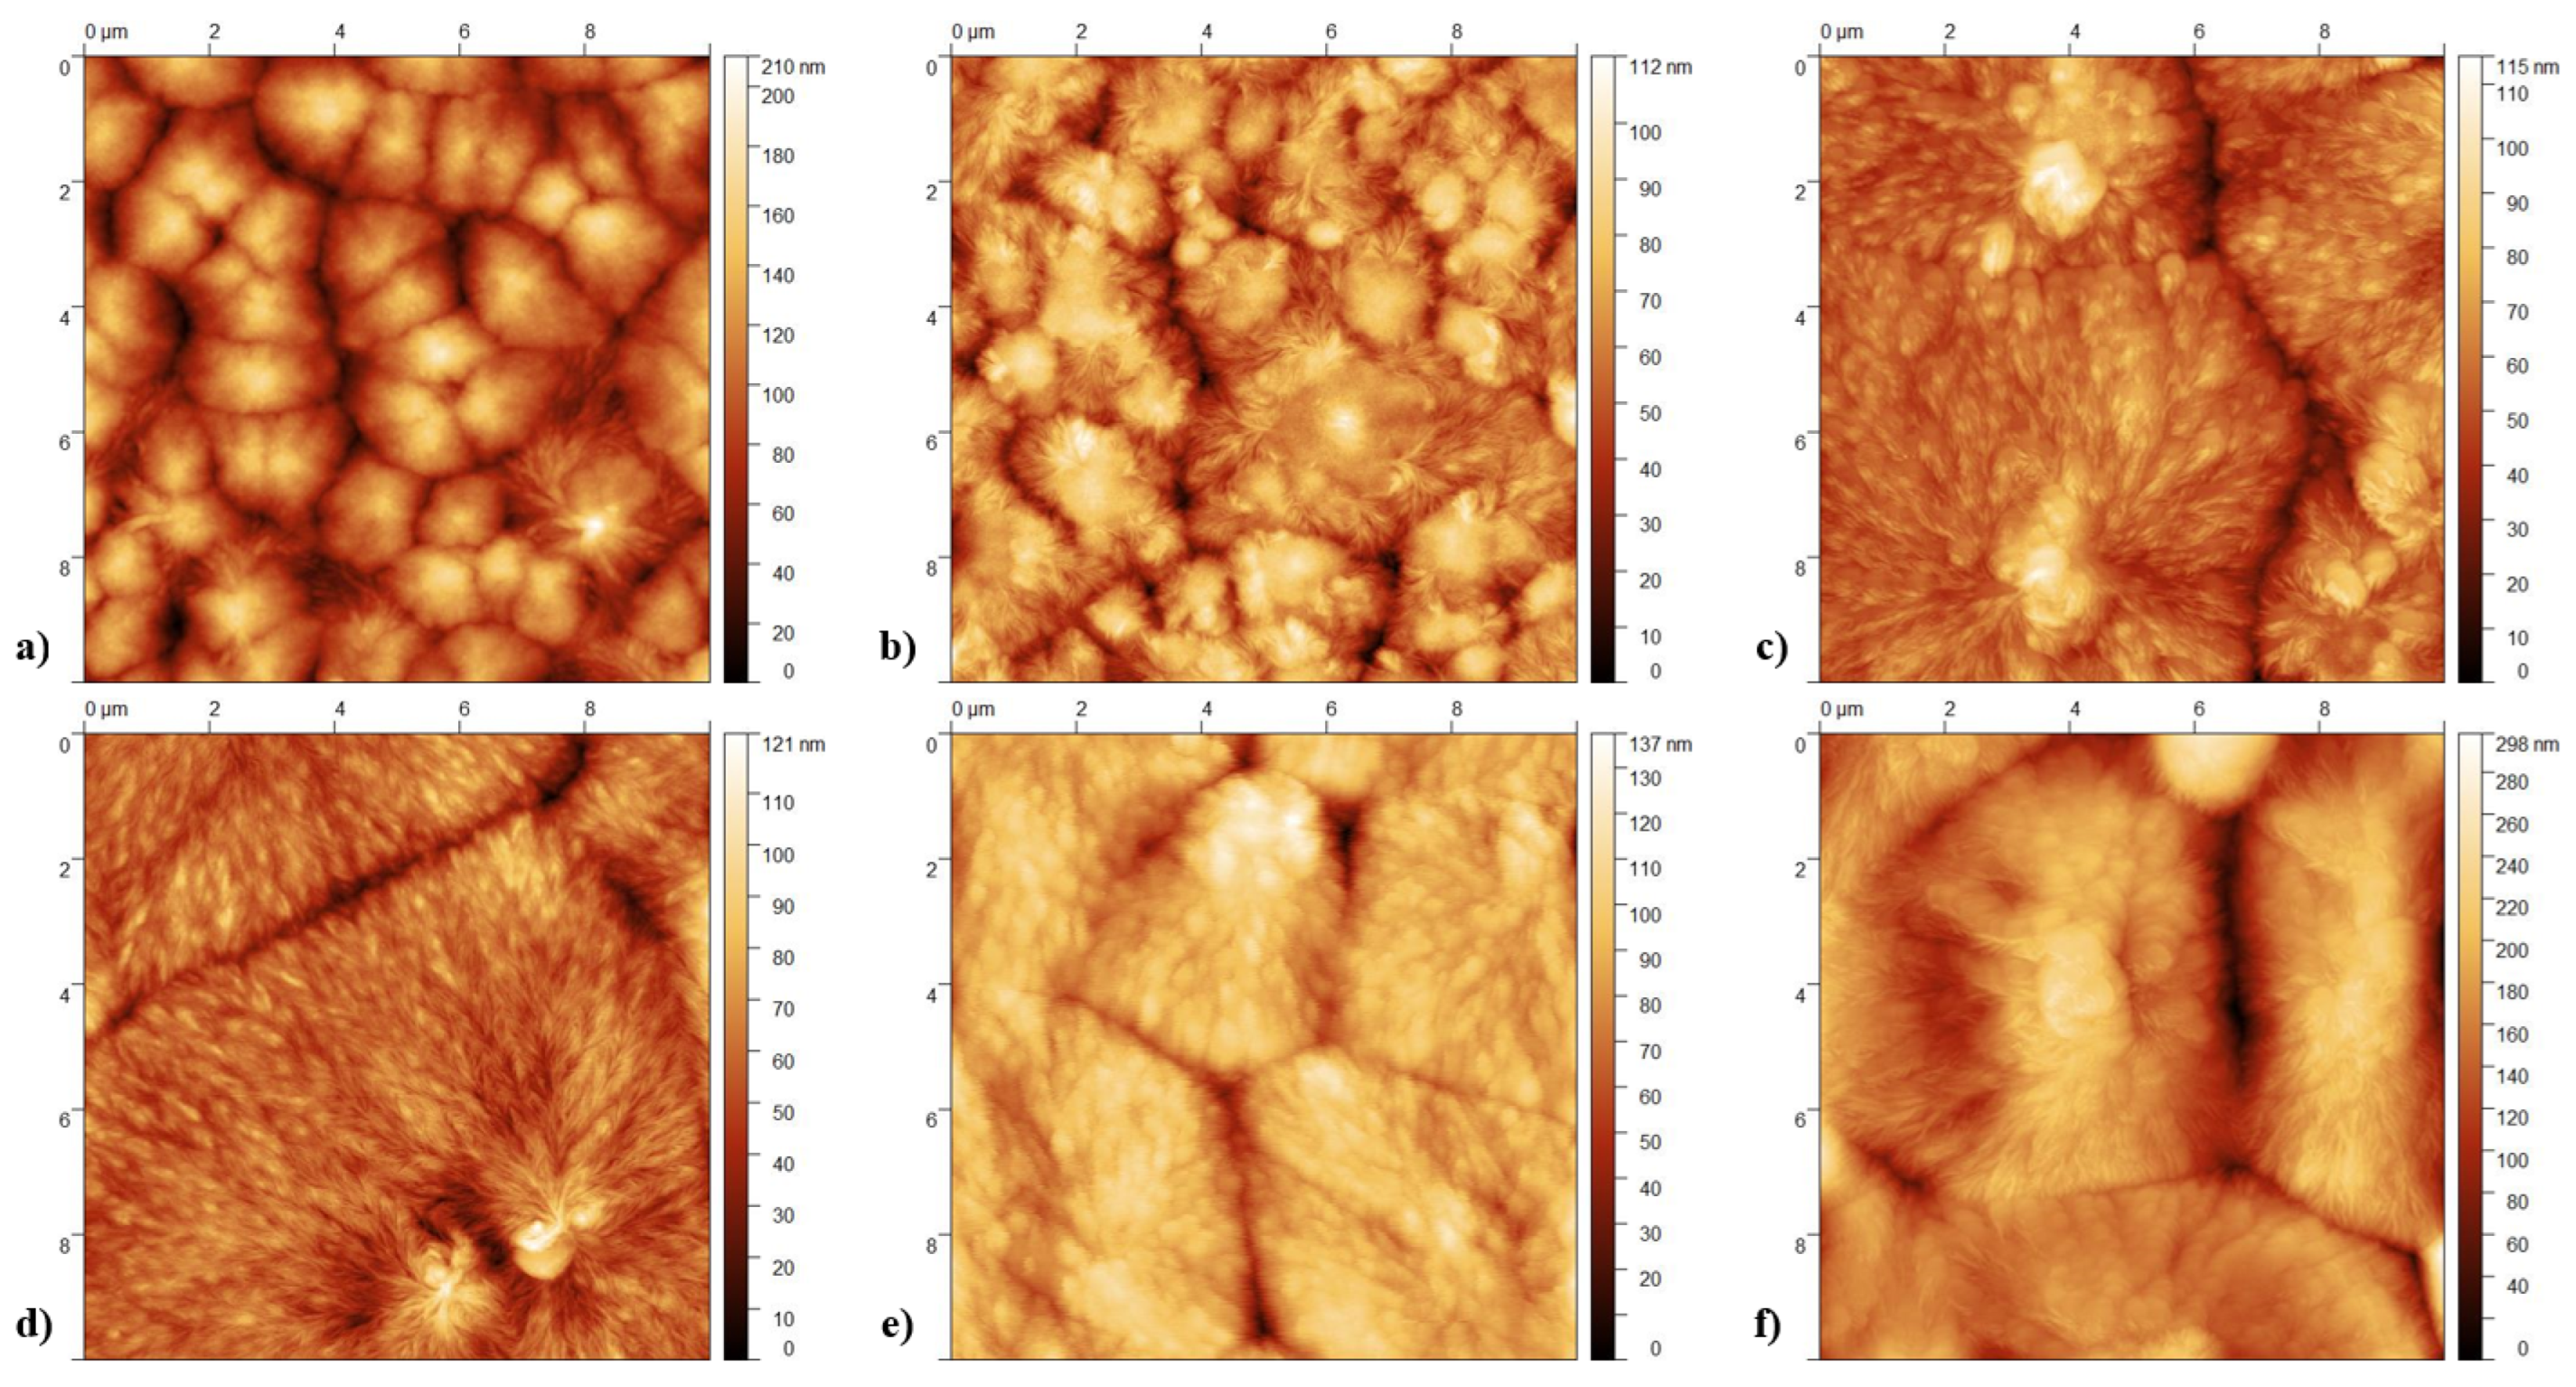
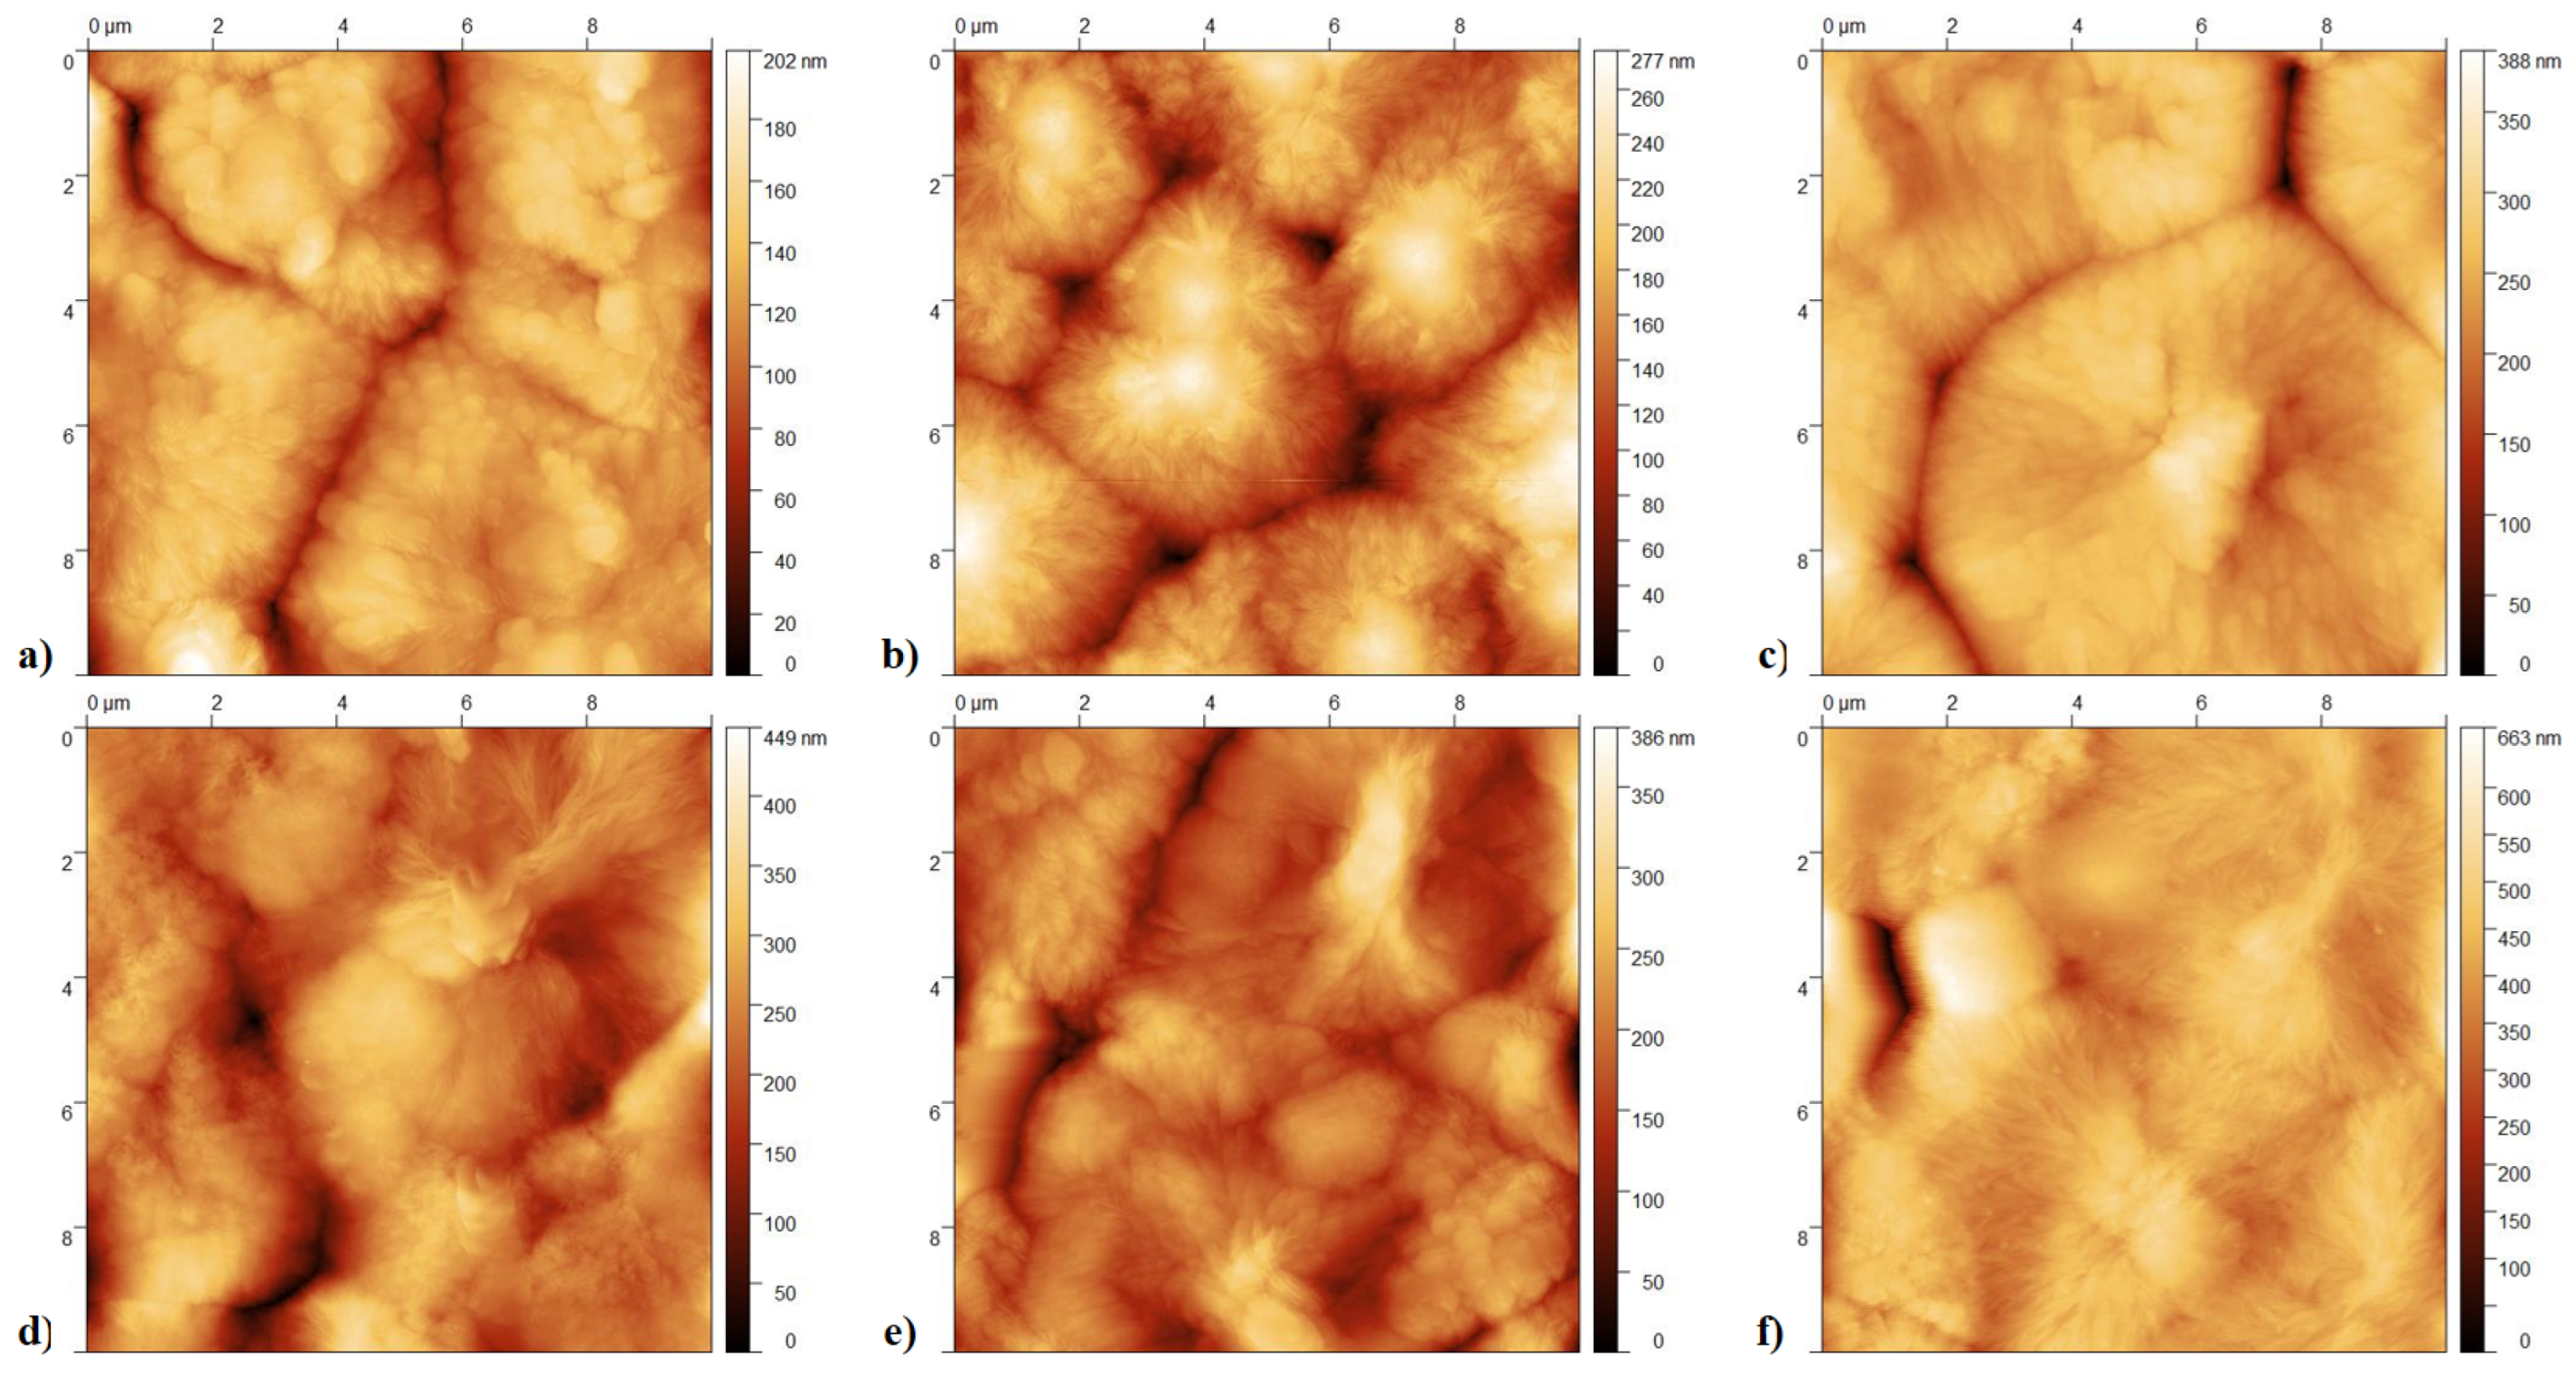
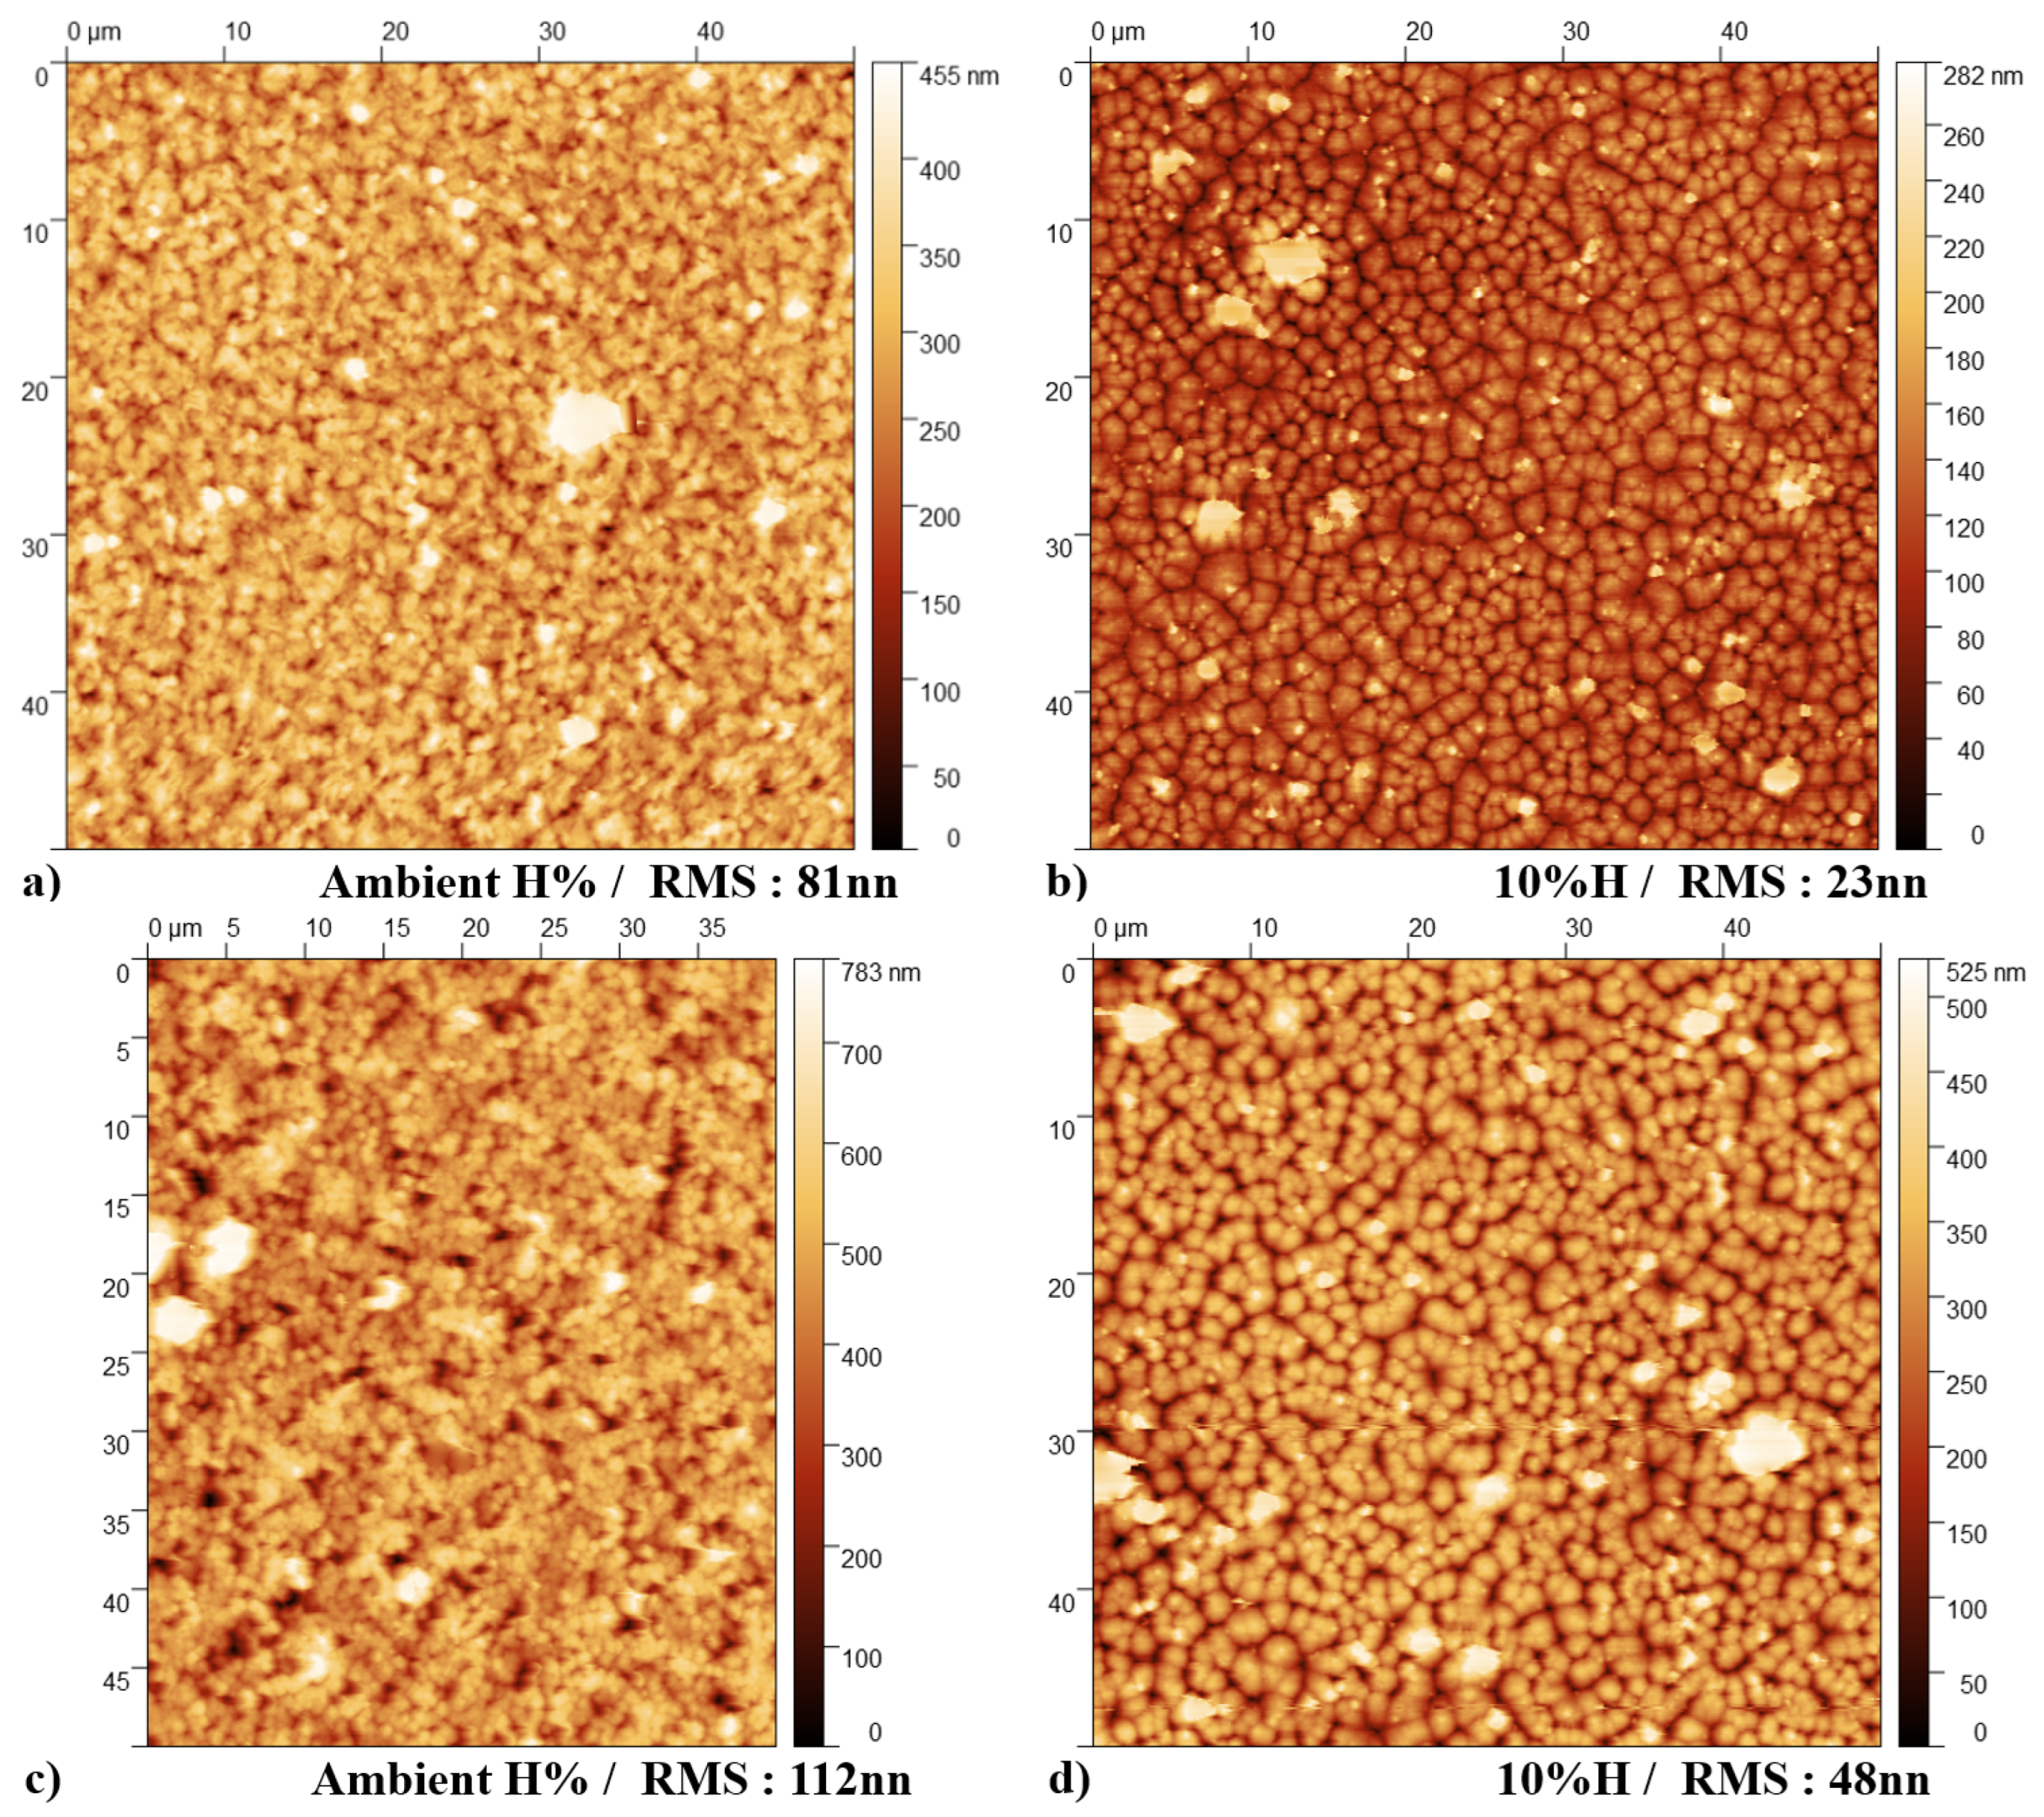
3.2. Imaging and Topography Analysis
- Crystallization Behavior: The -phase of PVDF crystallizes more easily compared to other phases during the cooling process from the melt. This leads to the formation of spherulites, as the phase tends to nucleate and grow in a radial pattern [43].
- Molecular Conformation: The -phase consists of a non-polar TGTG’ (trans-gauche-trans-gauche’) molecular conformation. The radial growth necessary for spherulite formation is facilitated by this specific arrangement.
- Thermodynamic Stability: At lower temperatures, the -phase is more thermodynamically stable than other phases, making it more likely to form and grow into spherulites during the cooling process [44].
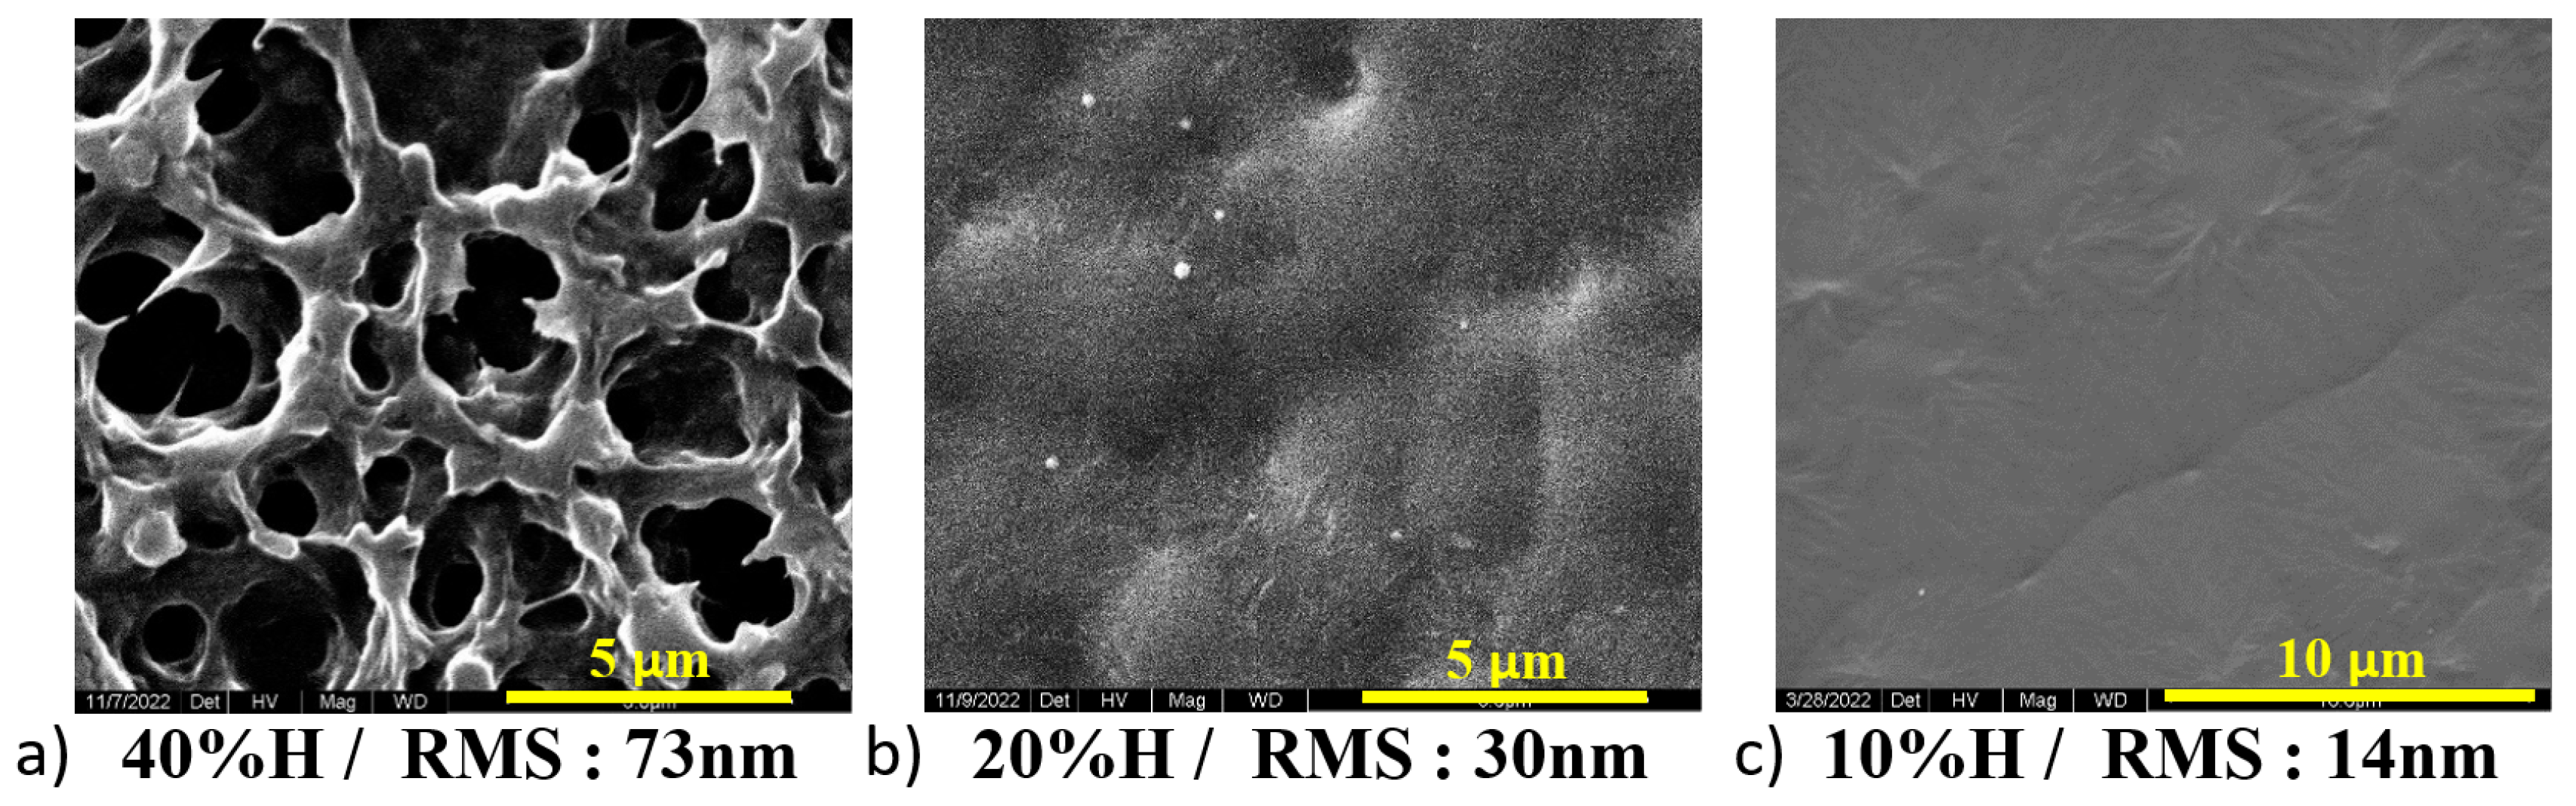
3.3. Relative Humidity Percentage Control
- High Humidity Conditions:
- –
- Slower Solvent Evaporation: Due to the increased presence of water vapor in the air, a high humidity level slows down the evaporation rate of the solvent. More controlled and gradual crystallization of PVDF is allowed.
- –
- Enhanced Chain Mobility: The time needed for the rearrangement into the planar zigzag conformation required for the formation of the electroactive -phase and the distinct molecular packing needed for the -phase can be achieved through the slower evaporation rate [46].
- –
- High - and -phase Content: The formation of and phases is favored by the increased chain mobility and prolonged crystallization time under high humidity levels.
- Low Humidity Conditions:
- –
- Rapid Solvent Evaporation: The time available for PVDF chain mobility and alignment is limited due to the low humidity level (reduced presence of water vapor), which leads to faster evaporation of the solvent.
- –
- Reduced Chain Mobility: The chains are locked in a more disordered state due to the quick solvent loss, which hinders their movement, preventing them from achieving the necessary conformation for - and -phase formation [47].
- –
- Dominance of -phase: The -phase is kinetically favored when there is insufficient time for the chains to rearrange, favoring the formation of this thermodynamically stable phase [45].
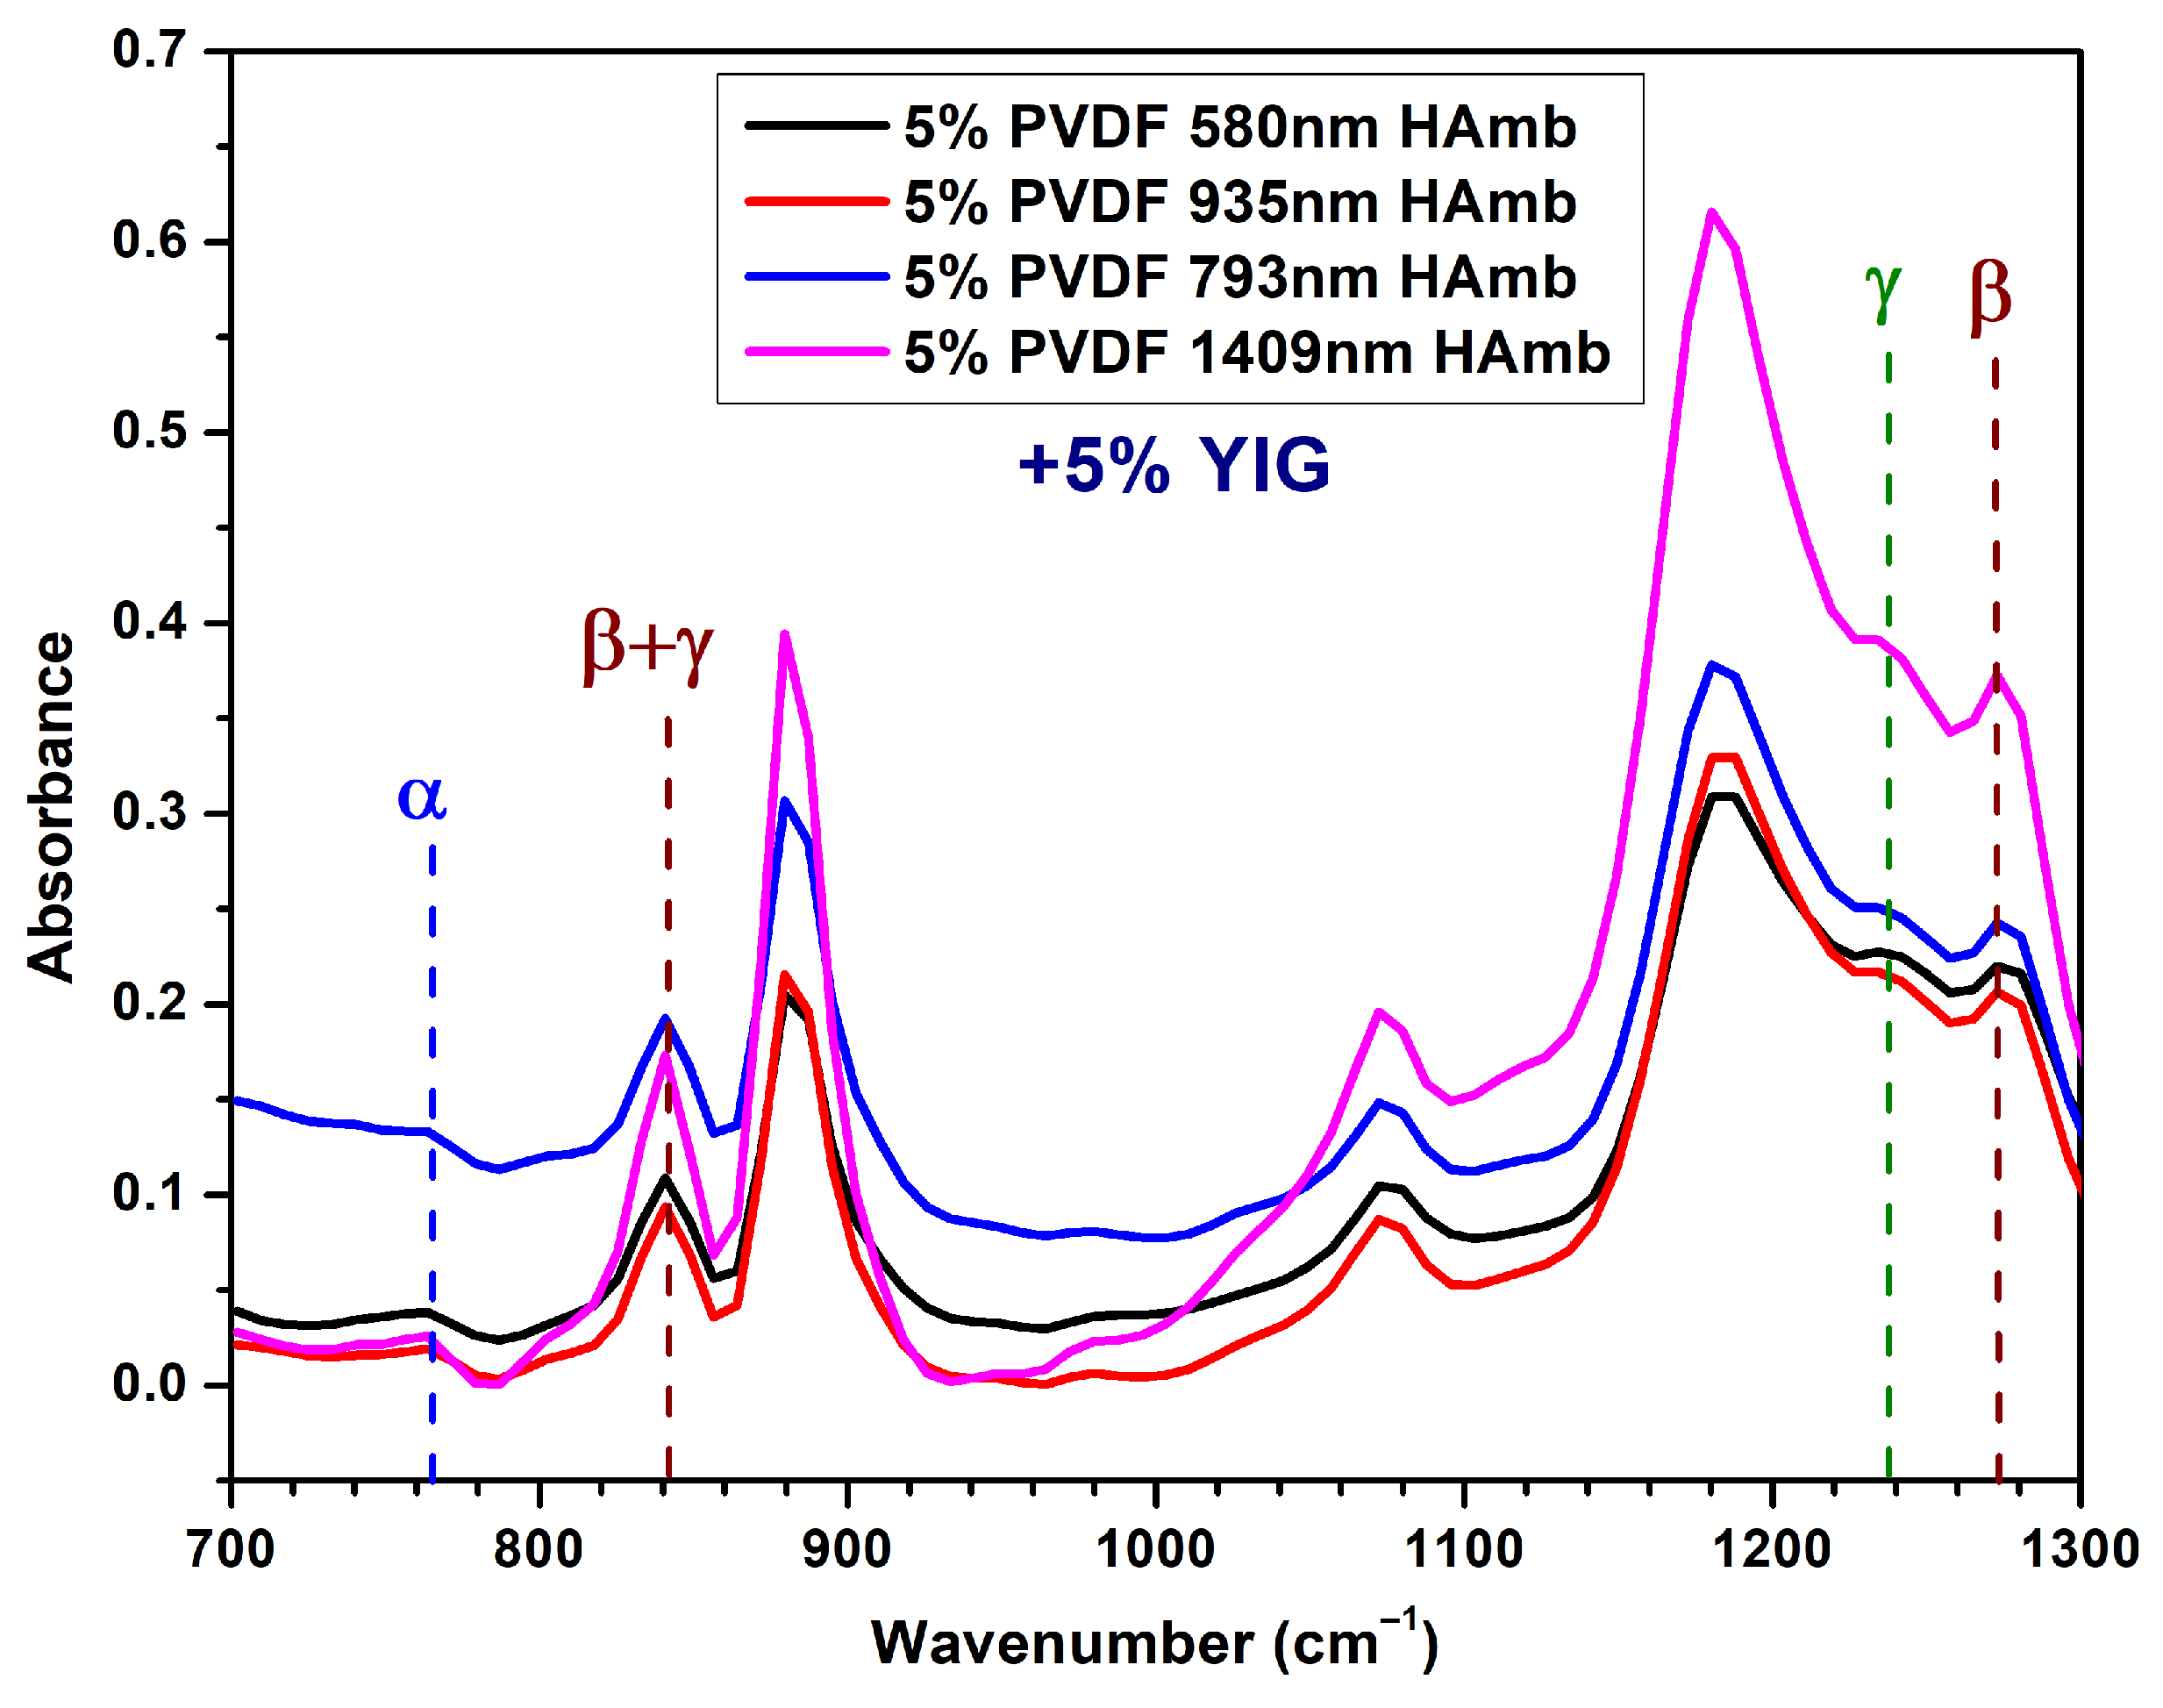
3.4. Nanoparticles Addition

- Nucleation and Crystallization Dynamics:
- Heterogeneous Nucleation: Due to their surface energy and interaction with PVDF, YIG nanoparticles act as heterogeneous nucleation sites [36]. This favors the formation of the phase by lowering the energy barrier for nucleation and, thus, providing a template for the alignment of PVDF chains.
- Enhanced Nucleation Density: The number of nucleation sites is increased by the high surface area of well-dispersed YIG NPs, promoting finer and more uniform crystalline structures, which facilitates the formation of the phase.
- Interfacial Interactions and Magnetic Influence:
- Dipole-Magnetic Interactions: The magnetic properties influence the dipolar interactions within the PVDF matrix, and these interactions can enhance the alignment of polymer chains into the higher dipolar nature phase, the phase.
- Electrostatic and Magnetic Effects: The phase is promoted by the presence of magnetic fields and the intrinsic properties of YIG, which can induce local magnetic fields affecting the molecular orientation of PVDF chains.
- Mechanical Stress and Morphological Effects:
- Stress-Induced Phase Transformation: The inclusion of YIG nanoparticles introduces mechanical stress within the PVDF matrix. This stress can facilitate the phase transformation from the phase to the phase by aligning the polymer chains under the influence of internal stress fields.
- Nanoparticle Dispersion: Uniform dispersion of YIG nanoparticles ensures a consistent stress distribution and maximizes the impact on phase transformation, promoting the formation of the phase.
- Thermal and Dielectric Properties:
- Enhanced Thermal Stability: By increasing a PVDF film’s thermal stability, YIG nanoparticles may have an impact on the phase stability and transformation kinetics. A higher -phase content can result from the presence of YIG due to the increased thermal energy that promotes chain mobility and reorganization.
- Dielectric Enhancement: The phase, which has a higher dielectric constant compared to the phase, is stabilized by the enhanced dielectric properties of the composite material by the presence of YIG nanoparticles.
3.5. Addition of YIG Combined with a Low Humidity % Control
4. Conclusions
Author Contributions
Funding
Data Availability Statement
Conflicts of Interest
Abbreviations
| PVDF | Polyvinylidene Fluoride |
| VDF | Vinylidene Floride Polymer |
| DMF | Dimethylformamide |
| PZT | Lead Zirconate Titanate |
| FTIR | Fourier Transform Infrared Spectroscopy |
| XRD | X-ray Diffraction |
| AFM | Atomic Force Microscopy |
| SEM | Scanning Electron Microscope |
| RMS | Root Mean Square |
| MNPs | Magnetic Nanoparticles |
| BaTiO3 | Barium Titanate |
| LiNbO3 | Lithium Niobate |
| YIG | Yttrium Iron Garnet |
| RPM | Revolutions Per Minute |
| R | Acceleration |
References
- Cardoso, V.F.; Correia, D.M.; Ribeiro, C.; Fernandes, M.M.; Lanceros-Méndez, S. Fluorinated Polymers as Smart Materials for Advanced Biomedical Applications. Polymers 2018, 10, 161. [Google Scholar] [CrossRef] [PubMed]
- Zapsas, G.; Patil, Y.; Gnanou, Y.; Ameduri, B.; Hadjichristidis, N. Poly(vinylidene fluoride)-based complex macromolecular architectures: From synthesis to properties and applications. Prog. Polym. Sci. 2020, 104, 101231. [Google Scholar] [CrossRef]
- Silva, C.A.; Fernandes, M.M.; Ribeiro, C.; Lanceros-Mendez, S. Two- and three-dimensional piezoelectric scaffolds for bone tissue engineering. Colloids Surf. B Biointerfaces 2022, 218, 112708. [Google Scholar] [CrossRef] [PubMed]
- Roopaa, T.; Narasimha Murthy, H.; Praveen Kumar, V.; Krishna, M. Development and Characterization of PVDF Thin Films for pressure sensors. Mater. Today Proc. 2018, 5, 21082–21090. [Google Scholar] [CrossRef]
- Gregorio, R., Jr. Determination of the α, β, and γ crystalline phases of poly(vinylidene fluoride) films prepared at different conditions. J. Appl. Polym. Sci. 2006, 100, 3272–3279. [Google Scholar] [CrossRef]
- Ruan, L.; Yao, X.; Chang, Y.; Zhou, L.; Qin, G.; Zhang, X. Properties and Applications of the β Phase Poly(vinylidene fluoride). Polymers 2018, 10, 228. [Google Scholar] [CrossRef]
- Aabid, A.; Raheman, M.A.; Ibrahim, Y.E.; Anjum, A.; Hrairi, M.; Parveez, B.; Parveen, N.; Mohammed Zayan, J. A Systematic Review of Piezoelectric Materials and Energy Harvesters for Industrial Applications. Sensors 2021, 21, 4145. [Google Scholar] [CrossRef]
- Mokhtari, F.; Azimi, B.; Salehi, M.; Hashemikia, S.; Danti, S. Recent advances of polymer-based piezoelectric composites for biomedical applications. J. Mech. Behav. Biomed. Mater. 2021, 122, 104669. [Google Scholar] [CrossRef]
- Ghobadi Moghadam, A.; Hemmati, A. Improved water purification by PVDF ultrafiltration membrane modified with GO-PVA-NaAlg hydrogel. Sci. Rep. 2023, 13, 8076. [Google Scholar] [CrossRef]
- Mohammadpourfazeli, S.; Arash, S.; Ansari, A.; Yang, S.; Mallick, K.; Bagherzadeh, R. Future prospects and recent developments of polyvinylidene fluoride (PVDF) piezoelectric polymer; fabrication methods, structure, and electro-mechanical properties. RSC Adv. 2023, 13, 370–387. [Google Scholar] [CrossRef]
- Zhao, X.; Song, L.; Fu, J.; Tang, P.; Liu, F. Experimental and DFT investigation of surface degradation of polyvinylidene fluoride membrane in alkaline solution. Surf. Sci. 2011, 605, 1005–1015. [Google Scholar] [CrossRef]
- Hsu, C.Y.; Liu, R.J.; Hsu, C.H.; Kuo, P.L. High thermal and electrochemical stability of PVDF-graft-PAN copolymer hybrid PEO membrane for safety reinforced lithium-ion battery. RSC Adv. 2016, 6, 18082–18088. [Google Scholar] [CrossRef]
- Pelizza, F.; Johnston, K. A density functional theory study of poly(vinylidene difluoride) crystalline phases. Polymer 2019, 179, 121585. [Google Scholar] [CrossRef]
- Zhao, Y.; Liao, Q.; Zhang, G.; Zhang, Z.; Liang, Q.; Liao, X.; Zhang, Y. High output piezoelectric nanocomposite generators composed of oriented BaTiO3 NPs@PVDF. Nano Energy 2015, 11, 719–727. [Google Scholar] [CrossRef]
- Yin, Z.; Tian, B.; Zhu, Q.; Duan, C. Characterization and Application of PVDF and Its Copolymer Films Prepared by Spin-Coating and Langmuir–Blodgett Method. Polymers 2019, 11, 2033. [Google Scholar] [CrossRef]
- Nguyen, A.N.; Solard, J.; Nong, H.T.T.; Ben Osman, C.; Gomez, A.; Bockelée, V.; Tencé-Girault, S.; Schoenstein, F.; Simón-Sorbed, M.; Carrillo, A.E.; et al. Spin Coating and Micro-Patterning Optimization of Composite Thin Films Based on PVDF. Materials 2020, 13, 1342. [Google Scholar] [CrossRef]
- Thirmal, C.; Nayek, C.; Murugavel, P.; Subramanian, V. Magnetic, dielectric and magnetodielectric properties of PVDF-La0.7Sr0.3MnO3 polymer nanocomposite film. AIP Adv. 2013, 3, 112109. [Google Scholar] [CrossRef]
- Takise, H.; Shintani, T.; Suzuki, M.; Takahashi, T.; Aoyagi, S. Thin film formation of PEDOT conductive polymer and PVDF piezoelectric polymer by dip-coating method assuming application to flexible power generation element. Electron. Commun. Jpn. 2020, 103, 46–52. [Google Scholar] [CrossRef]
- Aryanti, P.T.P.; Trilaksono, G.; Hotmaida, A.; Afifah, M.A.; Pratiwi, F.P.; Udini, N.; Nugroho, F.A. Preparation of Polypropylene/PVDF Composite Membrane by Dip-Coating Method. IOP Conf. Ser. Mater. Sci. Eng. 2021, 1115, 012028. [Google Scholar] [CrossRef]
- Aoyagi, S.; Morita, T.; Shintani, T.; Takise, H.; Takahashi, T.; Suzuki, M. Formation of PVDF Piezoelectric Film on 3D Bellows Surface of Robotic Suction Cup for Providing Force Sensing Ability -Feasibility Study on Two Methods of Dip-coating and Lamination. In Proceedings of the 2019 IEEE/RSJ International Conference on Intelligent Robots and Systems (IROS), Macau, China, 3–8 November 2019; pp. 1–6. [Google Scholar] [CrossRef]
- Sahu, N.; Parija, B.; Panigrahi, S. Fundamental understanding and modeling of spin coating process: A review. Indian J. Phys. 2009, 83, 493–502. [Google Scholar] [CrossRef]
- Schubert, D.W.; Dunkel, T. Spin coating from a molecular point of view: Its concentration regimes, influence of molar mass and distribution. Mater. Res. Innov. 2003, 7, 314–321. [Google Scholar] [CrossRef]
- Brinker, C.J. Dip Coating. In Chemical Solution Deposition of Functional Oxide Thin Films; Schneller, T., Waser, R., Kosec, M., Payne, D., Eds.; Springer: Vienna, Austria, 2013; pp. 233–261. [Google Scholar] [CrossRef]
- Grosso, D. How to exploit the full potential of the dip-coating process to better control film formation. J. Mater. Chem. 2011, 21, 17033–17038. [Google Scholar] [CrossRef]
- Touam, T.; Atoui, M.; Hadjoub, I.; Chelouche, A.; Boudine, B.; Fischer, A.; Boudrioua, A.; Doghmane, A. Effects of dip-coating speed and annealing temperature on structural, morphological and optical properties of sol-gel nano-structured TiO2 thin films. Eur. Phys. J. Appl. Phys. 2014, 67, 30302. [Google Scholar] [CrossRef]
- Tang, X.; Yan, X. Dip-coating for fibrous materials: Mechanism, methods and applications. J. Sol-Gel Sci. Technol. 2017, 81, 378–404. [Google Scholar] [CrossRef]
- Gregorio, R., Jr.; Cestari, M. Effect of crystallization temperature on the crystalline phase content and morphology of poly(vinylidene fluoride). J. Polym. Sci. Part Polym. Phys. 1994, 32, 859–870. [Google Scholar] [CrossRef]
- Cai, X.; Lei, T.; Sun, D.; Lin, L. A critical analysis of the α, β and γ phases in poly(vinylidene fluoride) using FTIR. RSC Adv. 2017, 7, 15382–15389. [Google Scholar] [CrossRef]
- Pavlović, V.P.; Pavlović, V.B.; Vlahović, B.; Božanić, D.K.; Pajović, J.D.; Dojčilović, R.; Djoković, V. Structural properties of composites of polyvinylidene fluoride and mechanically activated BaTiO3 particles. Phys. Scr. 2013, 2013, 014006. [Google Scholar] [CrossRef]
- Kakimoto, K.I.; Fukata, K.; Ogawa, H. Fabrication of fibrous BaTiO3-reinforced PVDF composite sheet for transducer application. Sens. Actuators A Phys. 2013, 200, 21–25. [Google Scholar] [CrossRef]
- Liu, M.; Xue, D. A solvothermal route to crystalline lithium niobate. Mater. Lett. 2005, 59, 2908–2910. [Google Scholar] [CrossRef]
- Ferro, G.; Ganjam, D.; Gibson, M.; Partington, K.; Trikha, A.; Wu, M.; Domrzalski, J.; Dato, A.; Monson, T. Investigating the dielectric properties of barium titanate nanocomposites using transmission electron microscopy image processing. MRS Adv. 2021, 6, 631–635. [Google Scholar] [CrossRef]
- Kumar, M.; Kulkarni, N.D.; Kumari, P. Fabrication and characterization of PVDF/BaTiO3 nanocomposite for energy harvesting application. Mater. Today Proc. 2022, 56, 1151–1155. [Google Scholar] [CrossRef]
- Mohanty, D.; Chaubey, G.S.; Yourdkhani, A.; Adireddy, S.; Caruntu, G.; Wiley, J.B. Synthesis and piezoelectric response of cubic and spherical LiNbO3 nanocrystals. RSC Adv. 2012, 2, 1913–1916. [Google Scholar] [CrossRef]
- Singh, G.; Sharma, M.; Vaish, R. Flexible Ag@LiNbO3/PVDF Composite Film for Piezocatalytic Dye/Pharmaceutical Degradation and Bacterial Disinfection. ACS Appl. Mater. Interfaces 2021, 13, 22914–22925. [Google Scholar] [CrossRef] [PubMed]
- Li, H.; Guo, Y. Synthesis and characterization of YIG nanoparticles by low temperature sintering. J. Mater. Sci. Mater. Electron. 2018, 29, 9369–9374. [Google Scholar] [CrossRef]
- Sharma, V.; Saha, J.; Patnaik, S.; Kuanr, B.K. Synthesis and characterization of yttrium iron garnet (YIG) nanoparticles—Microwave material. AIP Adv. 2016, 7, 056405. [Google Scholar] [CrossRef]
- Zhang, S.; Wu, L.; Deng, F.; Zhao, D.; Zhang, C.; Zhang, C. Hydrophilic modification of PVDF porous membrane via a simple dip-coating method in plant tannin solution. RSC Adv. 2016, 6, 71287–71294. [Google Scholar] [CrossRef]
- Scriven, L.E. Physics and Applications of DIP Coating and Spin Coating. MRS Online Proc. Libr. 1988, 121, 717–729. [Google Scholar] [CrossRef]
- Orlando, A.; Franceschini, F.; Muscas, C.; Pidkova, S.; Bartoli, M.; Rovere, M.; Tagliaferro, A. A Comprehensive Review on Raman Spectroscopy Applications. Chemosensors 2021, 9, 262. [Google Scholar] [CrossRef]
- Kang, S.J.; Park, Y.J.; Sung, J.; Jo, P.S.; Park, C.; Kim, K.J.; Cho, B.O. Spin cast ferroelectric beta poly(vinylidene fluoride) thin films via rapid thermal annealing. Appl. Phys. Lett. 2008, 92, 012921. [Google Scholar] [CrossRef]
- van Dommelen, J.; Parks, D.; Boyce, M.; Brekelmans, W.; Baaijens, F. Micromechanical modeling of the elasto-viscoplastic behavior of semi-crystalline polymers. J. Mech. Phys. Solids 2003, 51, 519–541. [Google Scholar] [CrossRef]
- Zhang, C.; Lu, L.; Li, W.; Li, L.; Zhou, C. Effects of crystallization temperature and spherulite size on cracking behavior of semi-crystalline polymers. Polym. Bull. 2016, 73, 2961–2972. [Google Scholar] [CrossRef]
- Gránásy, L.; Pusztai, T.; Tegze, G.; Warren, J.A.; Douglas, J.F. Growth and form of spherulites. Phys. Rev. E 2005, 72, 011605. [Google Scholar] [CrossRef] [PubMed]
- Li, M.; Katsouras, I.; Piliego, C.; Glasser, G.; Lieberwirth, I.; Blom, P.W.M.; de Leeuw, D.M. Controlling the microstructure of poly(vinylidene-fluoride) (PVDF) thin films for microelectronics. J. Mater. Chem. C 2013, 1, 7695–7702. [Google Scholar] [CrossRef]
- Zaarour, B.; Zhu, L.; Huang, C.; Jin, X. Controlling the Secondary Surface Morphology of Electrospun PVDF Nanofibers by Regulating the Solvent and Relative Humidity. Nanoscale Res. Lett. 2018, 13, 285. [Google Scholar] [CrossRef]
- Szewczyk, P.K.; Ura, D.P.; Stachewicz, U. Humidity Controlled Mechanical Properties of Electrospun Polyvinylidene Fluoride (PVDF) Fibers. Fibers 2020, 8, 65. [Google Scholar] [CrossRef]


| M (g/mol) | d (g/mL) | V (mL) | m (g) | ||
|---|---|---|---|---|---|
| DMF (Liquid) | 73.09 | 0.95 | 10 | 9.50 | |
| PVDF (Powder) | 534,000 | — | — | C (m)\% | Mass added (g) |
| 5 | 0.500 | ||||
| 10 | 1.055 | ||||
| 15 | 1.676 | ||||
| Nanoparticles | Size- NP Diameter (nm) | MW (g/mL) | d (g/mL) | Provider |
|---|---|---|---|---|
| Barium Titanate BaTiO3 | 50 to 70 | 233.19 | 5.85 | Alfa Aesar |
| Lithium Niobate LiNbO3 | <80 | 147.85 | 4.30 | Alfa Aesar |
| Yttrium Iron Garnet (YIG) Y3Fe5O12 | <100 | 737.94 | 5.11 | Alfa Aesar |
| (%) | |||
|---|---|---|---|
| Dip-Coating Solution | Low Speed | Medium Speed | High Speed |
| PVDF 5\% + YIG \5% | 98 | 97 | 92 |
| PVDF 5\% + YIG \5% and H10\% | 97 | 96 | 90 |
| PVDF 10\% + YIG \5% | 97 | 94 | 89 |
| PVDF 10\% + YIG \5% and H10\% | 95 | 91 | 89 |
Disclaimer/Publisher’s Note: The statements, opinions and data contained in all publications are solely those of the individual author(s) and contributor(s) and not of MDPI and/or the editor(s). MDPI and/or the editor(s) disclaim responsibility for any injury to people or property resulting from any ideas, methods, instructions or products referred to in the content. |
© 2025 by the authors. Licensee MDPI, Basel, Switzerland. This article is an open access article distributed under the terms and conditions of the Creative Commons Attribution (CC BY) license (https://creativecommons.org/licenses/by/4.0/).
Share and Cite
Fakhry, M.; Soppera, O.; Berling, D. Innovative Elaboration of Polyvinylidene Fluoride Thin Films via Dip-Coating: Beta Phase Optimization, Humidity Control, Nanoparticles Addition, and Topographic Analysis. Micro 2025, 5, 12. https://doi.org/10.3390/micro5010012
Fakhry M, Soppera O, Berling D. Innovative Elaboration of Polyvinylidene Fluoride Thin Films via Dip-Coating: Beta Phase Optimization, Humidity Control, Nanoparticles Addition, and Topographic Analysis. Micro. 2025; 5(1):12. https://doi.org/10.3390/micro5010012
Chicago/Turabian StyleFakhry, Marwan, Olivier Soppera, and Dominique Berling. 2025. "Innovative Elaboration of Polyvinylidene Fluoride Thin Films via Dip-Coating: Beta Phase Optimization, Humidity Control, Nanoparticles Addition, and Topographic Analysis" Micro 5, no. 1: 12. https://doi.org/10.3390/micro5010012
APA StyleFakhry, M., Soppera, O., & Berling, D. (2025). Innovative Elaboration of Polyvinylidene Fluoride Thin Films via Dip-Coating: Beta Phase Optimization, Humidity Control, Nanoparticles Addition, and Topographic Analysis. Micro, 5(1), 12. https://doi.org/10.3390/micro5010012