Abstract
Conventional capillary gas chromatography (GC) columns, which have circular symmetry in cross-section and uniformity in length, are well modeled mathematically by the GC rate theory. However, even after adaptation, the theory has limited applicability to many unconventional properties in microfabricated GC columns, such as trapezoidal cross-sections, non-uniform stationary phase, and temperature gradients. This paper reports a 3D finite-element model for the chemical separation process in microfabricated GC columns using COMSOL. The model incorporates gas flow, diffusion, partition, and temperature effects, enabling quantitative assessment of the separation performance of microfabricated GC columns with different stationary phase coating topologies and temperature gradients. To address the tremendous computational burden in such a 3D model, this paper investigates methods of providing proper meshing and dimensional scaling. For validation purposes, the implemented model was first applied to a conventional capillary GC column and showed good matches to both the analytical calculation and experimental results. Next, the model was used to assess microfabricated columns with a trapezoidal cross-section and different stationary phase coating topologies. The results showed that, for the cases under consideration, a single-side-coated column provides only a 33% lower separation resolution compared to a double-side-coated column, and a parabolic stationary phase profile provides only a 12% lower separation resolution compared to a uniform profile. The model also indicated that temperature gradients have a negligible impact on separation performance.
1. Introduction
In analytical chemistry, gas chromatography (GC) remains a gold-standard technique for complex chemical analyses. GC separates complex mixtures into individual compounds, which can be detected using a detector or identified using a spectrometer. In GC, the separation column is a vital component. It is a gas flow channel coated with a stationary phase that provides separation of the compounds passing through the column. Depending on the chemical and physical properties, each compound establishes a certain level of partition between the stationary phase and the carrier gas, thereby eluting the column at a certain time, i.e., the retention time, which is characteristic of the compound [1]. GC has a multitude of applications, and more are emerging. Examples include the analysis of new products in the pharmaceuticals industry, the monitoring of metabolites in biological systems, environmental pollution monitoring, and the analysis of petroleum products and in the petroleum industry [1].
Although GC is powerful and versatile, conventional GC instruments are relatively bulky pieces of high-power benchtop equipment. Microscale gas chromatographs (μGCs) are miniaturized GC instruments with high portability and low power consumption, enabling timely on-site measurements. μGCs typically incorporate microfabricated components, such as microfabricated preconcentrators, columns, and detectors [2,3,4,5,6].
While the separation columns typically used in conventional GC instruments are capillary columns with circular cross-sections, the cross-section of a μGC column is determined by its microfabrication method and is often non-circular. For instance, a μGC column fabricated using deep reactive-ion etching (DRIE) typically has a rectangular cross-section. In some work, during DRIE, dense arrays of narrow and vertical pillars may also be created in the channel, forming a “semi-packed” column [7]. In comparison, a μGC column fabricated using wet etching, sandblasting, or metal micromachining techniques may have tapered sidewalls or curved surfaces [8,9]. Furthermore, the stationary phase topology in a column is determined by its coating process. Conventionally, separation columns are coated using static or dynamic methods, which typically produce a uniform coating on the entire inner wall of the capillary column. However, for microfabricated columns, these methods typically leave a thicker coating at the corners than on the walls, i.e., the pooling effect, which causes undesired peak broadening [6]. Additionally, these methods have limited throughputs. Due to these challenges, alternative coating methods are being explored, such as chemical vapor deposition [10,11], atomic layer deposition [12,13,14], and spin-coating [15]. These alternative methods may only coat a portion of the inner surface of the column.
When designing and developing new fabrication and coating methods for μGC columns, it is highly valuable to obtain a theoretical prediction of the separation performance before delving into the labor-intensive and time-consuming experimental practice. The theory is well established for columns with circular or rectangular cross-sections and a stationary phase uniformly coated on the entire inner wall [16,17]. Mathematical formulae for columns with rectangular cross-sections and one or two walls coated are also reported [18]. However, theoretical models are not yet available for other cross-sections (e.g., semi-circular or semi-trapezoidal) and other stationary phase topologies (e.g., non-uniform or patterned coating on selected walls), which require 3D modeling.
Although the impact of column temperature has been well studied, the established theory mostly assumes a uniform column temperature that is either constantly maintained or programmed. However, the impact of a temperature gradient within the separation column is also worth investigating. Historically, it has been under debate whether separation performance can be improved by a longitudinal temperature gradient, i.e., with the upstream end of the column at a higher temperature than the downstream end. Some have argued that, when flowing along such a temperature gradient, a peak would tend to become sharper, as the trailing portion of the peak would be at a higher temperature than the leading portion and, therefore, would tend to catch up with the latter [19,20,21,22,23]. Others have refuted that such a temperature gradient would not enhance separation, as the peaks behind would have the same tendency to catch up with the peaks ahead [24,25,26,27,28]. Additionally, within a practical μGC system, the temperature distribution of the separation column may be affected by the package and thermal crosstalk from other components, forming a temperature gradient that possibly does not align with the flow direction. A model that can incorporate temperature effects can provide insight into these problems.
This work aims to develop a methodology to model the μGC column using COMSOL. It is intended that the developed model will enable the quantitative evaluation of different stationary phase topologies. It is also intended that temperature effects will be incorporated, enabling the investigation of temperature gradients on separation performance. The model can also allow visualization of the chemical concentration profile travelling along the column, providing an exclusive insight into the separation process.
To meet the goals of this work, a 3D FEA model is needed, which poses challenges associated with the substantial differences in various dimensions of the column. For a good mesh in the FEA, the aspect ratio (i.e., the ratio of the largest dimension to the smallest dimension) of the meshed elements is preferably close to unity. However, in a μGC column, the length is often 3–4 orders of magnitude larger than the cross-sectional dimensions, which are often another 2–3 orders of magnitude larger than the stationary phase thickness. Consequently, a tremendously large number of meshed elements is needed to provide the desired accuracy of the result, which is time consuming. To address this challenge, an artificially thick stationary phase is set with scaled material properties to represent a thinner layer, thereby significantly reducing the required number of mesh elements and the simulation time. The methodology to model the separation column is described in Section 2 and the results and discussion are presented in Section 3, followed by the conclusions in Section 4. For all the figures shown in this paper, the raw images were exported from COMSOL® and MATLAB®, and subsequently labeled in Inkscape® 1.1.
2. Model Development
2.1. Modeled Geometries
The objectives of the model include the study of the microfabricated columns with a trapezoidal cross-section, and further, the study of the stationary phase topologies therein. To validate the modeling approach, a straight capillary column is first modeled and compared to the experimental results. The modeled capillary column has a length of 1 m, an inner diameter of 250 μm, and a uniformly coated polydimethylsiloxane (PDMS) stationary phase with a thickness of 1 μm (Figure 1a).
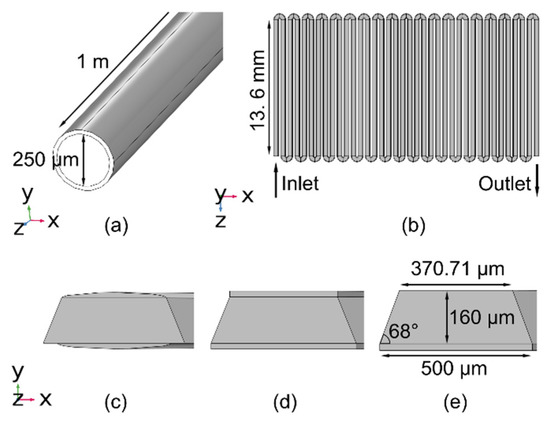
Figure 1.
Geometries of the modeled columns. (a) A straight capillary column with a circular cross-section; (b) A serpentine microfabricated column (in xz-plane). The cross-sections (in xy-plane) for different stationary phase topologies are as follows: (c) Case 1: parabolic profiles on both the top and bottom surfaces, both with 5 µm thickness at the center; (d) Case 2: uniform 2.95 μm thickness on both the top and bottom surfaces; and (e) Case 3: uniform 5.14 μm thickness only on the bottom surface.
The modeled microfabricated column consists of 38 straight segments connected via semi-circular segments (Figure 1b). Each straight segment is 13.6 mm long. The cross-section of the microfabricated column is trapezoidal with a 500 μm-wide bottom edge, a 371 μm-wide top edge, a 160 μm height, and two sidewalls with a 22° inward taper. For the microfabricated column, three different cases of the stationary phase topology are modeled. In Case 1, the stationary phase has parabolic profiles on both the top and bottom surfaces of the column, with a 5 μm thickness at the center (Figure 1c). The widths of the stationary phase on the top and bottom surfaces are 371 μm and 400 μm, respectively. In Case 2, the stationary phase is uniformly coated on both the top and bottom surfaces of the column and has a thickness of 2.95 μm (Figure 1d). In Case 3, the stationary phase is uniformly coated only on the bottom surface of the column and has a thickness of 5.14 μm (Figure 1e). All three cases have equal volumes of the stationary phase.
The selected thicknesses of the stationary phase noted above are modeled using a hypothetical thickness of 20 µm COMSOL geometry. This hypothetical thickness reduces the number of elements in the mesh and avoids re-meshing the model each time a different thickness of the stationary phase needs to be studied. A scaling factor n (explained in Section 2.3) is employed in the simulation to obtain the results for the actual thickness.
2.2. Modeling of the Gas Flow
The gas flow regime in a separation column is determined using the Reynolds number (Re), which can be calculated as:
where ρ and μ are the density and dynamic viscosity of the carrier gas, respectively; U is the characteristic velocity, i.e., the average gas flow speed; and dH is the characteristic length, i.e., the hydraulic diameter of the column cross-section [29]. For air at standard temperature and pressure, ρ = 1.18 kg/m3 and μ = 1.85 × 10⁻⁵ Pa∙s. At a nominal flow rate of 0.6 sccm, U is 0.22 m/s for the modeled capillary column and 0.16 m/s for the modeled microfabricated column. The value of dH is 250 μm for the modeled capillary column and 228.5 μm for the modeled microfabricated column. Substituting these values into Equation (1), the Re values obtained for the modeled capillary column and microfabricated column are 3.51 and 2.33, respectively. These values are <<2000, indicating that the flow is laminar.
To determine the compressibility of the gas flow, the Mach number (M) is calculated as the ratio between the average gas flow speed and the speed of sound in air. For the modeled capillary column and microfabricated column, the values of M are calculated to be 6.54 × 10⁻⁴ and 4.61 × 10⁻⁴, respectively. These values are <<0.3, indicating that the gas flow can be considered incompressible.
Therefore, this work implements the “Laminar Flow” module in COMSOL to model the incompressible flow of carrier gas in the separation column, which applies the following governing equations:
where u is the velocity field of the gas, p is the pressure, is the stress tensor, and is the body force.
For the ‘Laminar Flow’ module, the model domain is initialized with zero velocity, and a no-slip boundary condition is applied to the column walls, specifying that the gas flow in contact with the column walls has zero velocity. The inlet boundary condition is set with a fully developed flow at an average velocity U (with the value indicated above). The outlet boundary condition is set at 0 Pa relative to a reference pressure at 1 atm.
2.3. Modeling of the Chemical Transport
The chemicals transported along the separation column undergo convection, diffusion, and partition between the carrier gas and the stationary phase. These transportation mechanisms are modeled by the COMSOL module “Transport of Diluted Species” in this work.
Equations (5)–(7) model the convection (coupled with the flow field) and diffusion in the carrier gas, the diffusion in the stationary phase, and the partition between the two phases, respectively. Here, c is the concentration of the chemical, t is time, D is the diffusivity of the chemical, S is a source/sink term, and K is the partition coefficient. The subscripts CG and SP denote the carrier gas and the stationary phase, respectively.
Because this work scales the stationary phase thickness to a large, fixed hypothetical value (20 µm) to address the meshing and geometrical challenges, a scaling factor n, as mentioned in Section 2.1, must be applied to compensate for the impacts of such scaling. The n is defined as the ratio of actual stationary phase thickness to the hypothetical 20 µm. As a result, diffusivity in the stationary phase and the partition coefficient must be scaled as follows:
Note that such scaling is applied only in the direction of the stationary phase thickness, i.e., only in the x- and y-directions for the modeled capillary column and only in the y-direction for the modeled microfabricated columns. In COMSOL, such directional scaling is implemented by setting the diffusivity in the stationary phase as an anisotropic tensor.
For the ‘Transport of Diluted Species’ module, a no-flux boundary condition is applied to the column walls, specifying that no chemicals can penetrate through the column walls. The partition equilibrium condition is also applied to the interface between the stationary phase and carrier gas (Table 1). The model domain is initialized with zero chemical concentration. To model the chemical injection at the inlet, a Gaussian concentration profile of the chemical is set to pass the inlet cross-section at 1 s, with a peak width at half-height (PWHHinlet) of 0.5 s and a peak concentration of 4.4 × 10⁻⁵ mol/m3.
2.4. Modeling of the Temperature Effects
The impacts of temperature on the separation result from the temperature dependence of the diffusivity and the partition coefficient. For a chemical α in another chemical β, the diffusivity (Dα/β) is a function of temperature T (in the unit of K) [30]:
where M denotes the molecular weight of the chemical, p is pressure in atm, and ∑vi denotes the diffusion volume of the chemical.
This work selects air as the carrier gas, which has a diffusion volume of 20.1 cm3 [30]. This work selects hexane and benzene as the two representative chemicals for the model. Based on the known values of Dhexane/air and Dbenzene/air at 25 °C [31], the diffusion volumes of hexane and benzene are extracted to be 140.88 cm3 and 82.16 cm3, respectively.
In the stationary phase, the temperature dependence of the diffusivity can generally be described by the Arrhenius equation [32], , where R is the universal gas constant, D0 is the maximal diffusion coefficient at infinite temperature, and EA is the activation energy for diffusion. However, the values of D0 and EA are not always available. Therefore, in this work, for simplicity, the diffusivity values of hexane and benzene in PDMS (Dhexane/PDMS and Dbenzene/PDMS, respectively) are approximated as temperature-independent constants at 2.5 × 10⁻¹⁰ m2/s [33] and 2.8 × 10⁻¹⁰ m2/s [34], respectively. This approximation holds well for the small temperature range of 20–40 °C investigated in this work.
The partition coefficient K as a function of temperature (in K) can be calculated from its known value at a reference temperature T0 (which is usually 298.15 K) [35].
where A, B, and C are Antoine constants (Table 1).

Table 1.
Parameters used to compute the partition coefficients.
Table 1.
Parameters used to compute the partition coefficients.
| Hexane | Benzene | |
|---|---|---|
| [36] | 166 | 304 |
| A [37] | 6.88 | 6.91 |
| B [37] | 1171.53 | 1211.03 |
| C [37] | 224.37 | 220.80 |
2.5. Simulation Setup
In the COMSOL simulation, two Study steps are sequentially performed. The first step models the gas flow; this is performed as a Stationary Study, because the flow is fully developed and remains constant during the separation. The second step models the chemical transport process; this is performed as a Time-Dependent Study, because the chemical concentrations continue to change during the separation.
In the second step, because the PWHHinlet is set to 0.5 s, the time-step used during 0–2 s is set to 0.01 s to provide a smooth inlet Gaussian profile. Beyond 2 s, a time-step of 0.02 s is selected to reduce the simulation time by half without significantly impacting the result. These values are obtained from the mesh convergence study (Section 3.3).
The impact of the longitudinal temperature gradient is investigated using the modeled capillary column. Three temperature cases are considered: along the column length (in the z-direction) from the inlet to the outlet, Case I applies a temperature distribution linearly decreasing from 40 °C to 20 °C, Case II applies a temperature distribution linearly increasing from 20 °C to 40 °C, and Case III applies a uniform 30 °C (Figure 2a).
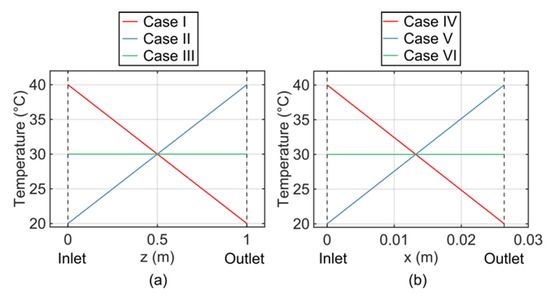
Figure 2.
Cases of temperature distribution applied to the two columns in the model. (a) Capillary Column with: Case I—inlet at 40 °C and outlet at 20 °C; Case II—inlet at 20 °C and outlet at 40 °C; and Case III—uniform at 30 °C. (b) Microfabricated Column with: Case IV—inlet at 40 °C and outlet at 20 °C; Case V—inlet at 20 °C and outlet at 40 °C; and Case VI—uniform at 30 °C.
The impact of the lateral temperature gradient is investigated using the modeled microfabricated column. Similar to the capillary column model, three temperature cases are also considered: along the column width (in the x-direction) from the inlet to the outlet, Case IV applies a temperature distribution linearly decreasing from 40 °C to 20 °C, Case V applies a temperature distribution linearly increasing from 20 °C to 40 °C, and Case VI applies a uniform 30 °C (Figure 2b).
2.6. Mesh Development
For the capillary column, a user-controlled mesh is applied to both study steps. In this approach, the cross-section of the column is first meshed with 2D elements (Figure 3a). This mesh is then swept along the length of the column to mesh the entire column geometry (Figure 3b). Such a mesh conforms well to the circular cross-section and enables a mesh convergence study of the impact of mesh element size along the column length.
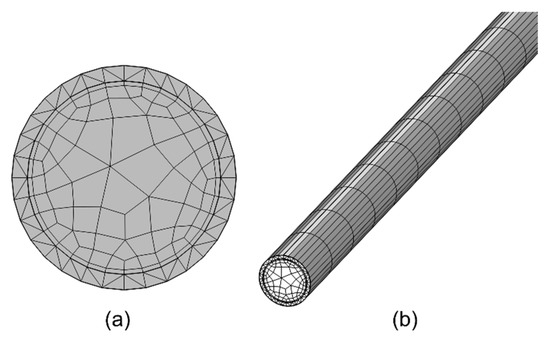
Figure 3.
Mesh of the capillary column. (a) Mesh of its cross-section; (b) mesh along its length.
For the microfabricated column, a physics-controlled mesh, which is found to represent the column dimensions well, is used for the Stationary Study of gas flow. Next, a user-controlled mesh is used for the Time-Dependent Study, similar to the capillary column mesh (Figure 4).
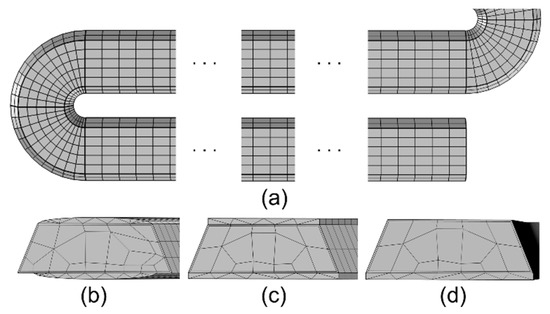
Figure 4.
Mesh of the microfabricated column. (a) Mesh along its length, and mesh across its cross-section for the three stationary phase topology cases: (b) Case 1: parabolic thickness on both the top and bottom surfaces; (c) Case 2: uniform thickness on both the top and bottom surfaces; and (d) Case 3: uniform thickness only on the bottom surface.
3. Results and Discussion
This section describes the results obtained from the models. First, the gas flow velocity profiles and chemical concentration profiles during transport are presented. Then, the results of the mesh convergence study are presented and compared to the analytical calculation and experimental results. Next, the performance of the modeled microfabricated columns with different stationary phase topologies are compared. Finally, the impacts of the different temperature gradients on the separation columns are evaluated.
3.1. Velocity Profile
Figure 5 shows the velocity distribution of the carrier gas in both the modeled capillary column and microfabricated column. As expected, the velocity in each column reached its maximum at the center of the cross-section, and was reduced to zero at the column walls. The maximum velocities were 0.48 m/s and 0.37 m/s in the modeled capillary column and microfabricated column, respectively. These values appeared reasonable in light of the average flow velocities of 0.22 m/s and 0.16 m/s, respectively, which were set in the boundary conditions.
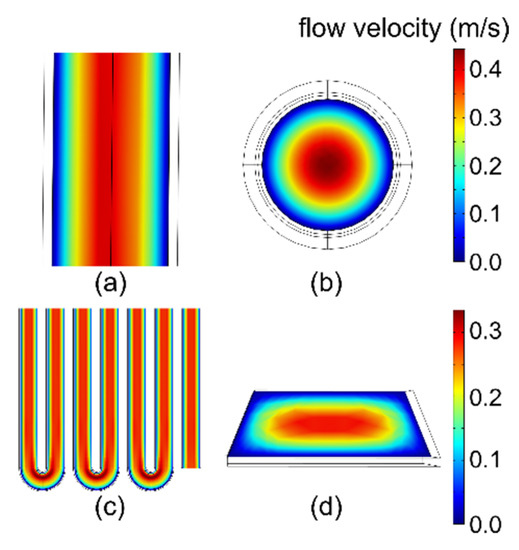
Figure 5.
Velocity profile (in m/s) of the carrier gas in the columns at 25 °C. (a) Capillary column model in xz-plane. (b) Capillary column model in xy-plane. (c) Microfabricated column in xz-plane. (d) Microfabricated column in xy-plane.
3.2. Concentration Profile
The chemical separation process can be visualized from the results. For example, Figure 6 illustrates the separation process of hexane and benzene in the modeled microfabricated column of Case 3 operated at 25 °C. After the injection from the column inlet in the lower left corner, at t = 2 s, the profiles of hexane and benzene remained largely overlapping (Figure 6a). As these profiles moved along the column, they exhibited partial separation at 10 s (Figure 6b), well-established separation at 20 s (Figure 6c), followed by the full elution of hexane by 30 s, upon which only benzene remained in the column (Figure 6d).
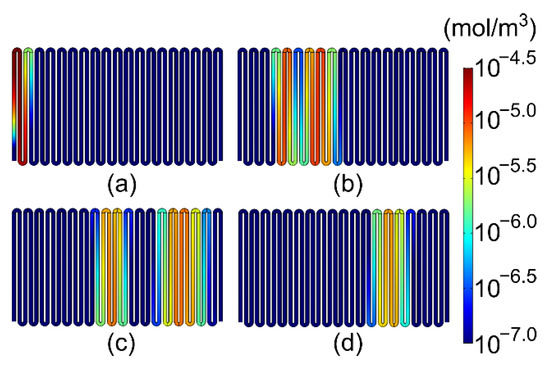
Figure 6.
Concentration distribution of hexane and benzene over time in a microfabricated column at 25 °C (with Case 3 stationary phase topology): (a) t = 2 s; (b) t = 10 s; (c) t = 20 s; and (d) t = 30 s.
3.3. Mesh Convergence and Experimental Verification
To ensure the accuracy of modeling, the mesh must be fine enough that the results converge, upon which a finer mesh does not significantly alter the results. Because the column length is at least 3–4 orders of magnitude larger than any dimension on the cross-section, it is critical to evaluate the impact of mesh fineness along the column length. Therefore, in the mesh convergence study performed in this work, a fixed mesh of 162 elements was applied to the cross-section of the column, whereas the mesh element count per meter (nL) of the column length was evaluated over a range of 2000–8000. Additionally, the impact of the time-step on the convergence was evaluated. This was performed by varying the time-step at certain fixed nL values. This section illustrates the mesh convergence study results for the capillary column at 25 °C, and a similar study can be also performed on the microfabricated column.
To evaluate the mesh convergence, four performance parameters for the column were extracted from the results and considered (Table 2). These include (1) the retention time (tR), which was relative to the injection time at t = 1 s; (2) the peak width at half-height (PWHH) of the chemical peaks eluting from the column; (3) the number of theoretical plates (N), which is an indicator of the column efficiency and is computed as
and (4) the separation resolution (Rs), which is a measure of how well two peaks are separated and is computed as [16]

Table 2.
Summary table comparing the performance parameters of the capillary column at 25 °C with different mesh distributions along its length. Analytical calculation and experimental results are also listed in the last two rows for comparison.
While all four performance parameters showed trends of convergence, the PWHHbenzene in Table 2 was selected as an example and plotted against nL (Figure 7). As is evident from Figure 7, the PWHHbenzene exhibited an exponential trend with respect to nL and a projected converged value of 1.33 s. For each simulated Mesh Case, the error of the results in % was calculated with respect to the converged value (Table 2). The case with the finest mesh, i.e., Mesh Case xv, had an error of only 6.77%, which was considered accurate enough for this work.
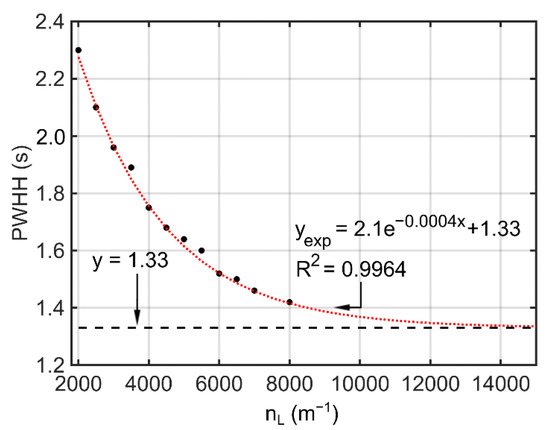
Figure 7.
Exponential curve fitted to the PWHH data for benzene in the capillary column at 25 °C.
Note that for Figure 7, Mesh Cases (iii), (vii), and (xii) were excluded. These three cases were inserted to evaluate the impact of the time-step at a given nL. Based on the comparison between Mesh Cases iii vs. iv; viii vs. viii; and xii vs. xiii, the selected time-steps in these cases were shown to be fine enough without significantly affecting the results. For example, compared to Mesh Case xii, Mesh Case xiii reduced the time-steps by half, but only changed the PWHHbenzene by 1.3%.
The model was verified using both an analytical calculation approach and an experimental approach, both applied to the modeled capillary column. The analytical calculation approach was based on the standard GC plate theory and rate theory, which are well established for capillary columns. In this approach, the tR, height equivalent to a theoretical plate (HETP), and N can be estimated as follows [1,16]
where k is the retention factor, which is calculated as k = K/βP, in which βP is the phase ratio, i.e., the volume ratio between the carrier gas and the stationary phase; L, D, and h are the column length, inner diameter, and stationary phase thickness, respectively; DCG and DSP are the diffusivities of the chemical in the carrier gas and in the stationary phase, respectively; is the variance of a Gaussian peak introduced by the extra-column effects, which represents the injection peak width in the model. Numerically, for a Gaussian injection peak, . After obtaining the results from Equations (14) and (16), the PWHHhexane, PWHHbenzene, and RS can be computed from Equations (12) and (13).
The results of this analytical calculation approach are listed in the second-to-last row in Table 2. Compared to the analytical calculation results, Mesh Case xv showed <22% differences in tR and PWHH, and <13% differences in N and RS.
In the experimental approach to verifying the model, a commercial off-the-shelf (COTS) capillary column (Part # 115-2504, Ohio Valley Specialty Company, Marietta, OH, USA) of equivalent properties to the model was experimentally tested in a benchtop GC system (Model # 6890, Agilent Technologies, Inc., Santa Clara, CA, USA), which provided an equivalent temperature and flow rate to the model. Samples of hexane and benzene were injected at the GC sample inlet and detected using a flame ionization detector (FID) after eluting the column. The experimental results were compared to the modeling result obtained from Mesh Case xv (Table 2 and Figure 8). The comparison showed tR differences at 11.03% and 1.68% for hexane and benzene, respectively, and PWHH differences at 28.79% and 8.97% for hexane and benzene, respectively.
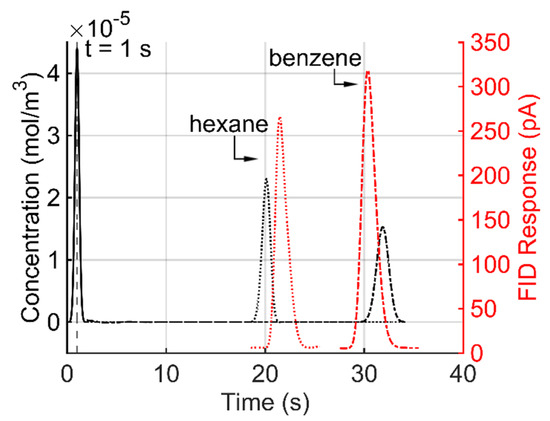
Figure 8.
Comparison of simulated result (black) for the outlet concentration profiles of hexane and benzene with the FID response of experimental result (red), using the capillary column model at 25 °C.
Note that all the parameter values used in the model were obtained from the literature without being intentionally adjusted to match the analytical calculation or experimental results. The modest differences between the modeling and analytical calculation results are not atypical of other comparisons between analytical and modeling results; for example, analytical results generally assume idealized geometries and boundary conditions that are not discretized. The differences between the modeling and experimental results are expected from factors such as the manufacturing variations in the COTS capillary column, inaccuracies in the experimental flow rate and temperature, and minute variations in the chemical injection. Given the overall match to the analytical calculation and experimental results, the model is sufficiently accurate to investigate the impact of the stationary phase topologies and temperature gradients.
3.4. Stationary Phase Topologies in Microfabricated Columns
Based on the mesh convergence study described in Section 3.3, the three PDMS topologies cases described in Figure 1 were modeled and compared. A converged mesh with an nL of approximately 8800 (120 longitudinal elements in each straight segment and 20 elements in each curved segment of the microfabricated column) was applied to all three cases. In the modeling results, all three cases provided similar tR values, but noticeably different PWHH, N, and RS values (Figure 9 and Table 3). Compared to Case 2, Case 1 provided 19% broader hexane and benzene peaks, whereas Case 3 provided a 55% broader hexane peak and a 48% broader benzene peak. Consequently, for the separation performance, as represented by the resolution between hexane and benzene (denoted by RS), Case 1 and Case 3 were 12% and 33% worse than Case 2, respectively.
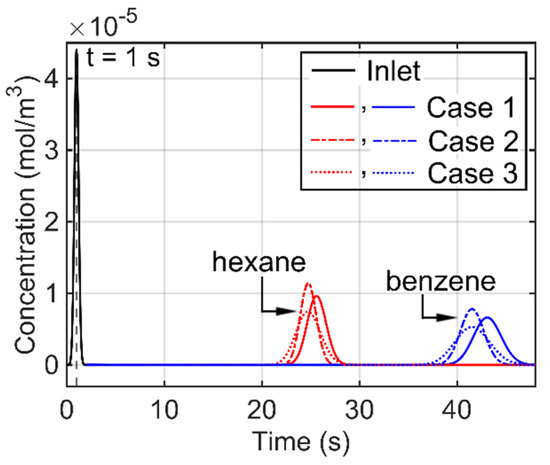
Figure 9.
Comparison of outlet concentration profiles of hexane and benzene for Cases 1, 2 and 3 of PDMS layer distribution, using the microfabricated column at 25 °C. Case 1: parabolic thickness on both the top and bottom surfaces; Case 2: uniform thickness on both the top and bottom surfaces; Case 3: uniform thickness only on the bottom surface.

Table 3.
The performance parameters of the microfabricated column at 25 °C with different cases of stationary phase topology. Case 1: parabolic thickness on both the top and bottom surfaces; Case 2: uniform thickness on both the top and bottom surfaces; Case 3: uniform thickness only on the bottom surface.
The similarity in the tR values was expected, as the overall volumes of PDMS in the three cases were the same. The overall worse performance of Case 3 than Case 2 was also expected because of two factors. First, the PDMS in Case 3 was only on the bottom surface, causing a larger effective distance for chemical diffusion from the carrier gas to its interface with the PDMS, i.e., causing larger resistance to mass transfer in the carrier gas [1]. Second, the PDMS in Case 3 was thicker, causing a larger effective distance for chemical diffusion from the PDMS to its interface with the carrier gas, i.e., causing larger resistance to mass transfer in the PDMS [1]. Nevertheless, compared to Case 2, the separation performance reduction in Case 3 may be considered tolerable for certain applications, especially when the benefit of simpler fabrication provided by Case 3 is emphasized.
Compared to Case 2, the separation performance reduction in Case 1 appears insignificant. This may be an encouraging sign for certain stationary phase coating processes, where a coated and patterned stationary phase film may reflow into a parabolic profile before being fully crosslinked and immobilized.
3.5. Impact of Temperature Gradients
The three cases of longitudinal temperature gradients in a capillary column (as described in Section 2.5) were modeled. The resulting chromatograms are overlaid in Figure 10, and the performance metrics are compared in Table 4. From these results, it is apparent that the negative longitudinal temperature gradient (in Case I) and the positive one (in Case II) provided equal performance, which was almost equal to the isothermal Case III. This result opposes the idea that the negative thermal gradient would significantly improve separation [19,20,21,22,23] and corroborates the counter-argument [24,25,26,27,28].
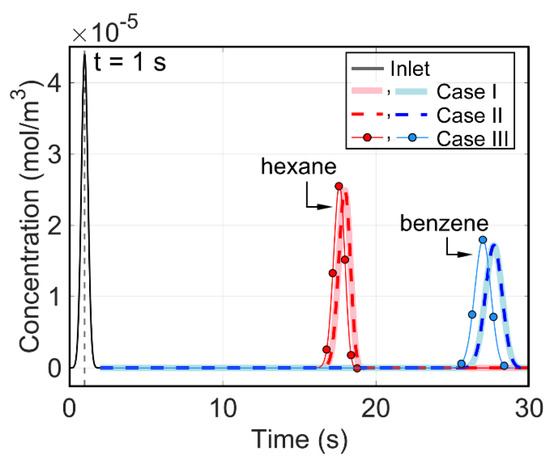
Figure 10.
Modeled chromatograms for the three cases with longitudinal temperature gradients in the modeled straight capillary column. Case I: inlet at 40 °C and outlet at 20 °C; Case II: inlet at 20 °C and outlet at 40 °C; Case III: uniform at 30 °C.

Table 4.
The performance parameters for the three cases with longitudinal temperature gradients in the modeled straight capillary column. Case I: inlet at 40 °C and outlet at 20 °C; Case II: inlet at 20 °C and outlet at 40 °C; Case III: uniform at 30 °C.
For the three lateral temperature gradient cases in the modeled microfabricated column as described in Section 2.5, the applied temperature gradient was effectively perpendicular to the dominating flow direction. From the modeling results (Figure 11 and Table 5), the negative lateral temperature gradient (in Case IV), the positive one (in Case V), and the isothermal Case VI appeared to provide almost the same performance (with <2% variation). Such a result provides an encouraging and quantitative understanding of tolerance to temperature non-uniformity in the microfabricated columns.
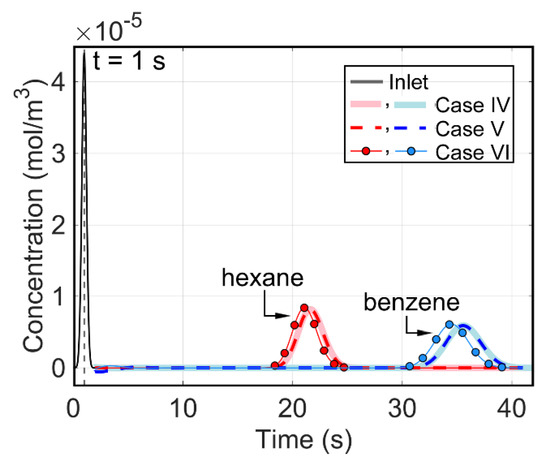
Figure 11.
Modeled chromatograms for the three cases with lateral temperature gradients in the modeled microfabricated column (Case 3). Case IV: inlet at 40 °C and outlet at 20 °C; Case V: inlet at 20 °C and outlet at 40 °C; Case VI: uniform at 30 °C.

Table 5.
The performance parameters for the three cases with lateral temperature gradients in the modeled microfabricated column (Case 3). Case IV: inlet at 40 °C and outlet at 20 °C; Case V: inlet at 20 °C and outlet at 40 °C; Case VI: uniform at 30 °C.
It is also worth noting that the isothermal cases always showed slightly smaller tR values than the corresponding cases with temperature gradients (Table 4 and Table 5 and Figure 10 and Figure 11). This is mathematically reasonable. As described by Equation (11), K(T) exhibits a convex function of T in the modeled temperature range of 20–40 °C. According to Jensen’s inequality [38], K (30 °C) is smaller than the average of K(T) over 20–40 °C. Additionally, for a given column geometry, tR increases linearly with K, as indicated by Equation (14). Therefore, the tR for isothermal 30 °C is expected to be smaller than that with a constant temperature gradient over 20–40 °C.
4. Conclusions
This work presents a methodology for modeling μGC separation columns using 3D FEA, which is essential for columns with unconventional and asymmetric cross-sections and stationary phase coating topologies. The methodology starts with essential simplifications of the governing equations. Meshing of the separation column is performed in a custom-defined manner to reduce simulation time while preserving enough accuracy of the results. A scaling factor of the stationary phase thickness is implemented to overcome the challenges in the large mesh density caused by the large span of column dimensions. Additionally, this scaling factor eliminates the need to re-mesh when modeling different thicknesses of the stationary phase with a given topology. A mesh convergence study is performed to confirm the required mesh density. The methodology is validated by the overall match between the modeling results of a capillary column and both the analytical calculation and experimental results.
Using the developed model, the impacts of stationary phase topology and temperature gradients on the performance of the separation column are quantitatively investigated. While a stationary phase coating on fewer inner surfaces or with a reflowed profile causes a reduction in separation performance, such a limited reduction may be well accepted if the benefits posed by the simpler fabrication process of the column are more desired. Compared to the isothermal cases, neither longitudinal nor lateral temperature gradients within the ranges considered in this work appear to affect the separation performance.
The developed model can be readily adapted to model various cross-sections of the column and topologies of its stationary phase. For example, it can be adapted to evaluate the impact of the pooling effect, which is common in microfabricated columns that use static or dynamic coating methods. Additionally, the model can assist in the exploration of any attractive stationary phase topologies. In the future, the model can be expanded to examine the impact of other μGC components on the overall separation performance of the system, e.g., the impact of a broad injection peak from the preconcentrator, particularly if the column is short; the impact of the fluidic pathway of the detector; and the impact of dead volume associated with other fluidic connections at the pump, valves, etc. The model can also be enhanced to incorporate adsorption at the column walls for certain surface-adsorptive analyte chemicals, such as amines and phosphonate esters.
Author Contributions
Conceptualization, Y.Q. and Y.B.G.; methodology, S.S. and Y.Q.; software, S.S.; validation, S.S. and Y.Q.; formal analysis, S.S. and Y.Q.; investigation, S.S.; resources, Y.B.G.; data curation, S.S.; writing—original draft preparation, S.S.; writing—review and editing, Y.Q. and Y.B.G.; visualization, S.S.; supervision, Y.Q. and Y.B.G.; project administration, Y.B.G.; funding acquisition, Y.B.G. All authors have read and agreed to the published version of the manuscript.
Funding
This research received no external funding.
Institutional Review Board Statement
Not applicable.
Informed Consent Statement
Not applicable.
Data Availability Statement
The data presented in this study are available on request from the corresponding author.
Acknowledgments
This work was supported, in part, by the University of Michigan. The authors thank Xiangyu (Daniel) Zhao for providing the experimental results essential for validating the separation column model.
Conflicts of Interest
The authors declare no conflict of interest.
References
- Grob, R.L.; Barry, E.F. Theory of Gas Chromatography. In Modern Practice of Gas Chromatography, 4th ed.; John Wiley & Sons, Inc.: Hoboken, NJ, USA, 2004. [Google Scholar]
- Qin, Y.; Gianchandani, Y.B. A fully electronic microfabricated gas chromatograph with complementary capacitive detectors for indoor pollutants. Microsyst. Nanoeng. 2016, 2, 15049. [Google Scholar] [CrossRef] [PubMed]
- Whiting, J.J.; Myers, E.; Manginell, R.P.; Moorman, M.W.; Anderson, J.; Fix, C.S.; Washburn, C.; Staton, A.; Porter, D.; Graf, D.; et al. A high-speed, high-performance, microfabricated comprehensive two-dimensional gas chromatograph. Lab Chip 2019, 19, 1633–1643. [Google Scholar] [CrossRef] [PubMed]
- Zampolli, S.; Elmi, I.; Cardinali, G.C.; Masini, L.; Bonafè, F.; Zardi, F. Compact-GC platform: A flexible system integration strategy for a completely microsystems-based gas-chromatograph. Sens. Actuators B Chem. 2020, 305, 127444. [Google Scholar] [CrossRef]
- Wang, J.; Nuñovero, N.; Nidetz, R.; Peterson, S.J.; Bookover, B.M.; Steinecker, W.H.; Zellers, E.T. Belt-Mounted Micro-Gas-Chromatograph Prototype for Determining Personal Exposure to Volatile-Organic-Compound Mixture Components. Anal. Chem. 2019, 91, 4747–4754. [Google Scholar] [CrossRef]
- Regmi, B.P.; Agah, M. Micro Gas Chromatography: An Overview of Critical Components and Their Integration. Anal. Chem. 2018, 90, 13133–13150. [Google Scholar] [CrossRef]
- Chan, R.; Agah, M. Semi-Packed Gas Chromatography Columns with Density Modulated Pillars. J. Microelectromech. Syst. 2019, 28, 114–124. [Google Scholar] [CrossRef]
- Ghosh, A.; Foster, A.R.; Johnson, J.C.; Vilorio, C.R.; Tolley, L.T.; Iverson, B.D.; Hawkins, A.R.; Tolley, H.D.; Lee, M.L. Stainless-Steel Column for Robust, High-Temperature Microchip Gas Chromatography. Anal. Chem. 2019, 91, 792–796. [Google Scholar] [CrossRef]
- Qin, Y.; Gianchandani, Y.B. iGC2: An architecture for micro gas chromatographs utilizing integrated bi-directional pumps and multi-stage preconcentrators. J. Micromech. Microeng. 2014, 24, 65011. [Google Scholar] [CrossRef]
- Stadermann, M.; McBrady, A.D.; Dick, B.; Reid, V.R.; Noy, A.; Synovec, A.R.E.; Bakajin, O. Ultrafast Gas Chromatography on Single-Wall Carbon Nanotube Stationary Phases in Microfabricated Channels. Anal. Chem. 2006, 78, 5639–5644. [Google Scholar] [CrossRef]
- Reid, V.R.; Stadermann, M.; Bakajin, O.; Synovec, R.; E Synovec, R. High-speed, temperature programmable gas chromatography utilizing a microfabricated chip with an improved carbon nanotube stationary phase. Talanta 2009, 77, 1420–1425. [Google Scholar] [CrossRef]
- Shakeel, H.; Rice, G.W.; Agah, M. Semipacked columns with atomic layer-deposited alumina as a stationary phase. Sens. Actuators B Chem. 2014, 203, 641–646. [Google Scholar] [CrossRef]
- Akbar, M.; Shakeel, H.; Agah, M. GC-on-Chip: Integrated Column and Photo Ionization Detector. Lab Chip 2015, 15, 1748–1758. [Google Scholar] [CrossRef] [PubMed]
- Shakeel, H.; Agah, M. High density semipacked separation columns with optimized atomic layer deposited phases. Sens. Actuators B Chem. 2017, 242, 215–223. [Google Scholar] [CrossRef]
- Breshike, C.J.; Furstenberg, R.; Dominguez, D.; Kusterbeck, A.; Kozak, D.; Stievater, T.; McGill, R.A. Gas chromatography using a spin-coated stationary phase and a molded elastomer microfabricated-channel. J. Chromatogr. A 2020, 1610, 460555. [Google Scholar] [CrossRef]
- Barry, E.F. Columns: Packed and capillary; Column selection in gas chromatography. In Modern Practice of Gas Chromatography, 4th ed.; John Wiley & Sons, Inc.: Hoboken, NJ, USA, 2004. [Google Scholar]
- Spangler, G.E. Height Equivalent to a Theoretical Plate Theory for Rectangular GC Columns. Anal. Chem. 1998, 70, 4805–4816. [Google Scholar] [CrossRef]
- Poppe, H. Mass transfer in rectangular chromatographic channels. J. Chromatogr. A 2002, 948, 3–17. [Google Scholar] [CrossRef]
- Rubey, W.A. A different operational mode for addressing the general elution problem in rapid analysis gas chromatography. J. High Resolut. Chromatogr. 1991, 14, 542–548. [Google Scholar] [CrossRef]
- Rubey, W.A. Operational theory and instrumental implementation of the thermal gradient programmed gas chromatography (TGPGC) mode of analysis. J. High Resolut. Chromatogr. 1992, 15, 795–799. [Google Scholar] [CrossRef]
- Phillips, J.B.; Jain, V. On-Column Temperature Programming in Gas Chromatography Using Temperature Gradients along the Capillary Column. J. Chromatogr. Sci. 1995, 33, 541–550. [Google Scholar] [CrossRef]
- Jain, V.; Phillips, J.B. High-Speed Gas Chromatography Using Simultaneous Temperature Gradients in Both Time and Distance along Narrow-Bore Capillary Columns. J. Chromatogr. Sci. 1995, 33, 601–605. [Google Scholar] [CrossRef]
- Nerheim, A.G. Gas-Liquid Chromathermography. Anal. Chem. 1960, 32, 436–437. [Google Scholar] [CrossRef]
- Blumberg, L.M. Outline of a theory of focusing in linear chromatography. Anal. Chem. 1992, 64, 2459–2460. [Google Scholar] [CrossRef] [PubMed]
- Blumberg, L.M. Variance of a zone migrating in a linear medium: II. Time-varying non-uniform medium. J. Chromatogr. 1993, 637, 119–128. [Google Scholar] [CrossRef]
- Blumberg, L.M. Focusing Cannot Enhance Resolution or Speed Limit of a GC Column. J. Chromatogr. Sci. 1997, 35, 451–454. [Google Scholar]
- Blumberg, L.M.; Berger, T.A. Variance of a zone migrating in a non-uniform time-invariant linear medium. J. Chromatogr. A 1992, 596, 1–13. [Google Scholar] [CrossRef]
- Blumberg, L.M. Limits of resolution and speed of analysis in linear chromatography with and without focusing. Chromatographia 1994, 39, 719–728. [Google Scholar] [CrossRef]
- Chanson, H. Fundamentals of open channel flows. In Environmental Hydraulics of Open Channel Flows; Butterworth-Heinemann: Oxford, UK, 2004; pp. 11–34. [Google Scholar]
- Fuller, E.N.; Schettler, P.D.; Giddings, J.C. New method for prediction of binary gas-phase diffusion coefficients. Ind. Eng. Chem. 1966, 58, 18–27. [Google Scholar] [CrossRef]
- Lugg, G.A. Diffusion coefficients of some organic and other vapors in air. Anal. Chem. 1968, 40, 1072–1077. [Google Scholar] [CrossRef]
- Arrhenius, S. Über die Dissociationswärme und den Einfluss der Temperatur auf den Dissociationsgrad der Elektrolyte. Z. Phys. Chem. 1889, 4U, 96–116. [Google Scholar] [CrossRef]
- Abdellah, M.H.; Scholes, C.; Freeman, B.; Liu, L.; Kentish, S. Transport of terpenes through composite PDMS/PAN solvent resistant nanofiltration membranes. Sep. Purif. Technol. 2018, 207, 470–476. [Google Scholar] [CrossRef]
- Chao, K.-P.; Wang, V.-S.; Hong, G.-M. Development of an in-cell SPME method to determine the chemical resistance of polymeric membranes to permeation by organic solvents. Polym. Test. 2012, 31, 1–6. [Google Scholar] [CrossRef]
- Poole, C. Handbook of Methods and Instrumentation in Separation Science; Elsevier Science: Burlington, NJ, USA, 2009; p. 300. [Google Scholar]
- Kloskowski, A.; Chrzanowski, W.; Pilarczyk, M.; Namieśnik, J. Partition coefficients of selected environmentally important volatile organic compounds determined by gas–liquid chromatography with polydimethylsiloxane stationary phase. J. Chem. Thermodyn. 2005, 37, 21–29. [Google Scholar] [CrossRef]
- Nevers, N. Appendix A: Useful Tables and Charts. In Physical and Chemical Equilibrium for Chemical Engineers, 2nd ed.; John Wiley & Sons, Inc.: Hoboken, NJ, USA, 2012. [Google Scholar]
- Jensen, J.L.W.V. Sur les fonctions convexes et les inégalités entre les valeurs moyennes. Acta Math. 1906, 30, 175–193. [Google Scholar] [CrossRef]
Publisher’s Note: MDPI stays neutral with regard to jurisdictional claims in published maps and institutional affiliations. |
© 2022 by the authors. Licensee MDPI, Basel, Switzerland. This article is an open access article distributed under the terms and conditions of the Creative Commons Attribution (CC BY) license (https://creativecommons.org/licenses/by/4.0/).