Article

Effect of Viscosity on High-Throughput Deterministic Lateral Displacement (DLD)

School of Engineering and Computer Science, Washington State University Vancouver, 14204 NE Salmon Creek Ave, Vancouver, WA 98686-9600, USA
*
Author to whom correspondence should be addressed.
Micro 2022, 2(1), 100-112; https://doi.org/10.3390/micro2010006
Submission received: 2 January 2022 / Revised: 21 January 2022 / Accepted: 21 January 2022 / Published: 24 January 2022
(This article belongs to the Section Microscale Engineering)

Abstract

:
Biosample analysis often requires the purification, separation, or fractionation of a biofluid prior to transport to the biosensor. Deterministic lateral displacement (DLD) is a size-based microfluidic separation technique that shows promise for biosample preparation. Recently, high-throughput DLD separation has been demonstrated with airfoil-shaped pillars at higher flow rates, but this also changes separation dynamics as the Reynolds number (Re) increases. In this work, the particle trajectories in the airfoil DLD with two different angle-of-attacks (AoAs) were studied at a range of Re with alterations of fluid viscosity to mimic biological fluids. Previous studies have found that the critical diameter (Dc) decreases as Re climes. We demonstrated that variations of the fluid viscosity do not alter the separation dynamics if the Re is kept constant. As the associated Re of the flow increases, the Dc decreases regardless of viscosity. The negative AoA with an airfoil DLD pillar design provided the stronger Dc shift to negate pressure increases.

1. Introduction

Biological sample preparation is an essential component for diagnostic testing and health monitoring with biosensors. Typical biological samples used in biosensors are whole blood, serum, plasma, urine, saliva, breast milk, sweat, cerebrospinal fluid, and gastric fluid [1]. Biological samples contain many different proteins, lipids, and contaminants that can affect how samples need to be prepared and, ultimately, the outcome of tests. These contaminants can disrupt the sensing process causing incorrect readings or undetermined results from the biosensor. The analytes of interest are often in a much lower concentration when compared to other substances that make up the remainder of the sample [1]. In addition, each of the biological samples has different viscosities or can be non-Newtonian, affecting the fluid mechanics of these samples in different preparation methods [2,3]. Due to the large variations in these samples, it is difficult to design sample preparation systems capable of multiplexing across sample types and analyte properties. To enhance the sensitivity of a biosensor, the analyte of interest needs to be isolated or the concentration of the analyte increased within a sample. This effectively increases a biosensor’s signal-to-noise ratio, allowing for higher sensitivity and better selectivity [4,5]. Many different physical properties can be used to identify analytes of interest, such as density, size, deformability, conductivity, and others [6,7,8,9,10,11,12].
Deterministic lateral displacement (DLD) is a size-based separation technique with strong potential for biosample preparation. DLD uses an array of pillars to separate particles based on their critical diameter (Dc) [13]. Dc has been previously approximated with linear [14], and power function [15] relationships. DLD has been studied in the laminar range with Reynolds (Re) values lower than one. At low Re, the device configuration leads to issues for the fractionation of multiple analytes per design. Additionally, low flow rates can result in low sample processing volumes. Both active and passive methods have been employed to fractionate analytes with different sizes. Passive methods use adjustments to the geometry of the device, such as the pillar shape [16] and the depth of the channel, to employ separation for multiple analytes with different sizes [17]. Active methods can be used to create multiplex DLD devices where external forces are applied to the particles, such as dielectrophoretic [18], gravitational [19], or mechanical forces [20]. Recently, it has been shown that symmetric airfoil-shaped pillars with neutral angle-of-attack (AoA) can be used for the high-throughput design of DLD devices due to the preservation of flow symmetry under high Re conditions [21,22,23]. Increasing the flow velocity lowers the Dc of the system, allowing for a variety of particle sizes to be separated based on the Re. With the ability to adjust Dc with alterations of flow rates, it becomes feasible to fractionate multiple target analytes in one design. Initial testing was conducted to characterize the particle trajectory in deionized water (DI) particle solution at various Re [23]. Since many biological fluids are non-Newtonian [24], the design of a DLD device for biological fluids requires a range of viscosities to be examined. Recent studies have been performed in microfluidic devices and even DLD microfluidic devices with viscoelastic fluids at low Re flows. It is concluded that with alterations to the viscoelastic fluid medium or through adjustments to the flowrate in low-throughput devices, Dc can be altered in a single device design [25].
This work aimed to characterize and further understand viscosity variations within a high-throughput DLD device. We examined viscosity variations in an airfoil pillar DLD from low to high throughput with two different AoAs, checking for alterations to the Dc. Both neutral and negative 15° AoA airfoils were tested to determine the feasibility and the effect of AoAs on particle trajectory shift at higher viscosity values. We chose the particle size close to Dc for each device to observe the particle trajectory shift with viscosity and Re changes. Based on our previous study, 15 µm and 20 µm particles were used for testing the negative 15° and neutral AoAs, respectively [21,22,23]. Due to many biological fluids being non-Newtonian, analyzing ranges of viscosities is the beginning step to characterizing the behavior of biological fluids. This allows for multiplexing with a single DLD design, negating the need for multiple devices or additional equipment.

2. Materials and Methods

2.1. Various Viscosity Sample Preparation

To test different viscosity solutions within DLD, we used glycerol (Sigma-Aldrich, St. Louis, MO, USA) mixed with DI water at ratios based on percentage weight. Glycerol solutions have been well defined at varying viscosities and temperatures [26]. The viscosities used and the mixing ratios can be seen in Table 1. The ratios defined in [26] were used to interpolate the values of viscosity for our testing buffer. Interpolation was based on a study by Chen et al. [27], where Equations (1) and (2) were developed to calculate intermediate points between known discrete glycerol water solution viscosities. Equation (1) shows an average prediction error of 1.3% from known data points, with all points falling within 5% of the known value seen in data from Segur and Oberstar [27,28].
α = 1 c m + a b c m ( 1 c m ) a c m + b ( 1 c m )
μ = μ w α μ g 1 α
In Equation (1), c m is the concentration of glycerol by weight, and both a and b are scaling factors for use in the calculation of weighting factor α . In Equation (2),   η is the absolute viscosity of the solution, μ w is the dynamic viscosity of water at 20 °C, and μ g is the dynamic viscosity of glycerol at 20 °C. Viscosities calculated based on room temperature are bolded in the temperature column. The remaining solutions were measured with a type T thermocouple (HH509R, OMEGA) with an uncertainty of ±1.0 °C.

2.2. Viscometer Measurement

A spindle-type viscometer (LVDVE115 low-range viscometer, Brookfield AMETEK, Middleborough, MA, USA) was utilized for viscosity verification during the initial testing. The viscosity of the fluid could be measured based on the rotational forces to calculate shear stresses. To measure the lower viscosity ranging from 1 to 3 cP, a YULA-15E spindle, in conjunction with the UL-enhanced adapter, was used. This provided viscosity measurement in the range of 1–2000 cP. The shear rate of the viscosity measurement is dependent on the rotational speed, the size of spindle, shape of the spindle, and the distance between the container wall and spindle surface. The YULA spindle has a spindle code of 00, which must be entered into the viscometer, correlating with a spindle multiplier constant (SMC) of 0.64. The viscometer model has a spring torque constant (TK) of 0.09373. Operating the viscometer at the top end of its speed range of 100RPM provides a full viscosity range of 5.998 cP per Equation (3) from the Brookfield manual.
Full   Scale   Viscosity   Range   [ cP ] = TK * SMC * 10 , 000 RPM
Since we measured viscosities near 1 cP, it was beneficial to use the lowest full-scale viscosity range for the device used. The accuracy, repeatability, and resolution were all dependent on the full-scale range, so utilizing the lowest range possible allowed for more accurate readings.

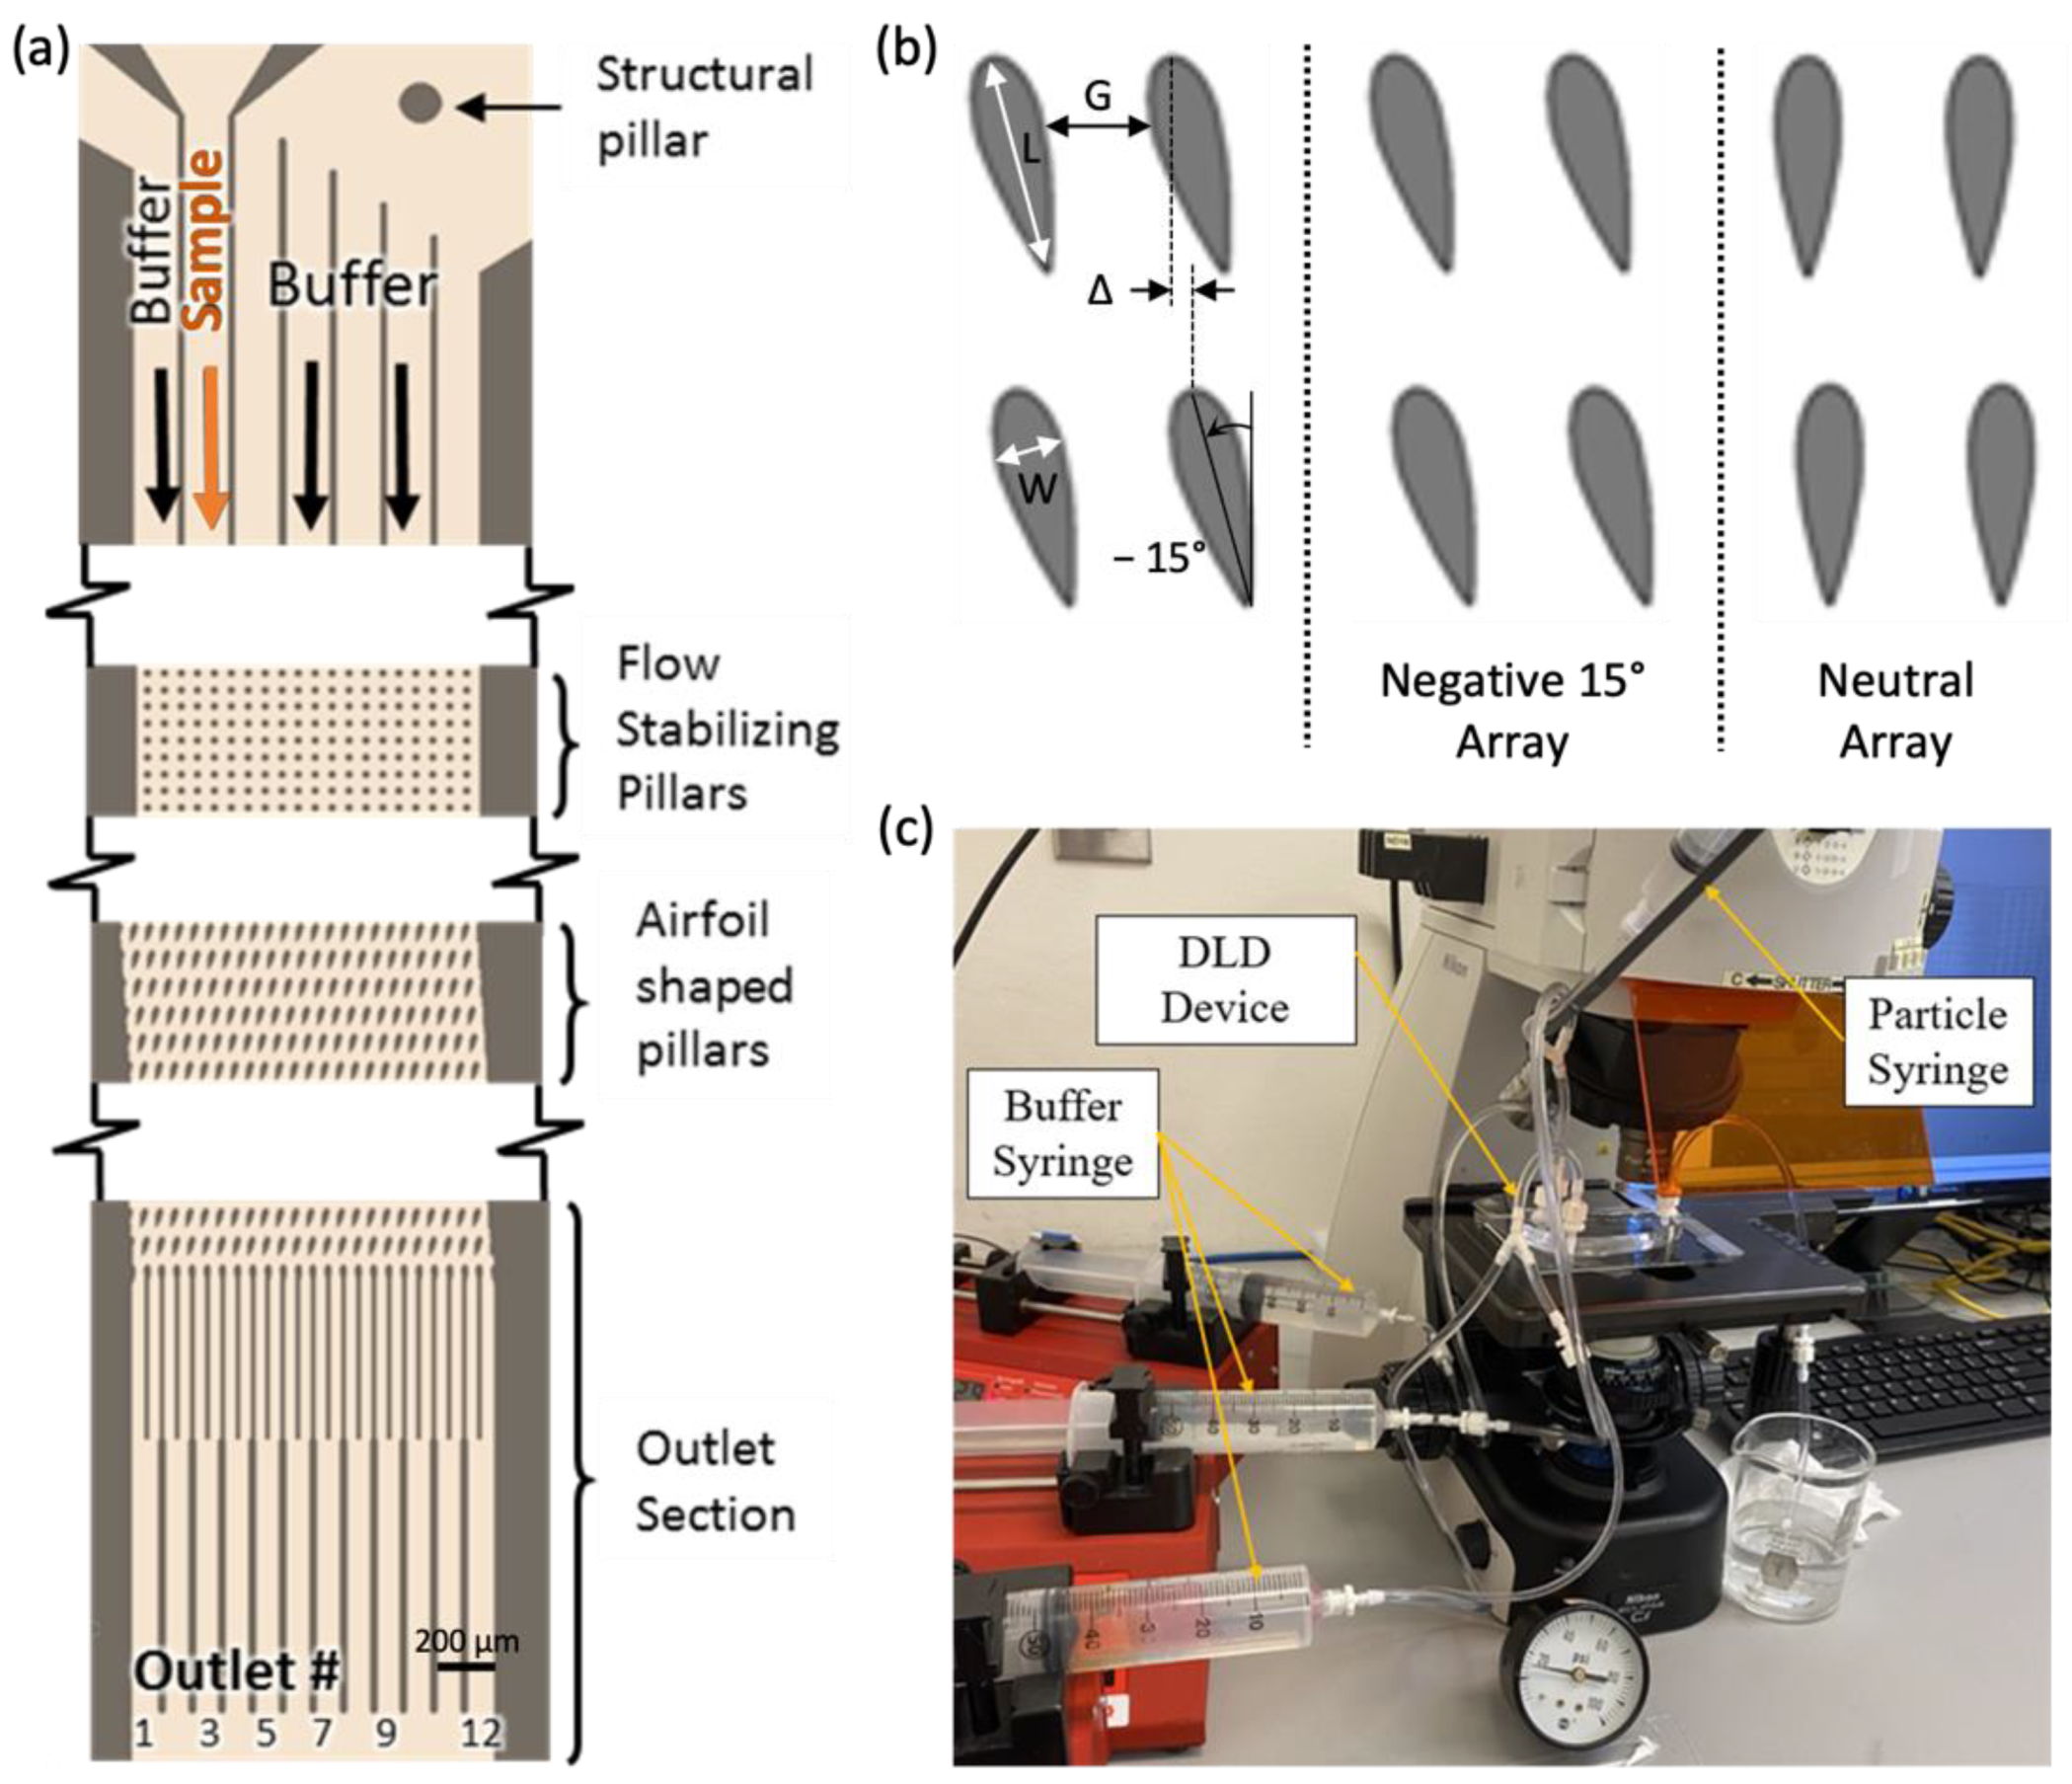
2.3. Airfoil DLD Device Design and Fabrication

Airfoil DLD devices consist of three inlets and a flow stabilization region before the airfoil pillar and outlet channel sections (Figure 1a). The particle inlet is in the middle, and the other two are the buffer inlets. The buffer inlets have different channel dimensions to allow the particle inlet to be off-center in the device. The three inlets also allow for finer tuning of each flow rate to achieve a balanced flow before particles enter the pillar array. The flow stabilization region reduces secondary flow before particles enter the DLD pillar array. The pillar array consists of airfoil pillars with two different AoAs. The airfoil DLD devices are designed to have a critical diameter of 15~20 μm, utilizing the linear Dc approximation, with a dimensionless correction factor (α), row shift (∆), period of the array (λ), and gap (G) between pillars perpendicular to flow. This study tested two different AoAs of 0°AoA (neutral) and negative 15° AoA. The airfoils were arranged in 21 periods of eight pillars with 22 pillars per column in the displacement direction. The airfoils were based on a NACA0030 modified airfoil. The first two digits 00xx indicated no camber, and the last two digits xx30 indicated a 30% thickness to width ratio. The AoA of the airfoils was defined as angle alterations to the normal flow direction. Figure 1b shows a NACA 0030 airfoil with neutral and negative 15° AoAs.
The devices were fabricated using soft lithography. The SU8 mold was silanized before PDMS (Polydimethylsiloxane, SYLGARD® 184, Dow, Hayward, CA, USA) curing using a droplet of trichlorosilane (Sigma-Aldrich) in a desiccator chamber overnight. The PDMS was thoroughly mixed at a ratio of base to curing agent of 10:1, and then desiccated to remove all air bubbles. The PDMS was then poured on the SU-8 mold, and cured in an oven at 90 °C for 90 min. Devices were then removed from the mold, cut to the desired shape, and cleaned. All inlet and outlet holes were cut with a biopsy punch for insertion of a lure barb valve and tubing. The PDMS devices were then ready to be permanently bonded to a glass slide using oxygen plasma treatment on both the glass slide and the PDMS.

2.4. DLD Testing Methods

Figure 1c shows the experimental setup to examine the effect of viscosity with airfoil DLD devices. To reduce clogging during particle testing, surface treatment was conducted by pumping sodium dodecyl sulfate (SDS, 2 mM in DI water) solution through the PDMS device, then leaving it to soak for 2–3 h prior to testing. During particle injection testing, Re was varied by increasing the flow rate through the device based on the definition of Re given in Equation (4).
R e = ρ v L μ  
Here, ρ is the density of the fluid, μ is the dynamic viscosity, L is the characteristic length, and v is the velocity of the fluid. The characteristic length L is the gap size between the airfoil pillars (40 µm), and the dynamic viscosity is outlined in Table 1. For our device, density varied with tests as different mixtures of glycerol and water were used, but it remained close to the density of water at 1000 Kg/m3.
The flow rate was set with Syringe pumps (kdScientific KDS-200, New Era NE-1000X, Holliston, MA, USA), allowing the system to reach equilibrium between each subsequent test. Flow for each pump was chosen based on its correlated channel area to achieve the desired ratios. Once the desired flow rate was stabilized, polystyrene particles (Phosphorex, Max Std Dev < 2% of the nominal particle size, Thermo Scientific, Waltham, MA, USA) were injected into the particle inlet channel. Flow uniformity was verified by ensuring that the particles were flowing straight when first entering the stabilizing region of the DLD. The buffer was a mixture of DI water and glycerol. The sample inlet channel was also the same mixture, but small volumes of a <2% solid mixture of polystyrene particles were occasionally injected into the channel. All tests were performed with 15 µm particles for negative 15° AoA and 20 µm particles for the neutral device. Particle trajectories were recorded with a high-speed camera (Phantom Mira 310, Wayne, NJ, USA) mounted atop an optical microscope (Nikon Eclipse Ci, Melville, NY, USA). The framerate of capture varied with the speed of the particles but generally was in the 3000–10,000 frame-per-second range to ensure frame-to-frame tracing of particles. Particle velocity was obtained using the Phantom Camera Control (PCC) application from videos in the middle of the DLD array. Particles were traced frame-to-frame using the distance traveled and time taken to calculate particle velocity. Distance traveled was determined by calibration prior to each set of readings, with device dimensions used for reference. The distribution of particles was manually determined using the PCC software. Outlets were numbered from left to right beginning with #1, with the far-right outlet being #12, as seen in Figure 1a. Particles flowing through outlets 1–4 represented no particle shift trajectory; this was named zigzag mode. Particles in outlets 5–8 were in a mixed mode, and particles in 9–12 represented full particle shifts, which was classified as a bumped mode.

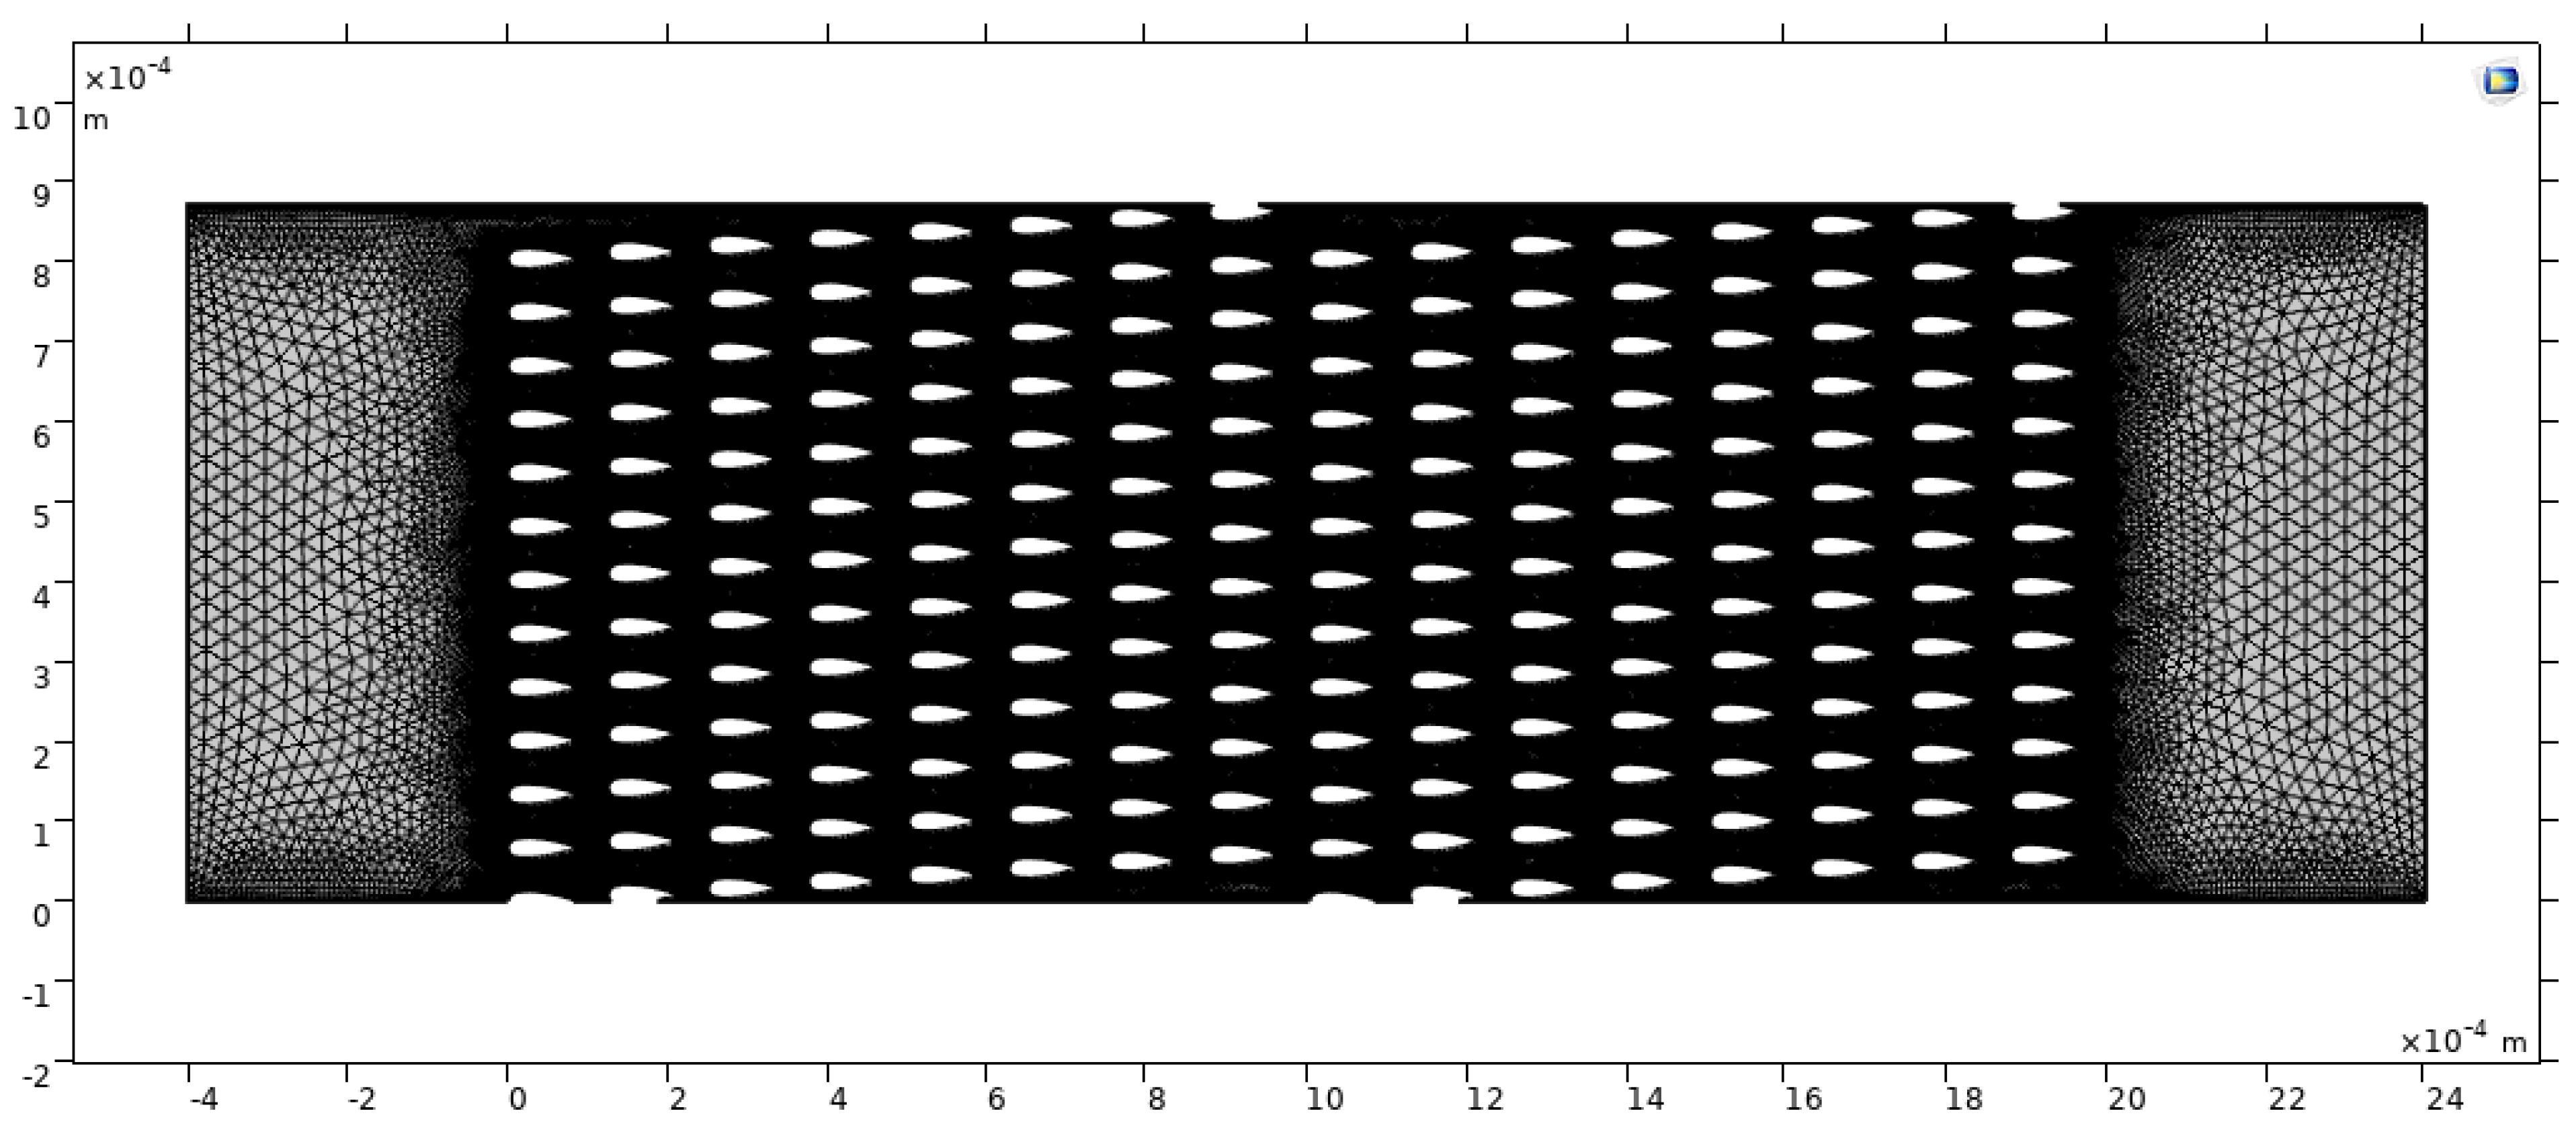
2.5. Computational Study

To supplement our experimental results, a computational study was conducted using COMSOL Multiphysics. A 2D model consisting of a cut-out portion of the airfoil DLD array was used for simulations. The DLD was created using identical coordinates, gap sizes, rotations, and row shifts, as previously described. Except for the inlet and outlet, all boundaries were set to a no-slip condition. The inlet was set to a constant flow velocity while the outlet was set to atmospheric pressure. Inlet velocity was altered through the simulations to account for various Re values that correlated to our experimental data. Re for the simulation was approximated by using the highest velocity flow, which occurred in the center of gap G between pillars. Throughout the simulation, viscosities of 1, 3, and 5 cP were used with inlet flows adjusted to correlate to Re values of 1, 10, 25, 50, 75, and 100. Besides the alterations in viscosity, properties of DI water were used for the liquid. Magnitude-controlled streamlines were plotted to analyze positional data at varying Re values and viscosities. Utilizing simulation data, we were able to expand our results past flow rates and viscosities that were not experimentally feasible due to testing limitations. A plot of the mesh size utilizing physics-controlled mesh with finer size selection for the neutral AoA device can be seen in Figure 2.

3. Results and Discussion

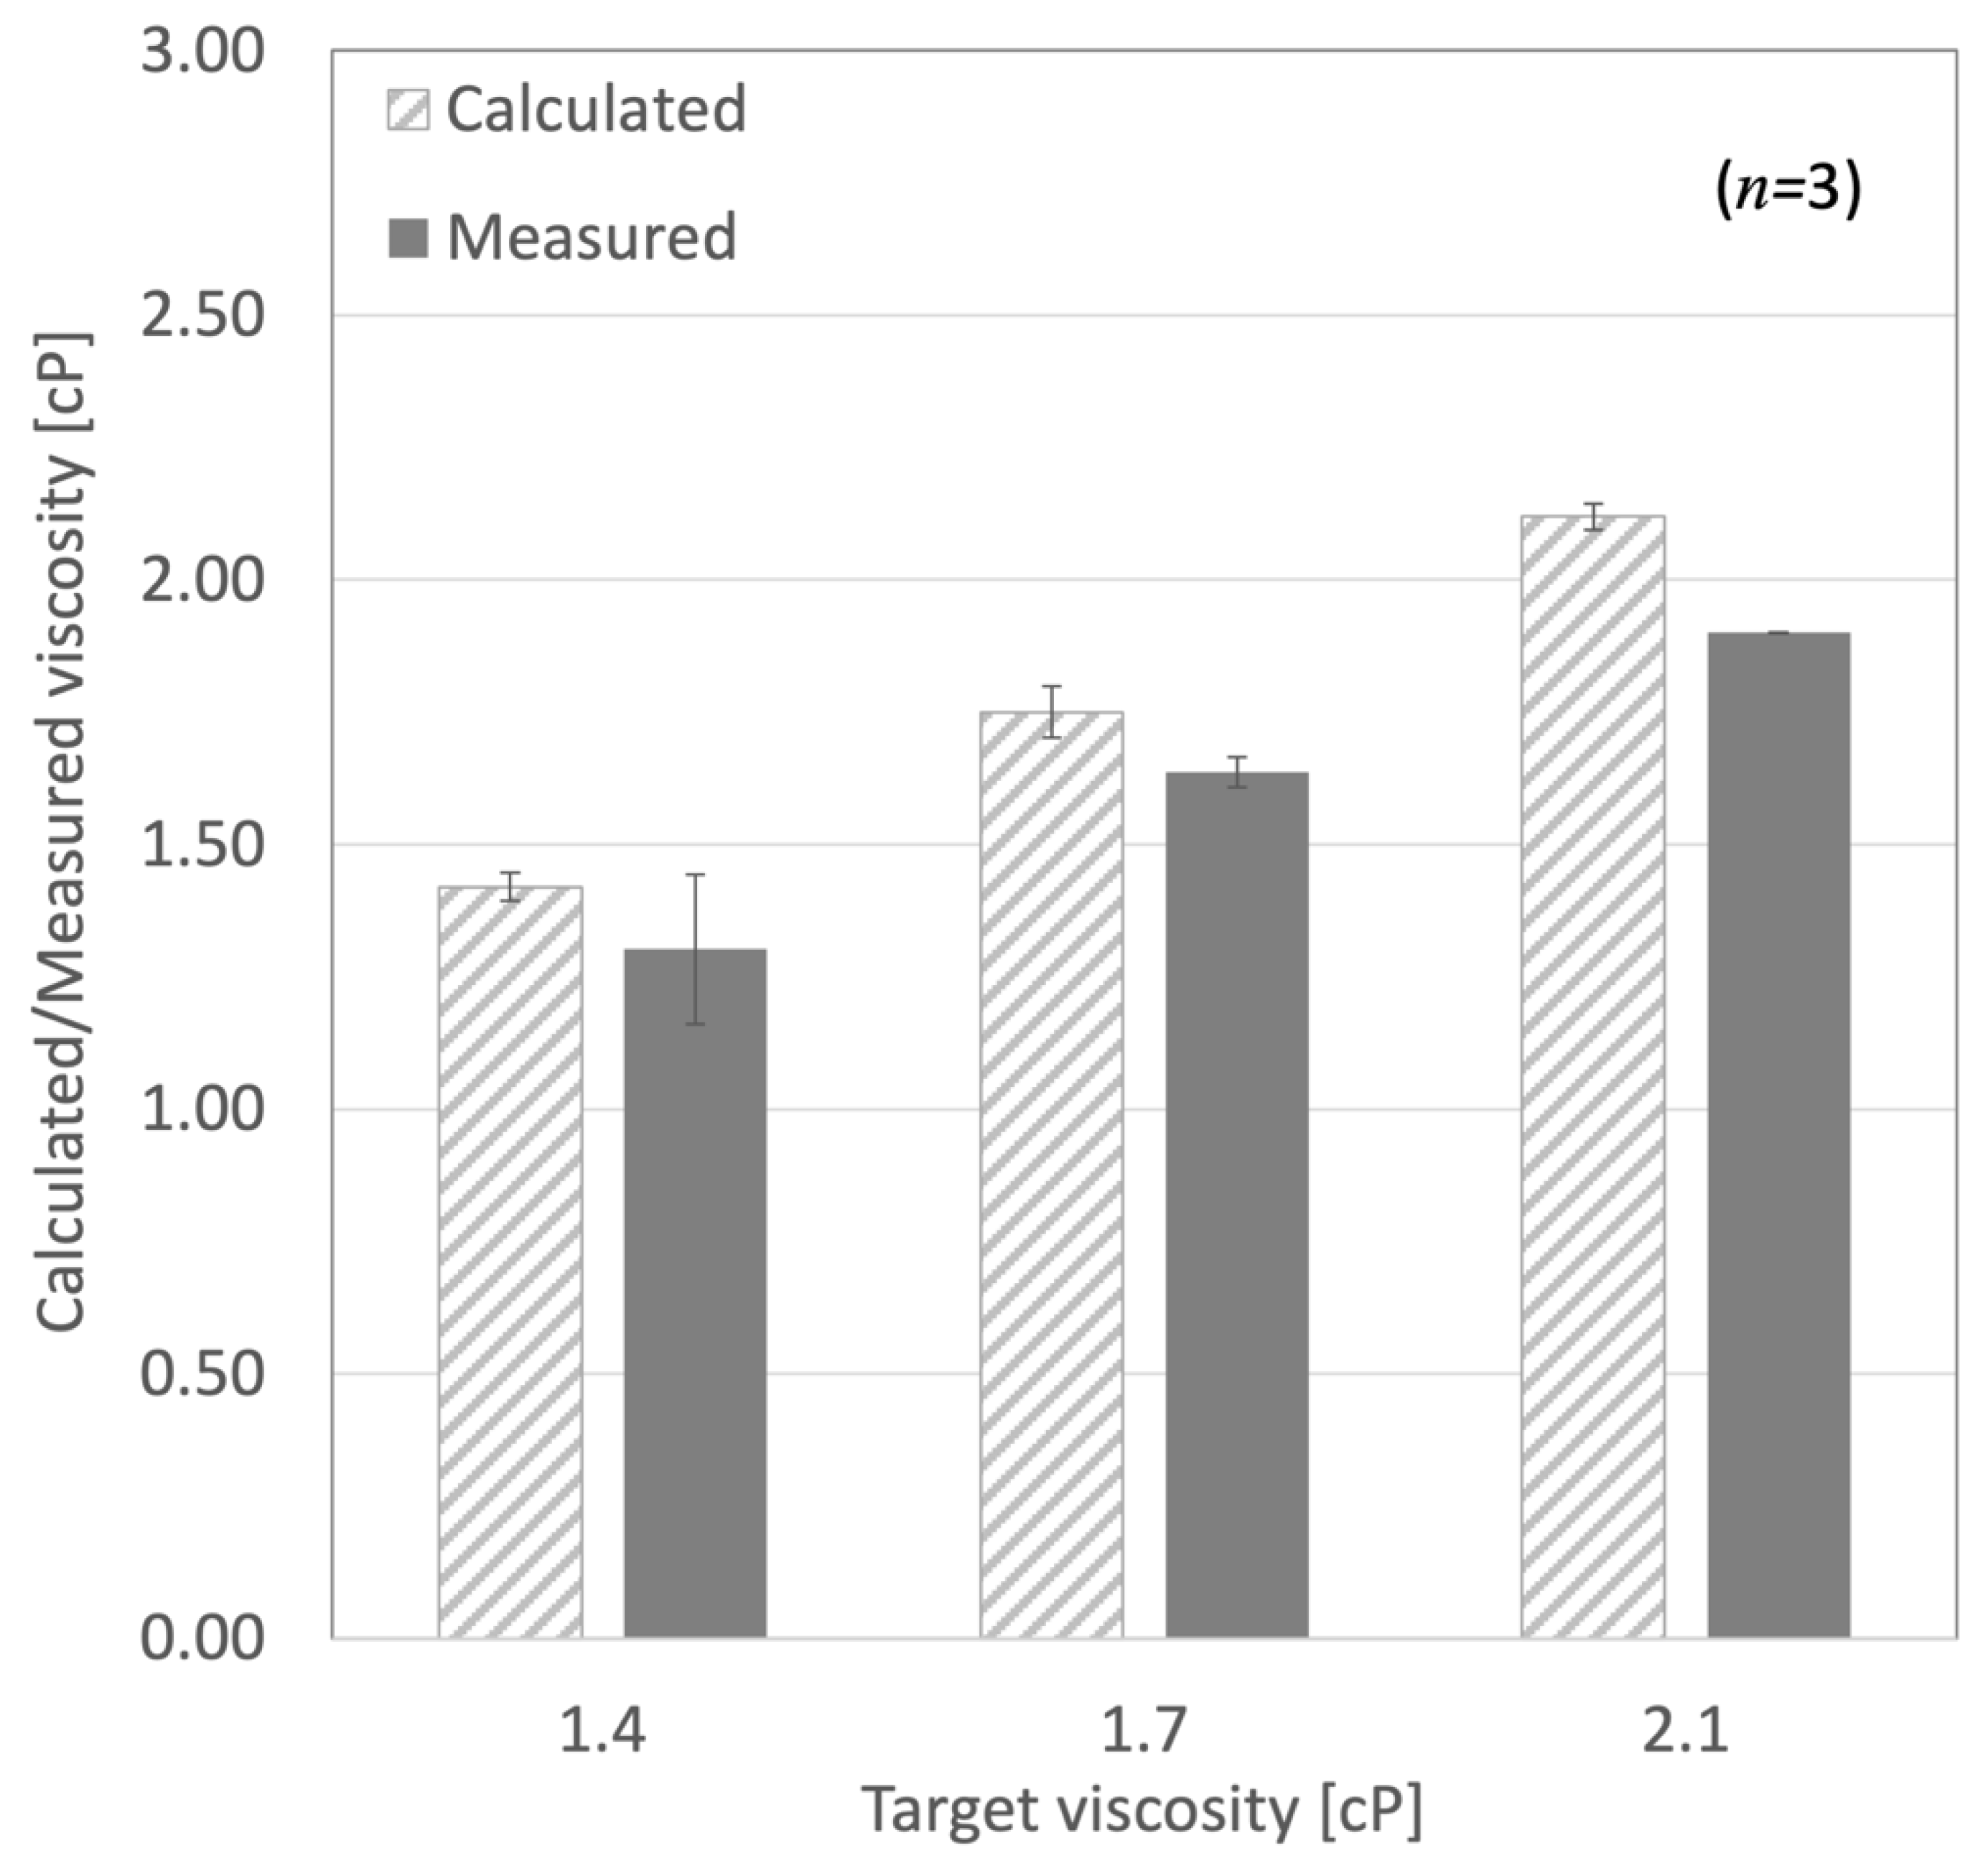
3.1. Viscosity Measurement

Initial testing of the viscosities for various solutions was performed with a viscometer. While interpolation based on defined data sets from the literature was used to calculate the viscosities, we also used a viscometer to check the approximate values. Figure 3 shows the calculated and measured viscosities. Overall, the calculated and measured viscosities were similar across the nine measurements shown.

3.2. DLD Testing Results

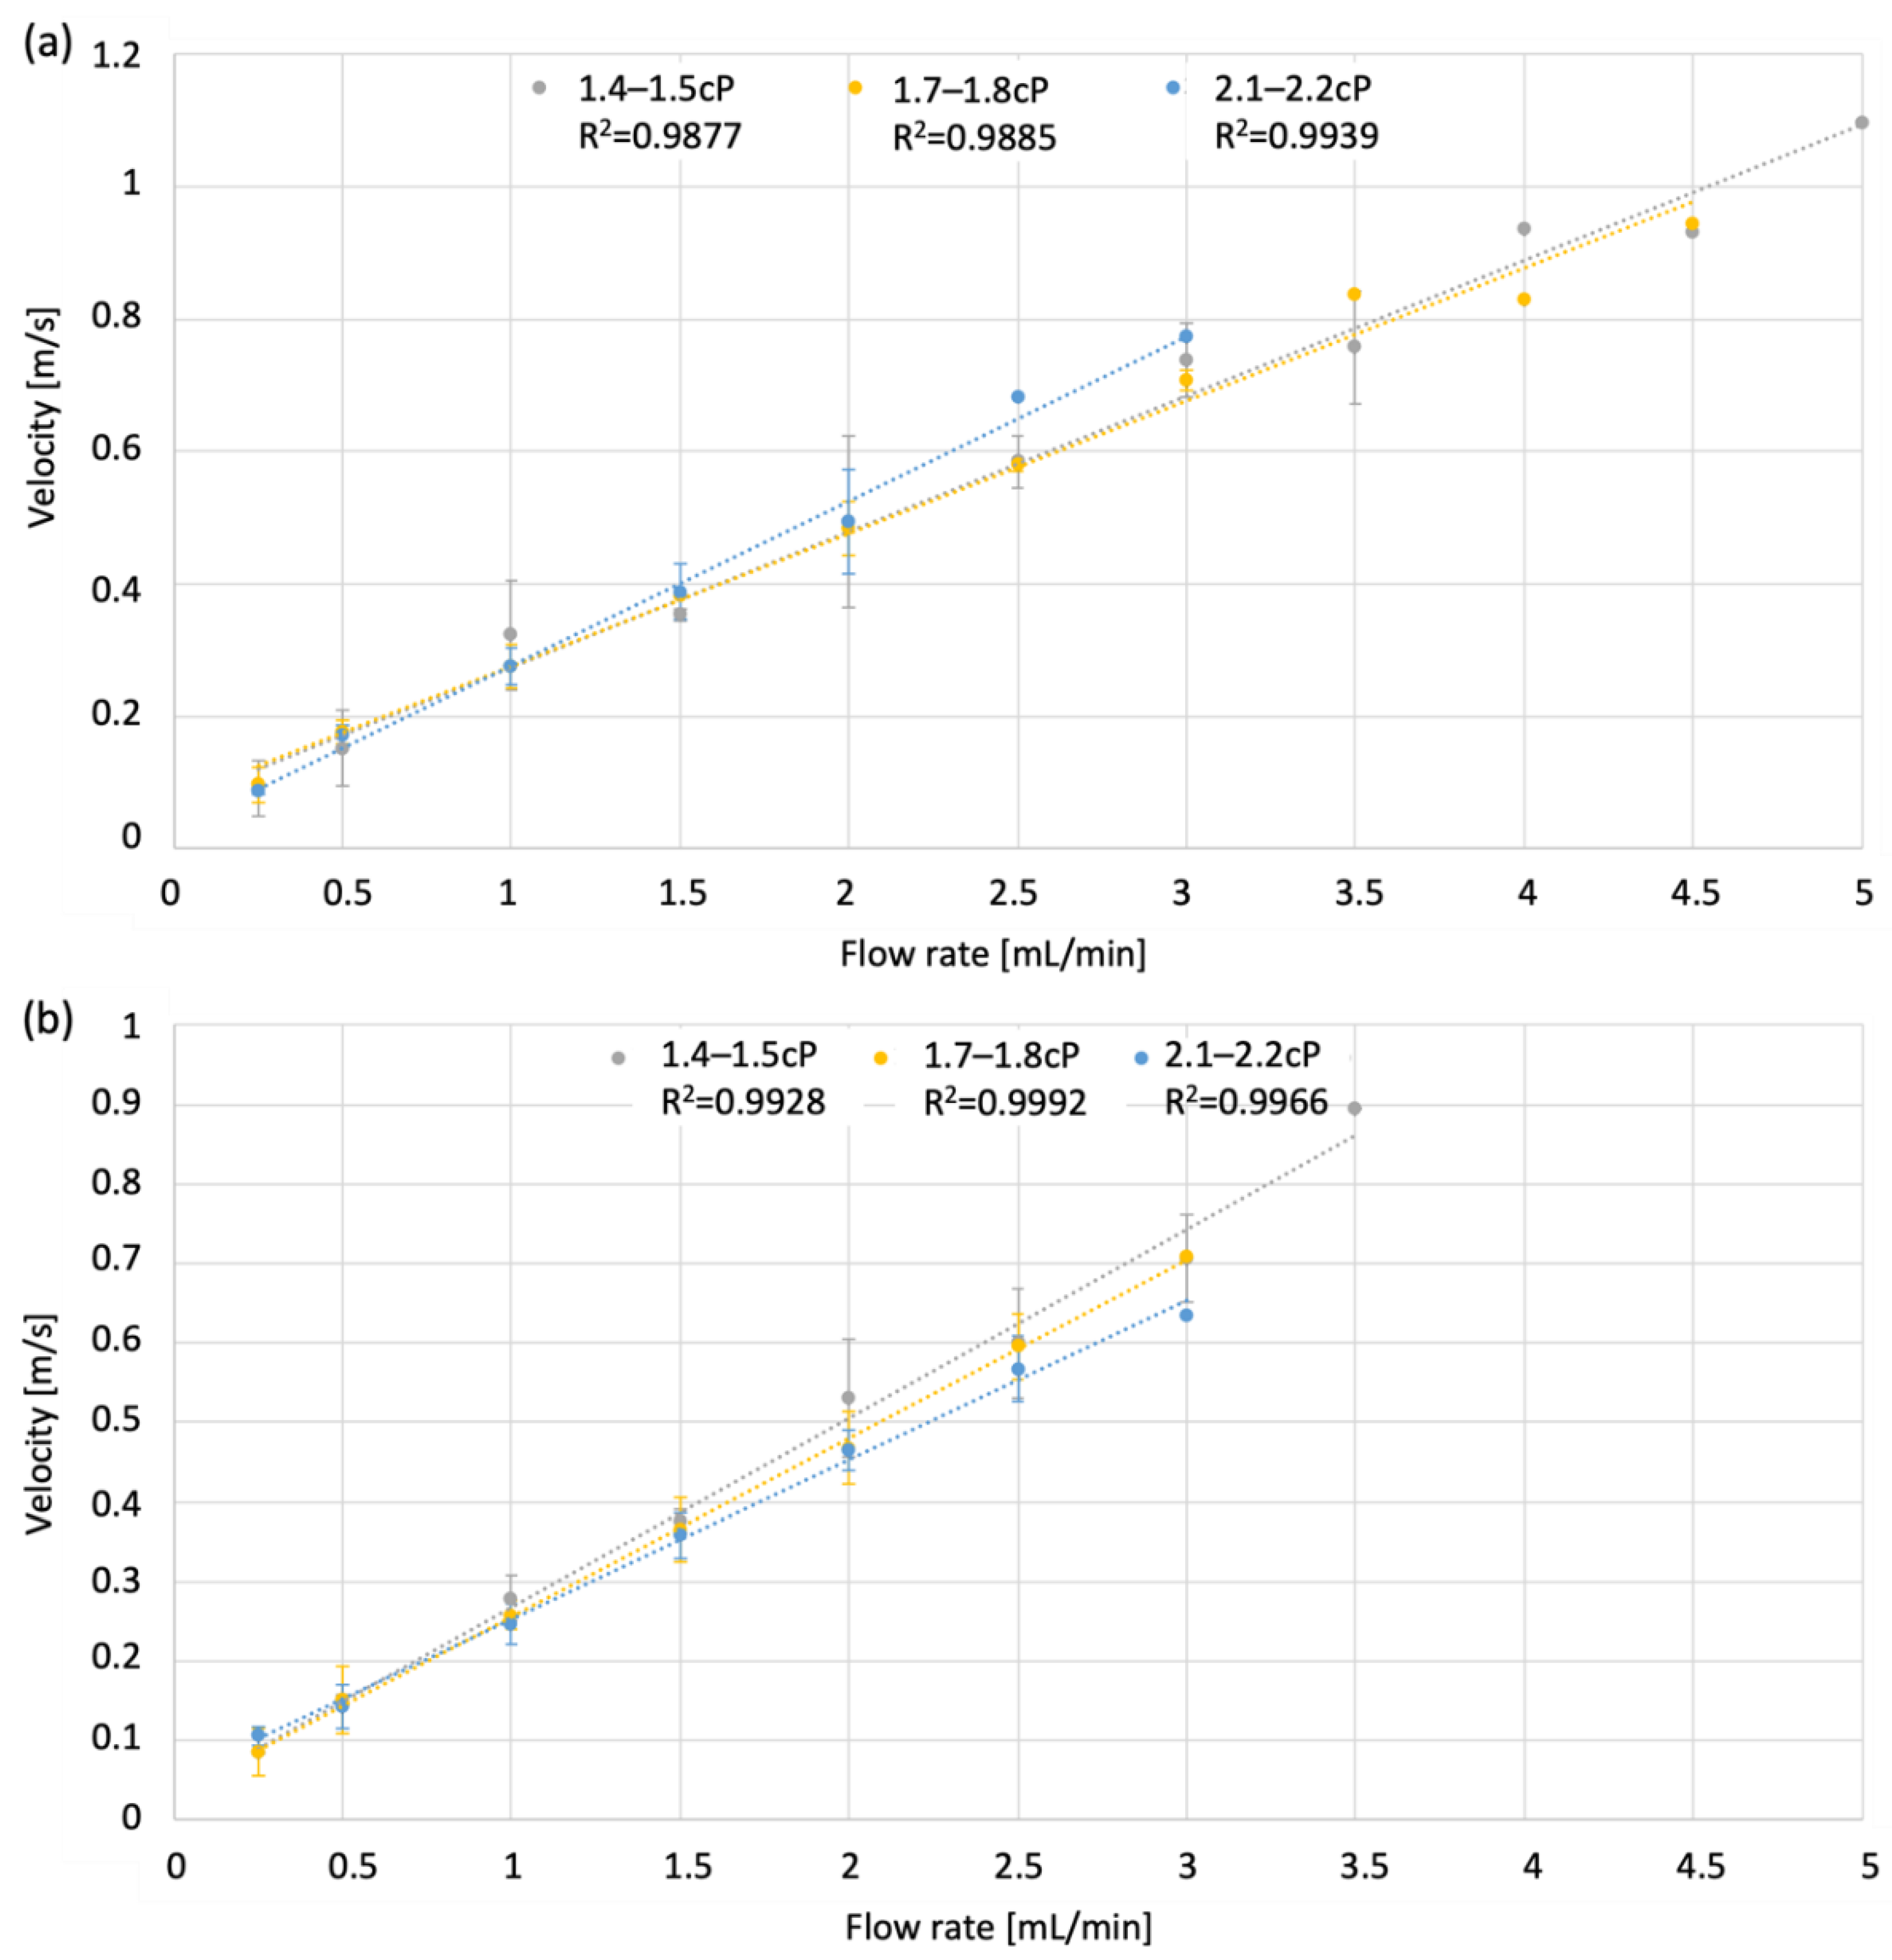
3.2.1. Flow Rate Linearity
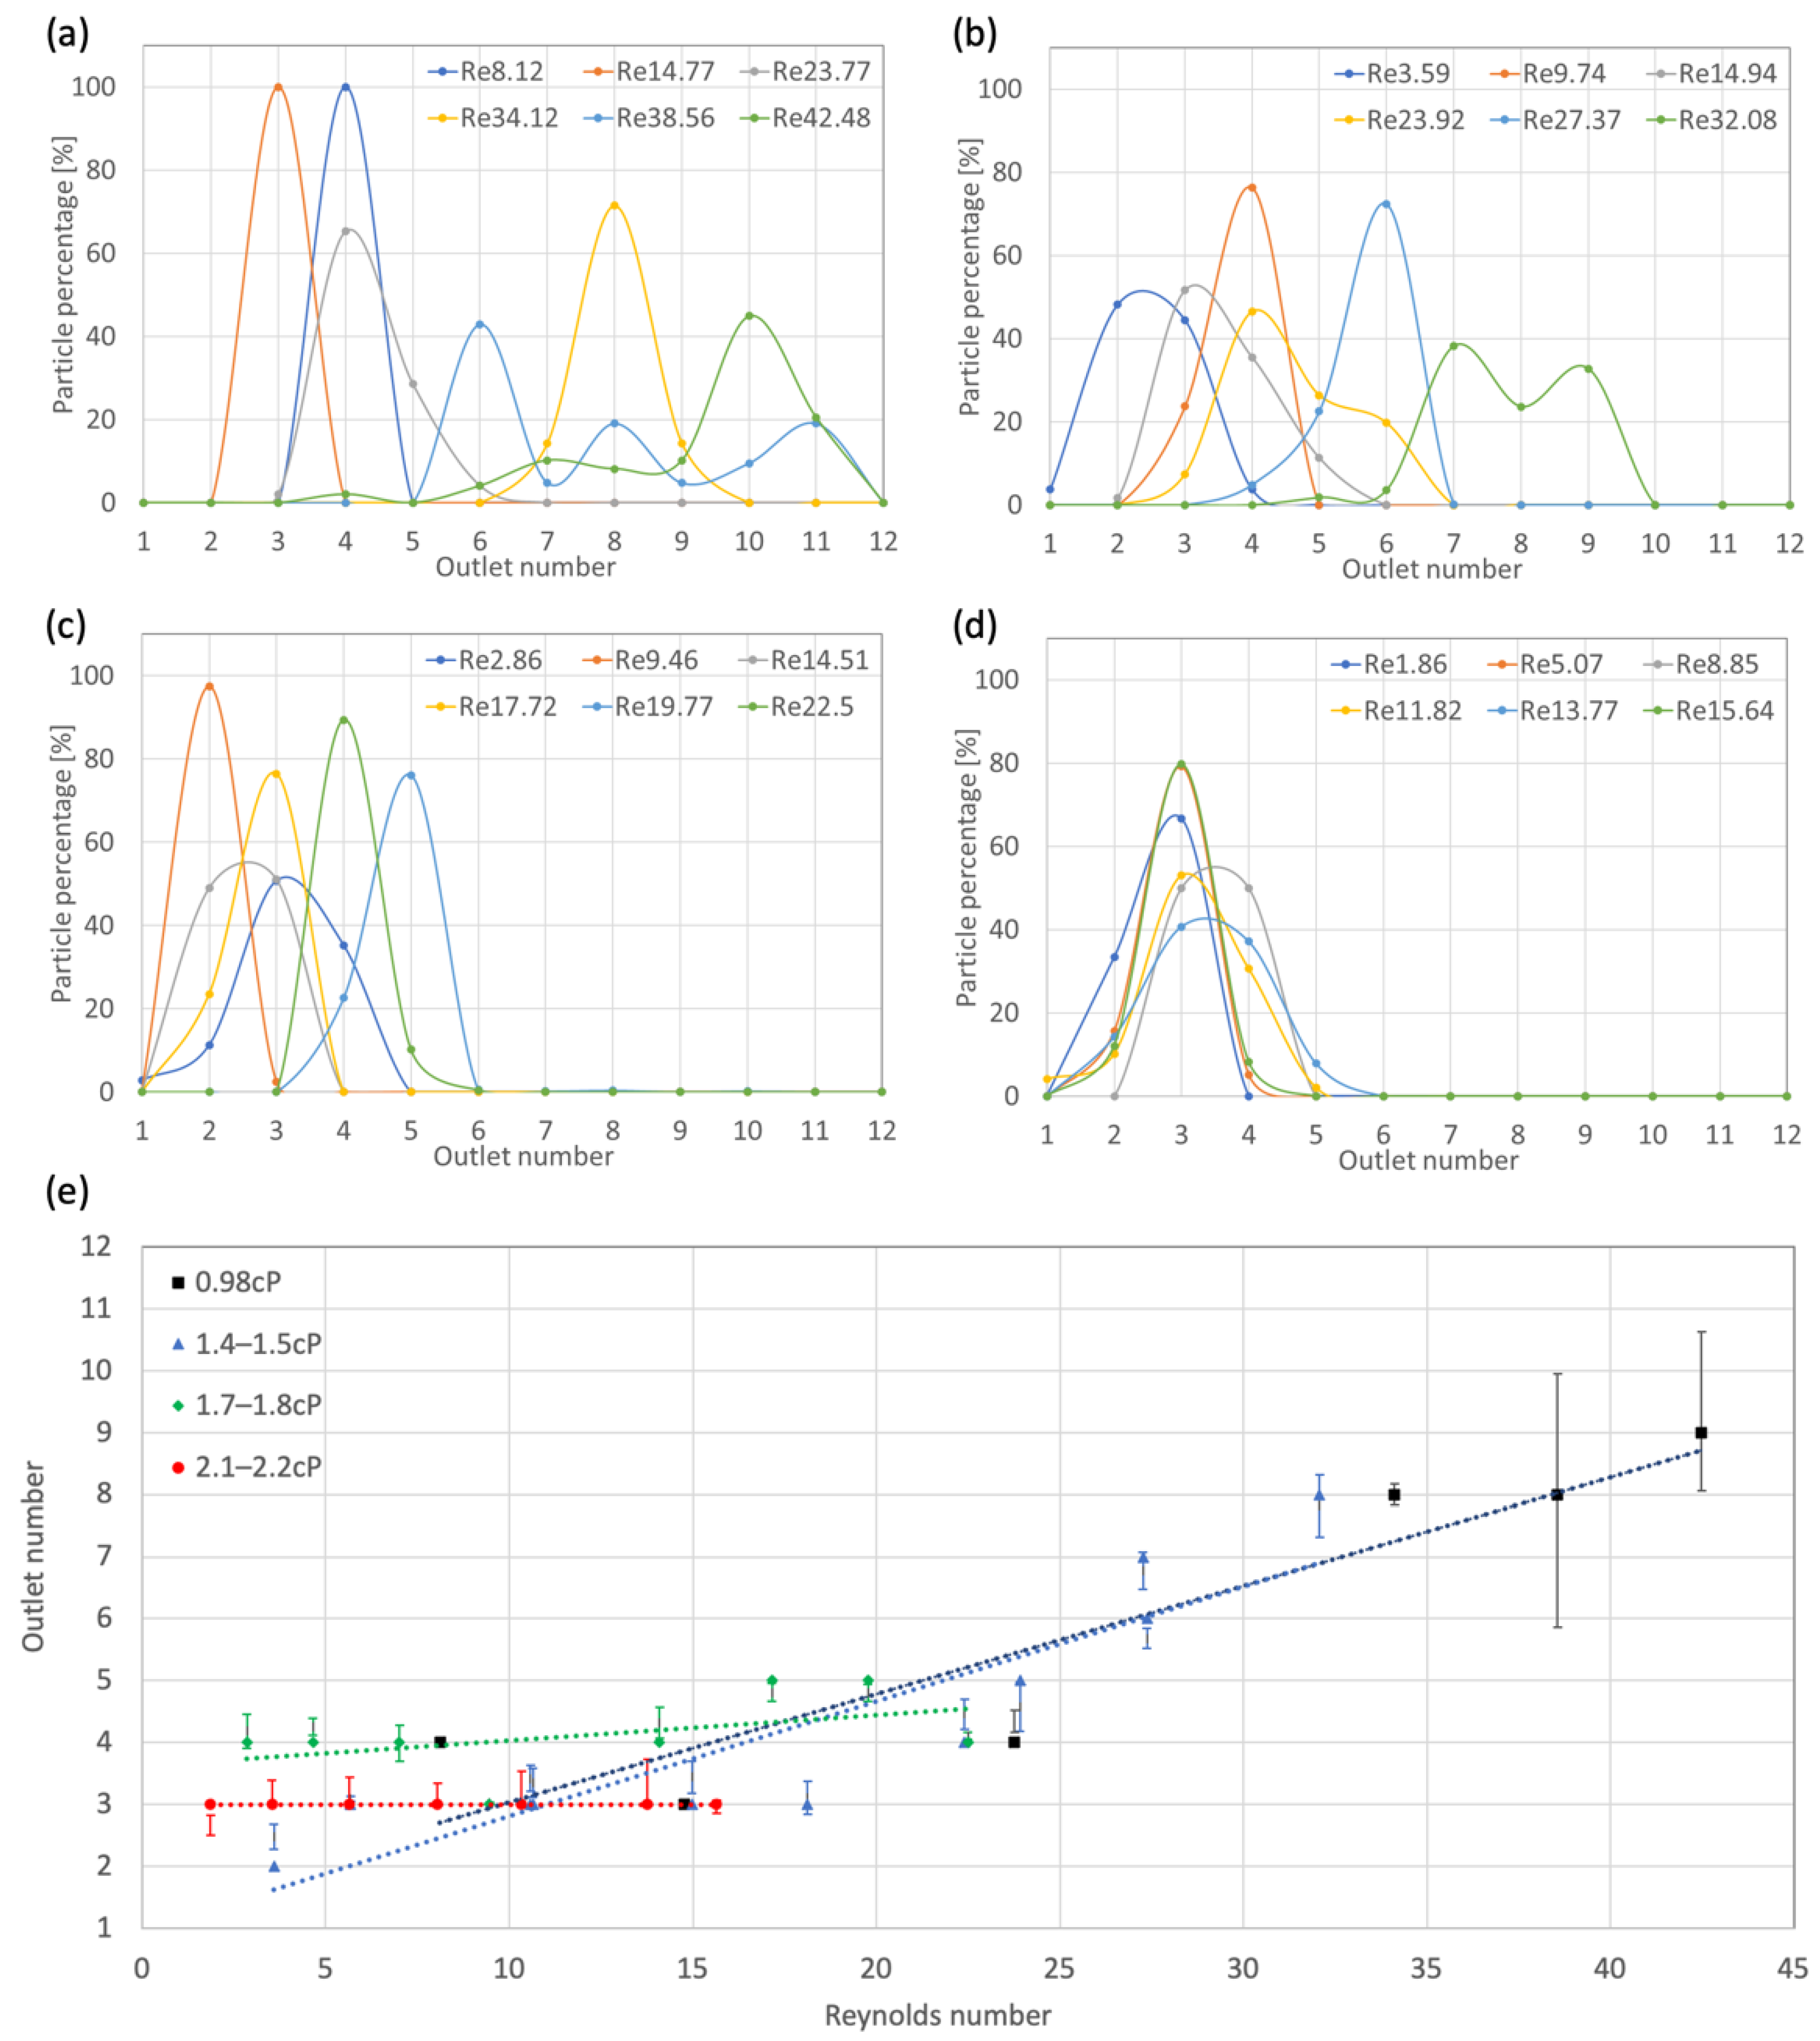
In Figure 4, the range of flow rates is plotted versus the average velocity for the range of viscosities tested. The trend shows that velocity has a linear relationship with volumetric flow rate, indicating that particle velocity measurement is a good approximation for Re of the flow. This linear relationship also confirms that the experimental system maintained an approximately constant volume at all flow rates. Therefore, channel deformation with increasing pressure was negligible within the ranges tested.

3.2.2. Neutral AoA

Particle percentage versus outlet number is plotted for the neutral AoA device in Figure 5. For these figures, particles for multiple devices tested are compiled, and the particle percentage distributions versus the outlet number are displayed for the full range of flow rates tested. The correlated average Re for each flowrate is displayed in the legend for each figure. For 20 µm particles, the ranges of viscosities tested were DI water (0.98 cP), 1.4–1.5 cP, 1.7–1.8 cP, and 2.1–2.2 cP. The range of Re values tested decreased as the viscosity increased due to experimental design and equipment limitations. For example, the internal pressure of the DLD was higher at 1 mL/min for the viscosities of 2.1–2.2 cP when compared to the 1.4–1.5 cP viscosity tests since pressure scales with viscosity in pressure-driven flows. Due to the pressure increase, we were unable to reach high flow rates with the higher viscosities, and the Re value could not reach higher values.
Particles showed Dc shift as the Re value was increased, even reaching bumped mode for the lowest viscosity tested of DI water at 0.98cP (Figure 5a). For the 1.4–1.5 cP range, as Re increased, a large percentage of the particles were seen in mixed mode, beginning at around 20 Re (Figure 5b). Particles remained in zigzag mode at Re values below 20. In the 1.7–1.8 cP range, a higher flow rate was not achievable due to increased pressure, as previously described. Particles largely remained between mixed and zigzag mode without showing a clear trend with an increase in the Re value (Figure 5c). In the 2.1–2.2 cP range, all particles remained in zigzag mode, and Re values above 15.64 were not achievable with device limitations (Figure 5d).
The average Re for each individual flow rate was calculated, and the results are displayed on the x-axis in Figure 5e. The correlated mean outlet number was calculated by determining the probability of a particle passing through the outlet then multiplying that probability by its correlated outlet number. The mean outlet could finally be calculated by summing probabilities multiplied by their correlated outlets for all 12 outlet values. The outlet points displayed in Figure 5e were rounded to the nearest integer since partial outlets were not possible. The probability of a particle passing through outlet x, where x represented an outlet between 1 and 12, was determined by dividing the number of particles that traveled through outlet x by the total number of particles counted at the flow rate. This provided the probability that a particle would travel through outlet x with a value of 1 correlating to 100% probability. The sample standard deviations were calculated and the results are displayed as error bars in Figure 5e. The standard deviation is displayed relative to the calculated mean outlet before rounding to the nearest integer. The slope of the particle shift for the viscosity range of 1.4–1.5 cP versus that of DI water 0.98 cP was very similar and showed an increase in outlet number as Re was increased. For a viscosity of 1.7–1.8 cP, a slight increase in the slope was observed. To determine if this slope would match that of the 1.4–1.5 cP and DI water tests, higher flow rates and, therefore, Re would need to be tested. The viscosity range of 2.1–2.2 cP had a flat slope, and a shift was not observed. Higher flow rates need to be tested using, for instance, the 1.7–1.8 cP test. The slopes of the trend lines for 2.1–2.2 cP, 1.7–1.8 cP,1.4–1.5 cP and 0.98 cP were 2 × 10⁻¹⁶, 0.0413, 0.1858, and 0.1751, respectively, with the R2 values of NA being 0.2195, 0.9511, and 0.8484. To compare trends from the data with similar slopes, we excluded data outside of one standard deviation or with an R2 of less than 0.50, and the average slope of the trend lines was 0.18045 with a standard deviation of 0.007566.

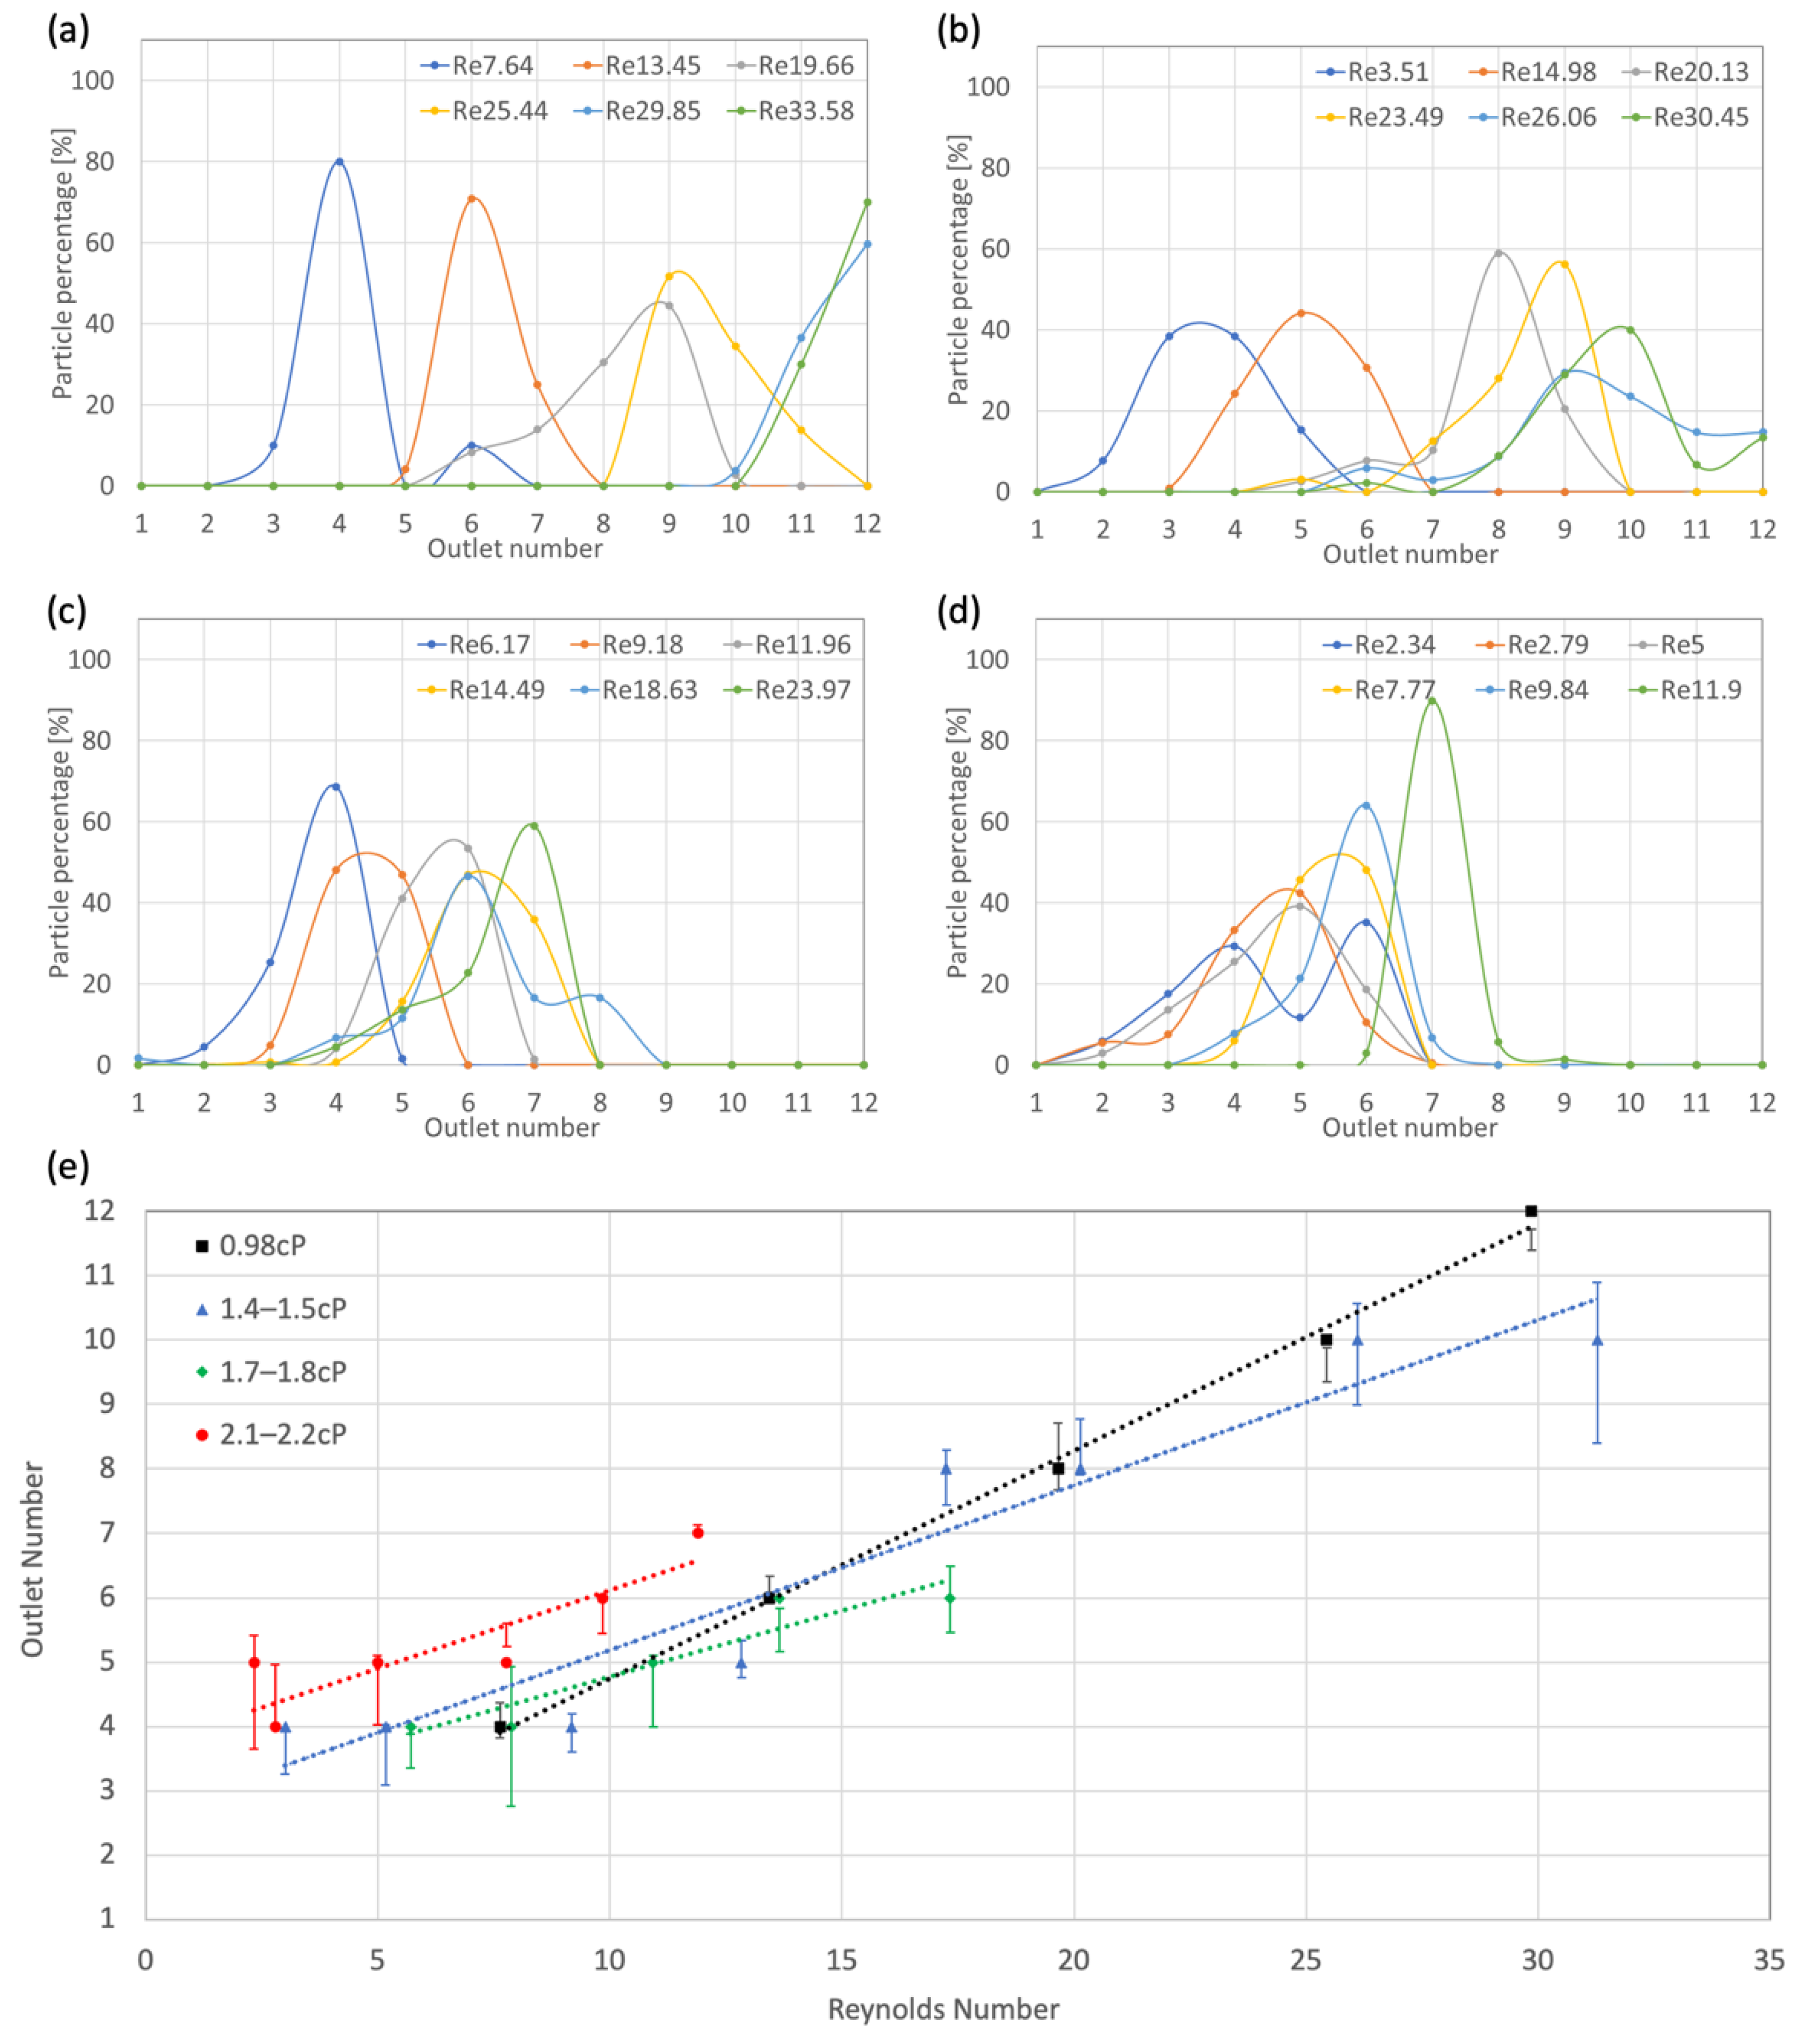
3.2.3. Negative 15° AoA

Figure 6 shows particle percentage versus outlet number for the negative 15° AoA device with 15 µm particles. The ranges of viscosities tested were 0.98 cP (DI water), 1.4–1.5 cP, 1.7–1.8 cP, and 2.1–2.2 cP. Particles tended to shift at a much lower Re when compared to the neutral device. For DI water at 0.98cP, particles were in zigzag mode at 7.64 Re and increased to full bumped mode as the Re value increased to 29.85 (Figure 6a). For a viscosity of 1.4–1.5 cP, particles again started between mixed and zigzag mode at low Re, then progressed to bumped mode as the Re increased above 20.13 (Figure 6b). For the viscosity of 1.7–1.8 cP particles, they started between mixed and zigzag mode, then shifted slightly to the middle-range mixed mode at an Re value of 18.63 (Figure 6c). In the viscosity range of 2.1–2.2 cP, the particles largely stayed in high-value zigzag or low-value mixed mode, except at 11.9 Re, at which particles were in the middle-range mixed mode (Figure 6d). As previously discussed, the flowrate ranges tested at higher viscosities were limited due to equipment and bond failure negating the ability to reach a high Re number in the higher viscosities.
The trends in the negative 15° AoA devices seen in Figure 6e were similar to each other as Dc shifts could be seen at all viscosities tested. The slope of the particle shift increases for the viscosity ranges of 1.4–1.5 cP, 2.1–2.2 cP, and 0.98 cP were all similar. Higher Re should be tested for the viscosity range of 2.1–2.2 cP to check the full range ending around 30 Re, as seen for the 0.98 cP and 1.4–1.5 cP ranges. The slope of the 1.7–1.8 cP range was much flatter. This trend may have been skewed due to the low-end Re tests at higher viscosities being in mixed mode with an average outlet number of 5. To fully compare the 1.7–1.8 cP trend, high-end flow rates also need to be tested to see if the slope would increase to match that of the other viscosities tested. The slopes of the trend lines for 2.1–2.2 cP, 1.7–1.8 cP, 1.4–1.5 cP, and 0.98 cP are 0.245, 0.1, 0.2568, and 0.3533, respectively, with R2 values of 0.8829, 0.5278, 0.9199, and 0.9967. Excluding data outside of one standard deviation or with an R2 less than 0.50, the average slope of the trend lines was 0.251 with a standard deviation of 0.008697. It is worth noting that the pressure within the DLD device increased as the viscosity increased, leading to issues with both AoAs DLD sealing as well as the external pumps. Due to equipment limitations, the negative 15° AoA DLD devices better controlled the particle trajectories and, thus, show greater promise for future applications, because the particle shift began at lower Re values when compared to the neutral AoA device. The decrease in Dc at lower Re in the negative 15° AoA device allowed us to observe particle shifting behavior even with the increased pressure caused by the higher viscosities used.

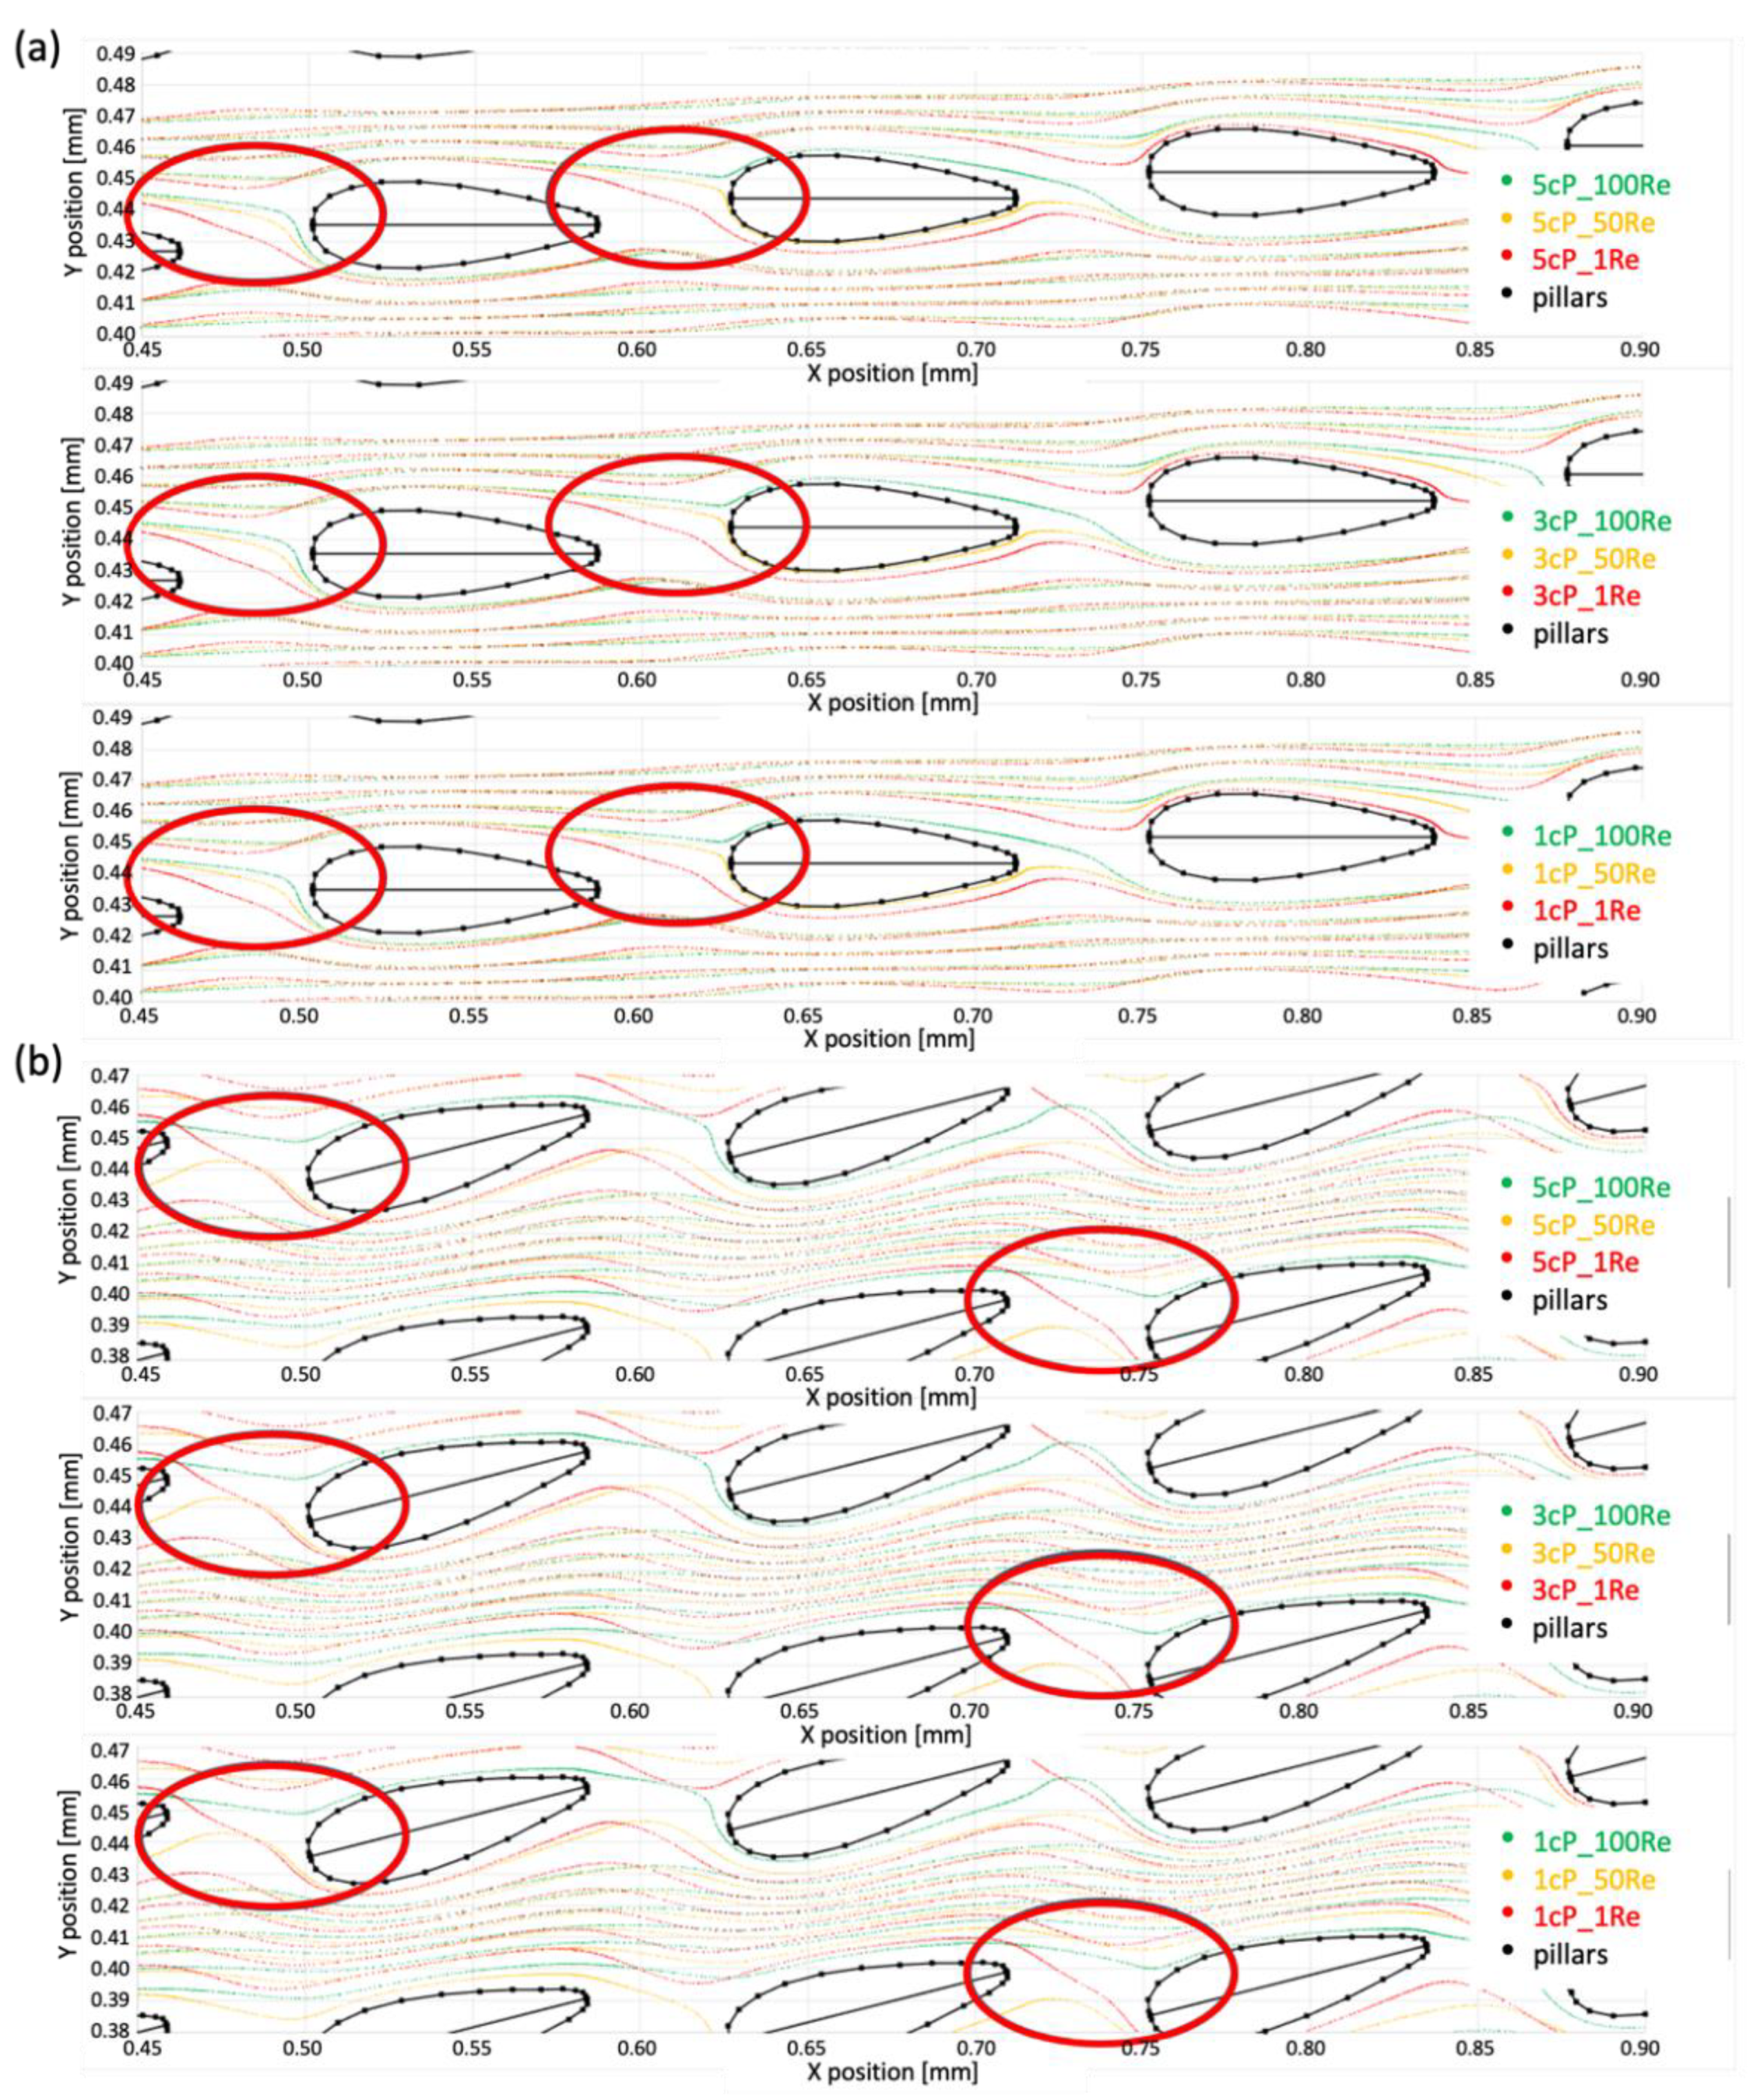
3.3. Computational Study Results

The streamlines from COMSOL for neutral AoA and negative 15° AoA devices at Re values of 100, 50, and 1 for viscosities of 5, 3, and 1 cP are plotted and compared. Based on our observation, streamlines were indistinguishable for matching Re across all viscosities. At an Re of 100, streamlines extended past the airfoil pillar, leaving less room for a particle to transition downward. As the Re decreased to 50, the streamline separation lessened, and at an Re of 1, the streamlines closely followed the outline of the pillar. Comparing the neutral and negative 15° AoA streamlines, the negative 15° AoA device had more separation of the streamlines at the tail of the airfoil pillar. This observation coincides with the results from the experimental data of the negative 15° AoA devices showing the shift of particles at lower Re numbers.
For further analysis, streamline positional data for the airfoil devices were plotted in Excel and are displayed in Figure 7a,b. Figure 7a shows the positional data of the streamlines for Re values of 100, 50, and 1 for viscosities of 5, 3, and 1 cP in a neutral AoA device. Areas showing a clear separation between the different Re value streamlines are circled in the plots. The plot clearly shows that at low Re, the streamlines decreased in position on the y-axis following interaction with an airfoil, as compared to the streamlines observed at Re values of 50 and 100. At an Re value of 50, the expected trends were followed, dropping down in the y position before the 100 Re streamline but separating further from the trailing edge of the pillar as compared to the behavior observed at the 1 Re streamline in x position. This was true across all viscosities simulated with higher Re values traveling further into the gap in the x-direction before dipping down and even crossing above the pillar instead of below, as with the 1 and 50 Re streamlines, as seen in the second circled region.
Figure 7b shows the positional data of the streamlines for Re values of 100, 50, and 1 for viscosities of 5, 3, and 1 cP in the negative 15° AoA device. This plot analysis led to the same conclusions as the neutral airfoil analysis plots. As expected, separation was more defined in the negative 15° AoA plot. Still, it followed the same trend as that higher Re values, showing a further direction traveled in the x-direction before dipping as before.

4. Conclusions

DLD continues to show promise with great potential for biosample preparation. Previously, it was shown that particle Dc decreases with an increase in the Re number. Additionally, the AoA of airfoil pillars was examined, showing that AoA can alter the Dc. In this research, airfoil pillar DLD designs with solutions that resemble a biological fluid were studied in high-throughput scenarios. Testing was performed with viscosity variations in a negative 15° and a neutral AoA airfoil DLD device, with incremental Re throughout testing. We demonstrated that alterations to viscosity still cause particles to follow previously found trends based on Re. The Dc decreased as Re increased with various viscosities of fluids. The streamline separation from pillars primarily drove the decrease in Dc with increasing Re. In this study, the negative 15° AoA DLD devices showed a better ability to control the particle trajectories and, thus, promise for future applications, because particle shift began at lower Re values when compared to the neutral AoA device. The decrease in Dc at lower Re in the negative 15° AoA device allowed us to observe particle shifting behavior even with the increased pressure caused by the higher viscosities. We believe the data collected can be used to help future investigations of non-Newtonian fluid. From these experiments, improvements to the design or modifications to the methods can be implemented to help further understand particle shifting in non-Newtonian fluids.

Author Contributions

Conceptualization, J.-H.K.; methodology, B.S. and J.-H.K.; formal analysis, B.S. and J.-H.K.; writing—original draft preparation, B.S. and J.-H.K.; writing—review and editing, J.-H.K.; funding acquisition, J.-H.K. All authors have read and agreed to the published version of the manuscript.

Funding

This research was partially supported by the National Science Foundation, CBET-1707056.

Institutional Review Board Statement

Not applicable.

Informed Consent Statement

Not applicable.

Data Availability Statement

Not applicable.

Conflicts of Interest

The authors declare no conflict of interest.

References

  1. Niu, Z.; Zhang, W.; Yu, C.; Zhang, J.; Wen, Y. Recent advances in biological sample preparation methods coupled with chromatography, spectrometry and electrochemistry analysis techniques. TrAC Trends Anal. Chem. 2018, 102, 123–146. [Google Scholar] [CrossRef]
  2. Amini, H.; Lee, W.; Di Carlo, D. Inertial microfluidic physics. Lab A Chip 2014, 14, 2739–2761. [Google Scholar] [CrossRef]
  3. Alexander, D.E. Nature’s Machines: An Introduction to Organismal Biomechanics; Academic Press: Cambridge, MA, USA, 2017. [Google Scholar]
  4. Bhalla, N.; Jolly, P.; Formisano, N.; Estrela, P. Introduction to biosensors. Essays Biochem. 2016, 60, 1–8. [Google Scholar]
  5. Zhang, Y.; Xu, C.; Guo, T.; Hong, L. An automated bacterial concentration and recovery system for pre-enrichment required in rapid escherichia coli detection. Sci. Rep. 2018, 8, 17808. [Google Scholar] [CrossRef] [PubMed]
  6. Zhang, Z.; Henry, E.; Gompper, G.; Fedosov, D.A. Behavior of rigid and deformable particles in deterministic lateral displacement devices with different post shapes. J. Chem. Phys. 2015, 143, 243145. [Google Scholar] [CrossRef] [PubMed] [Green Version]
  7. Dincau, B.M.; Lee, Y.; Kim, J.-H.; Yeo, W.-H. Recent advances in nanoparticle concentration and their application in viral detection using integrated sensors. Sensors 2017, 17, 2316. [Google Scholar] [CrossRef] [Green Version]
  8. Bhagat, A.A.S.; Kuntaegowdanahalli, S.S.; Papautsky, I. Continuous particle separation in spiral microchannels using dean flows and differential migration. Lab A Chip 2008, 8, 1906–1914. [Google Scholar] [CrossRef]
  9. Aran, K.; Fok, A.; Sasso, L.A.; Kamdar, N.; Guan, Y.; Sun, Q.; Ündar, A.; Zahn, J.D. Microfiltration platform for continuous blood plasma protein extraction from whole blood during cardiac surgery. Lab A Chip 2011, 11, 2858–2868. [Google Scholar] [CrossRef] [Green Version]
  10. Yu, Z.T.F.; Aw Yong, K.M.; Fu, J. Microfluidic blood cell sorting: Now and beyond. Small 2014, 10, 1687–1703. [Google Scholar] [CrossRef] [Green Version]
  11. Wilding, P.; Pfahler, J.; Bau, H.H.; Zemel, J.N.; Kricka, L.J. Manipulation and flow of biological fluids in straight channels micromachined in silicon. Clin. Chem. 1994, 40, 43–47. [Google Scholar] [CrossRef]
  12. Weigl, B.H.; Yager, P. Microfluidic diffusion-based separation and detection. Science 1999, 283, 346–347. [Google Scholar] [CrossRef]
  13. Huang, L.R.; Cox, E.C.; Austin, R.H.; Sturm, J.C. Continuous particle separation through deterministic lateral displacement. Science 2004, 304, 987–990. [Google Scholar] [CrossRef] [PubMed]
  14. Inglis, D.W.; Davis, J.A.; Austin, R.H.; Sturm, J.C. Critical particle size for fractionation by deterministic lateral displacement. Lab A Chip 2006, 6, 655–658. [Google Scholar] [CrossRef] [PubMed]
  15. Tottori, N.; Nisisako, T. High-throughput production of satellite-free droplets through a parallelized microfluidic deterministic lateral displacement device. Sens. Actuators B Chem. 2018, 260, 918–926. [Google Scholar] [CrossRef]
  16. Loutherback, K.; Puchalla, J.; Austin, R.H.; Sturm, J.C. Deterministic microfluidic ratchet. Phys. Rev. Lett. 2009, 102, 045301. [Google Scholar] [CrossRef] [Green Version]
  17. Holm, S.H.; Beech, J.P.; Barrett, M.P.; Tegenfeldt, J.O. Simplifying microfluidic separation devices towards field-detection of blood parasites. Anal. Methods 2016, 8, 3291–3300. [Google Scholar] [CrossRef] [Green Version]
  18. Beech, J.P.; Jönsson, P.; Tegenfeldt, J.O. Tipping the balance of deterministic lateral displacement devices using dielectrophoresis. Lab A Chip 2009, 9, 2698–2706. [Google Scholar] [CrossRef] [PubMed]
  19. Devendra, R.; Drazer, G. Gravity driven deterministic lateral displacement for particle separation in microfluidic devices. Anal. Chem. 2012, 84, 10621–10627. [Google Scholar] [CrossRef]
  20. Beech, J.P.; Tegenfeldt, J.O. Tuneable separation in elastomeric microfluidics devices. Lab A Chip 2008, 8, 657–659. [Google Scholar] [CrossRef]
  21. Dincau, B.M.; Aghilinejad, A.; Hammersley, T.; Chen, X.; Kim, J.-H. Deterministic lateral displacement (dld) in the high reynolds number regime: High-throughput and dynamic separation characteristics. Microfluid. Nanofluidics 2018, 22, 59. [Google Scholar] [CrossRef]
  22. Dincau, B.M.; Aghilinejad, A.; Chen, X.; Moon, S.Y.; Kim, J.-H. Vortex-free high-reynolds deterministic lateral displacement (dld) via airfoil pillars. Microfluid. Nanofluidics 2018, 22, 137. [Google Scholar] [CrossRef]
  23. Ahasan, K.; Landry, C.M.; Chen, X.; Kim, J.-H. Effect of angle-of-attacks on deterministic lateral displacement (dld) with symmetric airfoil pillars. Biomed. Microdevices 2020, 22, 42. [Google Scholar] [CrossRef] [PubMed]
  24. Oh, S.; Choi, S. 3d-printed capillary circuits for calibration-free viscosity measurement of newtonian and non-newtonian fluids. Micromachines 2018, 9, 314. [Google Scholar] [CrossRef] [PubMed] [Green Version]
  25. Li, Y.; Zhang, H.; Li, Y.; Li, X.; Wu, J.; Qian, S.; Li, F. Dynamic control of particle separation in deterministic lateral displacement separator with viscoelastic fluids. Sci. Rep. 2018, 8, 3618. [Google Scholar] [CrossRef] [PubMed]
  26. Takamura, K.; Fischer, H.; Morrow, N.R. Physical properties of aqueous glycerol solutions. J. Pet. Sci. Eng. 2012, 98–99, 50–60. [Google Scholar] [CrossRef]
  27. Cheng, N.-S. Formula for the viscosity of a glycerol−water mixture. Ind. Eng. Chem. Res. 2008, 47, 3285–3288. [Google Scholar] [CrossRef]
  28. Segur, J.B.; Oberstar, H.E. Viscosity of glycerol and its aqueous solutions. Ind. Eng.Chem. 1951, 43, 2117–2120. [Google Scholar] [CrossRef]
Figure 1. (a) Design of the airfoil DLD device. Arrows represent particle injection and buffer inlet channels. (b) Close view of airfoil pillar design with two different angles of attack, where L = 90 μm, G = 40 μm, Δ = 8.4 μm. (c) Experimental setup.
Micro 02 00006 g001
Figure 2. Mesh for a neutral airfoil DLD device in COMSOL Multiphysics.
Micro 02 00006 g002
Figure 3. Calculated and measured viscosities.
Micro 02 00006 g003
Figure 4. Flow rate linearity for particle testing with (a) neutral device and (b) negative 15 AoA device. Averaged flow velocity for viscosities of 1.4–1.5 cP (grey), 1.7–1.8 cP (yellow), and 2.1–2.2 cP (blue).
Micro 02 00006 g004
Figure 5. Particle percentage distributions versus outlet number with 20 µm particles in a neutral AoA DLD. Each trend line for (a) DI water with viscosity of 0.98 cP, (b) viscosity of 1.4–1.5 cP, (c) viscosity of 1.7–1.8 cP, and (d) viscosity of 2.1–2.2 cP. (e) Summary of test results for a neutral AoA DLD with 20 µm particles.
Micro 02 00006 g005
Figure 6. Particle percentage distributions versus outlet number with 15 µm particles in a negative 15° AoA DLD. Each trend line for (a) DI water with viscosity of 0.98 cP, (b) viscosity of 1.4–1.5 cP, (c) viscosity of 1.7–1.8 cP, and (d) viscosity of 2.1–2.2 cP. (e) Summary of test results for a negative 15° AoA DLD with 15 µm particles.
Micro 02 00006 g006
Figure 7. Streamline positional data from COMSOL for (a) neutral AoA and (b) negative 15° AoA with circles showing area of interest for streamline separation of Re of 100 (green) 50 (yellow) and 1 (red). Airfoil pillars are plotted in black.
Micro 02 00006 g007
Table 1. The calculated viscosities for Glycerol DI water solution using Equations (1) and (2).
Viscosity (cP)Weight Glycerol (g)Weight Water (g)Temperature (°C)
1.4048.42256.6523.5
1.4148.76255.0023.5
1.4177.21436.0921.0
1.4245.07255.0022.0
1.4549.75262.4821.0
1.7065.00235.2322.8
1.7266.19247.5221.7
1.7378.58271.7323.1
1.7569.87240.1022.8
1.7666.19247.5221.0
1.8072.21243.2122.2
2.10142.50357.5023.5
2.1186.11219.7822.9
2.1587.02213.2523.3
Publisher’s Note: MDPI stays neutral with regard to jurisdictional claims in published maps and institutional affiliations.

