Article

Soft-Microstructured Transparent Electrodes for Photonic-Enhanced Flexible Solar Cells

CENIMAT/I3N, Departamento de Ciência dos Materiais, Faculdade de Ciências e Tecnologia (FCT), Universidade Nova de Lisboa, and CEMOP/UNINOVA, 2829-516 Caparica, Portugal
*
Authors to whom correspondence should be addressed.
Micro 2021, 1(2), 215-227; https://doi.org/10.3390/micro1020016
Submission received: 3 August 2021 / Revised: 22 September 2021 / Accepted: 5 October 2021 / Published: 11 October 2021
(This article belongs to the Section Microscale Materials Science)

Abstract

:
Microstructured transparent conductive oxides (TCOs) have shown great potential as photonic electrodes in photovoltaic (PV) applications, providing both optical and electrical improvements in the solar cells’ performance due to: (1) strong light trapping effects that enhance broadband light absorption in PV material and (2) the reduced sheet resistance of the front illuminated contact. This work developed a method for the fabrication and optimization of wavelength-sized indium zinc oxide (IZO) microstructures, which were soft-patterned on flexible indium tin oxide (ITO)-coated poly(ethylene terephthalate) (PET) substrates via a simple, low-cost, versatile, and highly scalable colloidal lithography process. Using this method, the ITO-coated PET substrates patterned with IZO micro-meshes provided improved transparent electrodes endowed with strong light interaction effects—namely, a pronounced light scattering performance (diffuse transmittance up to ~50%). In addition, the photonic-structured IZO mesh allowed a higher volume of TCO material in the electrode while maintaining the desired transparency, which led to a sheet resistance reduction (by ~30%), thereby providing further electrical benefits due to the improvement of the contact conductance. The results reported herein pave the way for a new class of photonic transparent electrodes endowed with mechanical flexibility that offer strong potential not only as advanced front contacts for thin-film bendable solar cells but also for a much broader range of optoelectronic applications.

1. Introduction

The ubiquitous availability of solar energy is only one factor in the long chain leading to its conversion to usable electricity. Its collection, conversion, and storage still require significant technological improvements in order to fully realize its potential as a fossil fuel replacement [1]. The current photovoltaic (PV) market is thus still dominated by first-generation crystalline silicon solar cells (~95% share), which can achieve a maximum PV conversion efficiency of ~26%, despite their high production and implementation costs [2,3,4]. Second-generation devices based on thin-film solar cells (TFSCs) have emerged due to the necessity of lowering production costs, reducing material expenditure, and increasing mechanical flexibility, therefore enabling a much wider range of applications. Nevertheless, due to their reduced thickness, TFSCs suffer from major absorption losses, especially when compared with thicker wafer-based cells [5,6]. Therefore, the efficiencies attained by TFSC technologies (~15%) tend to be much more modest than those of bulk wafer-based devices [7]. As such, effective light trapping (LT) techniques offer great improvement potential for flexible TFSCs as a means to make the cells optically thicker while reducing their physical thickness and enabling mechanical bending.
Several LT schemes have been shown to improve the performance of different types of TFSCs, such as disordered [8,9] and ordered arrays [10] of micro-pyramidal features, photonic jets [11], corrugated substrates, and self-cleaning micro-cone structures [12]. It has also been observed that simple grating (wave-optical) structures in the front [13,14] and back electrodes [15] enable enhancements not only in light absorption but also in the stability of emergent TFSC technologies, such as perovskite solar cells (PSCs) [16]. Other non-LT optical approaches have also been attempted, such as down and/or upconversion [13,15,16,17].
Wavelength-sized photonic structures with high refractive indexes have recently been shown to allow the highest-efficiency improvements in TFSCs by reducing reflection in a broad spectral range via geometric index matching and increasing absorption in TFSCs via light scattering and coupling to waveguided modes confined in the periodic cells’ structure [10,18,19,20,21].
Among the nano/micro-patterning strategies capable of fabricating these LT structures, nano-imprint lithography (NIL) and colloidal lithography (CL) have sparked the highest research interest for PV applications [22,23,24,25]. However, NIL is limited in terms of the materials that can be structured, and presents difficulties concerning scalability due to its poor pattern fidelity over large areas. On the other hand, CL is an easily scalable, high-throughput, and low-cost technique that allows nanoscopic precision in an arbitrarily large area [5,26,27]. A lithographic mask can be promptly achieved via CL, whose pattern resolution is entirely dependent on the colloidal size that can be deposited in high-quality monolayer arrays. The best achieved resolutions in the literature ranges between 50 nm and 200 nm, which is comparable to that of state-of-the-art conventional-lithography systems [23,28]. Moreover, the fabricated structures can be produced with a high accuracy on a large scale, as the method is not limited in terms of the deposition area, meaning that it offers the possibility to be adapted to mass production techniques such as roll-to-roll. CL can also be used with a large range of materials, such as dense dielectrics or metal oxide materials with a high refractive index (appropriate for photonic applications) [29]. Moreover, it uses low-temperature steps (<100 °C), making it ideal for usage with temperature-sensitive materials (e.g., polymeric-based flexible substrates); thus, it tolerates a wide range of materials and surface chemistries [30].
The photonic structures fabricated by this versatile soft-lithography CL method can be implemented in PV devices in a straightforward manner, demonstrating pronounced performance improvements [25,31,32]. Moreover, metallic micro-meshed electrodes can also be obtained by CL, which is currently considered one of the most promising approaches for producing industrially compatible transparent conducting materials with excellent optical transmittance and electrical conductance [23,33,34].
As such, we employed CL as the micro-patterning method in this work to produce photonic-structured TCO layers, since it can easily fabricate honeycomb arrays of metal-oxide-based micro-features with semi-spheroidal geometries (either dome or void-like), in accordance with the optimized LT designs presented in previous theoretical studies [10,16].
The effectiveness of the light management of photonic structures depends chiefly on the geometry and material of the patterned features [6,16,20]. Recently, promising results [31] were obtained with LT structures made of indium zinc oxide (IZO) deposited directly on amorphous silicon (a:Si:H) TFSCs, leading to pronounced increases in photocurrent (by 21.4–23.1%) and efficiency (by 18.2–26.7%) [32]. Here, besides the LT effects causing higher broadband absorption, the photonic-structured IZO allowed a higher TCO volume relative to that in planar (non-structured) TFSCs, thus providing further electrical improvements (due to the reduced sheet resistance of the front contact) that contributed to such efficiency gains. Nevertheless, all these benefits have only been shown with photonic-structured TCOs patterned as a post-process on solar cells with a substrate-type layer configuration, while most TF PV technologies work best in a superstrate configuration supported on transparent (and potentially flexible) substrates.
This work defines the first main step for the development of advanced light management in superstrate-like TFSC configurations, as illustrated in Figure 1 (left, schematic of a superstrate device; right, optical effect of the micro-structuring). Namely, photonic-structured TCOs on bendable poly(ethylene terephthalate) (PET) substrates are developed for flexible superstrate TFSCs, in particular PSCs, following a LT design that was previously theoretically designed by the authors [35].
The fabricated photonic flexible structures showed a pronounced increase in diffuse transmittance (up to ~50%) due to the strong light in-coupling and scattering from the structured surface. This increase in scattered light directly correlates with path length enhancement and, consequently, with increased device absorption. Furthermore, the increased volume of the electrical contact also provides a conducive medium for easier charge collection, shown here by a ~30% decrease in sheet resistance.
It should also be noted that these structures benefit from a better practical compatibility—for instance, with PSC technology—compared to previous LT architectures shown in the literature that require the post-processing of the PV devices [10,16,20]. This is because, in the present approach, the PSC layers can be uniformly wet-coated by state-of-the-art methods onto substrates previously micro-patterned with the designed LT structure, thus avoiding the exposure of the sensitive solar cell materials to the required micro-structuring steps.
Lastly, even though they were not experimentally assessed in this work, the LT-structured electrodes developed on PET are expected to present considerable bending robustness, as evidenced by related studies [34] of metallic mesh electrodes CL-patterned onto PET substrates, which show pronounced mechanical flexibility (exhibiting only a marginal ~5% increase in sheet resistance after 150 bending cycles on a 0.5 inch curvature).

2. Materials and Methods

2.1. Substrate Preparation

ITO-coated PET substrates with 2.5 cm × 2.5 cm × 0.0175 cm dimensions, purchased from KINTEC COMPANY, were used as supports for the photonic microstructures. The substrates were washed with a micro cleaning solution (Micro-90), which is a chelating solution of detergent containing ethylenediaminetetraacetic acid (EDTA) salt, and ionic and non-ionic ingredients. Then, they were sonicated for 10 min in isopropanol and rinsed again with deionized water. Finally, the substrates were dried under a nitrogen flow.

2.2. Deposition of PS Colloidal Monolayer

Polystyrene (PS) colloidal spheres dispersed in aqueous solution at a 2.5% weight were purchased from Microparticles GmbH and Micromod Partikeltechonologie GmbH, with diameters of 1.3 µm and 2.0 µm. They were first dispersed in a mixture of the aqueous solution and diacetone (1:3), and this colloidal suspension was used to deposit an hexagonal close-packed monolayer of PS microspheres via a Langmuir–Blodgett (LB) wet coating [6,36] employing a Biolin Scientific KSV NIMA. The deposition steps consisted of dropping 800 mL of the prepared colloidal suspension onto the interface between water and air. The barriers of the LB system were then closed at a controlled speed of 10 mm/min, leading the floating PS spheres to self-assemble in an ordered close-packed hexagonal array at the water surface. Subsequently, this monolayer was transferred to the surface of the ITO-coated PET substrates by vertically withdrawing the previously immersed substrate at a speed of 2 mm/min.

2.3. Shaping of Colloidal Mask

The size and shape of the PS spheres will determine the geometry of the resulting surface structure. Since the colloids were deposited by LB in a close-packed array, it is necessary to controllably increase their inter spaces to create non-close-packed monolayers. This was achieved by partially etching the particles via reactive ion etching (RIE), which decreases the particles’ size and, therefore, increases their spacing. This RIE process was performed with oxygen (O2) gas in a dry-etching system using the conditions given in the first line of Table 1.

2.4. IZO Deposition

Indium zinc oxide (IZO) films with thicknesses of 175, 250, 325, and 500 nm were deposited by radio frequency (RF) magnetron sputtering using an In2O3/ZnO target (99.99% purity, 3′′ diameter) in a mixture of oxygen and argon at partial pressures of 10−5 and 1.5 × 10⁻³ mbar for 70, 100, 130, and 200 min, respectively. The RF power applied was 50 W and it yielded a deposition rate of 2.5 nm/min. A pre-sputtering process that took 15 min was performed before deposition to clean the target.

2.5. Lift-Off of Colloidal Mask

The last step of the CL fabrication process consisted of removing the PS particles by the sonication of the samples in a toluene bath for 30 min. Before that, an Ar/CF4 RIE process (see Table 1) was performed to remove the top covering layer of the deposited IZO over the PS particles, promoting the subsequent dissolution of the PS particles in the toluene bath.

2.6. Characterization

The morphological characterization of the fabricated structures was performed by Scanning Electron Microscopy (SEM) using a TM3030 Plus (HITACHI, Tokyo, Japan) tabletop microscope as well as a CARL ZEISS AURIGA Cross Beam SEM workstation. The surface morphology of the samples was also determined by Atomic Force Microscopy (AFM), with an Asylum MFP3D being employed mainly to analyze the height and size of the IZO structures.
Optical measurements were performed with a UV-Visible-NIR scanning spectrophotometer (PERKIN ELMER lambda 950, Shelton, CT, USA) using a 15 cm-diameter integrating sphere to obtain the total reflectance (RT) and transmittance (total, TT, and diffuse, TD) spectra of the samples. The total absorption (AT) was calculated using the following expression: AT (%) = 100% − TT (%) − RT (%). The measured spectra were also used to confirm the thickness of the layers by fitting the results with the analytical Scattering Matrix Method, which calculates the TT and RT for an arbitrary number of stacked layers.
The surface electrical properties were determined by measuring the sheet resistance and conductivity of the samples with a Jandel 4-Point Probe system.

3. Results and Discussion

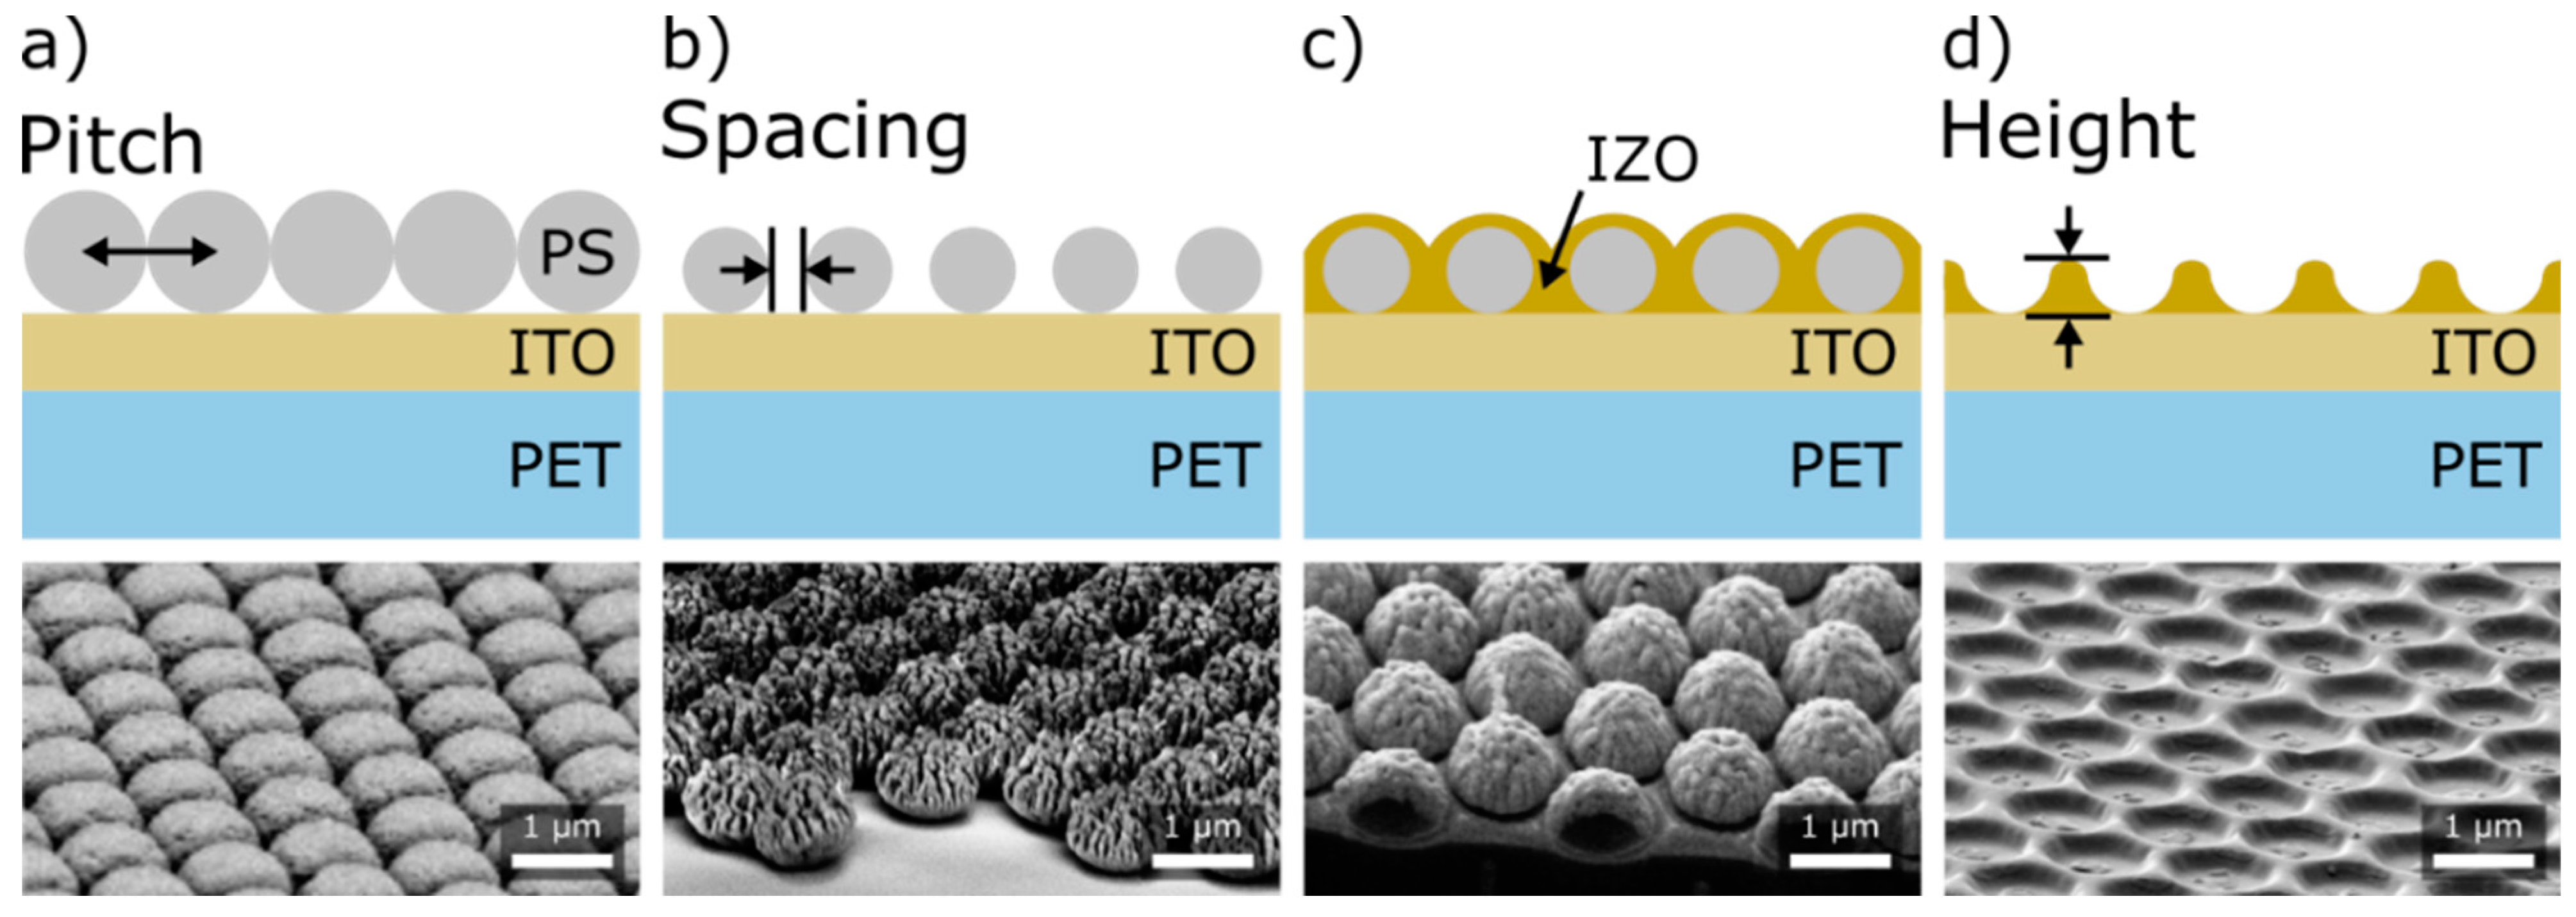
The four main fabrication steps of the colloidal lithography (CL) method are shown in Figure 2, with the respective SEM images given to visually show the structures at each step. The optimization of this process was performed with the IZO microstructures deposited on commercial ITO-coated PET substrates (see experimental methods), varying the main geometrical parameters as indicated in Figure 2.
The CL process consists of the deposition of a close-packed honeycomb monolayer of PS micro-spheres, via the Langmuir–Blodgett (LB) process, on the ITO-coated PET substrate (Figure 2a). These are then subjected to O2 reactive-ion etching (RIE) to reduce their size [37,38,39], thus obtaining a spaced (non-close-packed) monolayer of PS spheres (Figure 2b) that is subsequently used as a mask for the infiltration of IZO, deposited via RF magnetron sputtering (Figure 2c), leaving the colloids surrounded by the IZO material. Subsequently, two subprocesses are then required to remove the PS colloids. Firstly, a second RIE using Ar/CF4 as a reactive gas (Table 1) is used to remove part of the IZO film deposited on top of the colloids. This is performed to facilitate the penetration of the solvent, which dissolves the PS particles in the subsequent step. Secondly, the dissolution of the colloidal particles, which is performed by submersion in toluene, proceeds with sonication for 30 min. Finally, when the colloids are removed and the final structure, which is essentially composed of the IZO material that had been deposited in the inter-space of the colloidal array, is exposed (Figure 2d).
As indicated in Figure 2 and Table 2, we studied three key parameters: pitch (i.e., the microstructures’ center-to-center distance), linewidth (i.e., the spacing between the masking colloids), and IZO height/thickness. The pitch was given by the diameter of the PS spheres used in the LB deposition (D, either 1.3 μm or 2.0 μm); the IZO mesh linewidth was determined by the spacing between colloids, which was tuned by varying the first RIE exposure time (tRIE) from 0 to 450 s; and the IZO thickness (h, varied from 0 nm to 500 nm) was determined by the sputtering time.
Figure 3 shows top-view SEM images of the colloidal masks (left side) and the final microstructures obtained (right side) for the different O2 RIE times. As seen in Figure 3(a1,a2), for both colloidal sizes employed in this work the PS spheres were well deposited, forming the desired close-packed honeycomb structure throughout the entire sample area. Figure 3b–f corresponds to O2 RIE engravings with a duration of 90–450 s. The shorter plasma exposure times lead to only a small reduction in the spheres’ size and, consequently, a thinner linewidth of the resulting IZO mesh, while longer etching times lead to a stronger particle reduction (i.e., larger inter-particle separation), promoting higher IZO infiltration. However, care must be taken to avoid prolonging the O2 etching time too much (in this case above ~500 s), because if there is an excessive reduction in the particles’ size they will be strongly deformed, making them unsuitable for use as masks in the CL patterning, as also observed in previous contributions from the authors [6,23,31].
The surface morphology of the microstructures was also studied using AFM, mainly to verify the vertical profile (height) of the final mesh, which was set by the IZO sputtering time. As an example, Figure 4 presents the AFM morphology of two representative IZO microstructures, one with 1.3 µm initial PS spheres, 450 s of O2 RIE, and 130 min of IZO sputtering (Figure 4a), and the second with 2.0 µm initial PS spheres, 270 s of O2 RIE, and 100 min of IZO sputtering (Figure 4b). As observed here, and in more detail in Figure S1 in the Supplementary Material, the resulting average height of the IZO features remains below the equivalent IZO film thickness (h). This was determined according to the IZO sputtering time, mainly as a consequence of the final lift-off step (Figure 2c,d), which inevitably removes a small portion of the IZO material infiltrating the colloids. In addition to the information concerning the height of the resulting mesh features, the AFM results revealed the presence of undesirable PS residues in the mesh voids, which is assumed to be the result of the shorter-than-required lift-off time. Due to the small amount of these residues, they do not significantly affect the optoelectronic properties of the samples, and therefore their impact in the results discussed here is negligible. Nevertheless, they can be easily eliminated by adding an extra dry-etching or annealing (~100 °C) step to the process.
The optical behavior of the final IZO micro-mesh on the ITO-coated PET substrates was studied for each patterned substrate obtained for the different sets of fabrication conditions listed in Table 2. The control of these morphological parameters is crucial because they determine the anti-reflection and light scattering performance of the final structured material, as shown in Figure 5 and Figure 6 (see also Sections S2 and S3 of the Supplementary Material with the absorbance and transmittance spectra of all the samples analyzed in this work).
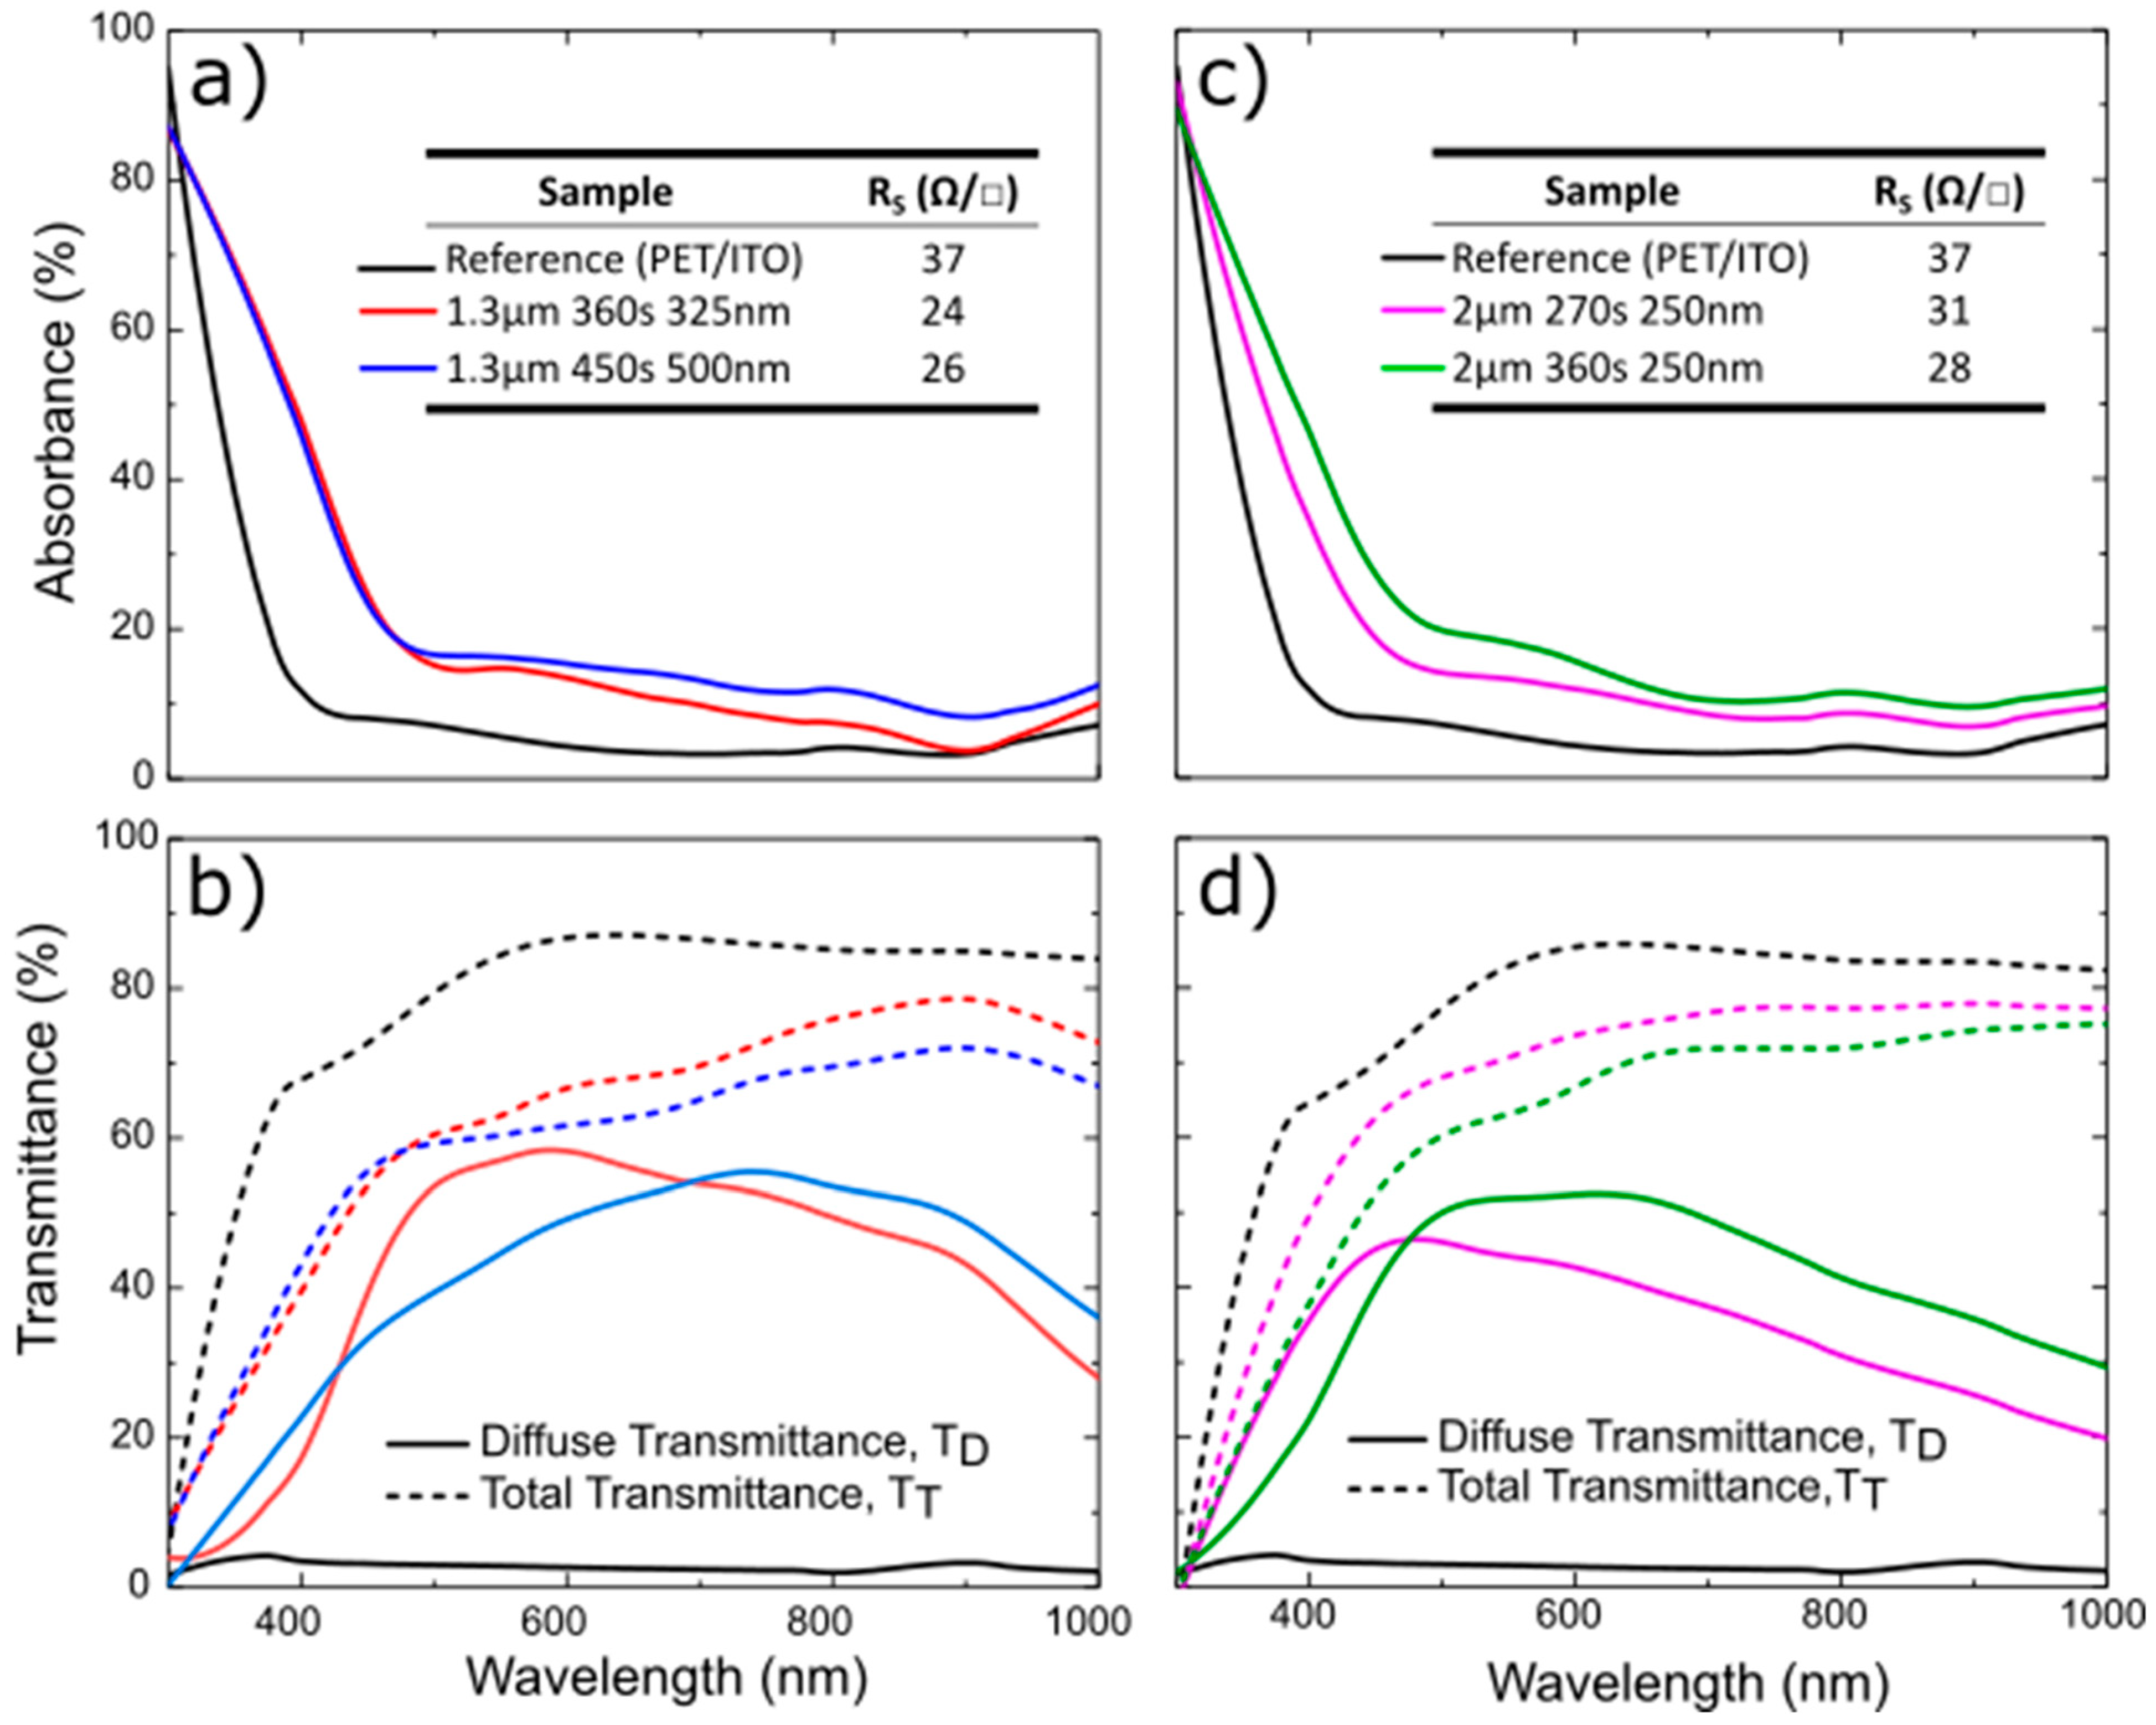
Figure 5 shows the optical absorbance and diffuse transmittance spectra of selected substrates with and without the IZO microstructures on the ITO-coated PET. These quantities indicate, respectively, the parasitic optical losses and light scattering performances of the samples in view of their application as photonic front electrodes providing light trapping in solar cells patterned uniformly on IZO mesh (as illustrated in Figure 1). The low optical absorbance over the visible spectral range ensures that almost all sunlight can cross to the PV active layer, while light scattering will increase the absorption path in this active layer, leading to a higher probability of photon absorption.
As expected, the unstructured reference (ITO-coated PET substrate) without the IZO mesh exhibited the lowest optical absorption (<10%) over the visible–NIR band (400–1000 nm), whereas the light absorption over the same band of the substrates with the IZO microstructures reached values about 10% higher. On the other hand, the diffuse transmittance was almost negligible for the planar reference, while values between ~35% and ~50% on average were obtained for the microstructured samples, revealing the strong scattering capabilities desired for light trapping in thin-film PV.
Among the photonic-structured samples shown in Figure 5, those fabricated with shorter O2 RIE times (D = 1.3 μm, tRIE = 360 s, and D = 2.0 μm, tRIE = 270 s) scatter better in the blue to green range (400 nm to 500 nm) than the samples fabricated with longer O2 RIE times (D = 1.3 μm, tRIE = 450 s, and D = 2.0 μm, tRIE = 360 s), which scatter better in the red to NIR range (600 nm to 1000 nm). In other words, there is a red-shift of the diffuse transmittance peaks for thicker mesh linewidths (attained with a longer RIE), as would be expected in accordance with electromagnetic studies investigating light trapping in different types of thin-film PV devices [10,16,35]. Comparing the optical performance of the samples obtained with different initial PS sphere sizes, it can be seen that the 1.3 μm spheres lead to higher broadband scattering than the 2.0 μm spheres, which is also in accordance with the results of the same computational studies that target sizes close to the micrometer as the optimal ones.
The amount of scattering achieved due to the structured IZO, as evaluated by the diffuse transmittance, will directly translate into photocurrent gains attainable by TFSCs patterned on top (relative to planar cells coated on the reference ITO/PET substrates). Therefore, the diffusive transmittance spectra exhibited by the structures are the first indicator of an initial optical screening of the photonic substrates. However, such scattering effects can only lead to photocurrent gains for the weakly absorbed wavelengths (typically above ~550 nm for TFSCs), whose optical path length within the PV absorber exceeds the absorber thickness. In the more easily absorbed shorter wavelength range (below ~550 nm), the amount of light scattering (i.e., diffuse transmittance) taking place does not lead to photocurrent enhancement with respect to planar reference cells. Therefore, what mainly matters in this shorter range is the high anti-reflection and weak parasitic absorption of the structures—namely, the light in-coupling evaluated by the measured total transmittance, which is also represented in Figure 5b,d. As can be seen, the reference sample exhibits an average total transmittance of 81% in the 400–1000 nm range, while values close to 73% on average are obtained for the microstructured samples due to the higher parasitic absorption occurring in the extra IZO material.
Figure 5a,c also show in the inset the corresponding sheet resistance (RS) results of these transparent electrodes. The presence of the highly conductive IZO material over the flat ITO layer reinforces the conductance of the overall structure (see Figure 1). As expected, the higher the volume of IZO present in the final mesh is, the more the RS is reduced, and this is mainly controlled by the O2 RIE time (determining the mesh linewidth) and IZO thickness (setting the mesh height). Therefore, besides optical gains, another beneficial side effect of the implementation of the IZO microstructures is a significant reduction in the sheet resistance of the transparent electrode, which will have a direct impact on the reduction in the series resistance and the improvement of the fill factor of the SCs integrating the proposed photonic front contacts.
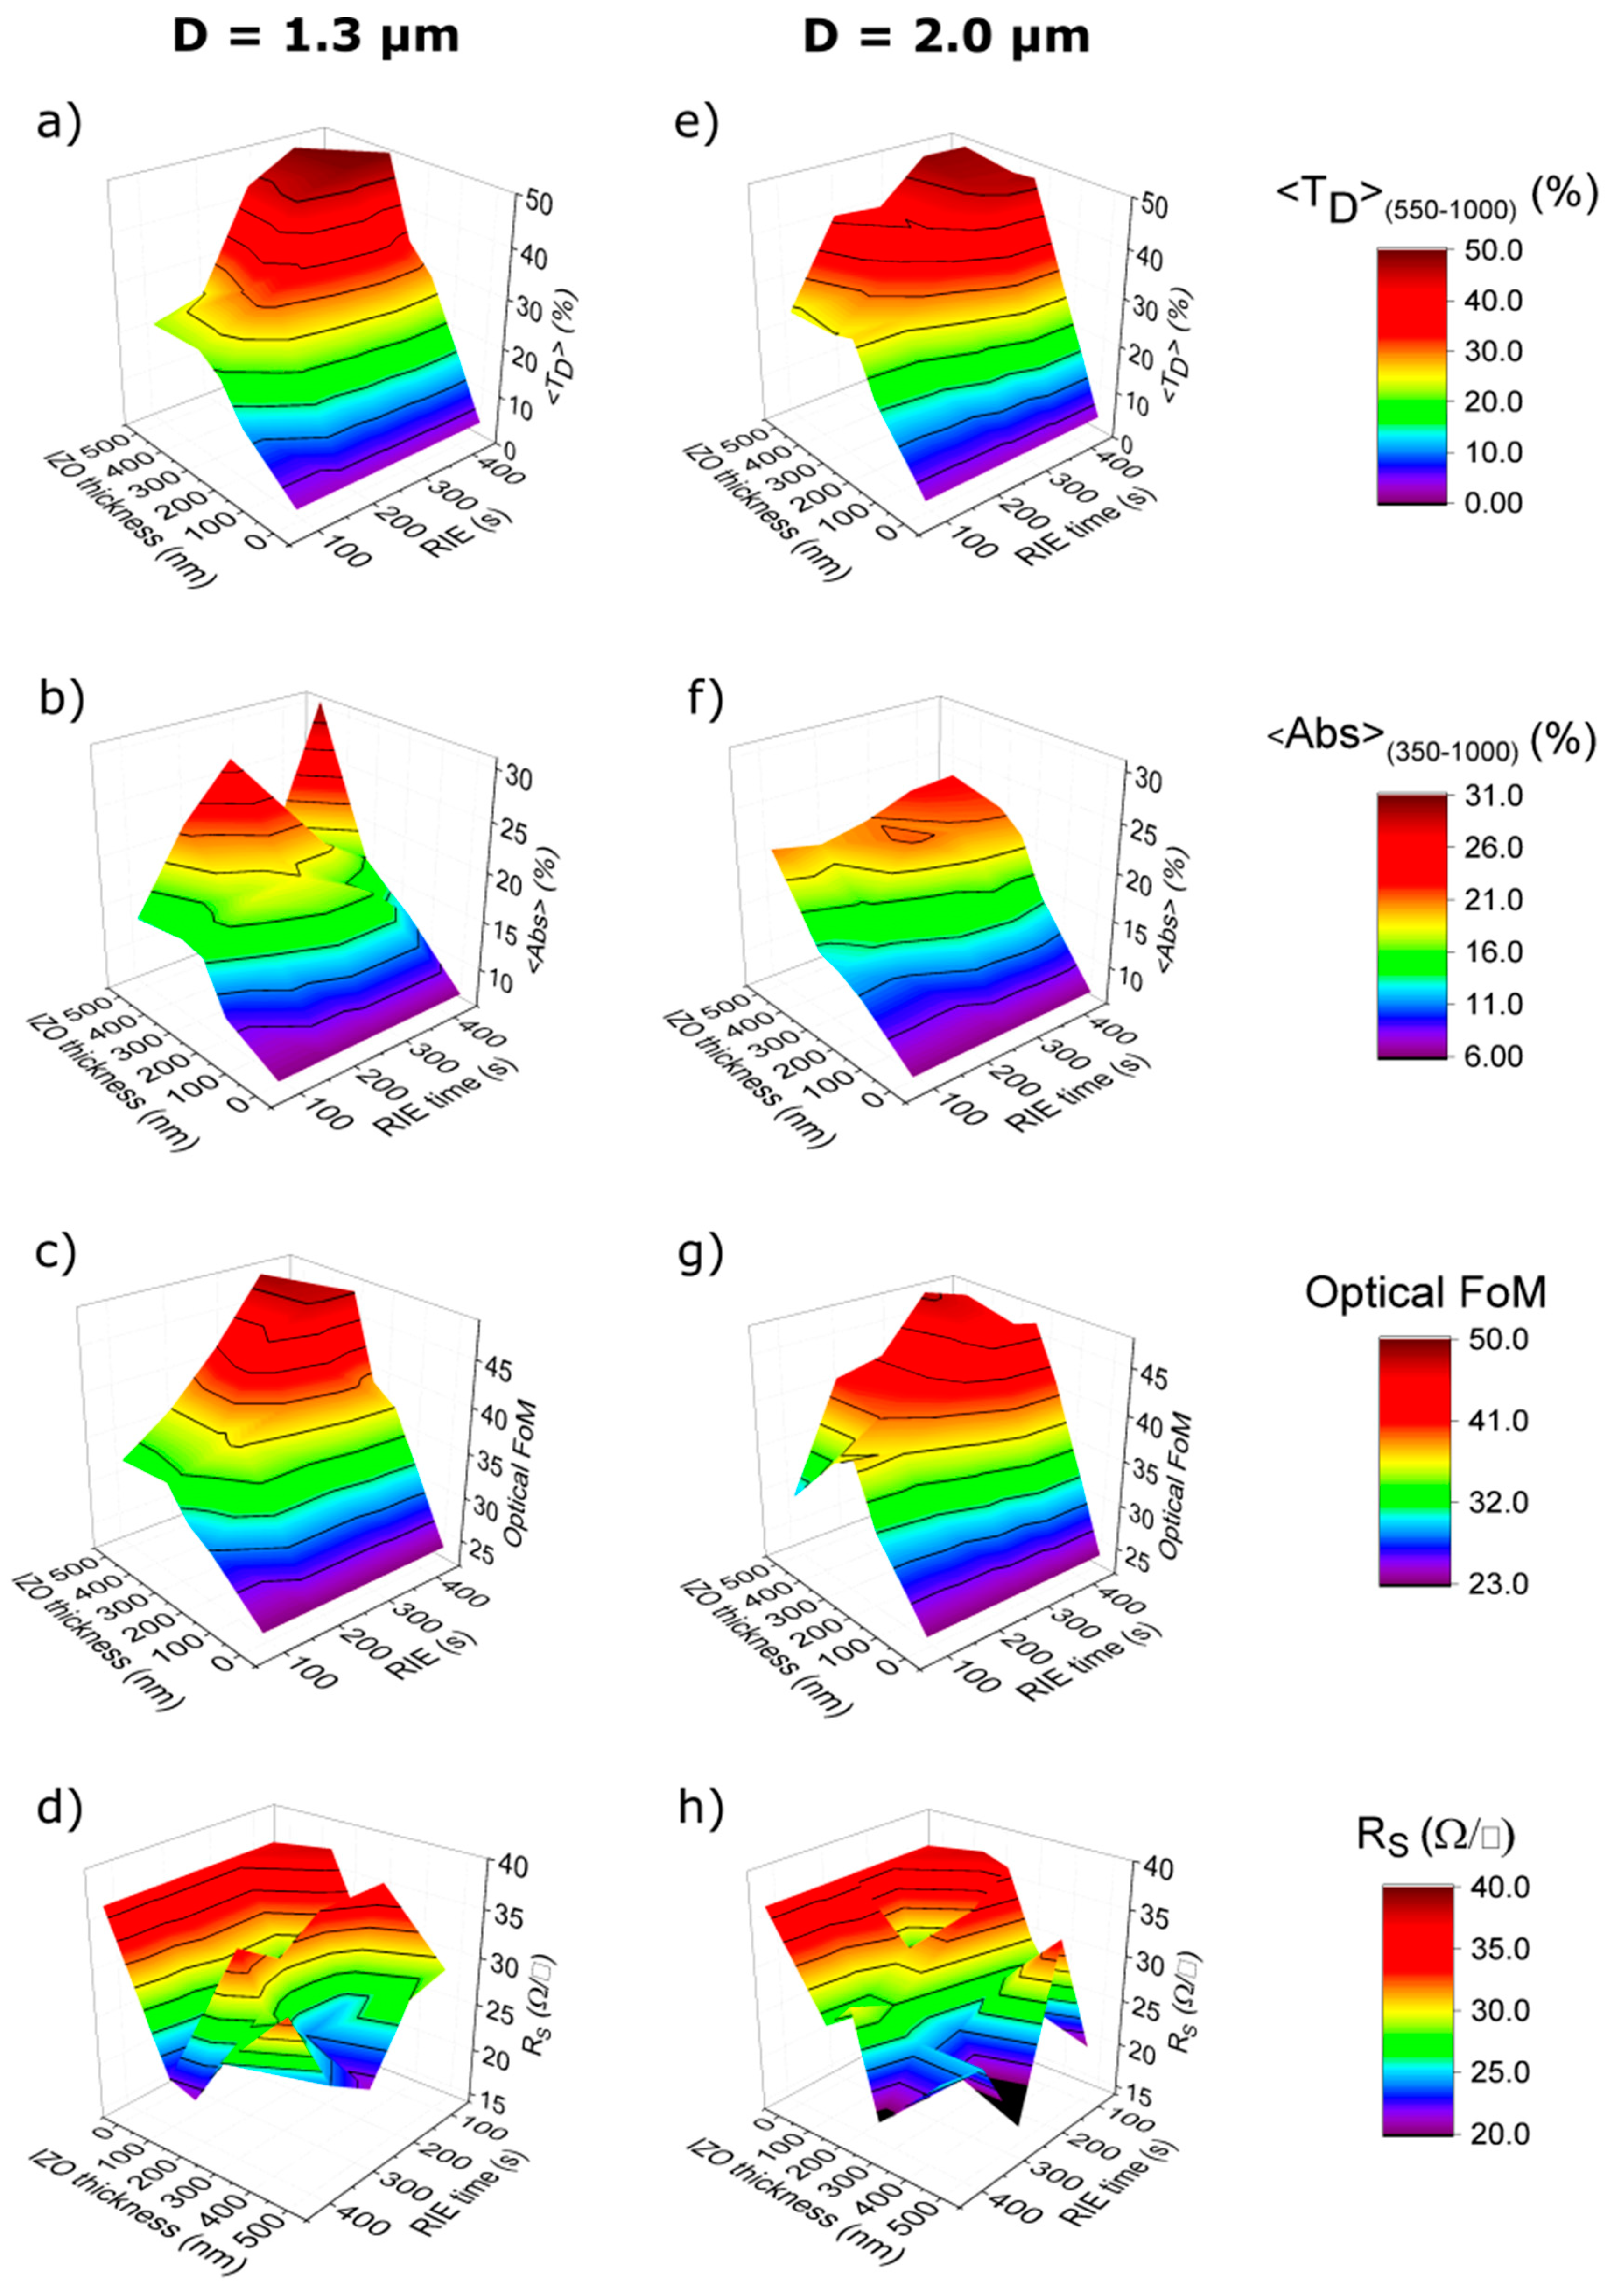
Figure 6 compiles the main optical and electrical quantities to evaluate the performance of all the samples analyzed in this study, fabricated with the parameters listed in Table 2, in view of their application as photonic transparent electrodes.
It can be seen in Figure 6a that longer O2 RIE times and higher IZO thicknesses result in a higher diffuse transmittance (reaching ~50% on spectral average), and, consequently, a stronger light scattering. Generally, in this regime the larger the dimensions of the patterned IZO structures are (i.e., mesh linewidth and height), the stronger their scattering effects will be and the higher their parasitic absorption will be (as presented in Figure 6b).
Here, there are two main factors contributing to the absorption losses. First, the use of a more patterned material will inevitably lead to more absorption taking place. Second, the beneficial scattering effect of the structures, increasing the diffuse transmittance, also leads to a small increase in parasitic absorption from the longer travel path of light within the structures. These two quantities (parasitic absorption and diffuse transmittance) have opposite contributions to the LT performance of these structures. In this, it is paramount to find the ideal trade-off where the increase in scattering is not overshadowed by the increase in parasitic losses. The best balance can be assessed by an optical figure of merit (FoM, Equation (1)), which allows a preliminary screening of the structures, in order to perform a first-order evaluation of the preferential fabrication parameters:
FoM = 350   nm 550   nm T T · d λ + 550   nm 1000   nm T D · d λ Δ λ
where TT is the total transmittance, TD is the diffuse transmittance, and ∆λ (1000 − 350 nm = 650 nm) is the full wavelength interval. The defined FoM (as shown in Figure 6c) can be understood as an effective averaged transmittance that has a direct correlation with the expected photocurrent gains induced in the solar cells; these are mainly given by TT in the shorter (<550 nm) wavelength range and TD in the longer spectral range, as previously discussed. Note that the amount of parasitic absorption that takes place is also intrinsically considered in this FoM definition, since the higher the absorption is the lower the transmittance will be.
The slight increase in parasitic absorption, from the presence of the IZO structures, is largely compensated for by the boosted diffused transmittance, leading to an overall increase in the FoM with the O2 RIE time and IZO thickness.
As can clearly be seen in the plots of Figure 6, there is a steeper increase in the scattering capability with the dimensions (height and linewidth) of the IZO mesh, while the absorption values increase more modestly (mainly with a higher IZO height from 175 nm to 500 nm). Therefore, the optical FoM ends up improving with the increase in the IZO features’ dimensions.
The same can be said for the electrical performance of the electrodes, since RS tends to decrease with a higher volume of IZO (see Figure 6d,h and Section S4 in the Supplementary Material), as expected. Besides the general decrease in RS with the IZO thickness, we can observe for the two sphere sizes that longer O2 RIE times also lead to a lower RS of the photonic structures, which is due to the formation of smaller IZO voids, meaning that a greater IZO mesh area is available for electrical conduction.

4. Conclusions

A colloidal lithography (CL) technique was successfully developed to create photonic transparent electrodes, which are highly attractive for the front contact of any class of thin-film solar cell with a superstrate architecture or for other types of optoelectronic devices where maximum light absorption is desired.
The properties of the front contact structures depend on three main CL parameters: the initial polystyrene (PS) sphere diameter, the duration of the O2 RIE shaping the colloidal mask, and the deposited IZO thickness. In general, longer O2 RIE times and thicker IZO deposits lead to IZO meshes with wider and taller lines, respectively, which scatter light more effectively than smaller IZO features. The best performing IZO microstructure was developed with an initial PS sphere size with a 1.3 µm diameter, ~450 s O2 RIE time, and 375 nm IZO deposit. This structure exhibits a considerably lower sheet resistance of 26 Ω/□ than that of the reference ITO-coated PET (37 Ω/□), with a remarkable average diffuse transmittance (~50%, calculated in the 550–1000 nm wavelength range) and low average parasitic absorbance (~20%) in comparison with the planar reference substrates (flat ITO on PET substrate). The best performing IZO structure was optimized with an initial 2.0 µm diameter sphere, ~250 nm IZO thickness, and 360 s O2 RIE time presented a sheet resistance of 28 Ω/□ with improved average diffuse transmittance (~45%, in the 550–1000 nm wavelength range) and a low average absorbance (~14%) compared to the planar reference substrate.
The transparent LT-enabling electrodes developed in this work offer particularly high potential for flexible perovskite PV devices, as the LT scheme can be integrated as a pre-process in their standard superstrate architecture without degrading the sensitive materials composing these cells.

Supplementary Materials

The following are available online at https://www.mdpi.com/article/10.3390/micro1020016/s1: Section S1: AFM results; Section S2: absorption spectra; Section S3: diffuse and total transmittance spectra; Section S4: sheet resistance; Figure S1: Top-view analysis of the 3D AFM images; Figure S2: Absorbance spectra of the samples analysed in this work with different fabrication parameters of the CL process; Figure S3: Diffuse and total transmittance of samples analysed in this work with different fabrication parameters of the CL process; Table S1: The tables compare the values of the sheet resistance.

Author Contributions

Conceptualization, M.J.M.; Formal analysis, E.F. and R.M.; Funding acquisition, E.F., R.M. and H.Á.; Investigation, J.L.N.B., P.C., A.M., M.A. and T.C.; Methodology, H.Á.; Project administration, R.M.; Supervision, M.J.M. and H.Á.; Validation, E.F., R.M. and H.Á.; Writing—original draft, J.L.N.B.; Writing—review and editing, M.J.M. and H.Á. All authors have read and agreed to the published version of the manuscript.

Funding

This work received funding from the European Union’s Horizon 2020 research and innovation program under the projects APOLO (H2020-LCE-2017-RES-RIA), grant agreement n° 763989 and Synergy (H2020-Widespread-2020-5, CSA), proposal no. 952169. The work was also funded by FCT (Fundação para a Ciência e Tecnologia, I.P.) under the projects UIDB/50025/2020, SuperSolar (PTDC/NAN-OPT/28430/2017), TACIT (PTDC/NAN-OPT/28837/2017) and LocalEnergy (PTDC/EAM-PEC/29905/2017). M. Alexandre and P. Centeno acknowledge funding by FCT-MCTES through the grants SFRH/BD/148078/2019 and DFA/BD/7882/2020, respectively.

Institutional Review Board Statement

Not applicable.

Informed Consent Statement

Not applicable.

Data Availability Statement

Not applicable.

Acknowledgments

This publication reflects only the author’s views, and the European Union is not liable for any use that may be made of the information contained therein.

Conflicts of Interest

The authors declare no conflict of interest.

References

  1. Ashok, S. Solar Energy. Available online: https://www.britannica.com/science/solar-energy (accessed on 20 December 2020).
  2. Svarc, J. Most Efficient Solar Panels. 2021. Available online: https://www.cleanenergyreviews.info/blog/most-efficient-solar-panels (accessed on 10 March 2021).
  3. Solar Energy Technologies Office. Solar Photovoltaic Cell Basics. Available online: https://www.energy.gov/eere/solar/solar-photovoltaic-cell-basics (accessed on 5 January 2021).
  4. Ding, Y.; Chen, P.; Fan, Q.H.; Hou, G. Photonic structures for light trapping in thin film silicon solar cells: Design and experiment. Coatings 2017, 7, 236. [Google Scholar] [CrossRef] [Green Version]
  5. Karg, M.; König, T.A.F.; Retsch, M.; Stelling, C.; Reichstein, P.M.; Honold, T.; Thelakkat, M.; Fery, A. Colloidal self-assembly concepts for light management in photovoltaics. Mater. Today 2014, 18, 185–205. [Google Scholar] [CrossRef] [Green Version]
  6. Sanchez-Sobrado, O.; Mendes, M.J.; Haque, S.; Mateus, T.; Araujo, A.; Aguas, H.; Fortunato, E.; Martins, R. Colloidal-lithographed TiO2 photonic nanostructures for solar cell light trapping. J. Mater. Chem. C 2017, 5, 6852–6861. [Google Scholar] [CrossRef]
  7. Mendes, M.J.; Sanchez-Sobrado, O.; Haque, S.; Mateus, T.; Águas, H.; Fortunato, E.; Martins, R. Wave-optical front structures on silicon and perovskite thin-film solar cells. In Solar Cells and Light Management; Elsevier: Amsterdam, The Netherlands, 2020; pp. 315–354. [Google Scholar]
  8. Thangavel, N.R.; Adhyaksa, G.W.P.; Dewi, H.A.; Tjahjana, L.; Bruno, A.; Birowosuto, M.D.; Wang, H.; Mathews, N.; Mhaisalkar, S. Disordered polymer antireflective coating for improved perovskite photovoltaics. ACS Photonics 2020, 7, 1971–1977. [Google Scholar] [CrossRef]
  9. Dudem, B.; Heo, J.H.; Leem, J.W.; Yu, J.S.; Im, S.H. CH3NH3PbI3planar perovskite solar cells with antireflection and self-cleaning function layers. J. Mater. Chem. A 2016, 4, 7573–7579. [Google Scholar] [CrossRef]
  10. Mendes, M.J.; Haque, S.; Sanchez-Sobrado, O.; Araújo, A.; Águas, H.; Fortunato, E.; Martins, R. Optimal-enhanced solar cell ultra-thinning with broadband nanophotonic light capture. iScience 2018, 3, 238–254. [Google Scholar] [CrossRef]
  11. Heifetz, A.; Kong, S.-C.; Sahakian, A.V.; Taflove, A.; Backman, V. Photonic Nanojets. J. Comput. Theor. Nanosci. 2009, 6, 1979–1992. [Google Scholar] [CrossRef] [PubMed]
  12. Centeno, P.; Alexandre, M.; Chapa, M.; Pinto, J.V.; Deuermeier, J.; Mateus, T.; Fortunato, E.; Martins, R.; Águas, H.; Mendes, M.J. Self-cleaned photonic-enhanced solar cells with nanostructured Parylene-C. Adv. Mater. Interfaces 2020, 7, 2000264. [Google Scholar] [CrossRef]
  13. Wang, Y.; Wang, P.; Zhou, X.; Li, C.; Li, H.; Hu, X.; Li, F.; Liu, X.; Li, M.; Song, Y. Diffraction-grated perovskite induced highly efficient solar cells through nanophotonic light trapping. Adv. Energy Mater. 2018, 8, 1702960. [Google Scholar] [CrossRef]
  14. Li, K.; Haque, S.; Martins, A.; Fortunato, E.; Martins, R.; Mendes, M.J.; Schuster, C. Simple, yet mighty, principles to maximise photon absorption in thin media. Optica 2020, 7, 1377–1384. [Google Scholar] [CrossRef]
  15. Deng, K.; Liu, Z.; Wang, M.; Li, L. Nanoimprinted grating-embedded perovskite solar cells with improved light management. Adv. Funct. Mater. 2019, 29, 1900830. [Google Scholar] [CrossRef]
  16. Haque, S.; Mendes, M.J.; Sanchez-Sobrado, O.; Águas, H.; Fortunato, E.; Martins, R. Photonic-structured TiO2 for high-efficiency, flexible and stable Perovskite solar cells. Nano Energy 2019, 59, 91–101. [Google Scholar] [CrossRef]
  17. Alexandre, M.; Chapa, M.; Haque, S.; Mendes, M.J.; Águas, H.; Fortunato, E.; Martins, R. Optimum luminescent down-shifting properties for high efficiency and stable perovskite solar cells. ACS Appl. Energy Mater. 2019, 2, 2930–2938. [Google Scholar] [CrossRef]
  18. Brongersma, M.L.; Cui, Y.; Fan, S. Light management for photovoltaics using high-index nanostructures. Nat. Mater. 2014, 13, 451–460. [Google Scholar] [CrossRef] [PubMed]
  19. Garnett, E.C.; Ehrler, B.; Polman, A.; Alarcon-Llado, E. Photonics for photovoltaics: Advances and opportunities. ACS Photonics 2021, 8, 61–70. [Google Scholar] [CrossRef] [PubMed]
  20. Mendes, M.J.; Araujo, A.; Vicente, A.; Águas, H.; Ferreira, I.; Fortunato, E.; Martins, R. Design of optimized wave-optical spheroidal nanostructures for photonic-enhanced solar cells. Nano Energy 2016, 26, 286–296. [Google Scholar] [CrossRef]
  21. Grandidier, J.; Deceglie, M.G.; Callahan, D.M.; Atwater, H.A. Simulations of solar cell absorption enhancement using resonant modes of a nanosphere array. In Spie Opto; SPIE: London, UK, 2012; Volume 8256, p. 825603. [Google Scholar]
  22. Liu, H.; Ding, Y.; Jiang, W.; Lian, Q.; Yin, L.; Shi, Y.; Lu, B. Novel imprint lithography process used in fabrication of micro/nanostructures in organic photovoltaic devices. J. Micro/Nanolithogr. MEMS MOEMS 2009, 8, 021170. [Google Scholar] [CrossRef]
  23. Oliveira, R.; Mouquinho, A.; Centeno, P.; Alexandre, M.; Haque, S.; Martins, R.; Fortunato, E.; Águas, H.; Mendes, M. Colloidal lithography for photovoltaics: An attractive route for light management. Nanomaterials 2021, 11, 1665. [Google Scholar] [CrossRef]
  24. Chen, H.L.; Chuang, S.Y.; Lin, C.H.; Lin, Y.H. Using colloidal lithography to fabricate and optimize sub-wavelength pyramidal and honeycomb structures in solar cells. Opt. Express 2007, 15, 14793–14803. [Google Scholar] [CrossRef] [Green Version]
  25. Lee, J.-S.; Yu, J.-H.; Hwang, K.-H.; Nam, S.-H.; Boo, J.-H.; Yun, S.H. Patterning ITO by template-assisted colloidal-lithography for enhancing power conversion efficiency in organic photovoltaic. J. Nanosci. Nanotechnol. 2016, 16, 5024–5028. [Google Scholar] [CrossRef]
  26. Vinckx, W.; Vanacken, J.; Moshchalkov, V.V. Vortex pinning in Nb thin films modulated by nanospheres. J. Appl. Phys. 2006, 100, 044307. [Google Scholar] [CrossRef]
  27. Lin, W.-Y.; Ho, C.-C.; Hsu, W.-K. Large-scale production of ferromagnetic nanorings by a modified hole-mask colloidal lithography: Controlled creation of flux-closure vortex state. AIP Adv. 2016, 6, 025102. [Google Scholar] [CrossRef]
  28. Parchine, M.; Kohoutek, T.; Bardosova, M.; Pemble, M.E. Large area colloidal photonic crystals for light trapping in flexible organic photovoltaic modules applied using a roll-to-roll Langmuir-Blodgett method. Sol. Energy Mater. Sol. Cells 2018, 185, 158–165. [Google Scholar] [CrossRef]
  29. Khan, S.B.; Irfan, S.; Zhuanghao, Z.; Lee, S.L. Influence of refractive index on antireflectance efficiency of thin films. Materials 2019, 12, 1483. [Google Scholar] [CrossRef] [PubMed] [Green Version]
  30. Boarino, L.; Laus, M. Colloidal Lithography. In Handbook of Porous Silicon; Gabler: Wiesbaden, Germany, 2014; pp. 541–550. [Google Scholar]
  31. Sanchez-Sobrado, O.; Mendes, M.J.; Haque, S.; Mateus, T.; Águas, H.; Fortunato, E.; Martins, R. Lightwave trapping in thin film solar cells with improved photonic-structured front contacts. J. Mater. Chem. C 2019, 7, 6456–6464. [Google Scholar] [CrossRef]
  32. Sanchez-Sobrado, O.; Mendes, M.J.; Mateus, T.; Costa, J.; Nunes, D.; Águas, H.; Fortunato, E.; Martins, R. Photonic-structured TCO front contacts yielding optical and electrically enhanced thin-film solar cells. Sol. Energy 2020, 196, 92–98. [Google Scholar] [CrossRef] [Green Version]
  33. Torrisi, G.; Luis, J.S.; Sanchez-Sobrado, O.; Raciti, R.; Mendes, M.J.; Águas, H.; Fortunato, E.; Martins, R.; Terrasi, A. Colloidal-structured metallic micro-grids: High performance transparent electrodes in the red and infrared range. Sol. Energy Mater. Sol. Cells 2019, 197, 7–12. [Google Scholar] [CrossRef]
  34. Gao, T.; Wang, B.; Ding, B.; Lee, J.-K.; Leu, P.W. Uniform and ordered copper nanomeshes by microsphere lithography for transparent electrodes. Nano Lett. 2014, 14, 2105–2110. [Google Scholar] [CrossRef]
  35. Haque, S.; Alexandre, M.; Mendes, M.J.; Águas, H.; Fortunato, E.; Martins, R. Design of wave-optical structured substrates for ultra-thin perovskite solar cells. Appl. Mater. Today 2020, 20, 100720. [Google Scholar] [CrossRef]
  36. Corkery, R.W. Langmuir−Blodgett (L−B) Multilayer Films. Langmuir 1997, 13, 3591–3594. [Google Scholar] [CrossRef]
  37. Cho, Y.-S.; Yi, G.-R.; Moon, J.H.; Kim, D.-C.; Lee, B.-J.; Yang, S.-M. Dry etching of colloidal crystal films. J. Colloid Interface Sci. 2010, 341, 209–214. [Google Scholar] [CrossRef] [PubMed]
  38. Ding, T.; Wang, F.; Song, K.; Yang, G.; Tung, C.-H. Oxygen plasma etching-induced crystalline lattice transformation of colloidal photonic crystals. J. Am. Chem. Soc. 2010, 132, 17340–17342. [Google Scholar] [CrossRef] [PubMed]
  39. Chen, Y.; Shi, D.; Chen, Y.; Chen, X.; Gao, J.; Zhao, N.; Wong, C.-P. A facile, low-cost plasma etching method for achieving size controlled non-close-packed monolayer arrays of polystyrene nano-spheres. Nanomaterials 2019, 9, 605. [Google Scholar] [CrossRef] [PubMed] [Green Version]
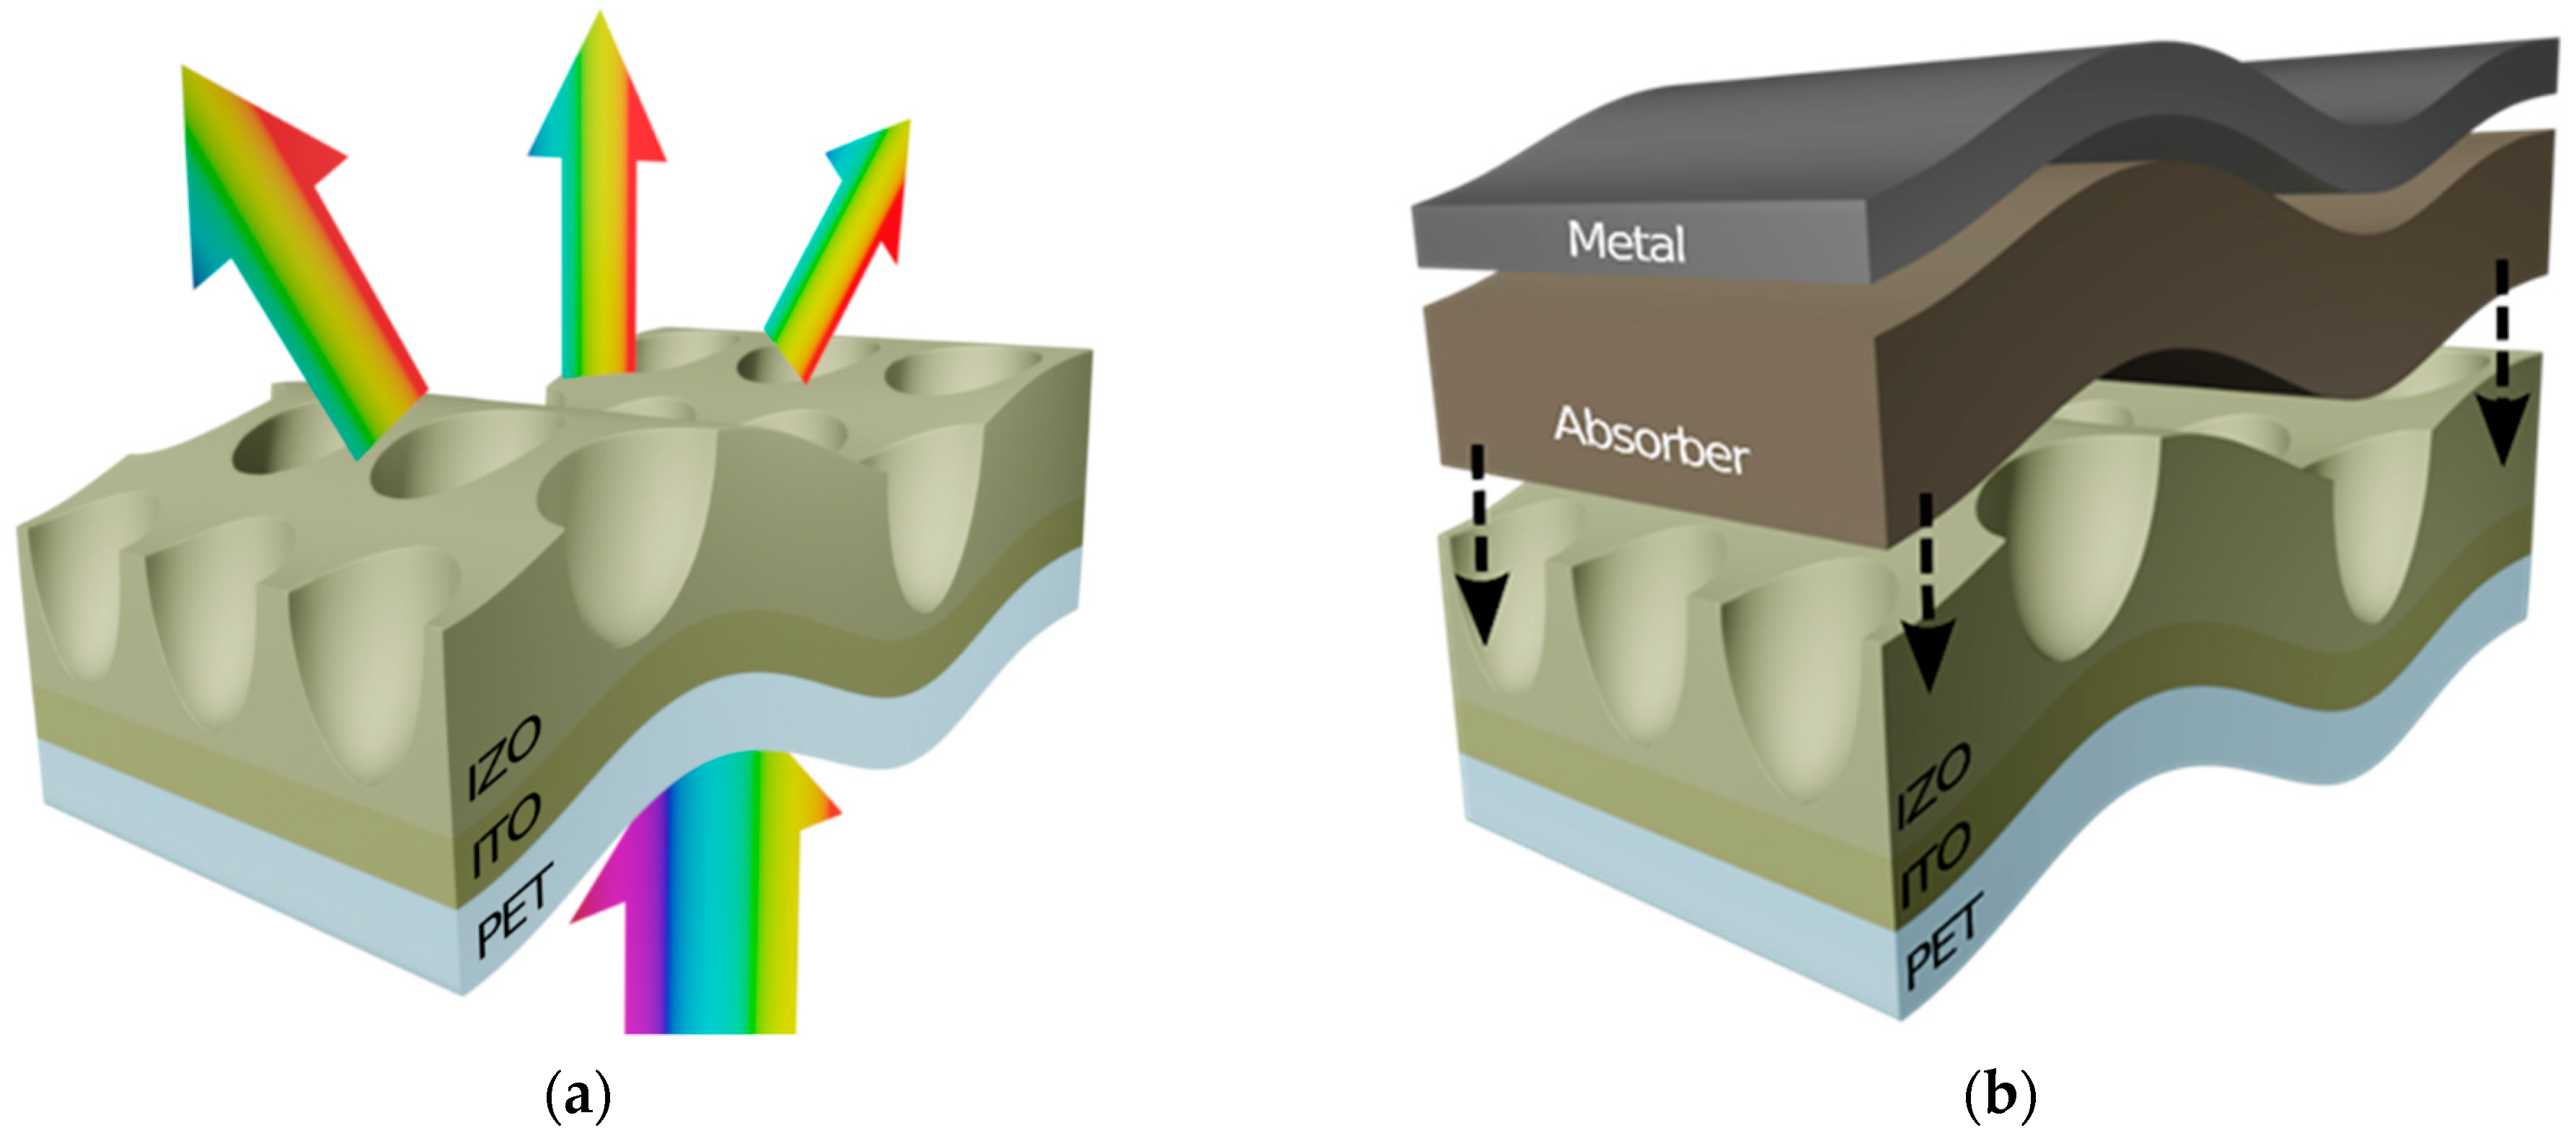
Figure 1. Illustration of a photonic-structured TCO electrode, composed of a micro-patterned IZO layer on a flexible ITO-coated PET substrate (a), aimed at producing effective light trapping (LT) in thin-film PV devices with a superstrate configuration (b). This LT solution can reduce reflection losses from the front illuminated surface and redirect the light to angles away from the incidence direction, thus boosting the optical path length of light in the solar cell absorbing materials patterned over this structure. Such an optical scheme is suitable for enhancing the performance of thin-film PV while allowing a thinner (and thus more flexible) absorber film, since the photocurrent generated by the devices (hence, their efficiency) is boosted in a wide spectral and incidence angular range.
Micro 01 00016 g001
Figure 2. Depiction of the main steps of colloidal lithography (CL): (a) deposition of the close-packed monolayer of colloidal polystyrene (PS) micro-spheres on top of the standard ITO-coated PET substrate, (b) the shaping of the colloids by O2 RIE, (c) IZO deposition via sputtering, and (d) the lift-off (removal) of the PS colloids, leaving the micro-structured IZO mesh on the surface. The bottom images show tilted-view SEMs of the patterned surface at each step.
Micro 01 00016 g002
Figure 3. Top-view SEM images showing the steps in the construction of the IZO microstructures by colloidal lithography using two different diameters of the PS colloids: 1.3 µm (top images) and 2.0 µm (bottom images). (a) Initially deposited close-packed array of PS spheres resulting from the LB coating. ((bf) left half) Non-close-packed arrays resulting from the O2 RIE shaping for different etching times: 90 s (b), 180 s (c), 270 s (d), 360 s (e), and 450 s (f). ((bf) right half) Resulting IZO micro-meshes created using the colloidal mask shown in the corresponding left half of the SEM images.
Micro 01 00016 g003
Figure 4. Examples of 3D AFM images of the resulting IZO micro-structures on ITO-coated PET substrate, used to correlate the resulting features’ height with the IZO deposition time, for two of the best-performing samples attained with the two different colloid sizes and distinct deposition times: (a) 130 min of IZO sputtering, with D = 1.3 µm PS spheres and tRIE = 360 s, resulting in an equivalent IZO film thickness of h = 0.325 μm and an average height of the IZO features of 0.3030 ± 0.1 μm; (b) 100 min of IZO sputtering, with D = 2.0 µm spheres and tRIE = 360 s, resulting in an equivalent film thickness of h = 0.25 μm and an average height of the IZO features of 0.1409 ± 0.1 μm.
Micro 01 00016 g004
Figure 5. (a,c) Absorbance and (b,d) diffuse and total transmittance spectra of selected samples analyzed in this work with different fabrication parameters for the CL process (indicated in the inset tables). The left plots correspond to structures made with D = 1.3 µm colloids (setting the array periodicity) and two different values for the tRIE and IZO film thickness (h). The right plots correspond to D = 2.0 µm and h = 250 nm for two different values of tRIE. These spectra are compared with those of the reference (Ref, black lines) planar samples made of just the ITO-coated PET substrate. The inset tables compare the values of the sheet resistance, RS, measured by the 4-point probe technique on the top surface of the samples.
Micro 01 00016 g005
Figure 6. Assessment of the photonic-structured contacts produced in this study for the 1.3 µm (left) and 2.0 µm (right) pitches set by the spheres’ diameter (a,e). Average diffuse transmittance calculated in the wavelength range of interest (550–1000 nm) for the scattering effects (b,f). Average parasitic absorption calculated in the full wavelength range (350–1000 nm) (c,g). Optical figure of merit (FoM) defined in Equation (1) (d,h). Sheet resistance (RS) of the substrates. These quantities are plotted as a function of the RIE exposure time (tRIE) and the deposited IZO’s thickness (h).
Micro 01 00016 g006
Table 1. Experimental conditions used during the two reactive ion etching (RIE) processes carried out in the colloidal lithography fabrication methodology developed in this work.
RIE AtmosphereEtched MaterialTime, tRIE
(s)
RIE Power
(W)
Gas Pressure
(mTorr)
Plasma Flow
(sccm)
O2Polystyrene90–450505050
Ar/CF4IZO1801001504/16
Table 2. Fabrication parameters explored for the CL processing of photonic substrates, which control the geometrical properties of the resulting IZO mesh, as indicated in the right-most column.
Fabrication ParameterAnalyzed SetsResulting Property
Spheres’ diameter, D1.3 and 2.0 µmArray pitch
O2 RIE time, tRIE0, 90, 180, 270, 360 and 450 sMesh line width
IZO thickness, h175, 250, 325 and 500 nmFeature’s height
Publisher’s Note: MDPI stays neutral with regard to jurisdictional claims in published maps and institutional affiliations.