Article

Ab Initio Investigation of the Hydration of the Tetrahedral d0 Transition Metal Oxoanions NbO43−, TaO43−, CrO42−, MoO42−, WO42−, MnO4, TcO4, ReO4, and of FeO4, RuO4, and OsO4

Department of Chemistry, Saint Mary’s University, Halifax, NS B3H 3C3, Canada
*
Author to whom correspondence should be addressed.
Liquids 2024, 4(3), 539-580; https://doi.org/10.3390/liquids4030031
Submission received: 20 May 2024 / Revised: 2 July 2024 / Accepted: 29 July 2024 / Published: 16 August 2024
(This article belongs to the Special Issue Hydration of Ions in Aqueous Solution)

Abstract

:
The geometries and vibrational frequencies of various configurations of XO4m−(H2O)n, X = Fe, Ru, Os, m = 0; X = Mn, Tc, Re, m = 1; X = Cr, Mo, W, m = 2; and X = Nb, Ta, m = 3; n = 0–6 are calculated at various levels up to MP2/6-31+G* and B3LYP/6-31+G*. These properties are studied as a function of increasing cluster size. The experimental and theoretical bond distances and vibrational spectra are compared where available, and predictions are made where they are not.

1. Introduction

The hydration of ions is crucial to understanding the properties of electrolyte solutions. Solution diffraction data using either X-rays or neutrons has established that water molecules arrange themselves in hydration shells around ions [1]. For metal cations, the existence and nature of an aqua ion can often be proven by Raman spectroscopy and/or ab initio calculations [2,3,4,5,6,7]. For oxoanions, the influence of the first hydration shell of water molecules is much smaller. One of the authors has examined the effect of the first hydration sphere on the main-group tetraoxo anions [8], some of their protonated forms [9,10,11,12,13,14], as well as several borate species [15,16,17,18] by ab initio computational methods. Therein, we have demonstrated that ab initio modeling using restricted Hartree-Fock (HF) theory with modest basis sets gives reasonable structural and vibrational properties, even if a full hydration sphere or an implicit solvation model is not employed. In this paper, we present our studies of naked and explicitly hydrated niobate, tantalate, chromate, molybdate, tungstate, permanganate, pertechnetate, perrhenate; and of iron, ruthenium, and osmium tetroxide, including optimization and frequency calculation up to the MP2/6-31+G* level and with up to twelve water molecules [19].

2. Materials and Methods

Calculations were carried out using Gaussian 03 [20], using the standard 6-31G* and 6-31+G* basis sets in conjunction with the standard HF, MP2, and B3LYP levels of theory. For the atoms of the second and third transition metal series, the standard SDD effective core potential and associated basis set was used in conjunction with the 6-31G(d) and 6-31+G(d) basis sets (O,H). The second-order Moller-Plesset (MP2) calculations use the frozen core approximation. A stepping stone approach was used, where the geometries and molecular orbital coefficients at the levels HF/6-31G*, HF/6-31+G*, MP2/6-31G*, MP2/6-31+G*, B3LYP/6-31G*, and B3LYP/6-31+G* were sequentially optimized (geom = allcheck guess = read). Default optimization specifications were normally used. After each level, a frequency calculation was performed at the same level, and the resulting force constants were used in the following optimization. Z-matrix coordinates constrained to the appropriate symmetry were used to speed up the optimizations and simplify the assignment of vibrational modes (FOpt = z-matrix, ReadFC). The force constants were evaluated at the first geometry as well (FOpt = CalcFC). The quadratic convergence method was applied automatically if the SCF failed to converge (SCF = XQC). Additional options were specified individually or in combination, as needed, to converge the geometry and energy (SCF: NoDIIS and/or IntRep and/or CDIIS; FOpt = CalcAll and/or GDIIS). Additional calculations with Gaussian 16 [21] were carried out to explore the BLYP and PBE functionals, often used for ab initio MD simulations and the effect of an implicit solvation model (CPCM).

3. Results

The XO4m− ion, or molecule, of Td symmetry has nine modes of internal vibration spanning the vibrational representation Γ v i b = A 1 + E + 2 T 2 . All modes are Raman active, whereas only the T2 modes are IR active. The structures are analogous to those reported previously for perchlorate [8]. In the following subsections, we review the geometries and vibrational frequencies of each molecule or ion, followed by our results.

3.1. Permanganate

The crystal structures of permanganate salts have been examined for several decades. For potassium permanganate (Pnma), Mooney determined the average Mn-O distance to be 1.59(9) Å [22]. Refinements include those of Ramaseshan et al. (1.55(1) Å) [23], Palenik (1.629(8) Å) [24], Hoppe (1.60(1)) [25], and Marabello et al. (1.615(1) Å) [26]. Other anhydrous alkali permanganate structure determinations include those of Fischer et al. (Li: neutron diffraction, 1.623(17) Å) [27], Bauchert et al. (Na: 1.610(13) Å) [28], and Hoppe et al. (Rb: 1.603(5) Å; Cs: 1.604(3) Å) [25]. Lithium permanganate can also exist as the trihydrate (1.615(8) Å) [29,30]. The more modern determinations squarely place the Mn-O distance in the range 1.60–1.63 Å.
The resonance Raman spectrum of KMnO4(aq) was measured with the 514.5 and 488 nm argon laser lines by Kiefer and Bernstein [31,32]. The Mn-O stretching bands at 837.5 (ν1-A1) and 906.5 cm−13-T2), as well as several overtones nν1 and combinations nν1 + ν3, were observed in light and heavy water. Weinstock, Schulze, and Muller observed, using a He-Ne laser at 633 nm, the normal Raman spectrum of KMnO4(aq) [33] and found bands at 839 ± 1 (ν1-A1), 914 ± 5 (ν3-T2), 360 ± 5 (ν2-E), and 430 ± 5 (ν4-T2) cm−1. In an argon matrix, the ν3 mode appears at 896.9 cm−1 [34].
The calculated bond lengths and vibrational frequencies for MnO4 are given in Table 1. The Hartree-Fock distances are too short compared to the experiment, but the MP2 and especially the DFT distances are in much better agreement. The Hartree-Fock frequencies are overestimated, which is a well-known problem with the theory and can be corrected by an empirical scaling factor. The DFT frequencies are reasonably close to the experiment, with the deformation modes being quite close, although the stretching frequencies are overestimated by up to 100 cm−1. The MP2 stretching frequencies, on the other hand, are nearly twice the experimental values, and this must be regarded as an abysmal failure of the MP2 method. The difficulty that permanganate can present to computational chemistry, especially with regard to electronic transitions, is well known [35,36,37,38,39,40,41,42,43,44,45,46,47]. The CPCM solvation model gives rise to slightly smaller Mn-O distances and T2 frequencies.
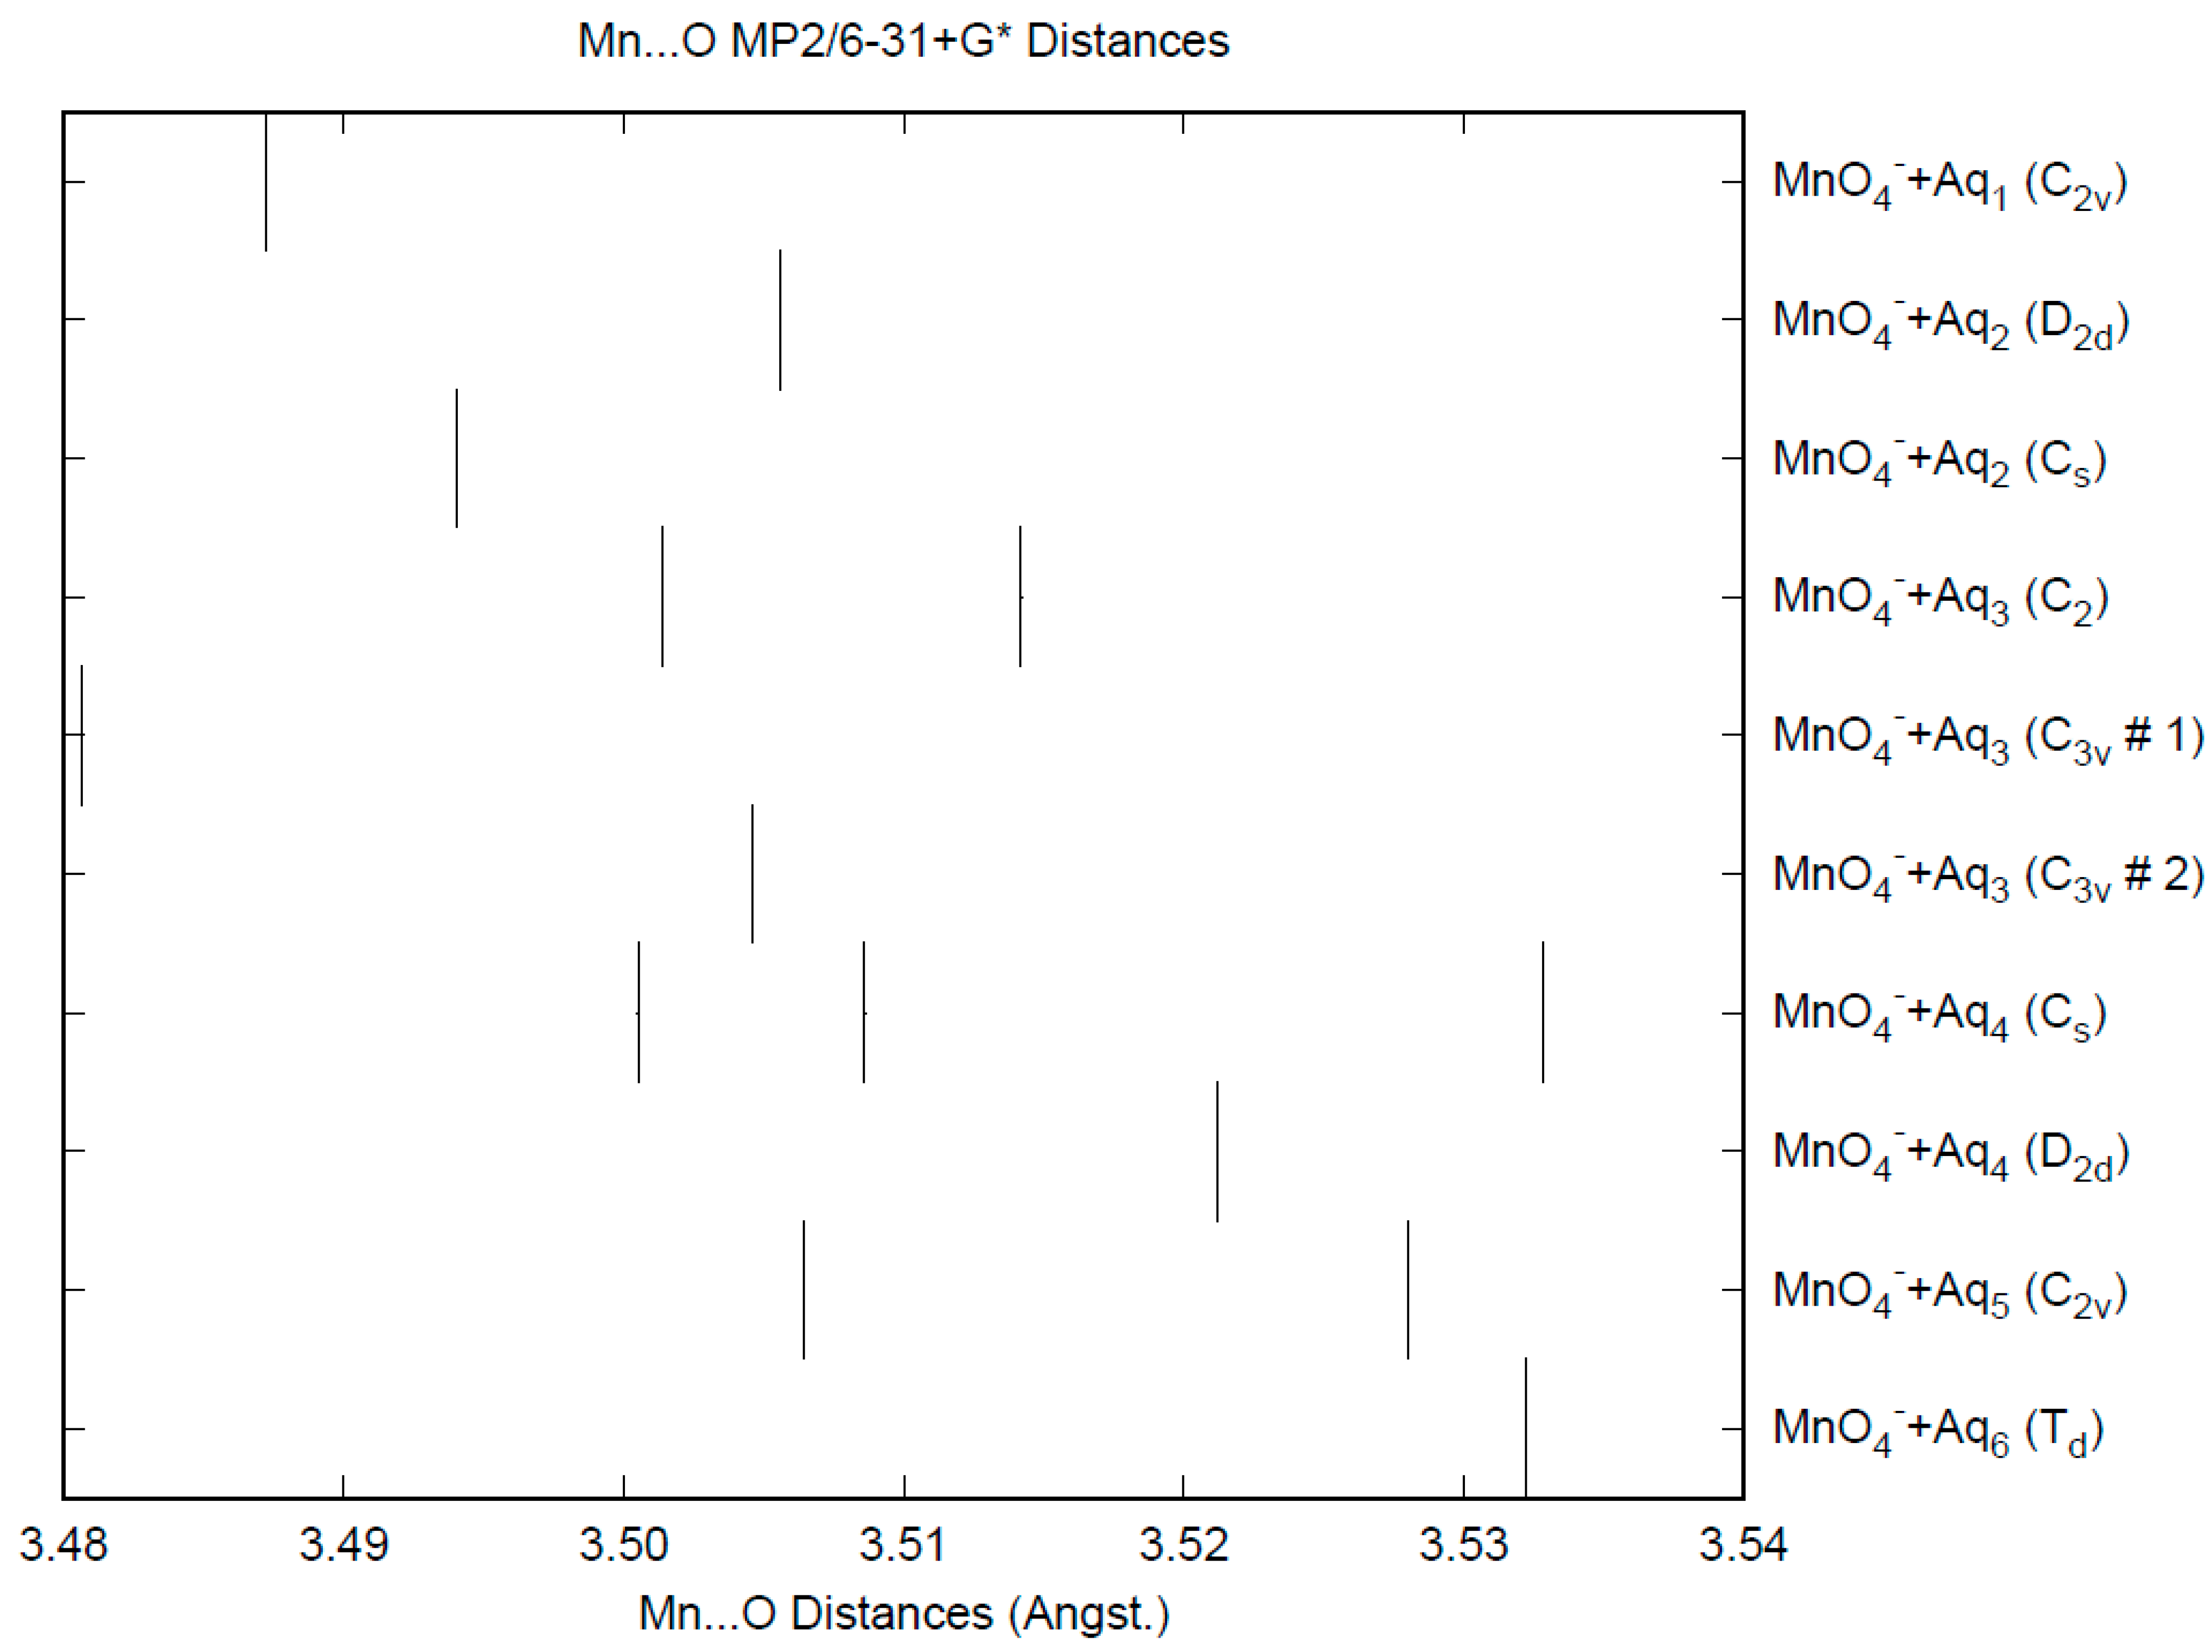
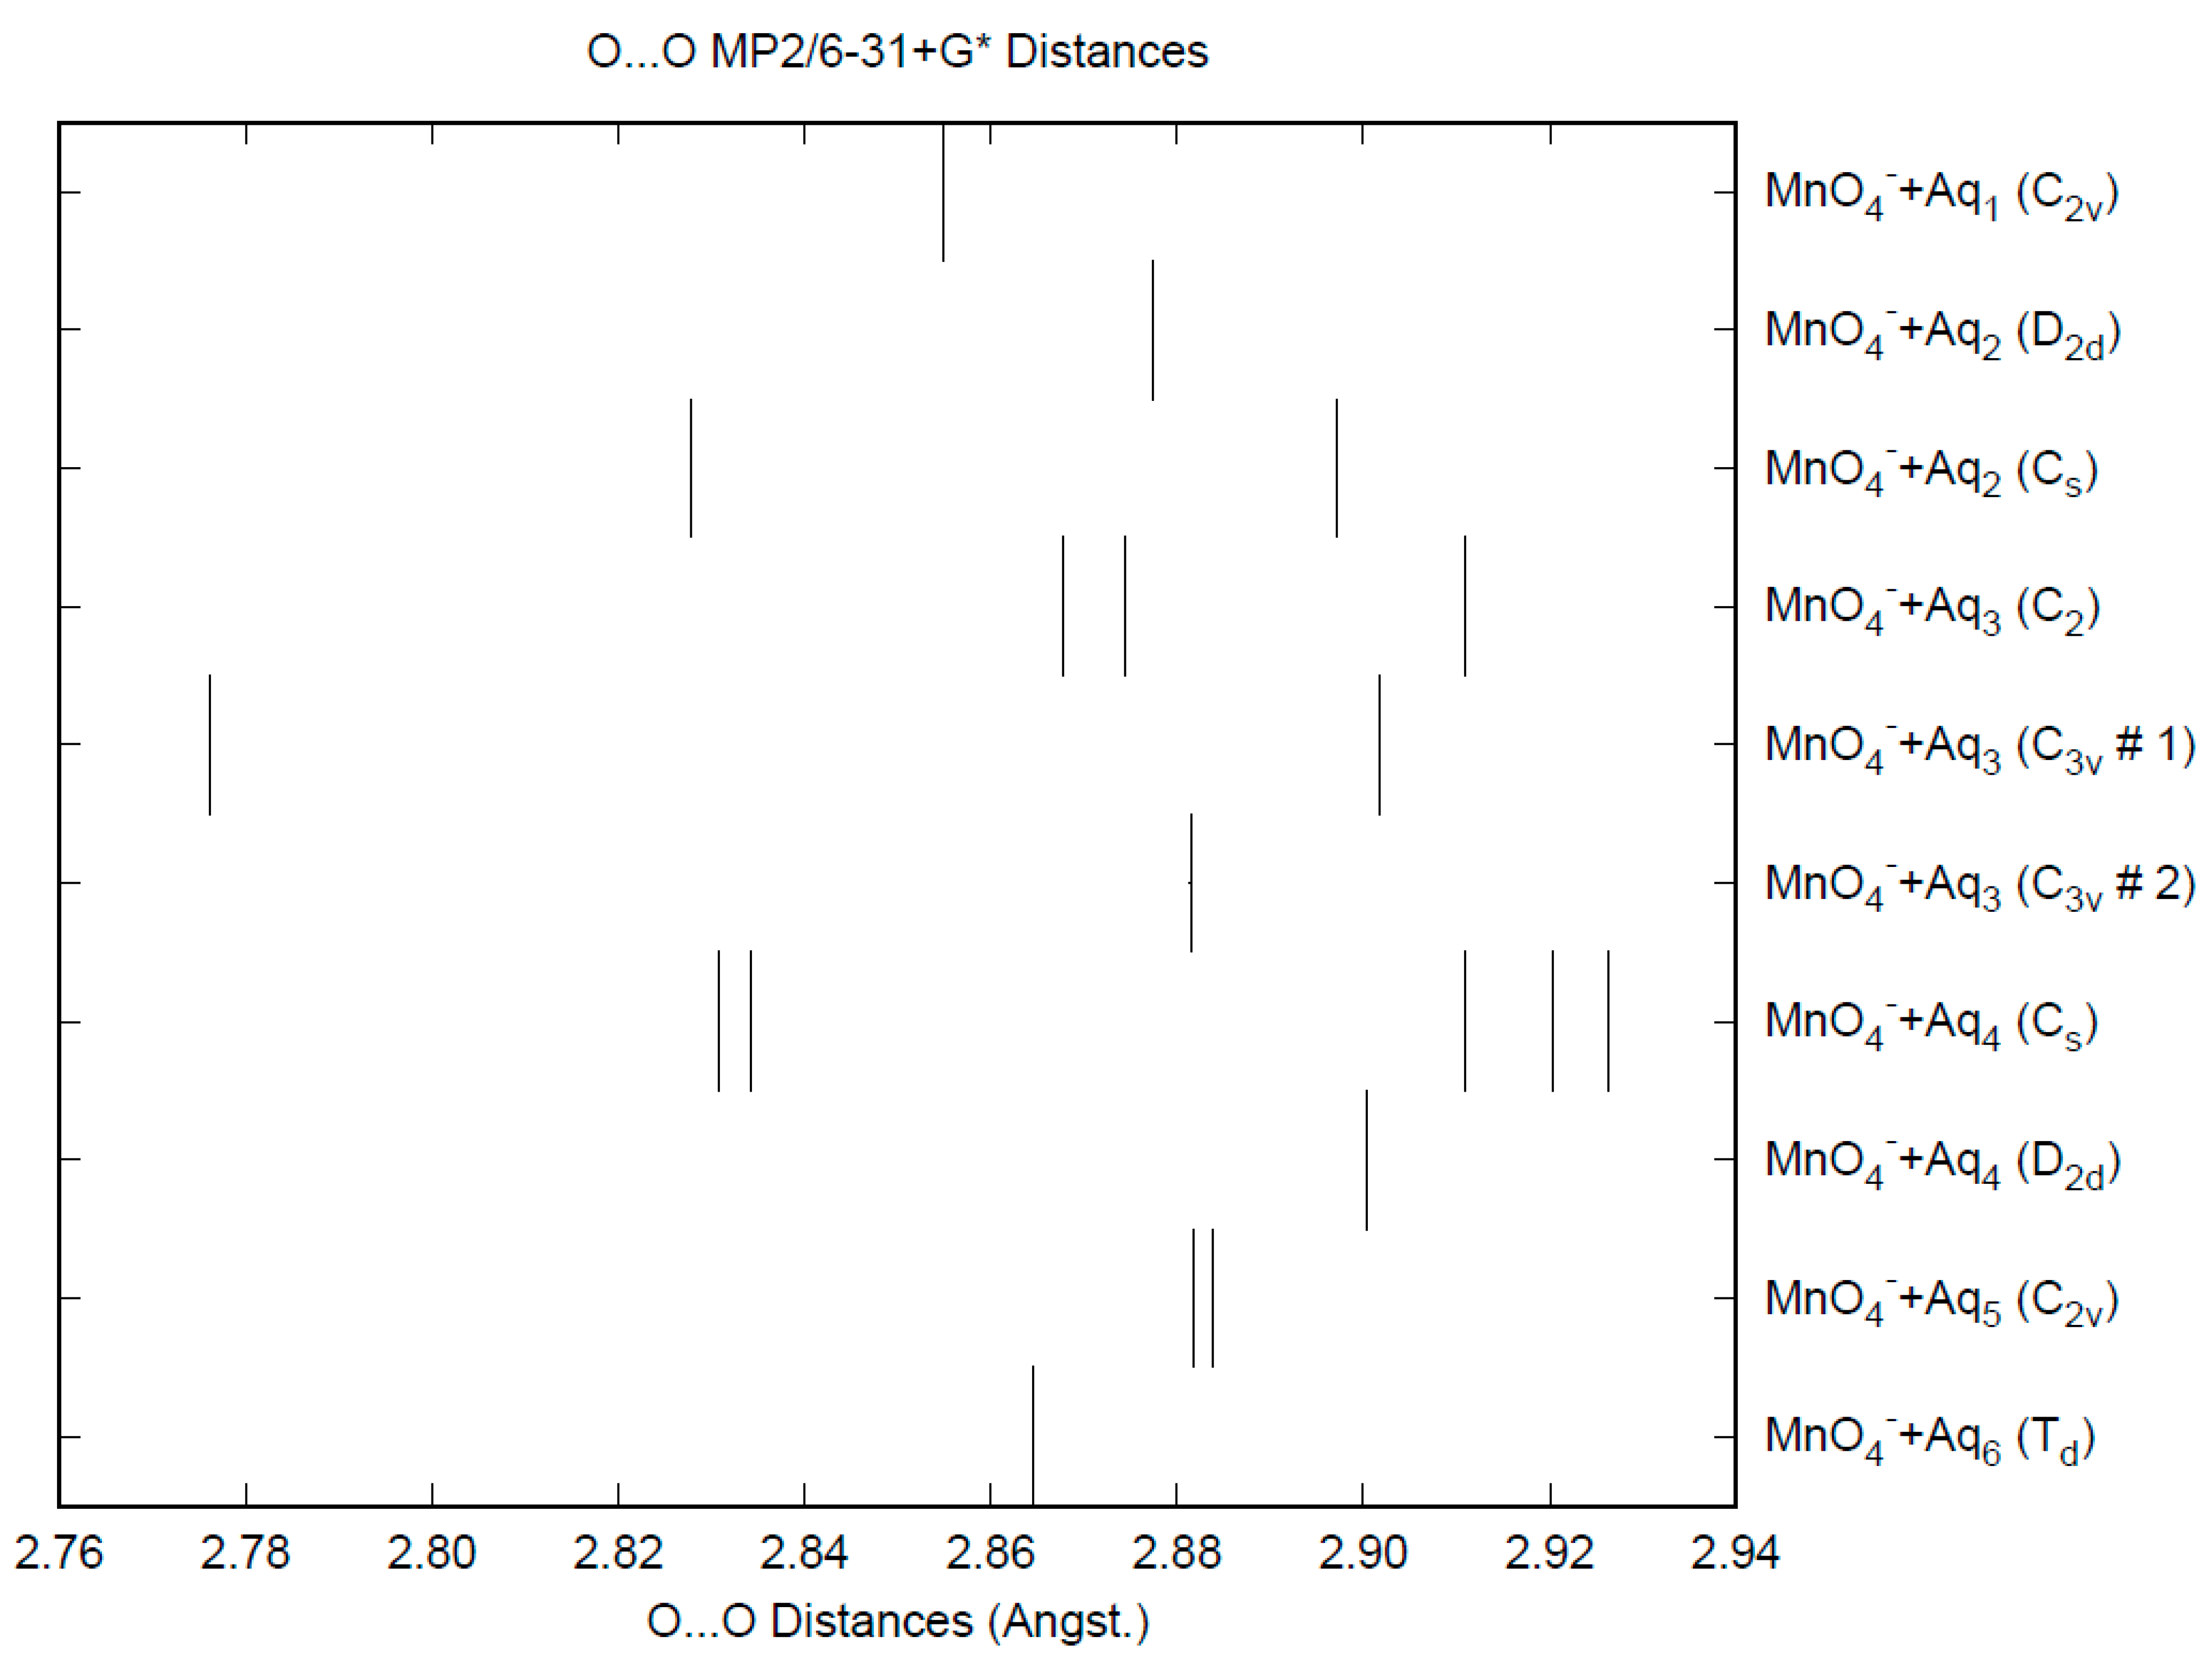
The effect of water upon the Mn-O distances (MP2/6-31+G(d)) in MnO4nH2O (n = 0–6) is similar to that of the Cl-O distances in the analogous perchlorate [8] (Figure 1). However, the net effect is a very slight lengthening of the Mn-O distance by 0.0007 Å (n = 6), compared with the shortening observed in perchlorate. However, the individual Mn-O distances can vary by up to 0.05 Å (in perchlorate, the variation was only 0.02 Å). This might be reflected in larger bandwidths in the vibrational spectra. Although the Mn-O distances are approximately 0.1 Å longer than the corresponding Cl-O distances, the Mn…O distances are actually about 0.1 Å shorter than the corresponding Cl…O distances (Figure 2). The O…O distances are about 0.2 Å shorter (Figure 3) than the corresponding distances in perchlorate, suggesting that the hydrogen bonding is stronger in permanganate than in perchlorate. This is also seen in the O…H distances (Figure 4). Unlike perchlorate, there is only a slight increase of the hydrogen bonding indicators (O…O, O…H) on the number of water molecules, but the ranges are much larger. This also indicates that the permanganate ion has an unusual solvation dependence. In an aqueous solution, the Mn-O distance is 1.630(5) Å by LAXS, and the Mn…O distance is 4.095(8) Å [48]. While the Mn-O distance is well-reproduced by the hexahydrate calculations, the Mn…O distance is too short because the double-donor water molecules are too close to the central metal. This is rectified in the dodecahydrate model, in which the Mn…O distance lies in the range 3.83–4.09 Å, depending on the level of theory.
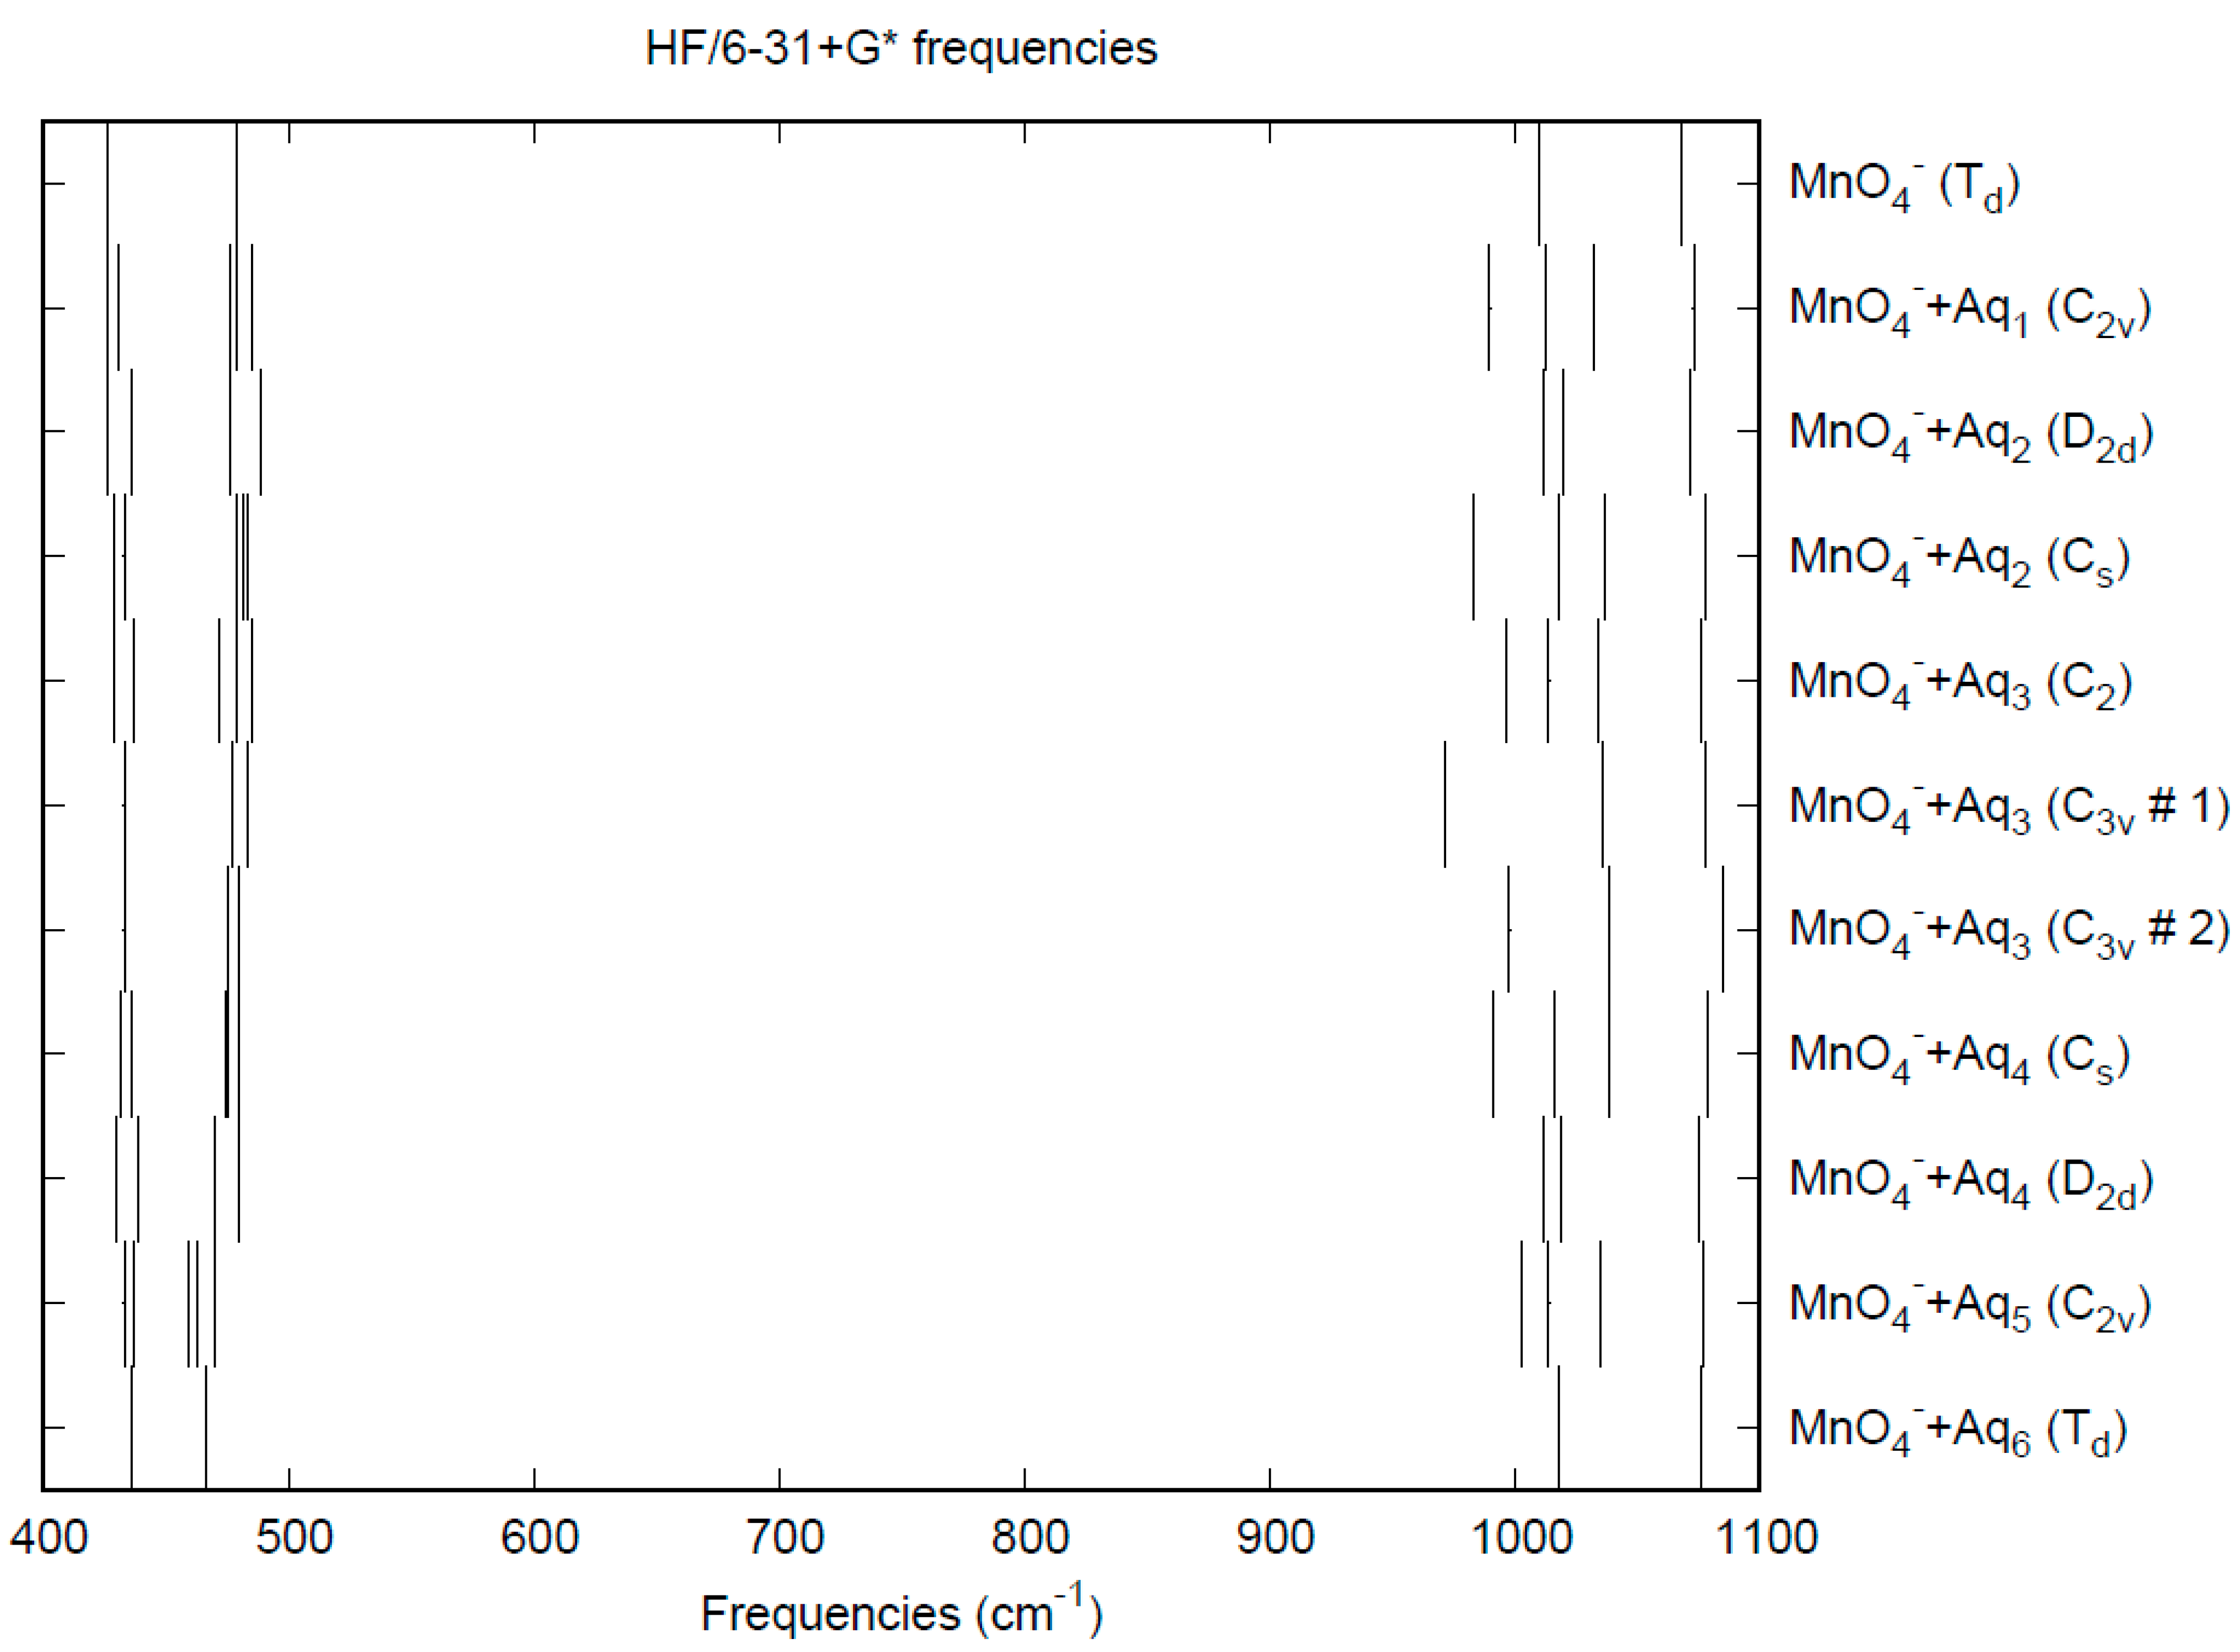
The vibrational frequencies (HF/6-31+G*) as a function of hydration number are shown in Figure 5. The deformation frequencies are lower than in perchlorate and are also much closer together. In addition, the HF/6-31+G* level predicts that the asymmetric stretching mode is lower than the symmetric stretching mode for permanganate, whereas the opposite is true in the experiment and also for both the calculated and experimental perchlorate spectrum [8].

3.2. Pertechnetate

The determination of the properties of pertechnetate salts requires special care because of the radioactivity of technetium. The crystal structure of potassium pertechnetate gives a Tc-O distance of 1.711(3) Å (1.724 Å corrected) [49]. Other anhydrous pertechnetate crystal structure determinations include those of German et al. (Na: 100 K, 1.7208(3) Å; 296 K, 1.7183(6) Å) [50], Weaver et al. (neutron diffraction: Na, 1.737(4) Å; K, 1.739(14) Å; Rb, 1.723(3) Å; Cs, 1.67(3) Å) [51], and Meyer et al. (Cs: 1.715(50) Å) [52]. The lithium salt crystallizes as the trihydrate (1.717(7) Å) [53]. The average Tc-O distances fall mostly in the high end of the range 1.67–1.74 Å.
Busey and Keller [54] observed Raman bands at 912 and 325 cm−1 for 2 mol/L NH4TcO4(aq). Weinstock, Schulze, and Muller observed the normal Raman spectrum of KTcO4(aq) [33] and found bands at 912 ± 1 (ν1-A1), 912 ± 4 (ν3-T2), 325 ± 2 (ν2-E), and 336 ± 10 (ν4-T2) cm−1. An infrared band was found at 334 ± 10 (ν4-T2) cm−1.
The calculated bond lengths and vibrational frequencies for TcO4 are given in Table 2. The Hartree-Fock distances are too short compared to the experiment, but the MP2 distances are too long. The DFT distances are in much better agreement. In accordance with the inverse relationship between distance and vibrational frequency, the Hartree-Fock frequencies are overestimated, and the MP2 frequencies are underestimated. In addition, HF places the ν1-A1 band above the ν3-T2 band by 50–70 cm−1, whereas MP2 reverses this order by 150 cm−1. Only the DFT frequencies are reasonably close to the experiment, predicting the near degeneracy of the two modes. The CPCM solvation model gives rise to slightly larger Tc-O distances and smaller frequencies.
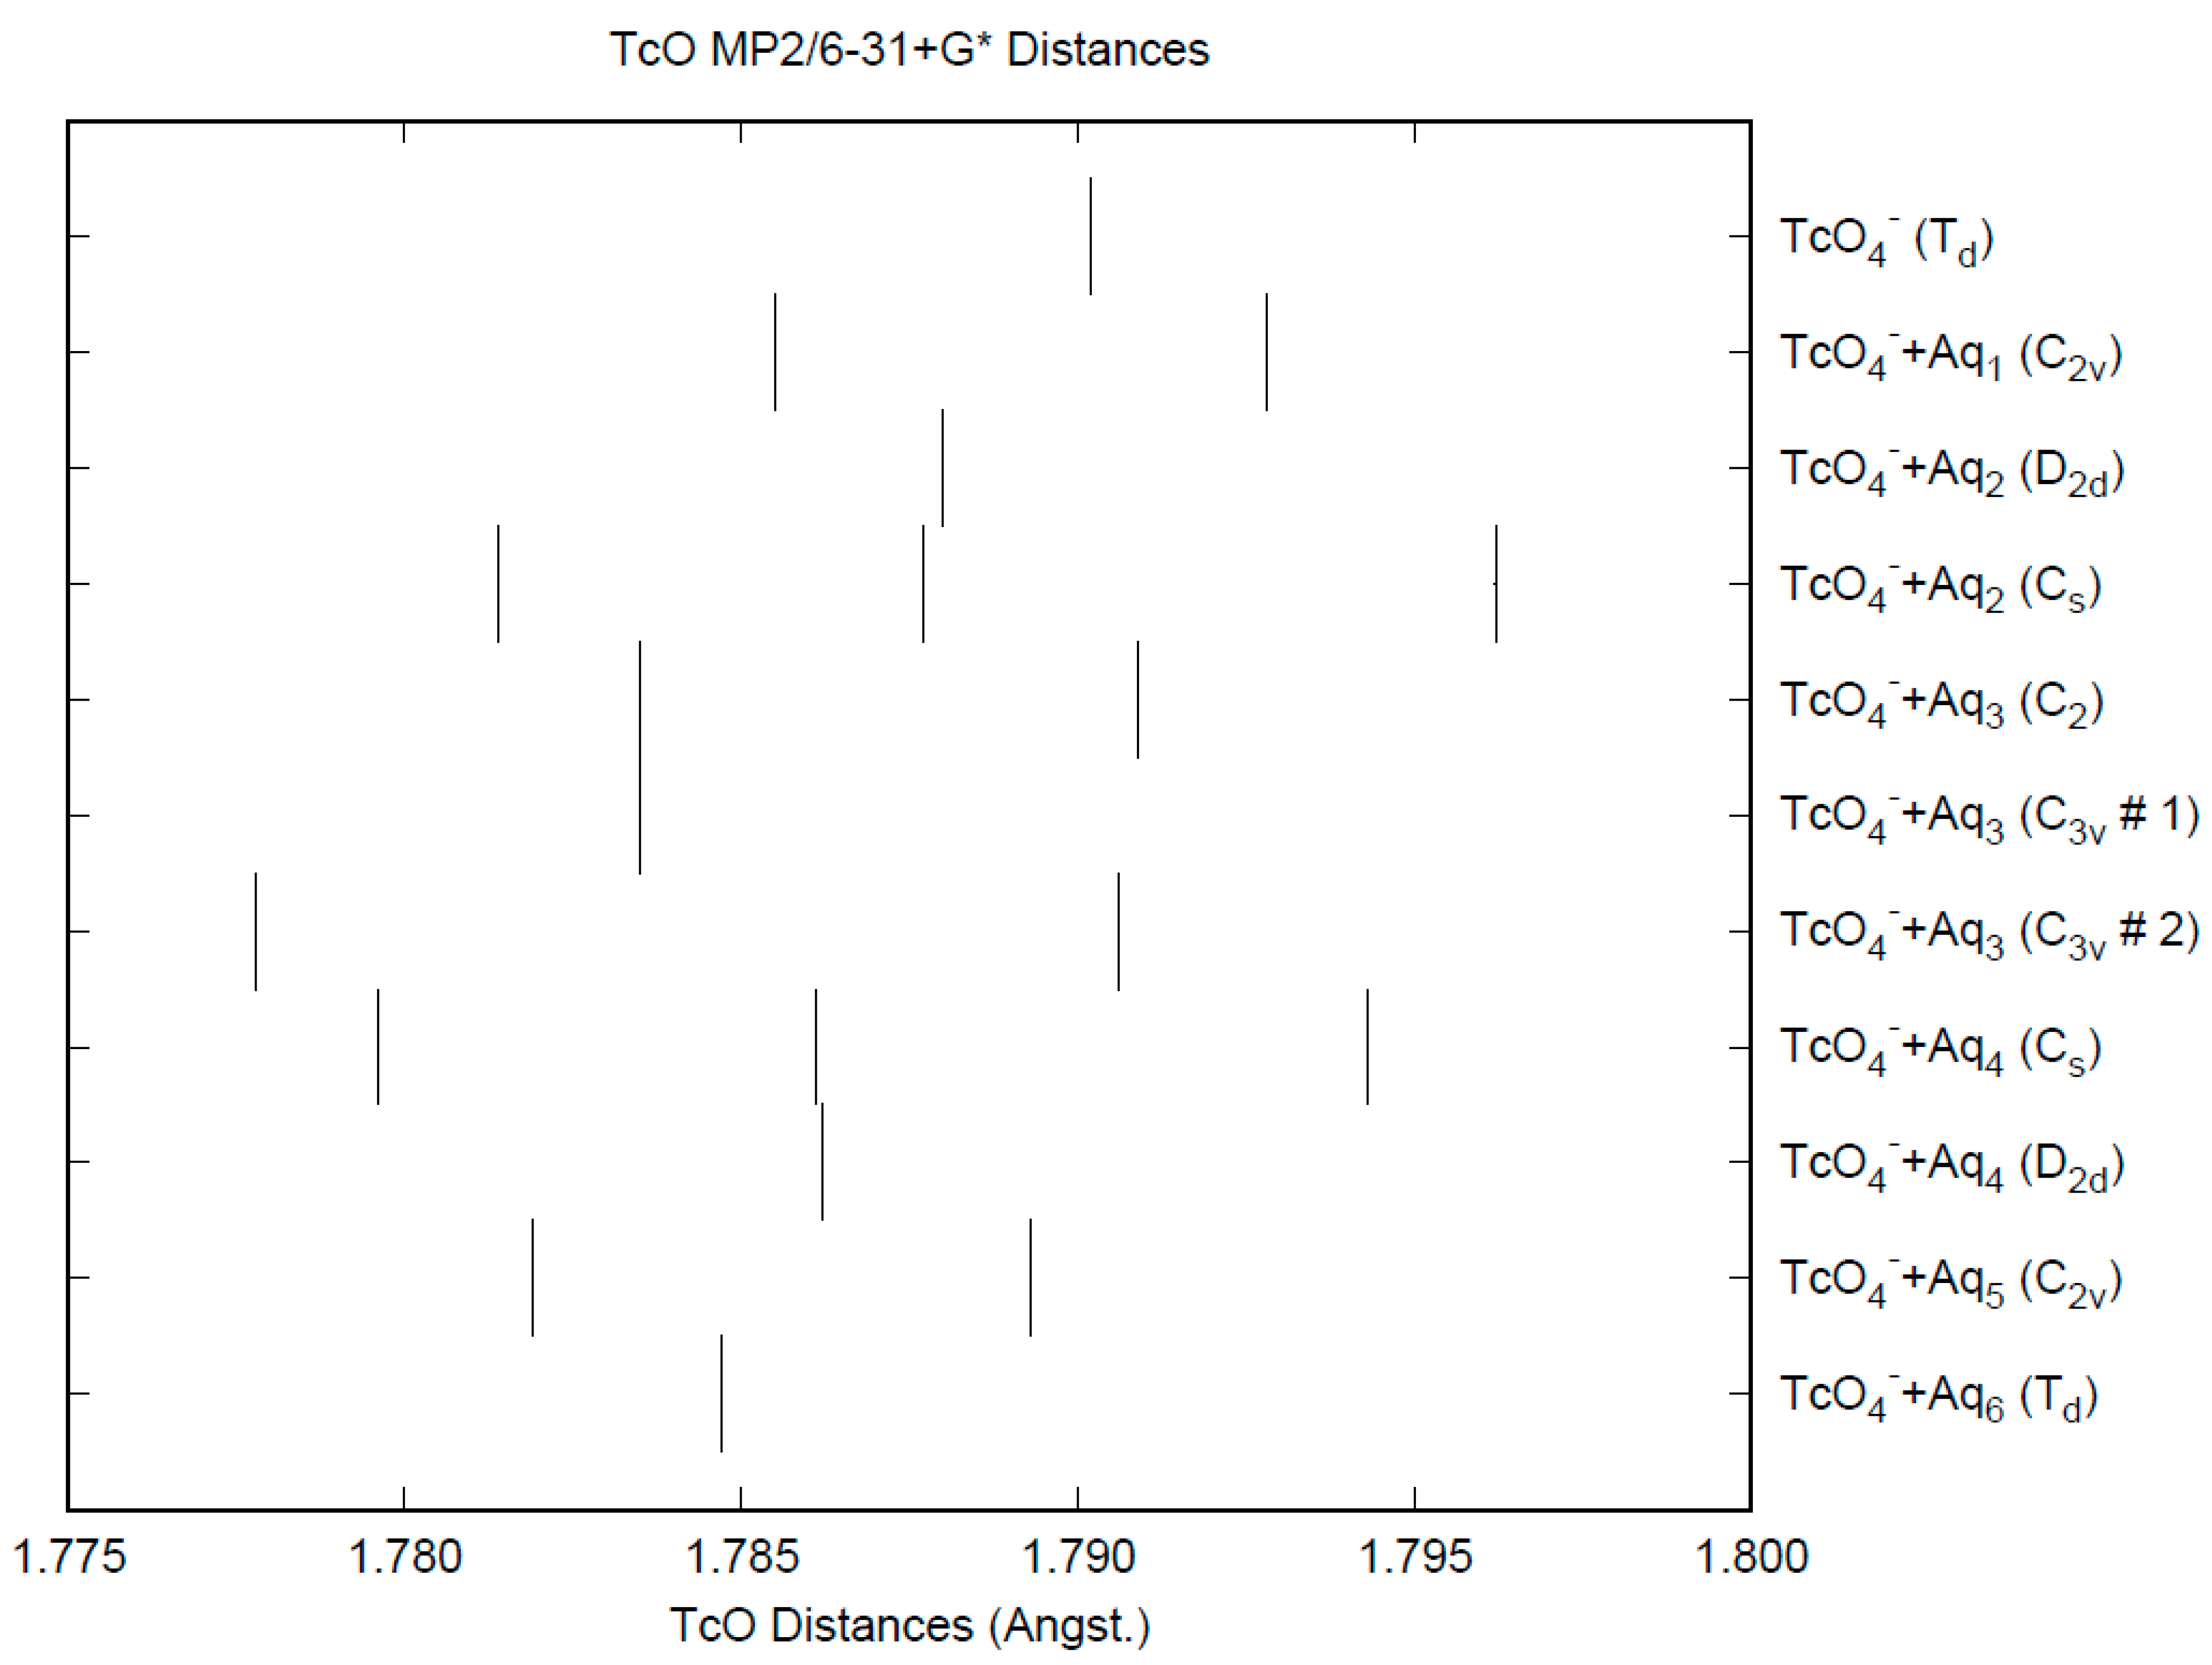
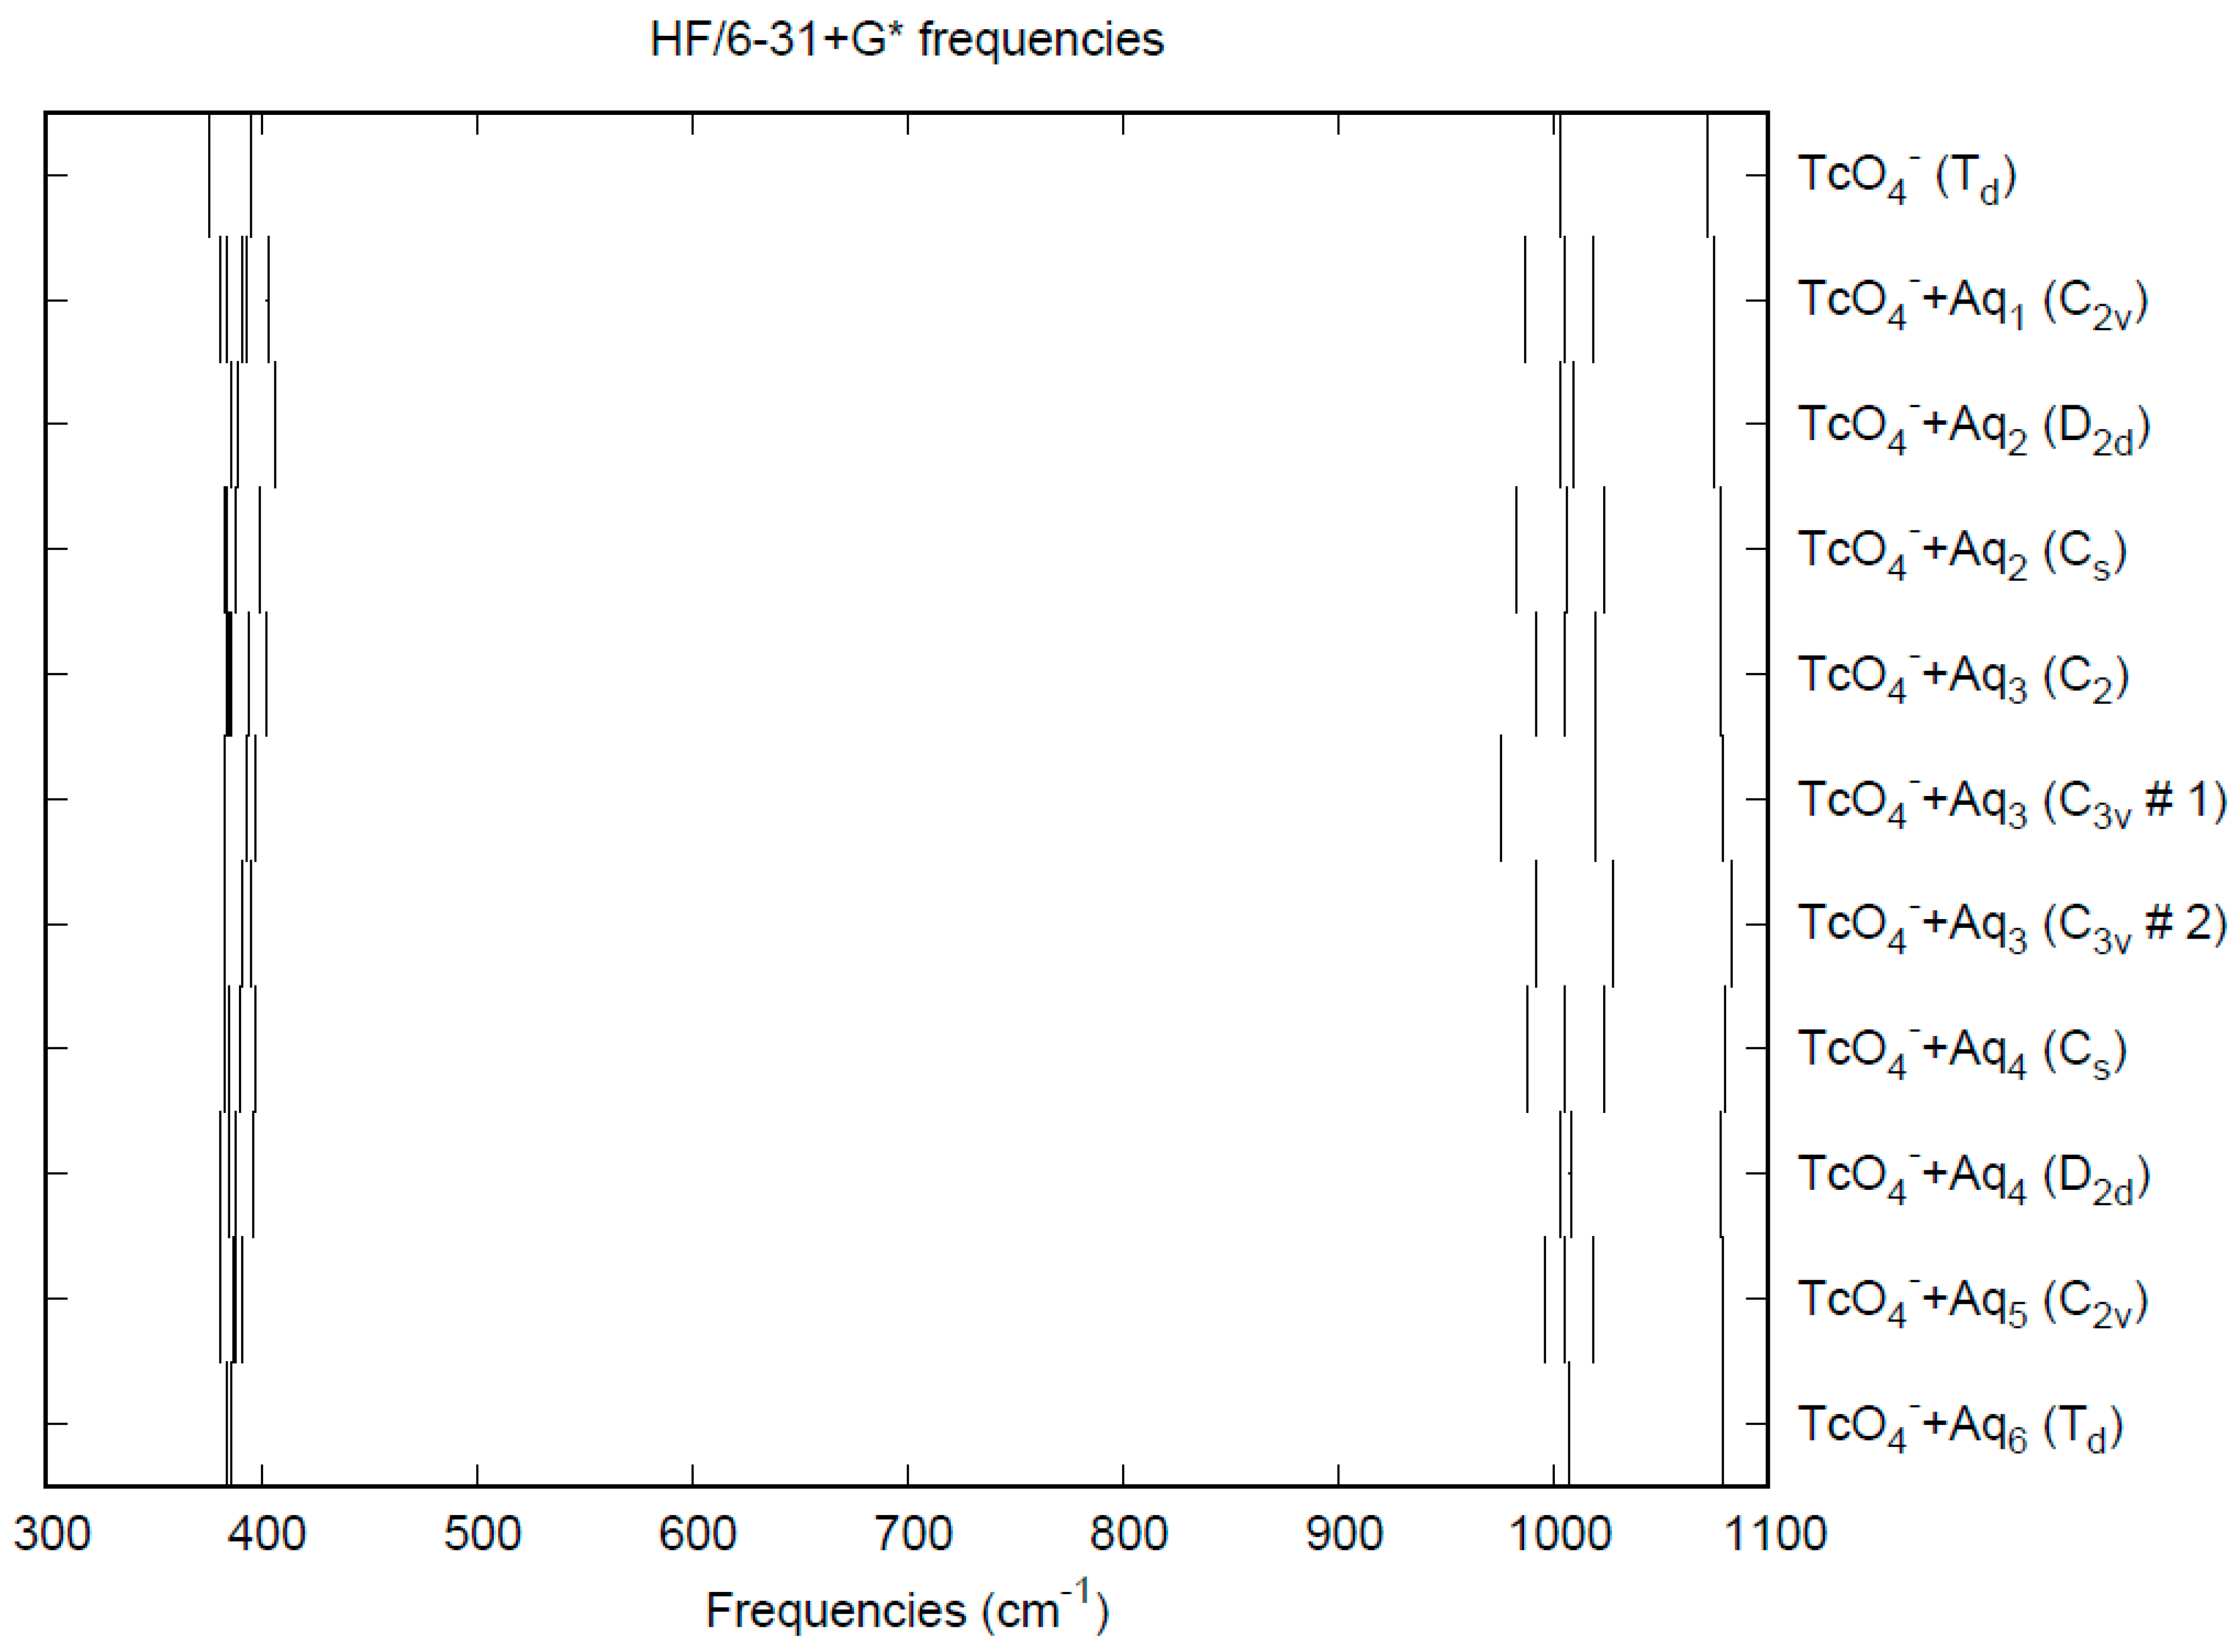
The effect of water upon the Tc-O distances (MP2/6-31+G(d)) in TcO4nH2O (n = 0–6) is similar to that of the Cl-O distances in the analogous perchlorate (Figure 6) [8]. The net effect is a slight shortening of the Tc-O distance by 0.005 Å (n = 6), unlike permanganate. The individual Tc-O distances vary by up to 0.01 Å (in perchlorate, the variation was larger at 0.02 Å). The Tc-O distances are approximately 0.3 Å longer than the corresponding Cl-O distances, although the Tc…O distances are about the same as the corresponding Cl…O distances (Figure S1). The O…O (Figure S2) and O…H (Figure S3) distances are about the same as in perchlorate.
The vibrational frequencies (HF/6-31+G*) as a function of hydration number are shown in Figure 7. The deformation frequencies are lower than in perchlorate and are also much closer together. In addition, the HF/6-31+G* level predicts that the asymmetric stretching mode is lower than the symmetric stretching mode for pertechnetate, whereas experimentally, the modes are degenerate. The effect of hydration is similar to that in perchlorate.

3.3. Perrhenate

The crystal structure of potassium perrhenate was determined by Morrow [55] to give Re-O distances of 1.77(3) Å. The structure was further refined by Lock and Turner [56] (Re-O = 1.723(4) Å), Krebs and Hasse [49] (Re-O = 1.719(5) Å), and Brown, Powell, and Stuart [57] (neutron diffraction, Re-O = 1.739(1) Å, 15 K; 1.736(2), 150 K; 1.731(2) Å, 298 K). Other anhydrous perrhenate determinations include those of sodium perrhenate [58], (Re-O = 1.728(2) Å), rubidium perrhenate [59,60] (Re-O = 1.722(6) Å, 297 K; 1.729(2) Å, 159 K), two forms of cesium perrhenate [61,62,63] (Pnma, Re-O = 1.714(4) Å, 297 K; I41/amd, 1.683(7) Å, 468 K), and lithium perrhenate [64] (Re-O = 1.715(26) Å). In addition, the crystal structure of some hydrated lithium perrhenate forms are known: LiReO4•H2O [65] (Re-O = 1.720(12) Å) and LiReO4•1.5H2O [66] (Re-O = 1.72(1) Å). The more modern determinations squarely place the Re-O distance in the range of 1.683–1.739 Å. A comparison with the nearly identical Tc-O distances is evidence for the well-known lanthanide contraction. Weinstock, Schulze, and Muller observed the normal Raman spectrum of KReO4(aq) [33] and found bands at 971 ± 1 (ν1-A1), 920 ± 4 (ν3-T2), and 331 ± 2 (ν2-E) cm−1. An infrared band was found at 322 ± 10 (ν4-T2) cm−1.
The calculated bond lengths and vibrational frequencies for ReO4 are given in Table 3. The Hartree-Fock distances are slightly too short compared to the experiment, but the MP2 distances are too long. The B3LYP distances are slightly too long. In accordance with the inverse relationship between distance and vibrational frequency, the Hartree-Fock frequencies are overestimated, and the MP2 frequencies are underestimated. In addition, HF places the ν1-A1 band above the ν3-T2 band by 90–100 cm−1, whereas MP2 reverses this order by 50–60 cm−1. Only the B3LYP frequencies are reasonably close to the experiment. The CPCM solvation model gives rise to slightly larger Re-O distances and usually smaller frequencies.
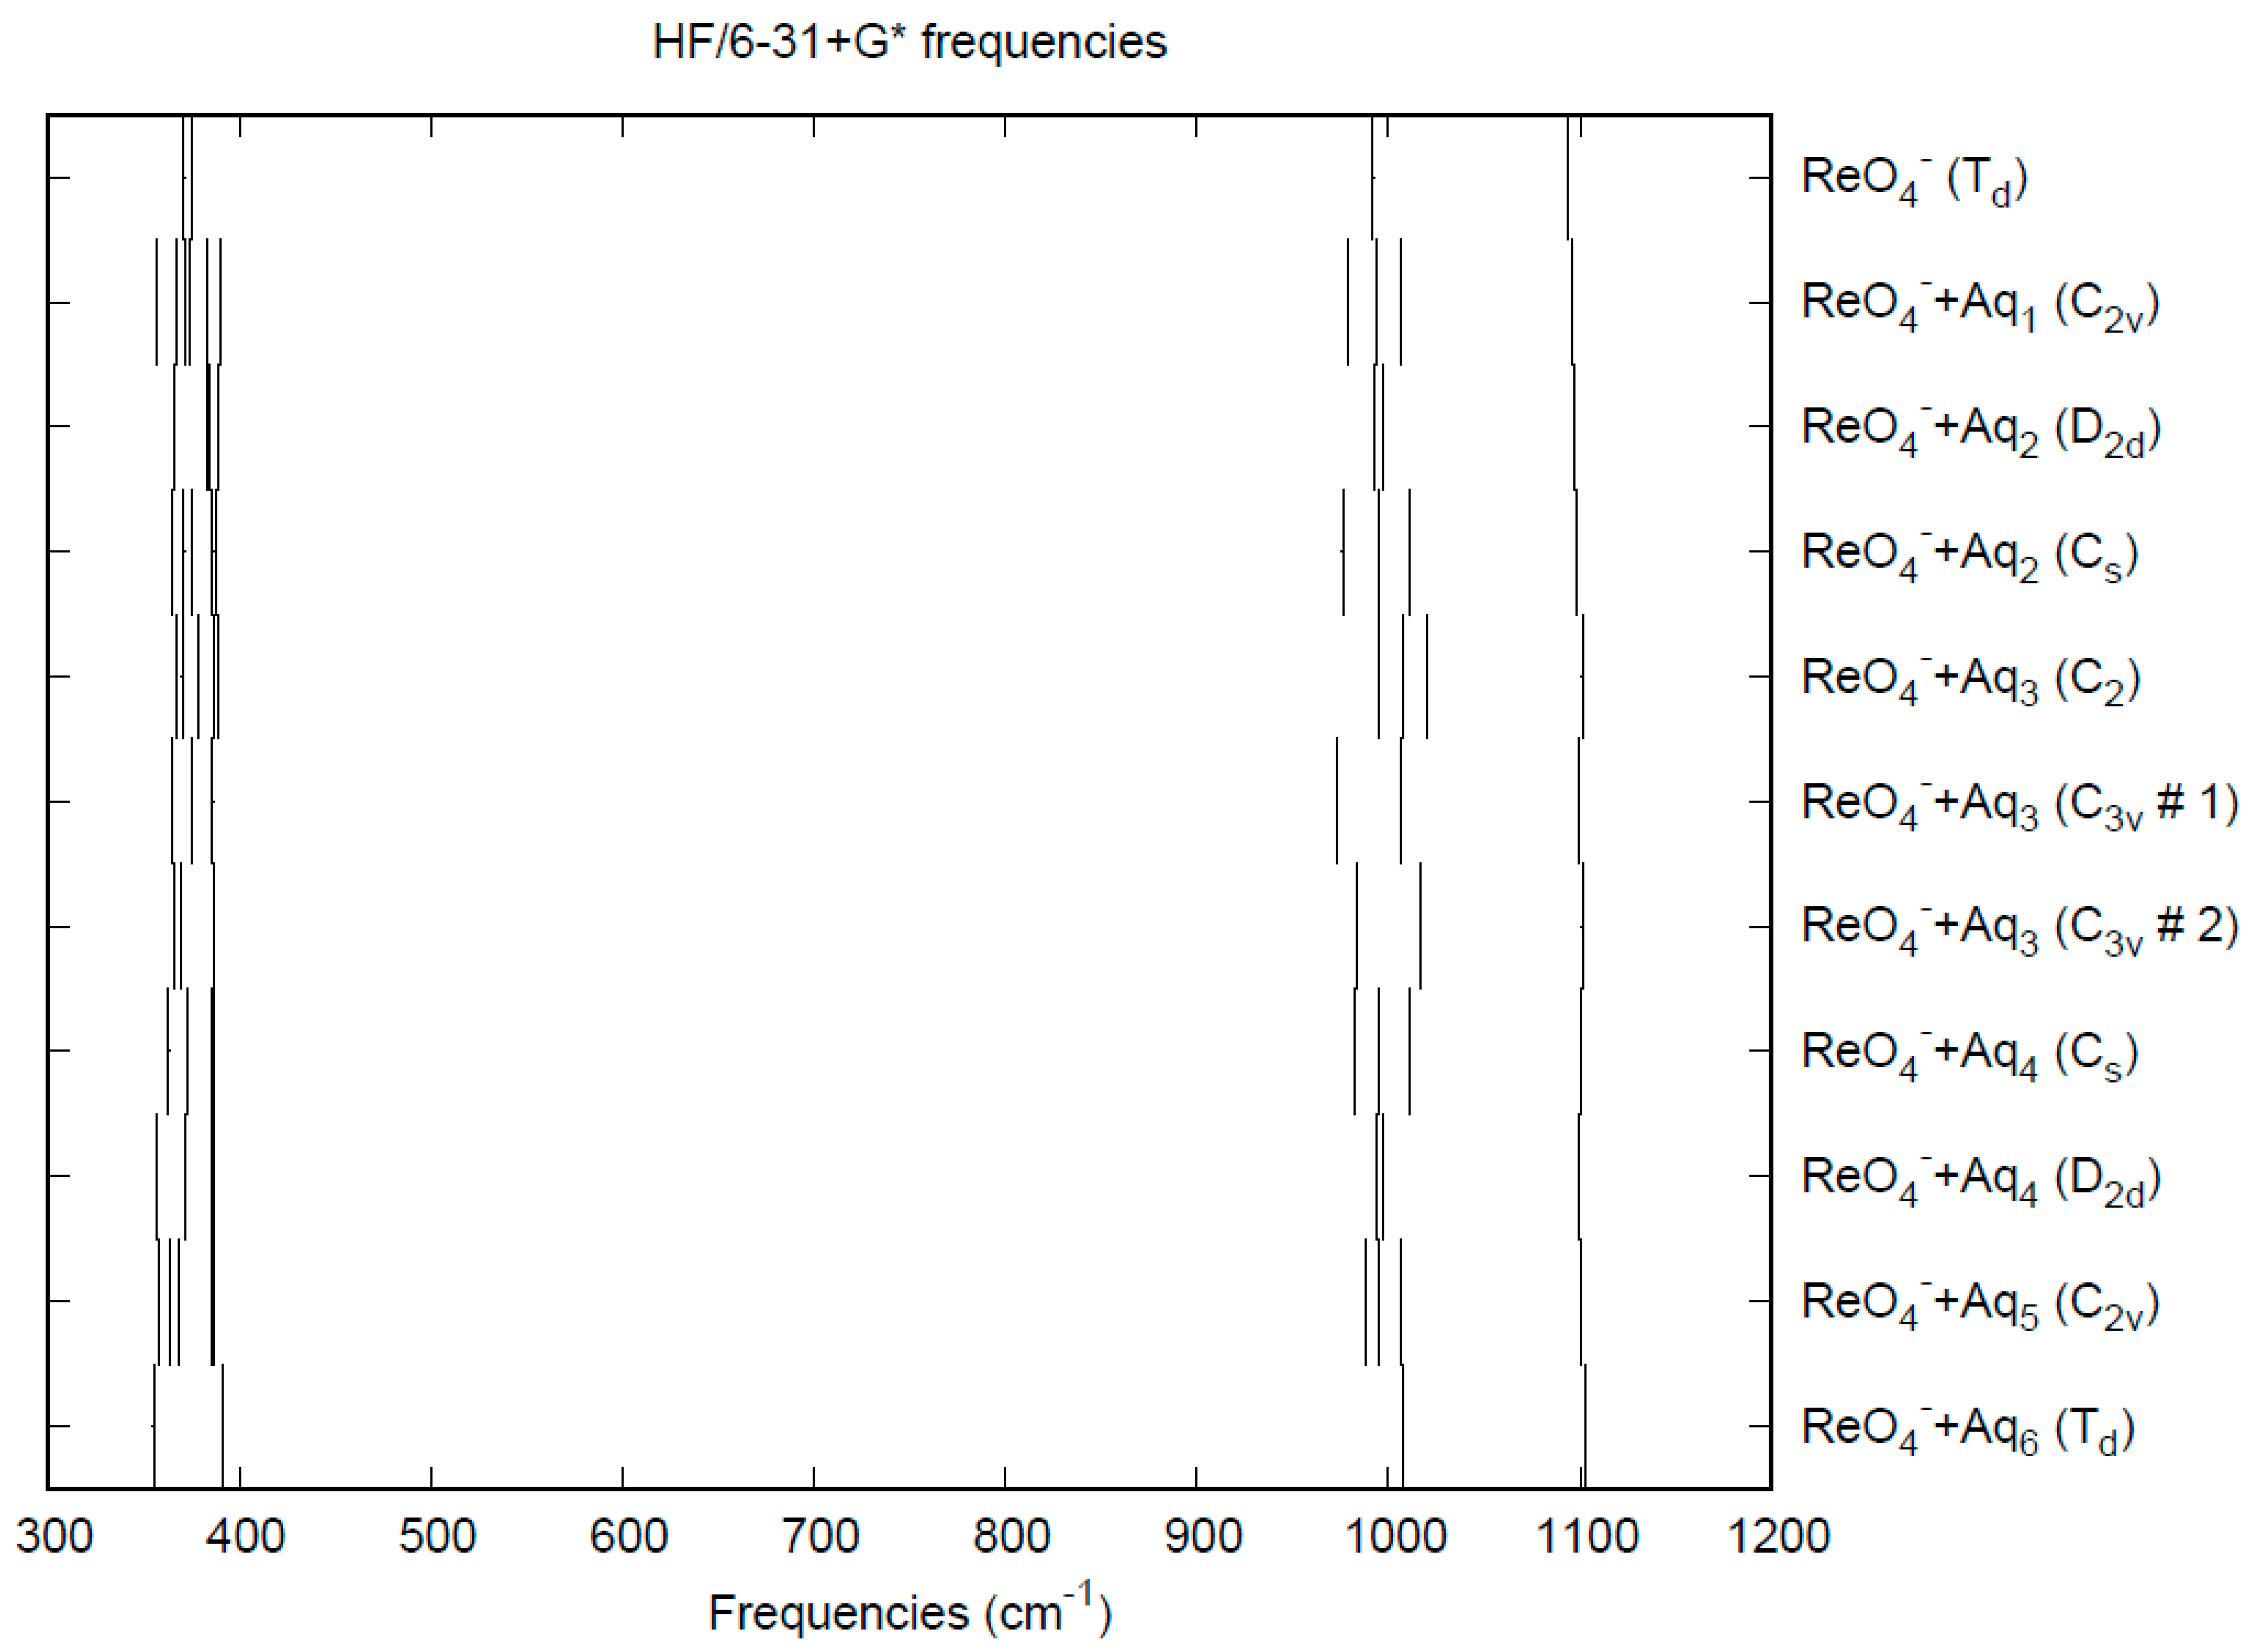
The effect of water upon the Re-O distances (MP2/6-31+G(d)) in ReO4nH2O (n = 0–6) is similar to that of the Tc-O distances in the analogous pertechnetate (Figure S4). The net effect is a slight shortening of the Re-O distance by 0.005 Å (n = 6). The individual Re-O distances vary by up to 0.01 Å (in perchlorate, the variation was larger at 0.02 Å). The Re…O, O…O, and O…H distances are about the same as the corresponding distances in the hydrated pertechnetate (Figures S5–S7). The vibrational frequencies (HF/6-31+G*) as a function of hydration number are shown in Figure 8. The deformation frequencies are lower than in perchlorate and are also much closer together. In addition, the HF/6-31+G* level correctly predicts that the asymmetric stretching mode is lower than the symmetric stretching mode for perrhenate. The effect of hydration is similar to that in perchlorate. In an aqueous solution, the Re-O distance is 1.735(2) Å by LAXS, and the Re…O distance is 4.197(7) Å [48]. While the Re-O distance is well-reproduced by the calculations, the Re…O distance is too short in the hexahydrate. This is mostly rectified in the dodecahydrate model, in which the Re…O distance lies in the range 3.87–4.08 Å, depending on the level of theory.

3.4. Iron, Ruthenium, and Osmium Tetroxide

Iron(VIII) oxide remains unknown. Ruthenium(VIII) oxide occurs in at least two modifications: a cubic form [67] and a monoclinic form [67,68]. The Ru-O distances are 1.696(1) and 1.699(2) Å, respectively. Osmium(VIII) oxide has been studied by both X-ray [69] and (gas phase) electron [70] diffraction. The distances obtained were 1.74(2) and 1.711(3) Å, respectively. The vibrational spectra of these two molecules have been measured by several authors (Table 4). Both molecules contain a tetrahedral MO4 moiety in the gas and solution phase, consistent with the crystal structure of the solids.
The calculated bond lengths and vibrational frequencies for FeO4, RuO4, and OsO4 are given in Table 5. In all cases, the DFT distances are greater than the HF distances. For RuO4 and OsO4, the MP2 distances are longer still, whereas for the hypothetical FeO4, the MP2 distance is slightly shorter than HF. The DFT levels give the best agreement with the M-O distance and vibrational frequencies for RuO4 and OsO4. The MP2 vibrational frequencies are poor in all cases. The CPCM solvation model gives rise to slightly larger M-O distances and usually smaller frequencies.
All attempts to optimize structures of hydrated iron, ruthenium, or osmium(VIII) oxide in which the water was hydrogen-bonded to the oxygen atoms of the metal tetroxide resulted in optimized structures with imaginary modes corresponding to water wagging or partially optimized structures where the water reorients in a wagging motion to approach the metal atom more closely. In the case of iron tetroxide, other structures can form, such as peroxides or ozonides. This is consistent with the supposition that FeVIIIO4 is not the most stable form of iron tetroxide but rather FeVIO22-O2) [77].

3.5. Chromate

The crystal structures of alkali metal chromate salts are known. Early determinations of the anhydrous salts placed the average Cr-O distance as 1.60 Å (Na [78], K [79], Rb [80], Cs [81]). The redetermination of anhydrous potassium chromate (Pnam) [82] gave a Cr-O distance of 1.644 Å (1.670 Å corrected) or 1.646 Å [83]. Other (re)determinations give Li (R 3 ¯ ) [84], 1.653 Å (1.660 Å corr.); Na (Cmcm) [85], neutron diffraction 1.645 Å; Rb (Pnam) [86], 1.632 Å; and Cs (Pnma) [87], neutron diffraction, 1.650(5) Å. Several hydrates of sodium chromate can form, including the tetrahydrate (P21/c) with a Cr-O distance of 1.64(4) Å [88], decahydrate (P21/c) and sesquihydrate (F2dd) with Cr-O distances of 1.646(7) and 1.652(5) Å, respectively [89]. The crystal structure of the hexahydrate remains unknown, presumably because of its narrow stability range (19.525–25.90 °C) [90,91].
The resonance Raman spectrum of aqueous chromate ion was measured with the 514.5 and 363.8 nm argon laser lines by Kiefer and Bernstein [32]. The Cr-O stretching bands at 848 (ν1-A1), 887 (ν3-T2), 350 (ν2-E), and 369 cm−14-T2) were observed with the 514.5 nm line. For the 363.8 nm line, only the stretching modes at 848 (ν1-A1) and 890 (ν3-T2) were observed, as well as several overtones nν1 and combination ν1+ ν3, were observed in light and heavy water. Early Raman work by Venkateswaran [92] gave bands at 840–860 (ν1-A1), 874–879 (ν3-T2), 481–486 (ν2-E), and 503–513 (ν4-T2) cm−1. Stammreich et al. observed aqueous solutions of sodium, potassium, and ammonium chromate using the He 587.56 nm line [93], and found Raman shifts of 847 (ν1-A1), 884 (ν3-T2), 348 (ν2-E), and 368 (ν4-T2) cm−1. Weinstock et al. observed, using a He-Ne laser at 633 nm, the normal Raman spectrum of K2CrO4(aq) [33] and found bands at 846 ± 1 (ν1-A1), 890 ± 4 (ν3-T2), 349 ± 2 (ν2-E), and 368 ± 2 (ν4-T2) cm−1. In their study of the chromate—dichromate--hydrogen chromate equilibria, the values obtained by Michel and Machiroux [94] were 846, 887, 348, and 371 cm−1. The aqueous IR and EXAFS spectrum were measured by Hoffmann and coworkers [95], who observed the chromate band at 880 ± 1 cm−1 at pH 8.5. The EXAFS analyses (pH = 13) gave a Cr-O distance of 1.660(3) and 1.656(3) Å using two models.
The calculated bond lengths and vibrational frequencies for CrO42− are given in Table 6. The Hartree-Fock distances are about 0.05 Å too short compared to the experiment, but the MP2 distances are about 0.05 Å too long. The B3LYP distances are very close. The Hartree-Fock frequencies are overestimated. The MP2 stretching frequencies are also overestimated, which is somewhat unusual. In addition, HF places the ν1-A1 band above the ν3-T2 band by 30–50 cm−1, whereas MP2 reverses this order by 20–70 cm−1. Only the DFT frequencies (and MP2 deformation frequencies) are reasonably close to the experiment. The CPCM solvation model gives rise to smaller Cr-O distances.
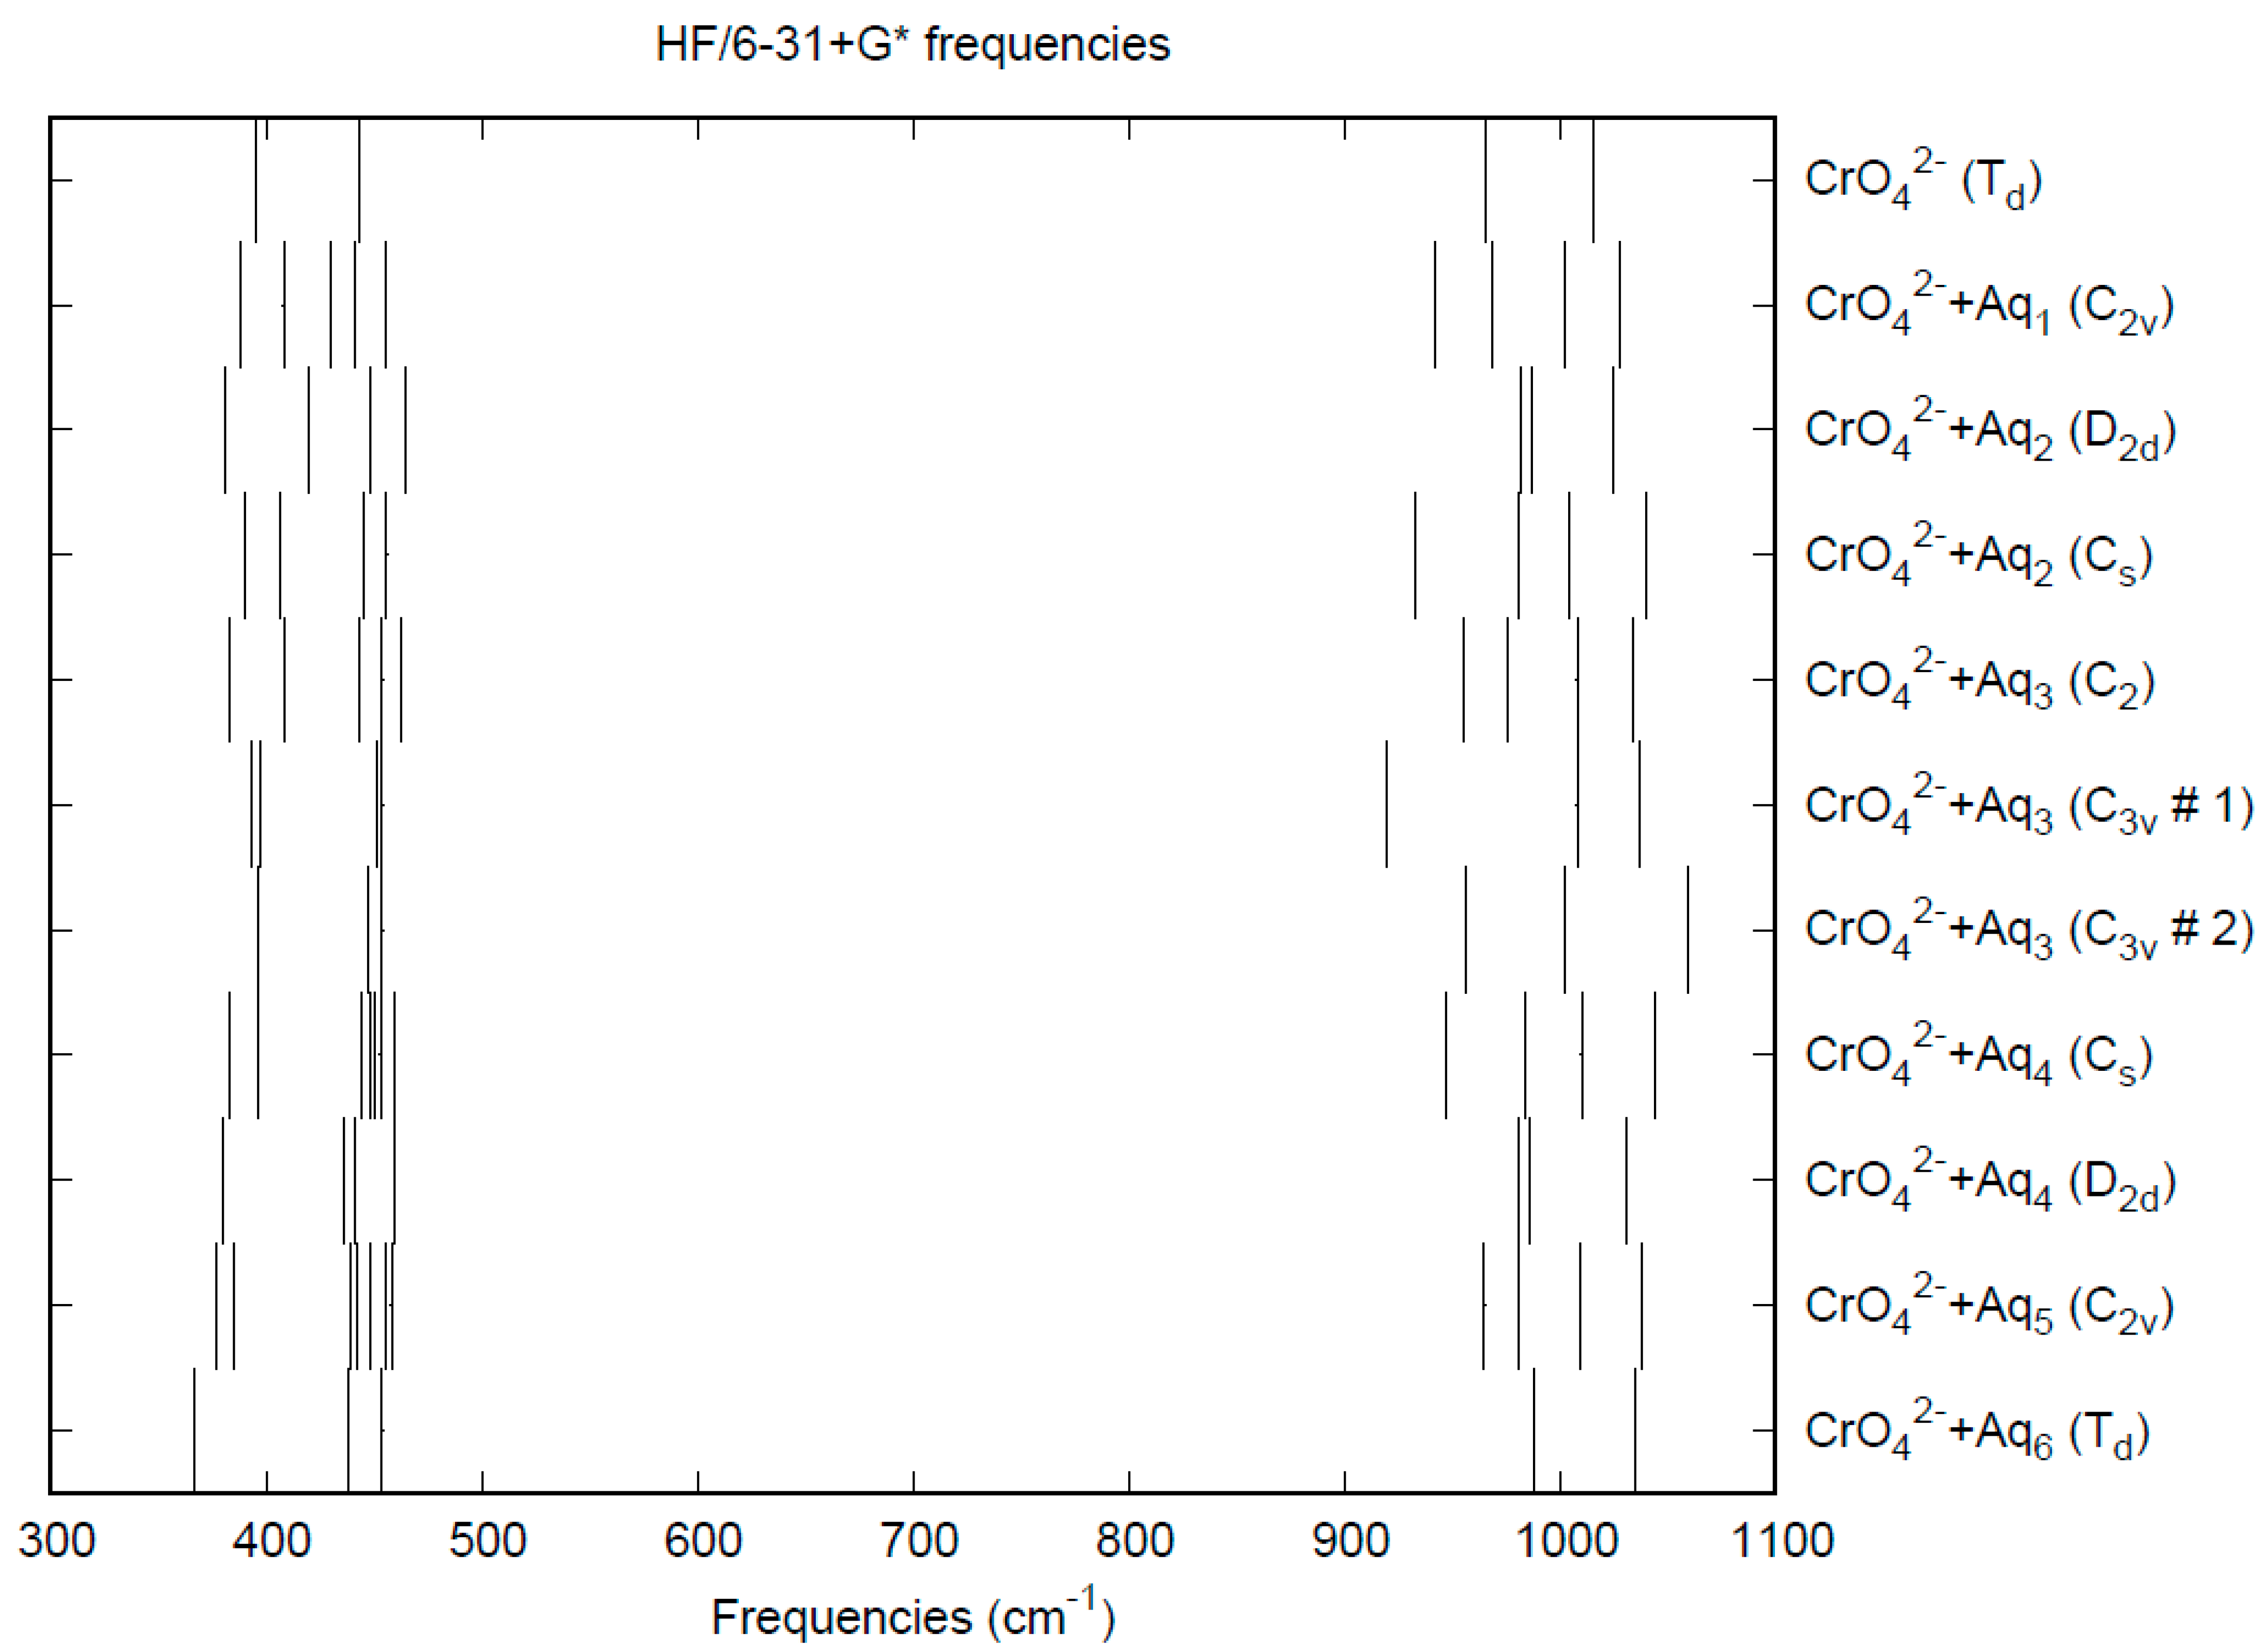
The effect of water upon the Cr-O distances (MP2/6-31+G(d)) in CrO42−nH2O (n = 0–6) is given in Figure 9. The net effect is a moderate shortening of the Cr-O distance by 0.01 Å (n = 6). The individual Cr-O distances vary by up to 0.05 Å (in perchlorate, the variation was smaller at 0.02 Å). The Cr…O distance is about the same as the corresponding distance in the hydrated permanganate (Figure S8), although there is less variation within a particular species. For the O…H and O…O distances, the increase of about 0.1 Å upon going from mono to hexahydrate is much more pronounced than permanganate, although the spread within a species is about half (O…H) to the same (O…O) (Figures S9 and S10). The vibrational frequencies (HF/6-31+G*) as a function of hydration number are shown in Figure 10. The frequencies are lower than in permanganate. In addition, the HF/6-31+G* level predicts that the asymmetric stretching mode is lower than the symmetric stretching mode for chromate, whereas experimentally, the modes are reversed. The effect of hydration is similar to that in permanganate, except that the splitting within degenerate modes is about twice as large, which makes it more difficult to correlate the two stretching modes because of the overlap. In an aqueous solution, the Cr-O distance is 1.660(3) Å by LAXS, and the Cr…O distance is 3.955(5) Å [48]. While the Cr-O distance is well-reproduced by the calculations, the Cr…O distance is too short in the hexahydrate. This is rectified in the dodecahydrate model, in which the Cr…O distance lies in the range of 3.78–3.88 Å, depending on the level of theory.

3.6. Molybdate

Numerous authors have investigated the crystal structures of alkali metal molybdate salts. The space group of anhydrous lithium molybdate was determined to be P32 by Barinova et al. [96]. The average Mo-O distance was 1.768 Å. However, Yip et al. argued [97] that the correct space group was R 3 ¯ , as shown previously by Kolitsch [98] between 103 and 293 K (1.764 Å), whereas Zachariasen [99] suggested that P 3 ¯ was correct. Anhydrous sodium molybdate was shown to exist in four modifications [100] between 623 and 923 K: α (Fd-3m), β (unknown), γ (Fddd), and δ (P63/mmc) by powder diffraction. The low-temperature α-form was confirmed and refined by Fortes [101] using neutron powder diffraction (Mo-O = 1.7716 Å). Anhydrous potassium molybdate was found [102] to crystallize in the space group C2/m, with Mo-O distance of 1.76(1) Å. A powder diffraction study of anhydrous potassium, rubidium, and cesium molybdate [103] provided cell constants and fractional coordinates of the metal atoms, but the oxygen atoms were not located. Later, annealed anhydrous rubidium molybdate (Pnam) was found [104] to have an Mo-O distance of 1.75(2) Å. Anhydrous cesium molybdate was found [105] to crystallize in the space group Pcmn, with a Mo-O distance of 1.773 Å (corrected 1.792 Å). In addition to anhydrous salts, sodium molybdate dihydrate is also known. Mitra and Verma found [106] a space group Pcba with an average Mo-O distance of 1.82(3) Å (octahedrally coordinated). Other authors found tetrahedral coordination. Atovmyan et al. found [107] a space group of Pcab with an average Mo-O distance of 1.76(6) Å. A (re)determination by Matsumoto et al. gave [108] space group Pbca, Mo-O distance of 1.772(14) Å. Another redetermination by Capitelli (Pbca) gave Mo-O distances of 1.767(10) Å and also located the hydrogen atoms [109]. Neutron powder diffraction was used by Fortes [110] (Pbca) to give Mo-O distances of 1.766(10) Å. The consensus for a Mo-O distance of 1.77 Å is clear.
Early Raman work by Venkateswaran [92] gave the molybdate frequencies of 897–944 (ν1-A1), 841–896 (ν3-T2), 218–241 (ν2-E), and 317–361 cm−14-T2). Busey and Keller [54] found Raman bands at 897 (ν1-A1), 841 (ν3-T2), and 318 cm−1 (either ν2-E or ν4-T2) for sodium molybdate. Weinstock et al. [33] measured sodium molybdate at 897 (ν1-A1), 837 (ν3-T2), 317 (ν2-E, R), and 325 cm−14-T2, IR). Dean and Wilkinson [111] gave an accurate value of 986.1 cm−1 for the value of ν1-A1 extrapolated to infinite dilution.
The calculated bond lengths and vibrational frequencies for MoO42− are given in Table 7. The Hartree-Fock distances are slightly too short (0.01 Å) compared to the experiment, but the MP2 distances are about 0.06 Å too long. The B3LYP distances are slightly too long (0.03 Å). It seems that this example is unusual compared to the others in that the Hartree-Fock distances are closest to X-ray diffraction results. The Hartree-Fock frequencies overestimate the experiment, whereas the MP2 and B3LYP frequencies underestimate it. In addition, HF and B3LYP place the ν1-A1 band above the ν3-T2 band, whereas MP2 reverses this order. The B3LYP frequencies are closest to the experiment. The CPCM solvation model gives rise to smaller Mo-O distances and larger A1 frequencies.
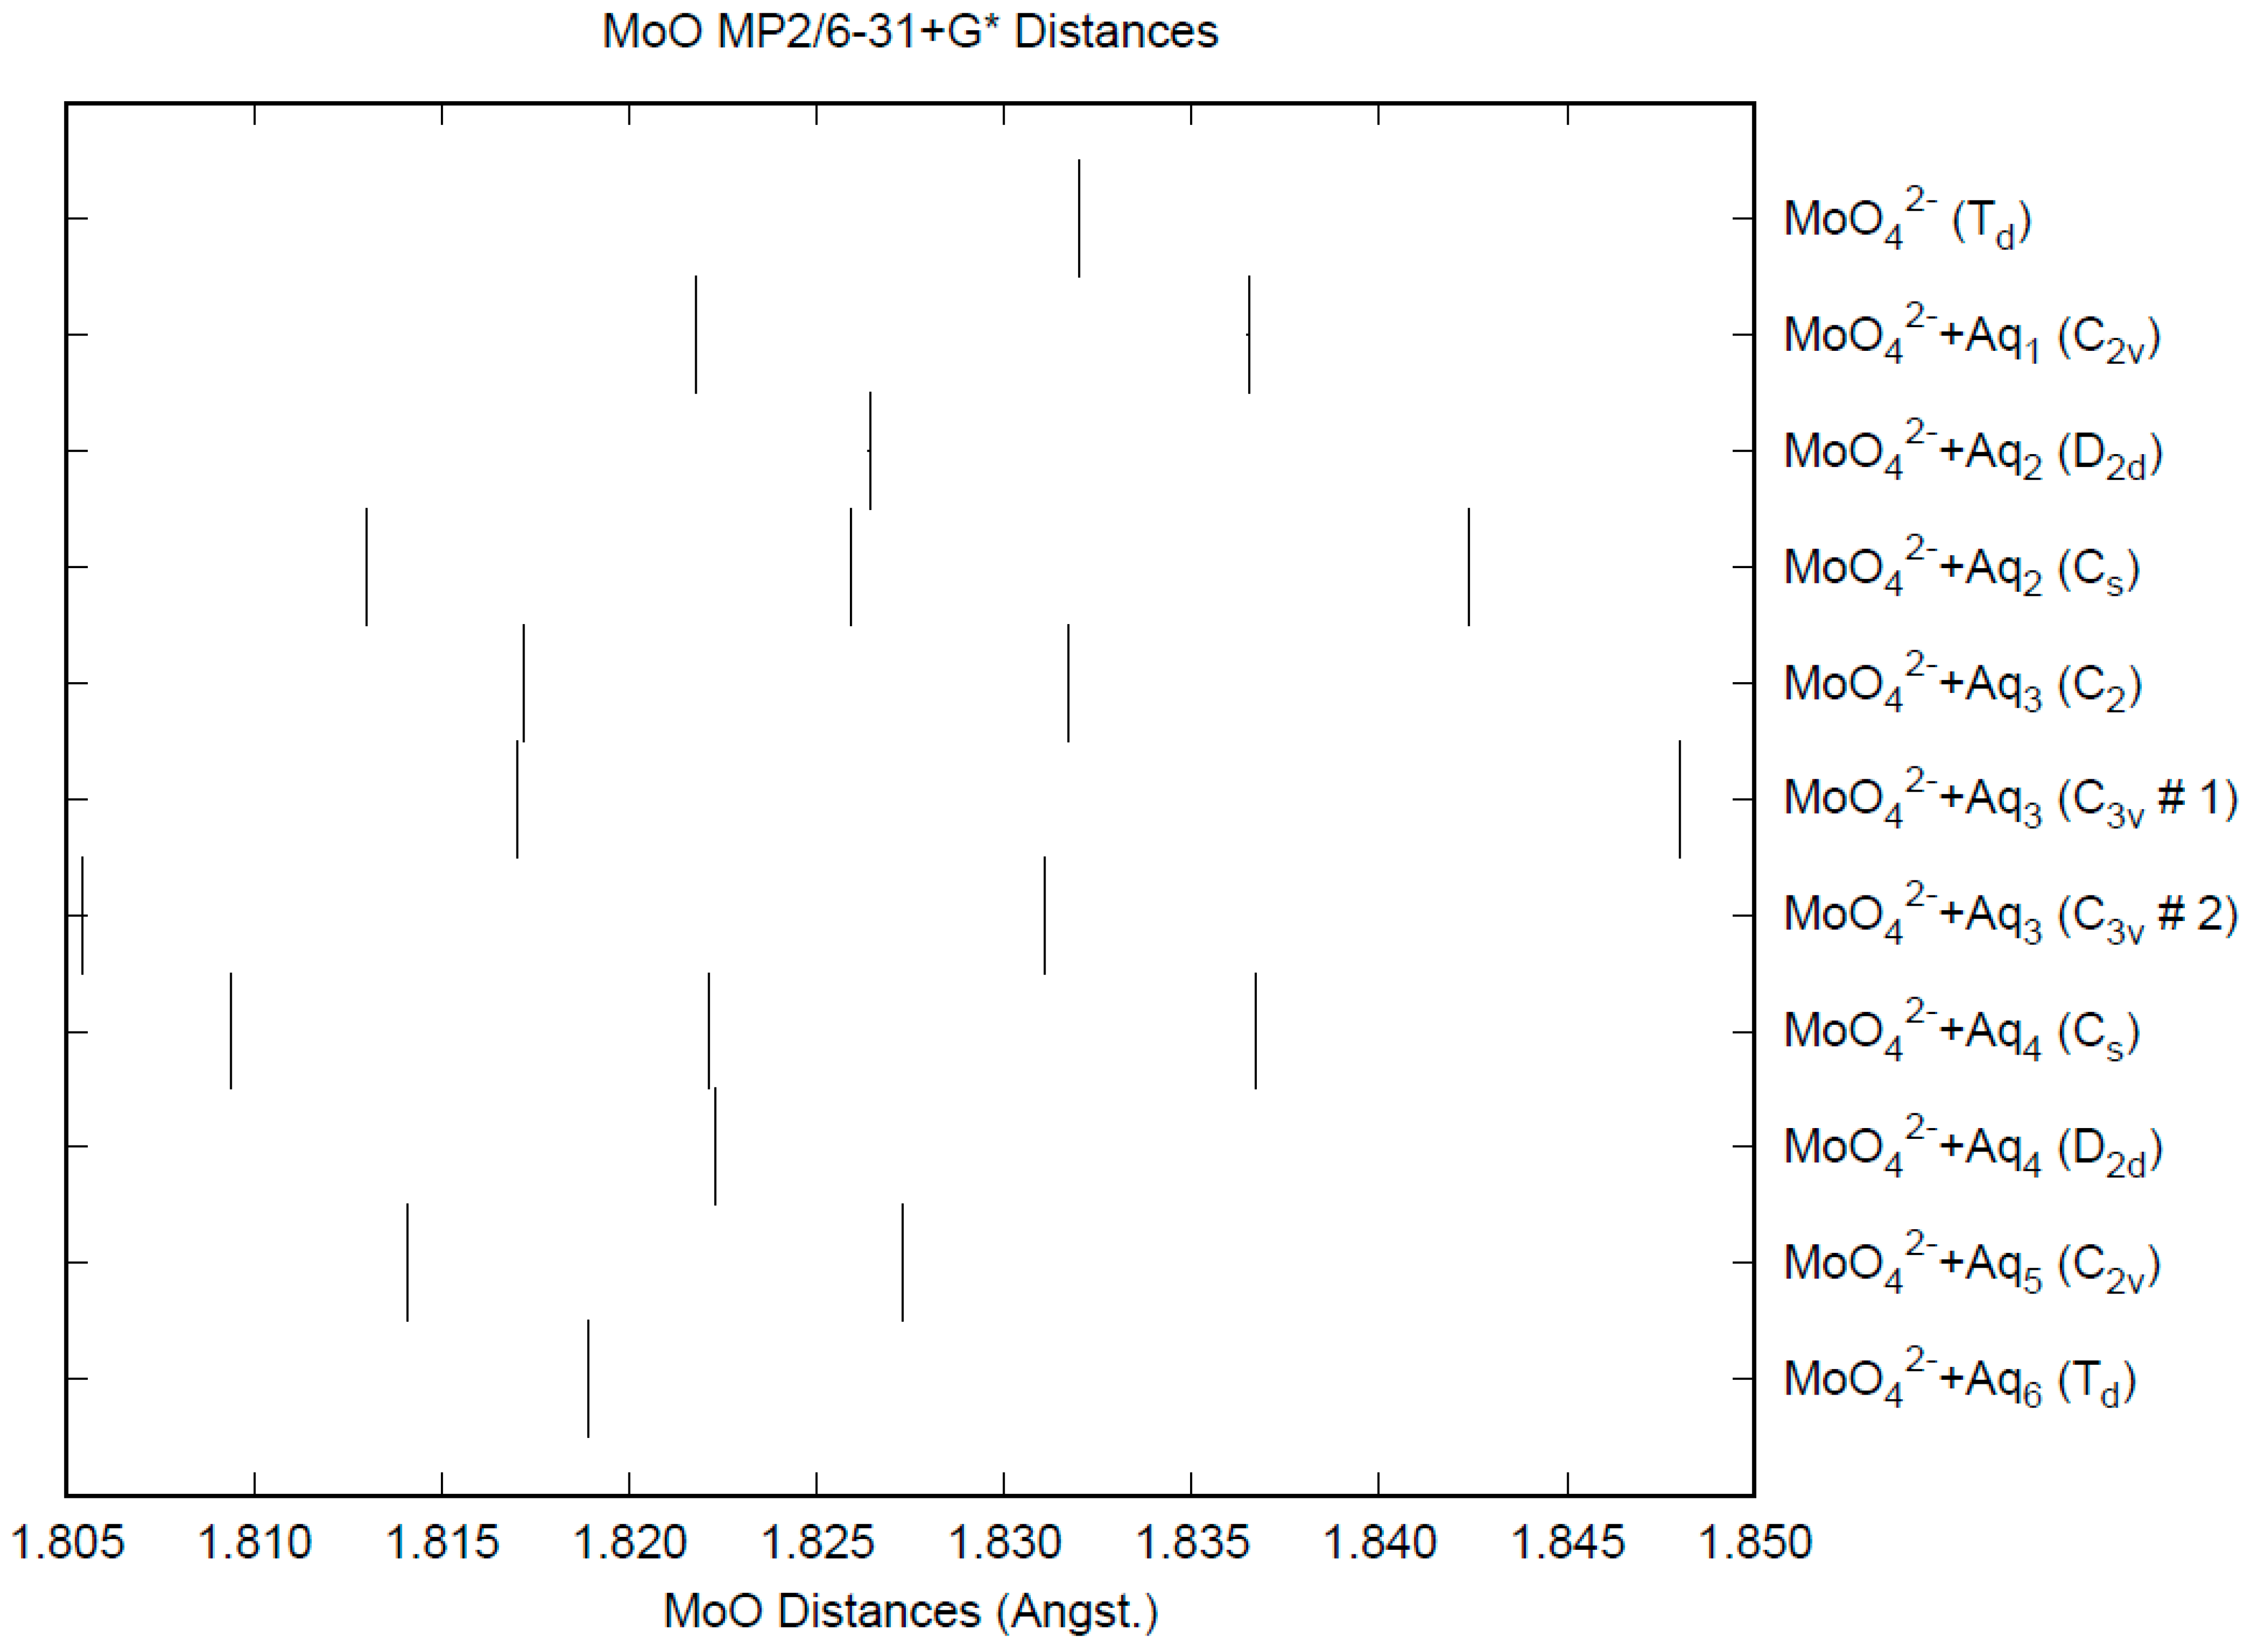
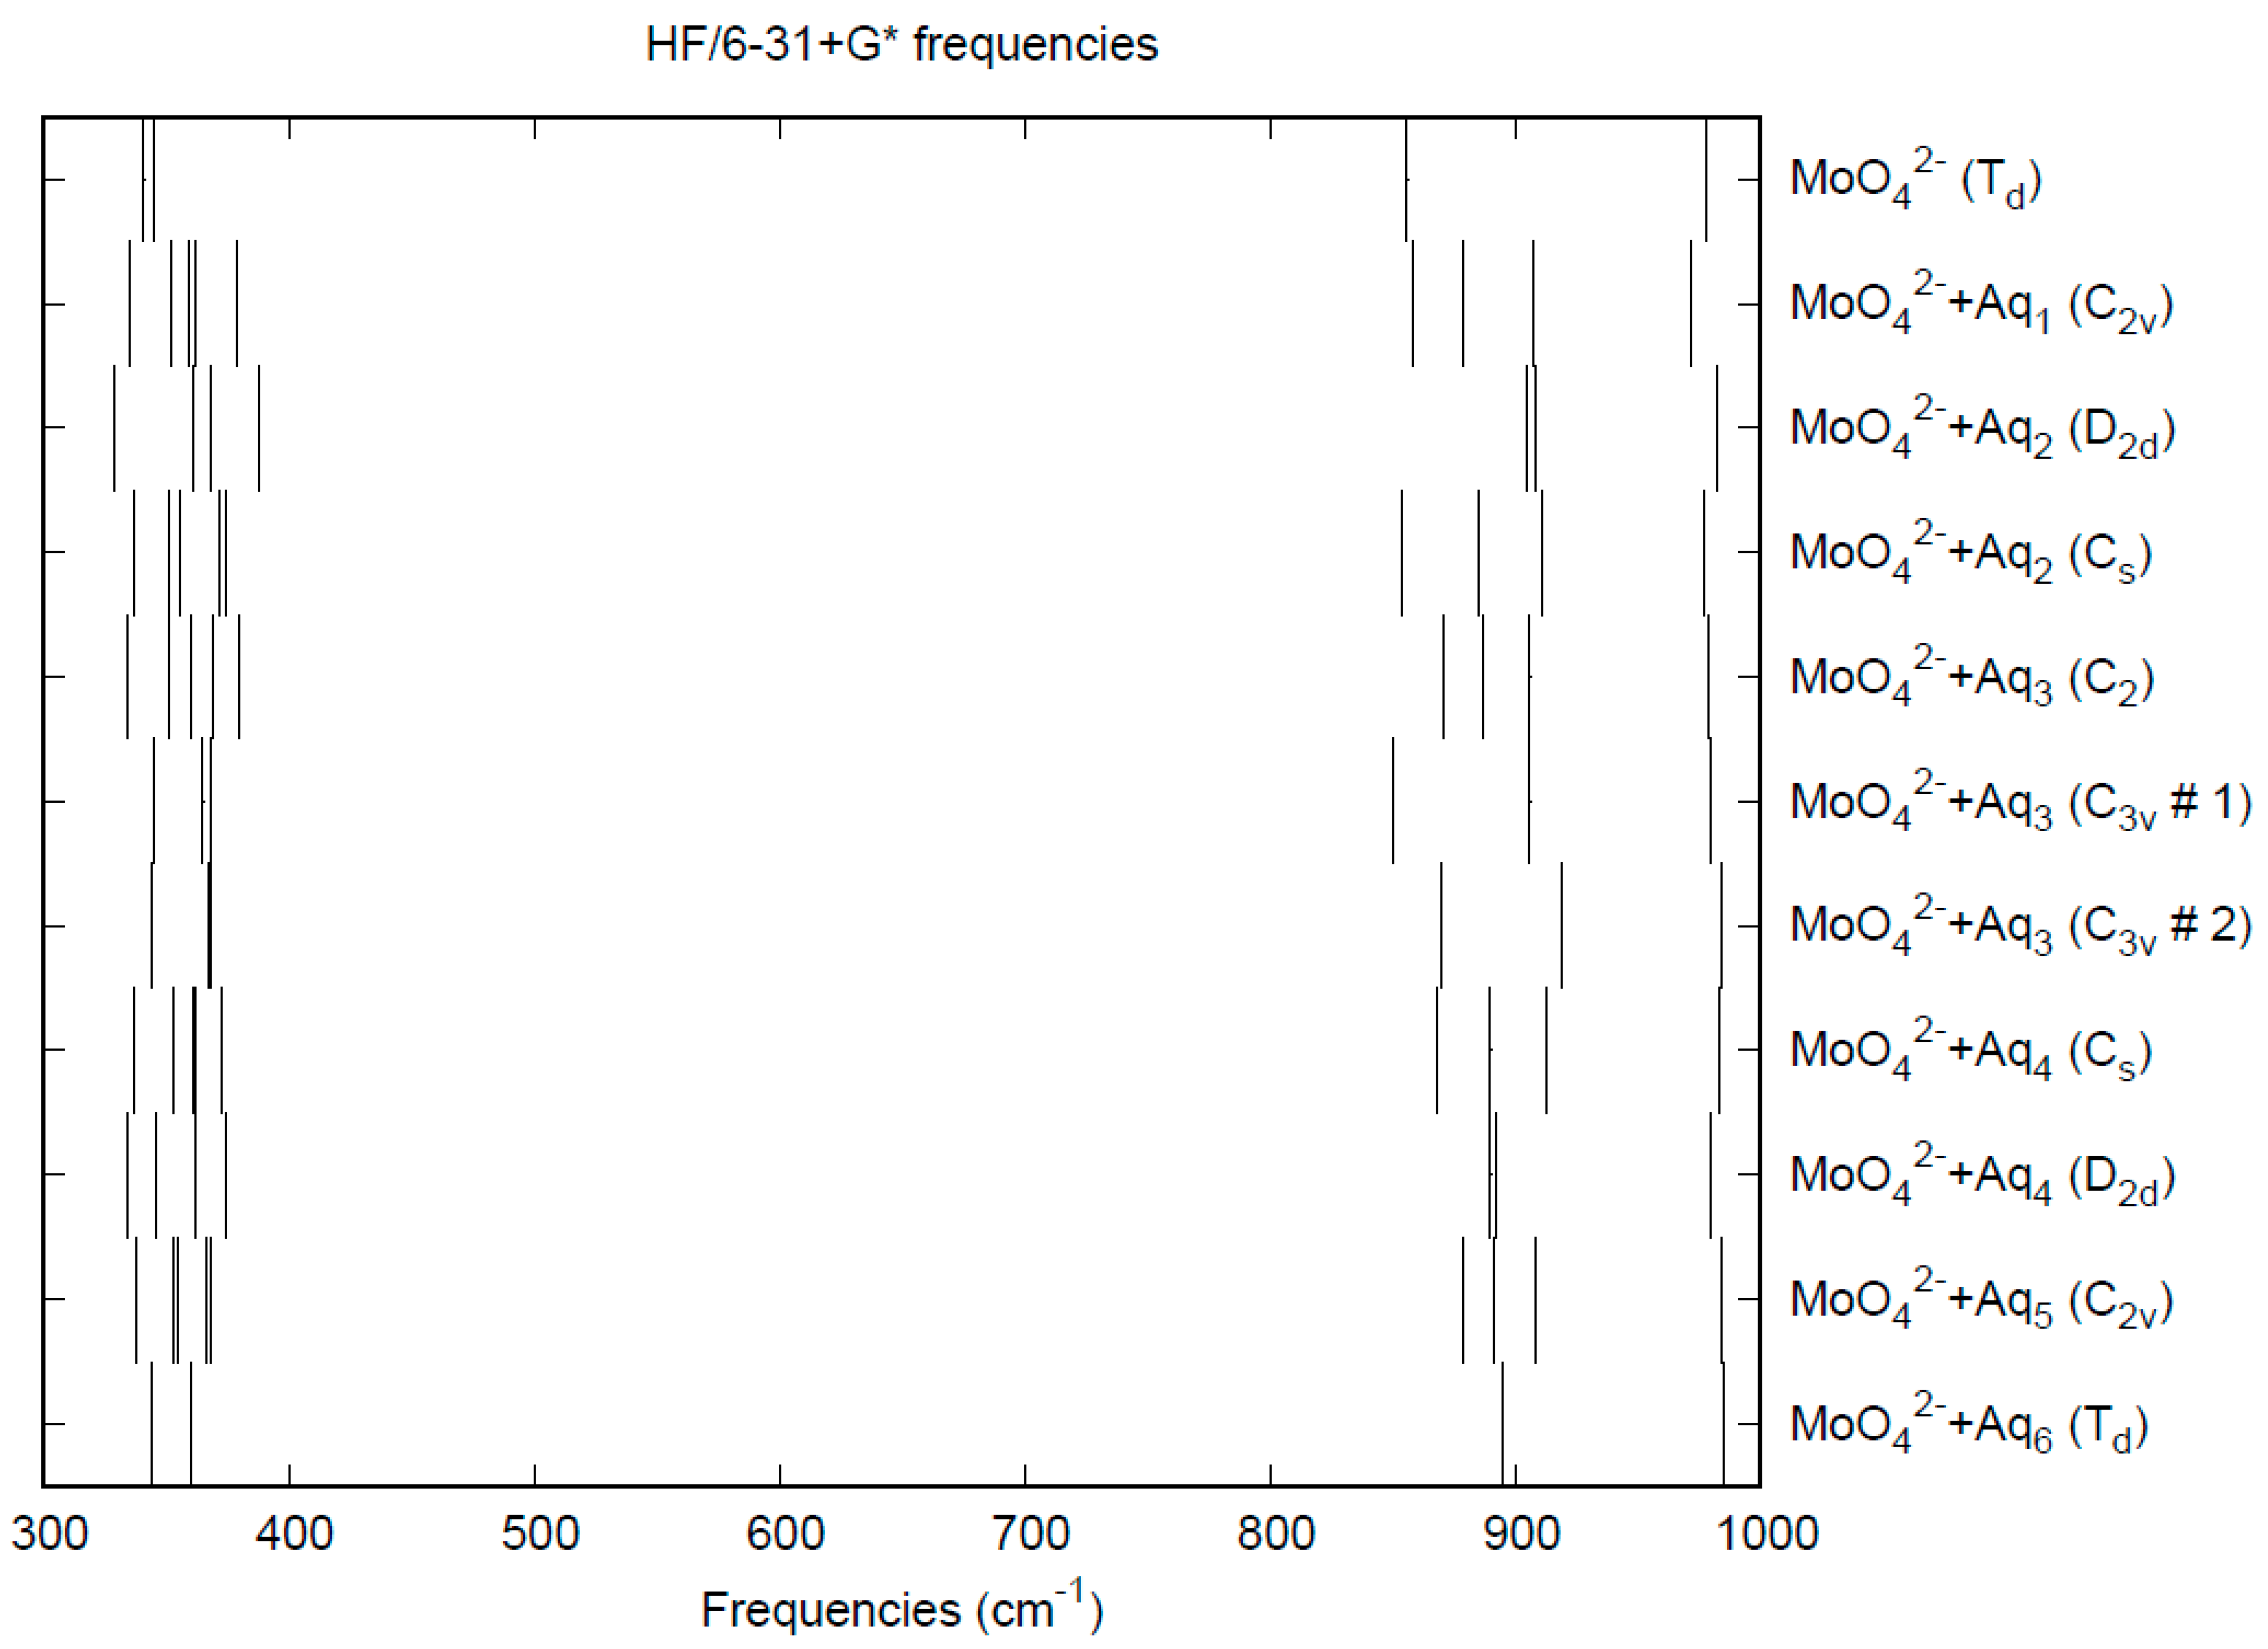
The effect of water upon the Mo-O distances (MP2/6-31+G(d)) in MoO42−nH2O (n = 0–6) is given in Figure 11. The net effect is a moderate shortening of the Mo-O distance by 0.013 Å (n = 6). The individual Mo-O distances vary by up to 0.025 Å (in chromate, the variation was larger at 0.05 Å). The Mo…O distance is about 0.1 Å larger/smaller than the corresponding distance in the hydrated chromate/pertechnetate (Figure S11), although there is less variation within a particular species. For the O…H and O…O distances, the increase of about 0.1 Å upon going from mono to hexahydrate is much similar to chromate, although the spread within a species is about half (Figures S12 and S13). In 2M sodium molybdate solution, the Mo-O (Mo…O) distance was found to be 1.786(8) (4.06(2)) Å by LAXS [112]. The vibrational frequencies (HF/6-31+G*) as a function of hydration number are shown in Figure 12. The frequencies are lower than in pertechnetate and chromate. The effect of hydration is similar to that in chromate, except that the splitting within degenerate modes is somewhat smaller. The splitting is still large enough to obfuscate the correlation between the two deformation modes because of the overlap. In an aqueous solution, the Mo-O distance is 1.775(4) Å by LAXS, and the Mo…O distance is 4.010(3) Å [48]. While the Mo-O distance is well-reproduced by the calculations, the Mo…O distance is too short in the hexahydrate. This is rectified in the dodecahydrate model, in which the Mo…O distance lies in the range of 3.82–3.94 Å, depending on the level of theory.

3.7. Tungstate

The crystal structures of alkali metal tungstates have been investigated. Zachariasen and Plettinger showed [113] that anhydrous lithium tungstate has space group R 3 ¯ , with W-O bonds of 1.79(2) Å. Okada et al. showed [114] that anhydrous sodium tungstate has space group Fd3m, with W-O bonds of 1.819(8) Å. This was revisited by Fortes [101] ( F d 3 ¯ m ), who found a somewhat shorter length of 1.7830(2) Å using neutron diffraction. Anhydrous potassium tungstate crystallizes [115] in the space group C2/m, with a W-O distance of 1.79(2) Å. Powder diffraction on anhydrous potassium, rubidium, and cesium tungstate [103] provided cell constants and fractional coordinates of the metal atoms, but as with the molybdates, the oxygen atoms were not located. By neutron powder diffraction [104], it was found that rubidium tungstate crystallizes in the space group C2/m, W-O = 1.775(9) Å. To the best of our knowledge, the crystal structure of cesium tungstate remains unknown.
Early Raman work by Venkateswaran [92] gave the tungstate frequencies at 934 (ν1-A1), 840 (ν3-T2), 325 (ν2-E), and 452 cm−14-T2). Busey and Keller [54] found IR and Raman bands at 928–931 (ν1-A1), 813–855 (ν3-T2), 335 cm−1 (either or both ν2-E, ν4-T2) for sodium tungstate powder (anhydrous and dihydrate). Weinstock et al. [33] measured the Raman spectrum of sodium tungstate and found bands at 931 (ν1-A1), 838 (ν3-T2), and 325 cm−1 (either or both ν2-E, ν4-T2). Dean and Wilkinson [111] gave an accurate value of 931.1 cm−1 for the value of ν1-A1 extrapolated to infinite dilution.
The calculated bond lengths and vibrational frequencies for WO4 are given in Table 8. With the experimental distances spanning the range from 1.775–1.819 Å, the Hartree-Fock distances are at the low end of this range, and the B3LYP distances are at the high end. The MP2 distances are somewhat too long. The Hartree-Fock frequencies overestimate the experiment, whereas the B3LYP frequencies underestimate it by about the same amount. The MP2 frequencies underestimate the experiment a bit more, which matches the inverse trend expected with bond length. All methods correctly place the ν1 band higher than ν3 and predict the near degeneracy of the ν2 and ν4 bands. The CPCM solvation model gives rise to slightly smaller W-O distances and larger stretching frequencies.
The effect of water upon the W-O distances (MP2/6-31+G(d)) in WO42−nH2O (n = 0–6) is given in Figure S14. The net effect is a moderate shortening of the W-O distance by 0.012 Å (n = 6). The individual W-O distances vary by up to 0.015 Å, which is smaller than in chromate and molybdate. The W…O distance is about the same as the corresponding distance in the hydrated molybdate (Figure S15), although there is less variation within a particular species. For the O…H and O…O distances, the increase of about 0.1 Å upon going from mono to hexahydrate is much similar to molybdate, as are the actual values, although the spread within a species is about half (Figures S16 and S17). In 2M sodium tungstate solution, the W-O (W…O) distance was found to be 1.786(8) (4.06(2)) Å by LAXS [112]. The vibrational frequencies (HF/6-31+G*) as a function of hydration number are shown in Figure 13. The frequencies are slightly lower than in molybdate, except for ν1. The effect of hydration is similar to that in molybdate, except that the splitting within degenerate modes is somewhat smaller. As with molybdate, the splitting is still large enough to obfuscate the correlation with the two deformation modes because of the overlap. In an aqueous solution, the W-O distance is 1.797(4) Å by LAXS, and the W…O distance is 4.024(4) Å [48]. While the W-O distance is well-reproduced by the calculations, the W…O distance is too short in the hexahydrate. This is rectified in the dodecahydrate model, in which the W…O distance lies in the range 3.82–3.94 Å, depending on the level of theory.

3.8. Niobates

Unlike the previously mentioned anions, the experimental evidence for the existence of orthoniobate (NbO43−), especially in aqueous solution, is scant. We therefore review some of the literature on the complex chemistry of the Nb2O5·M2O·H2O (M = Li, Na, K, Rb, Cs) phase diagrams and the compounds therein.
Studies of niobium oxide [116,117] and the phase equilibria with lithium [118], sodium [119], potassium [120], rubidium [121], and cesium [122] carbonate/oxide were carried out by Reisman and coworkers. Amorphous niobium oxide, upon heating, converts to the γ-phase at 435 °C, which then converts to the α-phase at 830 °C before melting at 1491 °C. The existence of the previously identified β and δ phases as equilibrium phases was ruled out [116]. A metastable ε-phase was observed between 1300–1500 °C [117]. Lithium niobates form with a niobium to lithium ratio of 14:1 (Li2Nb28O71), 4:1 (Li2Nb8O21), 1:1 (LiNbO3), and 1:3 (Li3NbO4) [118]. Only LiNbO3 could be readily indexed from powder X-ray diffraction. Sodium niobates form at the same ratios, and all could be indexed [119]. Potassium niobates form at ratios of 22:3 (K6Nb44O113), 3:1 (KNb3O8), 3:2 (K4Nb6O17), 1:1 (KNbO3), and 1:3 (K3NbO4) [120]. The metastable 7:6 and 6:7 compounds may also form [123]. Rubidium niobates form at ratios of 15:2 (Rb4Nb30O77), 4:1 (Rb2Nb8O21), 11:4 (Rb8Nb22O59), 2:1 (Rb2Nb4O11), 3:2 (Rb4Nb6O17), 1:1 (RbNbO3), 3:4 (Rb8Nb6O19), and 1:4 (Rb8Nb2O9) [121]. Cesium niobates form at ratios of 15:2 (Cs4Nb30O77), 13:5 (Cs5Nb13O35), 2:1 (Cs2Nb4O11), 3:2 (Cs4Nb6O17), and 1:1 (CsNbO3) [122]. From these results, it appears that compounds of stoichiometry M3NbO4 only exist for M = Li, Na, and K.
The structures of these compounds have proven difficult to elucidate. Powder diffraction gives the intensity of the scattered waves (X-ray, neutron, electron) as a function of scattering angle 2θ, which generally uniquely characterizes the compound. If this can be indexed, then the unit cell parameters and sometimes the space group can be identified. In favorable cases, a single crystal can be grown, and the related technique of X-ray crystallography may be applied.

3.8.1. Niobium Oxides

Early work on the oxides of niobium suggested the existence of three polymorphs of Nb2O5, the low (T), medium (M), and high (H)-temperature forms, and the powder diffraction patterns were measured (copper-Kα) [124]. The H-form of Brauer appears to be equivalent to the α-form of Reisman [116], who was able to index to a monoclinic cell, a = 21.34 Å, b = 3.816 Å, c = 19.47 Å, β = 120.33°. A crystal structure of this form was determined by Gatehouse and coworkers (P2, a = 21.16 Å, b = 3.822 Å, c = 19.35 Å, β = 119.83°) [125]. The structure consists of three types of building blocks: a slab consisting of edge-shared 3 × 5 NbO6 octahedra, a slab of edge-shared 3 × 4 NbO6 octahedra, and two tetrahedral holes, one of which consisted of NbO4 tetrahedra. The tetrahedra contain Nb-O distances of 1.65(5) and 1.68(5) Å. The structure was refined by Kato (P2/m, a = 21.153 Å, b = 3.8233 Å, c = 19.356 Å, β = 119.80°) [126], who altered the space group by delocalizing the tetrahedra over both holes. The Nb-O distance in the tetrahedra was altered to 1.826 Å. Hahn’s niobium(V) oxide appears to be the low-temperature T-form [127], as do the forms examined by Frevel [128] and Nolander [129] (Pba2 or Pbam, a = 6.170 Å, b = 29.25 Å, c = 3.928 Å). Single-crystal X-ray diffraction was carried out by Kato and Tamura [130] (Pbam, a = 6.175 Å, b = 29.175 Å, c = 3.930 Å). The structure consists of sheets of 6- (octahedral) or 7-coordinated (pentagonal bipyramidal) niobium atoms, along with some nine-coordinate interstitial niobium atoms. A single-crystal X-ray diffraction study of the M-form was carried out by Mertin and coworkers [131] (I4/mmm, a = 20.44 Å, b= 3.832 Å), who found sheets of 4 × 4 corner linked niobium octahedra that are edge-linked to other 4x4 sheets. The crystal structure of ζ-Nb2O5 was solved by Laves et al. [132] (B2/b, a = 12.73 Å, b = 5.56 Å, c = 4.88 Å, γ = 105.08°) and consists of a dense network of NbO6 octahedra. The crystal structure of another form, N-Nb2O5, was solved by Andersson [133] (C2/m, a = 28.51 Å, b = 3.830 Å, c = 17.48 Å, β = 120.80°). The structure is composed of 4 × 4 blocks of NbO6 octahedra. Powder diffraction gives slightly different values [134] (C2/m, a = 28.53 Å, b = 3.827 Å, c = 17.58 Å, β = 125.10°). We speculate that it may be possible to make in situ small amounts of transient NbO43− or its protonated forms by partial dissolution of the H-form, which already contains some tetrahedral niobium(V).

3.8.2. Lithium Niobates

There are several known structures for lithium niobates. Lithium orthoniobate, Li3NbO4, was studied by Blasse [135], who determined a cubic form from powder X-ray diffraction with a = 8.433 Å and also located the niobium atoms. It was also studied by Grenier et al. [136], who found cubic forms for both the low (Fm3m, a = 4.212 Å) and high (I23, a = 8.429 Å) temperature modifications using powder X-ray diffraction. In the low-temperature form (I), the cations were randomly distributed, whereas, in the high-temperature form (II), powder neutron diffraction gives a tetrahedral grouping of niobium octahedra, with lithium octahedra completing the 3D network. The structure might be viewed as a Nb4O4 core bound to 12 additional oxygens to form Nb4O1612−, held together by Li+ ions. The positions were further refined by Grenier and Bassi [137]. The unit cell was confirmed by Whiston and Smith [138] (cubic, a = 8.4300 ± 0.0008). Ukei et al. revised the space group of the high-temperature form to I-43m, a = 8.412 Å [139].
Lithium metaniobate, LiNbO3, is the most studied by far because of its ferroelectric properties. Bailey [140] found that LiNbO3 crystallizes in the space group R3c with a rhombohedral unit cell (a = 5.4920 Å, α = 55.88°). The corresponding hexagonal unit cell has aH = 5.147 Å cH = 13.856 Å. Two possible models were considered for the atomic positions. Megaw discussed the relationship of this structure to its ferroelectricity [141]. Powder neutron diffraction was carried out by Shiozaki and Mitsui [142], suggesting a disordered distribution of lithium ions. Abrahams et al. carried out a single crystal X-ray diffraction study at ambient temperature (R3c, aH = 5.14829(2) Å, cH = 13.8631(4) Å; aR = 5.4944, α = 55.87°) [143]. They found that the unit cell consists of 6 planar sheets of oxygen atoms perpendicular to c, with the octahedral interstices filled by Nb, Li, and X, where X indicates a vacancy. Isotropic thermal parameters were sufficient. The following single-crystal neutron diffraction study [144] confirmed the results and cast doubt on the accuracy of the atomic positions found from powder neutron diffraction determined previously [142]. The powder X-ray diffraction method was then applied at 24, 250, 500, 750, 1000, and 1200 °C [145], where the atomic arrangement essentially remains unchanged. Absorption and extinction effects gave unphysical values for the isotropic B at some temperatures. The shifts in atomic positions led Abrahams to propose that at the Curie point (1210 °C), the space group changes to the paraelectric R-3. Stoichiometric LiNbO3 melts incongruently, and the congruently melting compound corresponds to a stoichiometry of Li0.946NbO2.973 (Li0.955Nb1.009O3). A small amount of Li2O has been lost. This form crystallizes (R3c, aH = 5.15052(6) Å, cH = 13.86496(3) Å) nearly identically to the stoichiometric compound (R3c, aH = 5.14739(8) Å, cH = 13.85614(9) Å) [146]. In the congruent form, 4.2% of the niobium ions have migrated to the vacated lithium sites. It was found that the thermal vibrations of the congruent form were anharmonic. A single crystal study on the congruent form was carried out by Ohgaki et al. (R3c, aH = 5.15020(6) Å, cH = 13.8653(4) Å), who also incorporated anharmonic corrections for vibration [147]. There also exists an ilmenite-type polymorph of LiNbO3, characterized by Kumada et al. using powder diffraction (R3, a = 5.212 Å, c = 14.356 Å) [148]. Neutron powder diffraction both below (R3c) and above (R-3c) the Curie point demonstrated that the high-temperature paraelectric phase of LiNbO3 had disordered lithium on both sides of a LiO3 pyramid [149]. Synchrotron X-ray studies have also been carried out [150,151].
It was argued by Whiston and Smith that the Li2Nb8O21 (1:4) compound observed by Reisman and Holtzberg [118] was actually LiNb3O8 (monoclinic, a = 7.435 Å, b = 5.618 Å, c = 7.079 Å, β = 101.0°) [138]. Powder and single-crystal X-ray diffraction was used to solve the structure of LiNb3O8 by Lundberg (P21/a, a = 15.262(2) Å, b = 5.033(1) Å, c = 7.457(1) Å, β = 107.34(1)°) [152]. It is comprised of chains of edge-shared metal octahedra. The structure was also solved by Gatehouse and Leverett (P21/c, a = 7.459(4) Å, b = 5.034(4) Å, c = 15.270(7) Å, β = 107.33(3)°) [153].
The structure of Li7NbO6 [154] was solved by Muhle using powder X-ray diffraction (P-1, a = 5.37932(9) Å, b = 5.91942(11) Å, c = 5.37922(9) Å, α = 117.0033(9)°, β = 119.6023(7)°, γ = 63.2570(9)°) [155]. This structure is interesting in that it consists of isolated NbO67− octahedra held together by octahedrally and tetrahedrally-coordinated lithium ions. Because of the structure of Li7NbO6, it may be possible to generate in situ protonated forms of NbO67− from it before subsequent condensation.
The crystal structure of Li8Nb2O9 was solved by Braun and Hoppe (P-1, a = 15.210 Å, b = 8.815 Å, c = 5.858 Å, α = 109.8°, β = 101.4°, γ = 87.0°) [156] It consists of a network of edge and vertex fused NbO6 octahedra.
The compound Li2Nb28O71 of Reisman and Holtzberg [118] was argued by Whiston and Smith to actually be Li2Nb24O61 (monoclinic, a = 44.79 Å, b = 3.807 Å, c = 28.38 Å, β = 106.5°) [138]. Norin and Nolander argued that extensive twinning of crystals occurred and obtained a powder pattern consistent with the space group being either C2, Cm, or C2/m (a = 28.52(2) Å, b = 3.828(2) Å, c = 17.55(1) Å, β = 124.98(4)°) [134]. There were many similarities to N-N2O5.

3.8.3. Sodium Niobates

Sodium orthoniobate, Na3NbO4, was studied by Whiston and Smith (C2 or Cm or C2/m, a = 12.23 Å, b = 12.85 Å, c = 5.782 Å, β = 121.5°) [138]. Bouillaud found two forms, a cubic form (a = 4.606 Å) [157] with random Li+ and Nb5+ arrangement and a monoclinic form (a = 11.095(5) Å, b = 12.993(5) Å, c = 5.730(5) Å, β = 108.9(5)°) which was believed to be the form observed by Whiston and Smith, in spite of the differences in lattice constants. These lattice constants were confirmed by Barker and Wood, who also observed a third orthorhombic phase (a = 13.806 Å, b = 13.411 Å, c = 9.579 Å) [158]. Meyer and Hoppe determined the crystal structure of the monoclinic form (C2/m, a = 11.068 Å, b = 13.032 Å, c = 5.733 Å, β = 109.13°) and found it to consist of discrete Nb4O1612− ions [159].
Sodium metaniobate, NaNbO3, has been investigated by numerous groups. It was found to be pseudocubic at ambient temperature by Barth (a = 3.890 Å) [160]. Wood found reversible polymorphism: 25 °C, orthorhombic (a0 = 5.512 Å, b0 = 5.577 Å, c0 = 4 × 3.885 Å; also can be described as pseudotetragonal a0 = 2 × 3.921 Å, c0 = 4 × 3.885 Å; monoclinic axes a0 = 2 × 3.921 Å, b0 = 4 × 3.885 Å, c0 = 2 × 3.921 Å, β = 90.67°); 300 °C, orthorhombic pseudotetragonal (a0 = 2 × 3.91 Å, c0 = 4 × 3.94 Å); 425 °C, tetragonal pseudocubic (a0 = 2 × 3.928, c0 = 4 × 3.928 Å); 490 °C, tetragonal pseudocubic (a0 = 2 × 3.93, c0 = 4 × 3.93 Å) [161]. Vousden found an orthorhombic phase at ambient temperature (a = 5.5682 Å, b = 3.8795 Å, c = 5.5052 Å) [162]. Upon heating, phase changes to tetragonal (300 °C) and cubic (600 °C) forms were noted. Reisman noted the existence of four phases (α, β, γ, δ) with phase transitions at 640, 562, and 354 °C. Single crystal diffraction of the room-temperature form (δ) gave (P2212, a = 5.5682 Å, b = 15.5180 Å, c = 5.5052 Å) [163], which was inconsistent with its ferroelectric nature [164,165]. Shirane et al. undertook optical, dielectric, and X-ray measurements from 20–670 °C [166]. In addition, Francombe examined the diffraction lines from 20–640 °C [167]. Solovev studied polycrystalline NaNbO3 with X-rays between −200–700 °C [168]. The subcell lattice parameters ranged between 3.87–3.95 Å, giving six regions: pseudomonoclinic (−200–360 °C), pseudomonoclinic (360–430 °C), pseudocubic (430–470 °C), pseudocubic (470–520 °C), tetragonal (520–640 °C), and cubic (640–700 °C). Bouillaud found in a study of solid solutions that the monoclinic end member NaNbO3 was pseudocubic with a = c = 3.9150(8) Å, b =3.8800(8) Å, 90.72(5)° with superstructure 2a.2b.2c [169]. A single crystal study at room temperature by Sakowski-Cowley et al. gave an orthorhombic structure (Pbma, a = 5.566 Å, b = 15.520 Å, c = 5.506 Å) [170]. The results of Hewat [171] using neutron diffraction matched those of Sakowski-Cowley. A study of the room temperature (P-antiferromagnetic) and a new low-temperature ferromagnetic N phase by Darlington and Megaw [172] showed that the transition occurred at about -110 °C. This structure was further refined by Seidel and Hoffmann at 20 K [173]. Further high-precision study of the high-temperature transitions up to 800 °C in a single crystal by Glazer and Megaw [174] demonstrated the existence of six high-temperature phases: P (<373 °C), R (373–480 °C), S (480–520 °C), T1 (520–575 °C), T2 (575–640 °C), and the cubic phase (>640 °C). The crystal structure of the tetragonal T2 form at 600 °C was solved by Glazer and Megaw (P4/mbm, a = 5.5639(8), b = 5.5639(8), c = 3.9428(8)) [175] and can be described as slight tilting of the NbO6 octahedra from the cubic perovskite structure. Essentially, the same structure was proposed by Ishida and Honjo [176]. The structure was further refined by Darlington and Knight by synchrotron powder diffraction at 615 °C [177]. The crystal structures of the orthorhombic S (500 °C) and T1 (530 °C) phases were solved by Ahtee et al. [178]. The lattice parameters are: for T1, Ccmm, a = 7.8642 Å, b = 7.8550 Å, c = 7.8696 Å; for S, Pnmm, a = 7.8608 Å, b = 7.8556 Å, c = 7.8606 Å. The structures can be described as successively more tilted regular NbO6 octahedra. The T1 structure was further refined by Darlington and Knight by synchrotron powder diffraction at 540 °C [177]. Nanoparticles 20 nm in size refined best to Pmc21, a = 7.8636(7) Å, b = 5.6306(9) Å, c = 5.5483(9) Å, according to Shanker et al. [179] This appears to be similar to the room-temperature polar phase described by Johnston et al. (P21ma, a = 5.571(1) Å, b = 7.766(1) Å, c = 5.513(1) Å) [180]. Using neutron diffraction, Darlington and Knight [181] confirmed the structures of the T1 and T2 phases and, based on the superlattice reflections, suggested that Phase S was a 2 × 4 × 6 multiplicity instead of the 2 × 2 × 2 reported by Ahtee et al. [178] Phase R had the same multiplicity. In addition, Phase P was suggested to be monoclinic (a0 = 5.5101 Å, b0 = 5.5717 Å, c0 = 15.5181 Å, β = 89.94°). Koruza et al. used powder X-ray diffraction [182] and found: R, 420 °C, Pmmn, a = 7.8440(12) Å, b = 7.8459(13) Å, c = 7.8567(3) Å; 300 °C, Pbcm, a = 5.5327(2) Å, b = 5.5630(2) Å, c = 15.6450(5) Å; 250 °C, Pmc21, a = 7.8066(2) Å, b = 5.5279(2) Å, c = 5.5637(2) Å; and 25 °C, Pmc21, a = 7.7633(3) Å, b = 5.5143(2) Å, c = 5.5655(2) Å. Mishra et al. carried out a neutron powder diffraction study over a wide range of temperature [183] and found: 1075 K, U, cubic, Pm-3m, a = 3.9507(2) Å; 900 K, T2, tetragonal, P4/mbm; 850 K, T1, orthorhombic, Cmcm; 770 K, S, orthorhombic, Pbnm, a = 5.5555(2) Å, b = 5.5556(2) Å, c = 47.1489(9) Å; 680 K, R, orthorhombic, Pbnm; a = 5.5459(1) Å, b = 5.5505(1) Å; c = 23.5229(3) Å; 300 K, P, orthorhombic, Pbma. Peel and coworkers used both neutron and X-ray powder diffraction between 360 and 520 °C [184] and found that phase S (500 °C) was a 2 × 2 × 4 structure, Pmmn, a = 7.85684(4) Å, b = 7.86748(7) Å, c = 15.72795(13) Å, and that phase R (440 °C) was a 2x2x6 structure, Pmmn, a = 7.85371(6) Å, b = 23.54619(19) Å, c = 7.85677(7) Å (a 2 × 6 × 2 Pnma model was also close). An ilmenite form also exists (R3, a = 5.333(1) Å, b = 15.611(4) Å) [148].
Another sodium-rich structure, Na5NbO5, was found by Darriet et al. [185]. This structure is unique in that it has discrete square pyramidal NbO55− coordinated to sodium atoms with oxygen voids.
The crystal structure of Na2Nb4O11 was determined by Jahnberg (C2/c, a = 10.840 Å, b = 6.162 Å, c = 12.745 Å, β = 106.22°) [186], confirming the stoichiometry of Andersson [187]. It consists of sheets of edge-shared pentagonal bipyramidal NbO7. These sheets are connected to each other by NbO6 octahedra and NaO7 polyhedra. The presence of ferroelectricity suggested that a noncentrosymmetric space group might be more appropriate, and the refinement of powder diffraction data was conducted by Maso and West (Cc, a = 10.8427(1) Å, b = 6.1664(6) Å, c = 12.7524(1) Å, β = 106.176(1)°) [188].
The structure of NaNb3O8 was examined using powder X-ray diffraction, and an orthorhombic cell was found: Andersson, Pbam or Pba2, a = 12.372 Å, b = 37.10 Å, c = 3.954 Å [187]; Bouillaud, a = 12.344(4) Å, b = 37.121(6) Å, b = 3.950(2) Å [189]; Nedjar, Pmnm or Pmn21, a = 8.771(14) Å, b = 10.16(2) Å, c = 3.784(3) Å [190]. The layers can be described as edge-shared NbO6 octahedra, sharing their corners with NbO4 tetrahedra. A high-pressure form, synthesized by Range et al., consists of both NbO7 and NbO8 polyhedra (Ibam, a = 7.3244(4) Å, b = 10.3100(5) Å, c = 7.0426(4) Å) [191].
Using single crystal X-ray diffraction, Andersson solved the structure of NaNb13O33 (C2/m, a = 22.40 Å, b = 3.834 Å, c = 15.37 Å, β = 91.47°) [192]. It consists of a 3D network of octahedral NbO6 along with square-planar NaO4. The powder diffraction pattern was also published [187].

3.8.4. Potassium Niobates

The potassium niobates are described next. Potassium orthoniobate, K3NbO4, was confirmed to exist by Guerchais, who gave the d-spacings [193]. It was also studied by Addison, who identified that there were two different powder patterns corresponding to two phases of the purported compound, depending on the synthesis temperature [194], in agreement with one of two scenarios suggested by the observations of Reisman [120]. Stecura et al. found that a = 12.05(4) Å, b = 14.34(5) Å, c = 10.50(3) Å [195]. Meyer and Hoppe found a cubic γ structure with a = 8.605 Å, and a tetragonal β structure with a = 6.14 Å, c = 8.37 Å [196].
Potassium pyroniobate, K4Nb2O7, was proposed by Guerchais, who provided the d-spacings [193].
Potassium metaniobate, KNbO3, was found by Vousden to be orthorhombic by X-ray powder diffraction (a = 5.7203 Å, b = 3.9714 Å, c = 5.6946 Å) [162]. Wood found reversible polymorphism: 25 °C, orthorhombic (a0 = 5.702(10) Å, b0 = 5.739(10) Å, c0 = 3.984(10) Å; also can be described as pseudotetragonal a0 = 4.045 Å, c0 = 3.984 Å; monoclinic axes a0 = 4.045 Å, b0 = 3.984 Å, c0 = 4.045 Å, β = 90.35°); 260 °C, tetragonal (a0 = 4.00(2) Å, c0 = 4.07(2) Å); 500 °C, cubic (a0 = 4.024(1) Å) [161]. The phase changes occur between 200–225 and 420–435 °C. These are in good agreement with the later temperature-dependent study of Shirane et al. from 25–510 °C [166]. Reisman inferred the existence of this compound from the phase diagram [120] and refined procedures for its preparation [197]. Guerchais also found a pseudocubic structure (a = 4.029 Å) [193]. A single crystal X-ray diffraction by Katz and Megaw at room temperature also gave excellent agreement (Bmm2, a = 5.697 Å, b = 3.971 Å, c = 5.721 Å) with the expected distorted perovskite structure [198]. The tetragonal phase was refined by Hewat at 270 °C using single crystal neutron diffraction (P4mm) [199]. Hewat also refined the structure using powder neutron diffraction [200] for the tetragonal (P4mm, a = 3.996 Å, c = 4.063 Å), orthorhombic (Amm2, a = 3.973 Å, b = 5.695 Å, c = 5.721 Å) and rhombohedral (−43 °C, R3m, a = 4.016 Å, α = 89.817°) phases. Sugimoto confirmed the structure of the room temperature form (Amm2, a = 3.9807(7) Å, b = 5.688(1) Å, c = 5.711(1) Å) [201]. Nanowires were synthesized by Kim et al. in a monoclinic phase, as determined by X-ray and neutron powder diffraction (P1m1, a = 4.04976(6) Å, b = 3.99218(6) Å, c = 4.02076 Å, β = 90.1012(27)°) [202].
A metastable orthorhombic phase, K12Nb14O41, was found by Whiston and Smith (a = 8.81 Å, b = 21.55 Å, c = 3.76 Å) [138].
The compound K4Nb6O17 was identified by Reisman and Holtzberg [120] and confirmed by Guerchais, who gave the d-spacings [193]. The lattice parameters of this tetragonal cell were given by Whiston and Smith as a = 12.575(2) Å, c = 3.763(1) Å [138]. However, Gasperin and Le Bihan found a lamellar structure consisting of sheets of NbO6 octahedra (P21nb, a = 7.83 Å, b = 33.21 Å, c = 6.46 Å) [203].
The tetragonal compound K6Nb10.8O30 was made by Becker and Hold, whose crystal structure was solved (P4/mbm, a = 12.537(2) Å, c =3.9730(1) Å) [204]. The tungsten-bronze-type structure contains NbO6 octahedra vertex shared with two others to form an Nb3O15 unit, and these are vertex-connected to form a sheet. Above and below these units is a site 20% occupied by tricapped trigonal prism Nb5+, together with planes of potassium and oxygen ions.
The triclinic compound K3Nb7O19 was synthesized by Fallon et al., and single-crystal XRD was carried out (P-1, a = 14.143(3), b = 9.948(2), c = 6.463(2) Å, α = 106.45(2), β = 95.82(1), γ = 97.29(1)°) [205]. It consists of double strings of seven edge-shared NbO6 octahedra.
The tetragonal compound KNb3O8 was reported by Reisman et al. [120] and by Whiston and Smith (a = 37.71(3) Å, c = 3.939(5) Å) [138]. Gasperin solved the crystal structure of an orthorhombic form (Amam, a = 8.903(3), b = 21.16(2), c = 3.799(2) Å) [206]. It has a lamellar structure consisting of two edge-shared octahedral units connected by a vertex-shared octahedra.
The compound K2Nb8O21 was found by Guerchais, who gave the d-spacings [193]. It was also indexed by Whiston and Smith [138] to be primitive tetragonal, a = 27.41, c = 3.955 Å, but they expressed doubts about stoichiometry.
The compound KNb5O13 was prepared by Kwak et al. and characterized by single crystal X-ray diffraction (Pbcm, a = 5.672(2), b = 10.737(5), c = 16.742(6) Å) [207]. It consists of slabs of NbO6 octahedra connected by oxygen atoms, with potassium ions occupying the tunnels produced.
The compound KNb7O18 was studied by electron microscopy and electron diffraction by Hu et al., who found that it was tetragonal, with a = 27.5, c = 3.94 Å [208]. The x and y positions were located, but not the z positions.
The compound K6Nb44O113, proposed by Reisman et al. [120], was indexed as monoclinic by Whiston and Smith (a = 19.83, b = 3.899, c = 19.03 Å, β = 115.0°) [138].

3.8.5. Rubidium Niobates

The rubidium niobates are described next. Rb8Nb2O9 was identified by Reisman and Holtzberg [121].
Rb3NbO4 was found by Meyer and Hoppe [196]. At least three polymorphs exist. Two cubic forms were identified by powder diffraction: α, a = 4.45 Å and γ, a = 8.90 Å, the latter of which was isotypic with the potassium analog. In addition, there exists a tetragonal form, a = 6.30 Å, c = 8.81 Å. Annealing of the reactant mixtures at constant temperature gives the tetragonal form first, followed by the α form (2 weeks) and γ form (3 months).
Rb8Nb6O19 was identified by Reisman and Holtzberg [121].
RbNbO3 was identified by Reisman and Holtzberg [121]. The “pyrgom” (Greek for piled-up) structure was solved by Serafin and Hoppe as triclinic (a = 8.87 Å; b = 8.39 Å; c = 5.11 Å; α = 94.6°; β = 93.5°; γ = 113.9° [209] and P-1, a = 8.882(3) Å, b = 8.395(3) Å, c = 5.109(2) Å, α = 94.60(3)°, β = 93.53(3)°, γ = 113.83(3)°) [210]. Each niobium possesses a tetragonal pyramid of oxygen atoms connected by edges to others in chains. The chains are connected by rubidium atoms. A high-pressure orthorhombic perovskite form is also known (a = 3.9965 Å, b = 5.8360 Å, c = 5.8698 Å) [211].
Rb4Nb6O17 was identified by Reisman and Holtzberg [121]. Iyer and Smith identified it as orthorhombic (a = 6.42 Å, b = 7.68 Å, c = 38.55 Å) [212] but suggested a slightly different composition Rb8Nb14O39. The crystal structure of a hydrated version of this salt, Rb4Nb6O17·3H2O, was solved by Gasperin and Le Bihan (Pmnb, a = 7.83(1) Å, b = 39.06(5) Å, c = 6.57 (1) Å) [213].
Rb2Nb4O11 was identified by Reisman and Holtzberg [121]. Iyer and Smith identified it as monoclinic (Cm, C2, or C2/m, a = 12.95 Å, b = 7.48 Å, c = 14.92 Å, β = 106.4°) [212] but suggested Rb12Nb22O61 as the stoichiometry.
Rb8Nb22O59 was identified by Reisman and Holtzberg [121]. Iyer and Smith suggested hexagonal symmetry (P6322, a = 7.45 Å, c = 7.66 Å) [212] but reformulated it as RbNb3O8. The structure was solved by Fallon and Gatehouse (R-3m, a = 7.527(6) Å, c = 43.17(2) Å) [214]. Dewan and coworkers also solved the structure (R-3m, a = 7.53(1) Å, c = 43.39(6) Å) [215], as did Jones and Robertson (R-3m, ah = 7.52 Å, ch = 43.17 Å; rhombohedral ar = 15.03 Å, αr = 29.0°) [216] and Voronkova et al. (R-3m, a = 7.502(1), c = 43.12(2)) [217]. This structure was referred to as 11-L (a = 7.7224(7) Å, c = 43.180(5) Å) by Minor et al. [218] Two other structures of similar composition, 16-L (a = 7.5138(5) Å, c = 65.115(9) Å) and 9-L (a = 7.5179(2) Å, c = 36.353(1) Å) were noted.
A structure identified as “RbNb3O9” was solved (hexagonal, P6/mmm, a = 7.39 Å, c = 3.89 Å; orthorhombic Cmmm, a = 13.038 Å, b = 7.502 Å, c = 3.89 Å) and described as being similar to the hexagonal tungsten bronzes [219]. The c-axis is about half of that reported by Iyer and Smith for RbNb3O8 [212]. It appears similar to the hexagonal-type bronze of Minor et al. (a = 12.991(4) Å, b = 7.550(1) Å, c = 3.8978(8) Å) [218].
Rb2Nb8O21 was identified by Reisman and Holtzberg [121]. Iyer and Smith suggested tetragonal symmetry (a = 26.55 Å, c = 3.85 Å) [212]. Jones and Robertson suggested orthorhombic symmetry (Cmcm (more likely) or Cmc2, a = 7.55(1) Å, b = 13.00(2) Å, c = 7.78(1) Å) [216].
Rb4Nb30O77 was identified by Reisman and Holtzberg [121]. Iyer and Smith suggested monoclinic symmetry (Pm, P2, or P2/m, a = 20.17 Å, b = 3.83 Å, c = 20.75 Å, β = 123.5°) [212]. It was suggested that this may have been a solid solution for the composition Rb2Nb26O66 because of its similarity to the high-temperature form of Nb2O5. One phase present in Reisman’s sample, called “Rb3Nb54O146”, was indexed as tetragonal (P4212 or P-421m, a = 27.69 Å, c = 3.98 Å) [219]. It consists of octahedra surrounding a heptagonal tunnel. This appears similar to the Gatehouse tetragonal bronze (a = 27.484(3) Å, c = 3.9656(4) Å) [218].

3.8.6. Cesium Niobates

The cesium niobates are described next. Cs3NbO4 was synthesized by Meyer and Hoppe [196]. They found a face-centered cubic structure (a = 9.19 Å).
CsNbO3 was identified by Reisman and Mineo [122]. Iyer and Smith found that it crystallized at 870 °C with orthorhombic symmetry (a = 7.24 Å, b = 15.13 Å, c = 9.77 Å) [212]. Meyer and Hoppe solved the crystal structure and found it to be monoclinic (P21/c, a = 5.148 Å, b = 15.89 Å, c = 9.143 Å, β = 93.3°) with discrete Nb4O124− ions [220].
Cs4Nb6O17 was identified by Reisman and Mineo [122].
Cs2Nb4O11 was identified by Reisman and Mineo [122]. Iyer and Smith found that it crystallized at 1170 °C with orthorhombic symmetry (a = 13.03 Å, b = 7.60 Å, c = 14.36 Å) [212]. Gasperin also found orthorhombic symmetry (P2nn, a = 10.484 (2) Å, b = 28.898 (4) Å, c = 7.464 Å) [221]. A different high-temperature phase was found by Smith et al. at 450 K (Imma, a = 7.4729 (5) Å, b = 28.9520 (18) Å, c = 10.5080 (6) Å) [222].
Cs10Nb26O70 was identified by Reisman and Mineo [122].
Cs8Nb22O59, after reformulating as CsNb3O8, was found to be isomorphous to the rubidium compound by Dewan et al. [215]. They found the following space group and unit cell (R-3m, a = 7.53(1) Å, c = 43.02(6) Å), as did Voronkova and coworkers (R-3m, a = 7.53(2) Å, c = 42.83(4) Å) [217], and Jones and Robertson (R-3m, ar = 15.02 Å, αr = 28.9°; ah = 7.50 Å, ch = 43.15 Å) [216].
Cs4Nb30O77 was identified by Reisman and Mineo [122].

3.8.7. Calculations on Orthoniobate

The calculated bond lengths and vibrational frequencies for NbO43− are given in Table 9. The only structures containing discrete orthoniobate are the salts of potassium, rubidium, and cesium, whose structures contain a lot of disorder [196]. However, with fractional coordinates for Nb (0, 0, 0) and O ± (0, 0.211, 0.01) and ±(0.211, 0, 0.01), and cubic unit cell of dimensions 8.90 Å, K3NbO4 would have an Nb-O distance of 1.88 Å. The Hartree-Fock distances are slightly less than this, the B3LYP distances are slightly higher, and the MP2 distances are too long. To the best of our knowledge, the vibrational frequencies of orthoniobate have not been measured. We expect a clear separation of the symmetric and antisymmetric stretching frequencies, but it is possible that there may be an accidental degeneracy of the deformation frequencies, which are mostly predicted to be within 30 cm−1 of each other. The CPCM solvation model gives rise to smaller Nb-O distances and larger stretching frequencies.
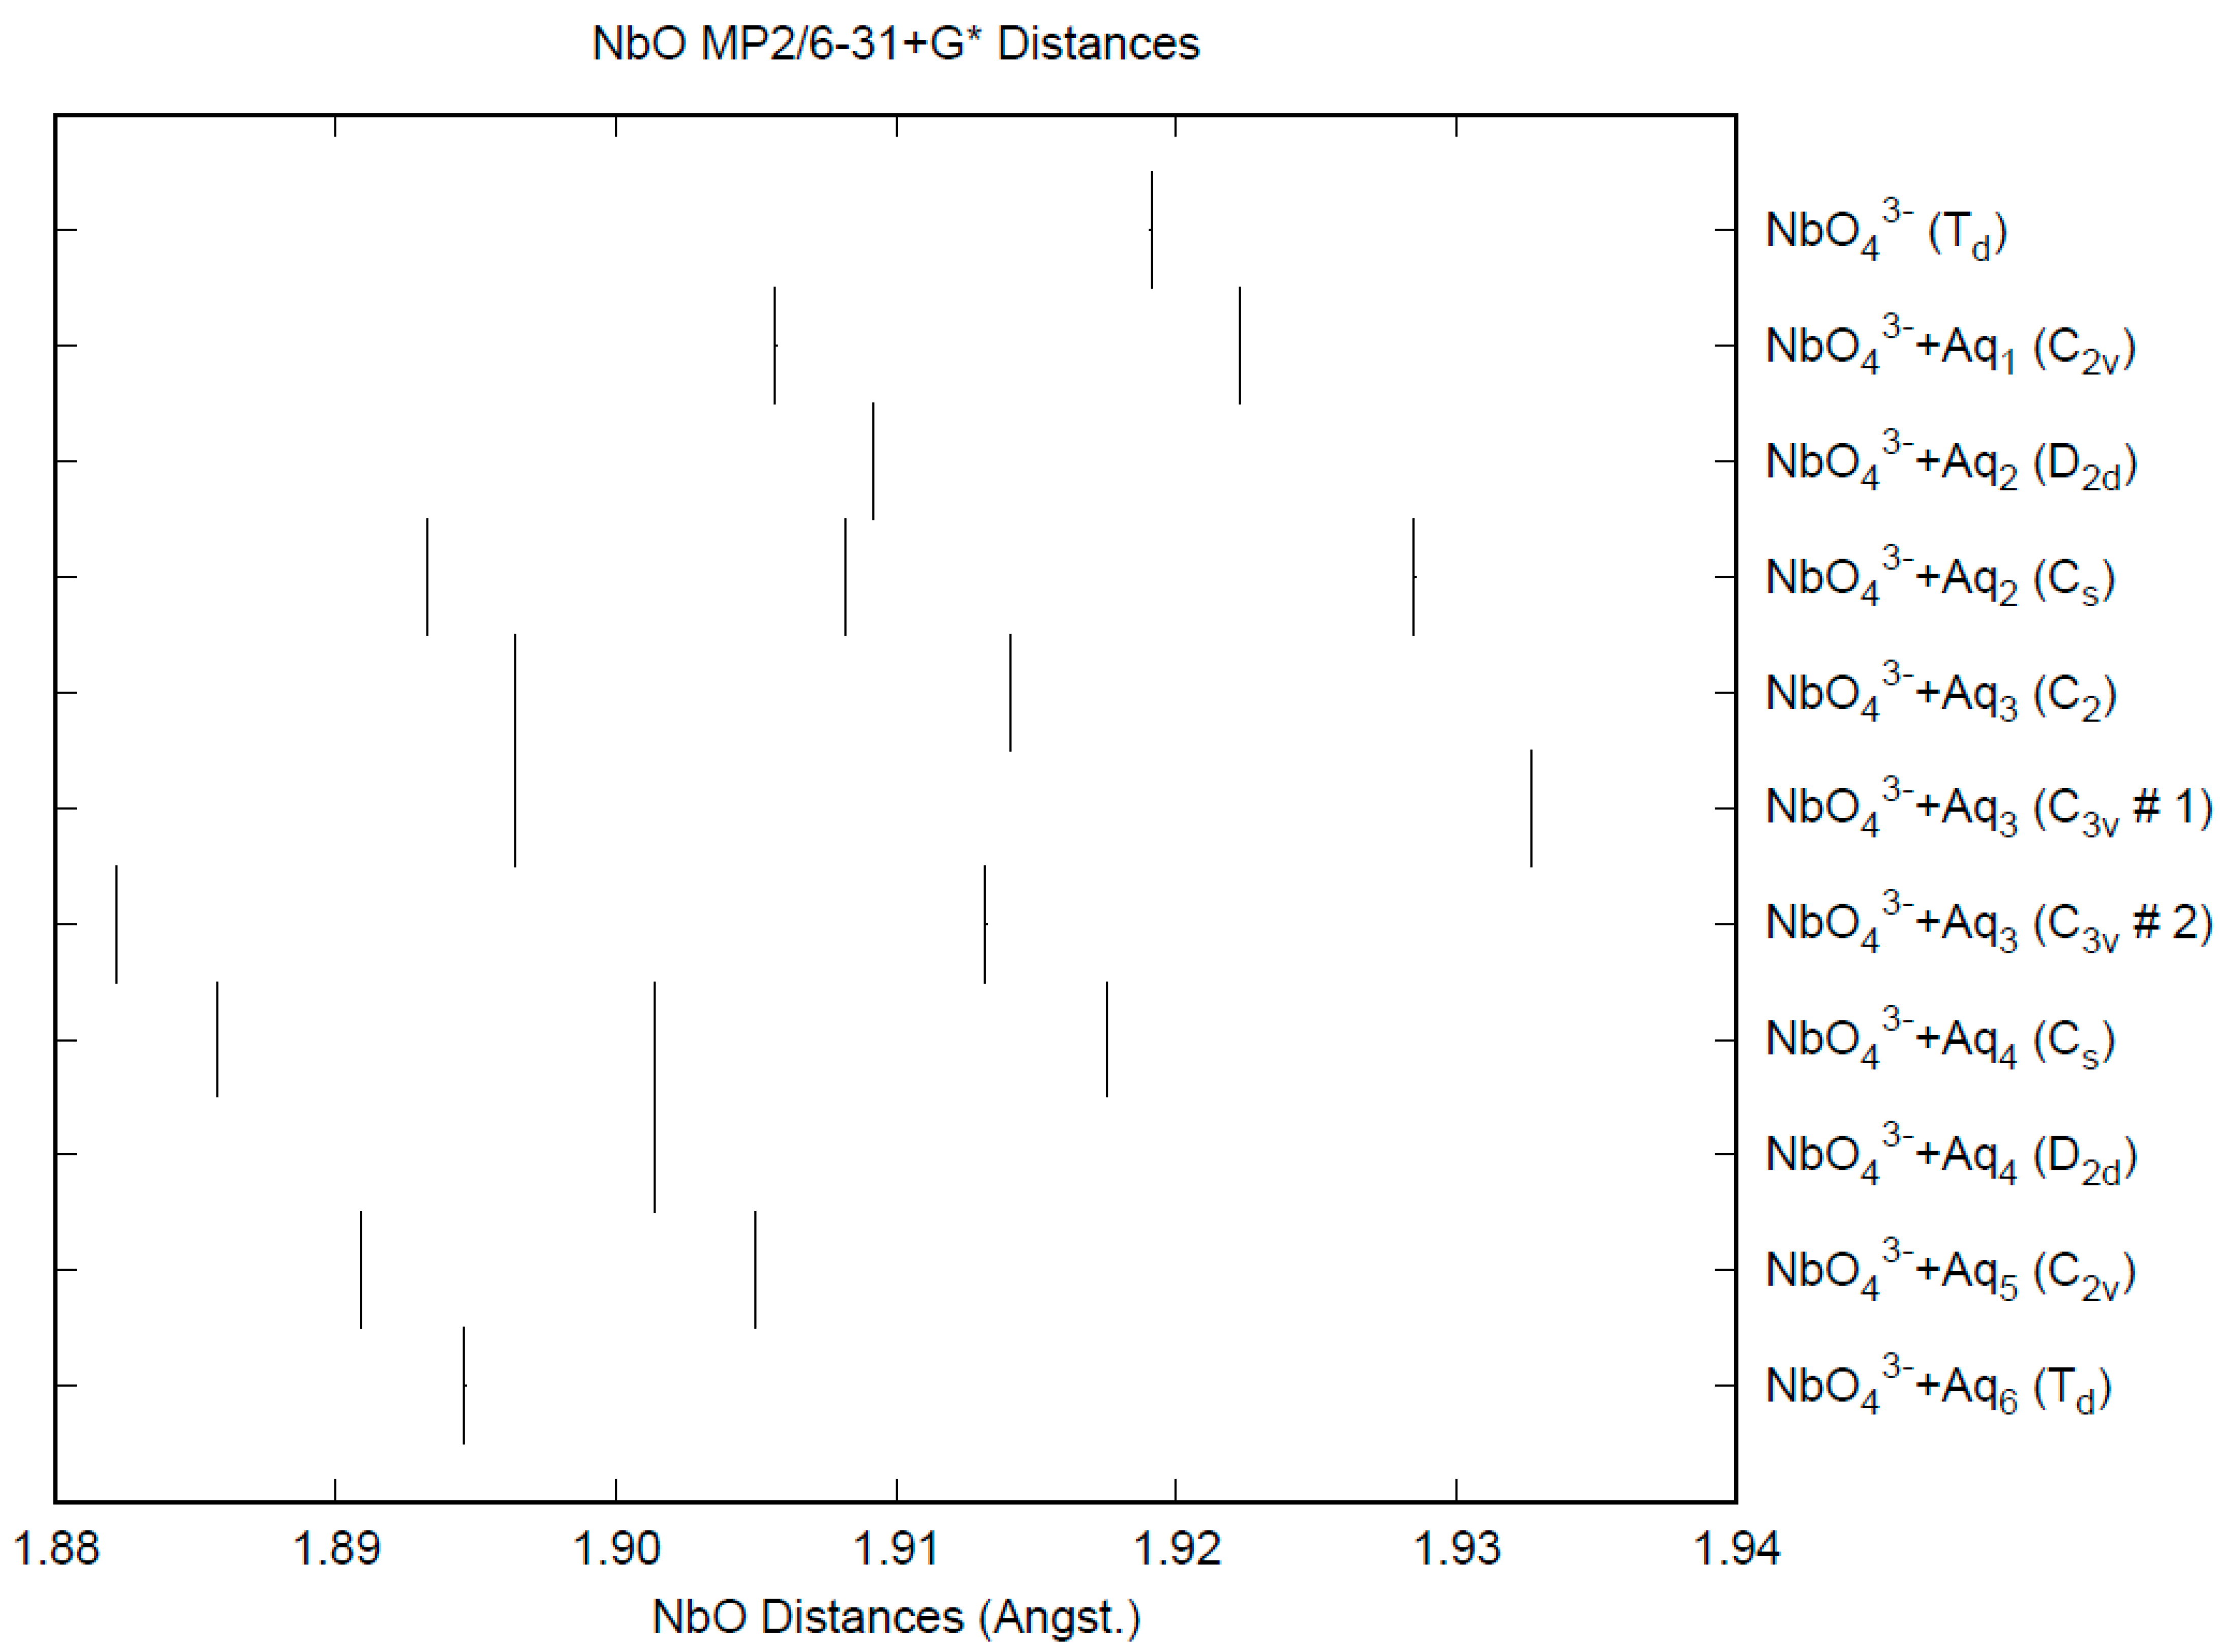
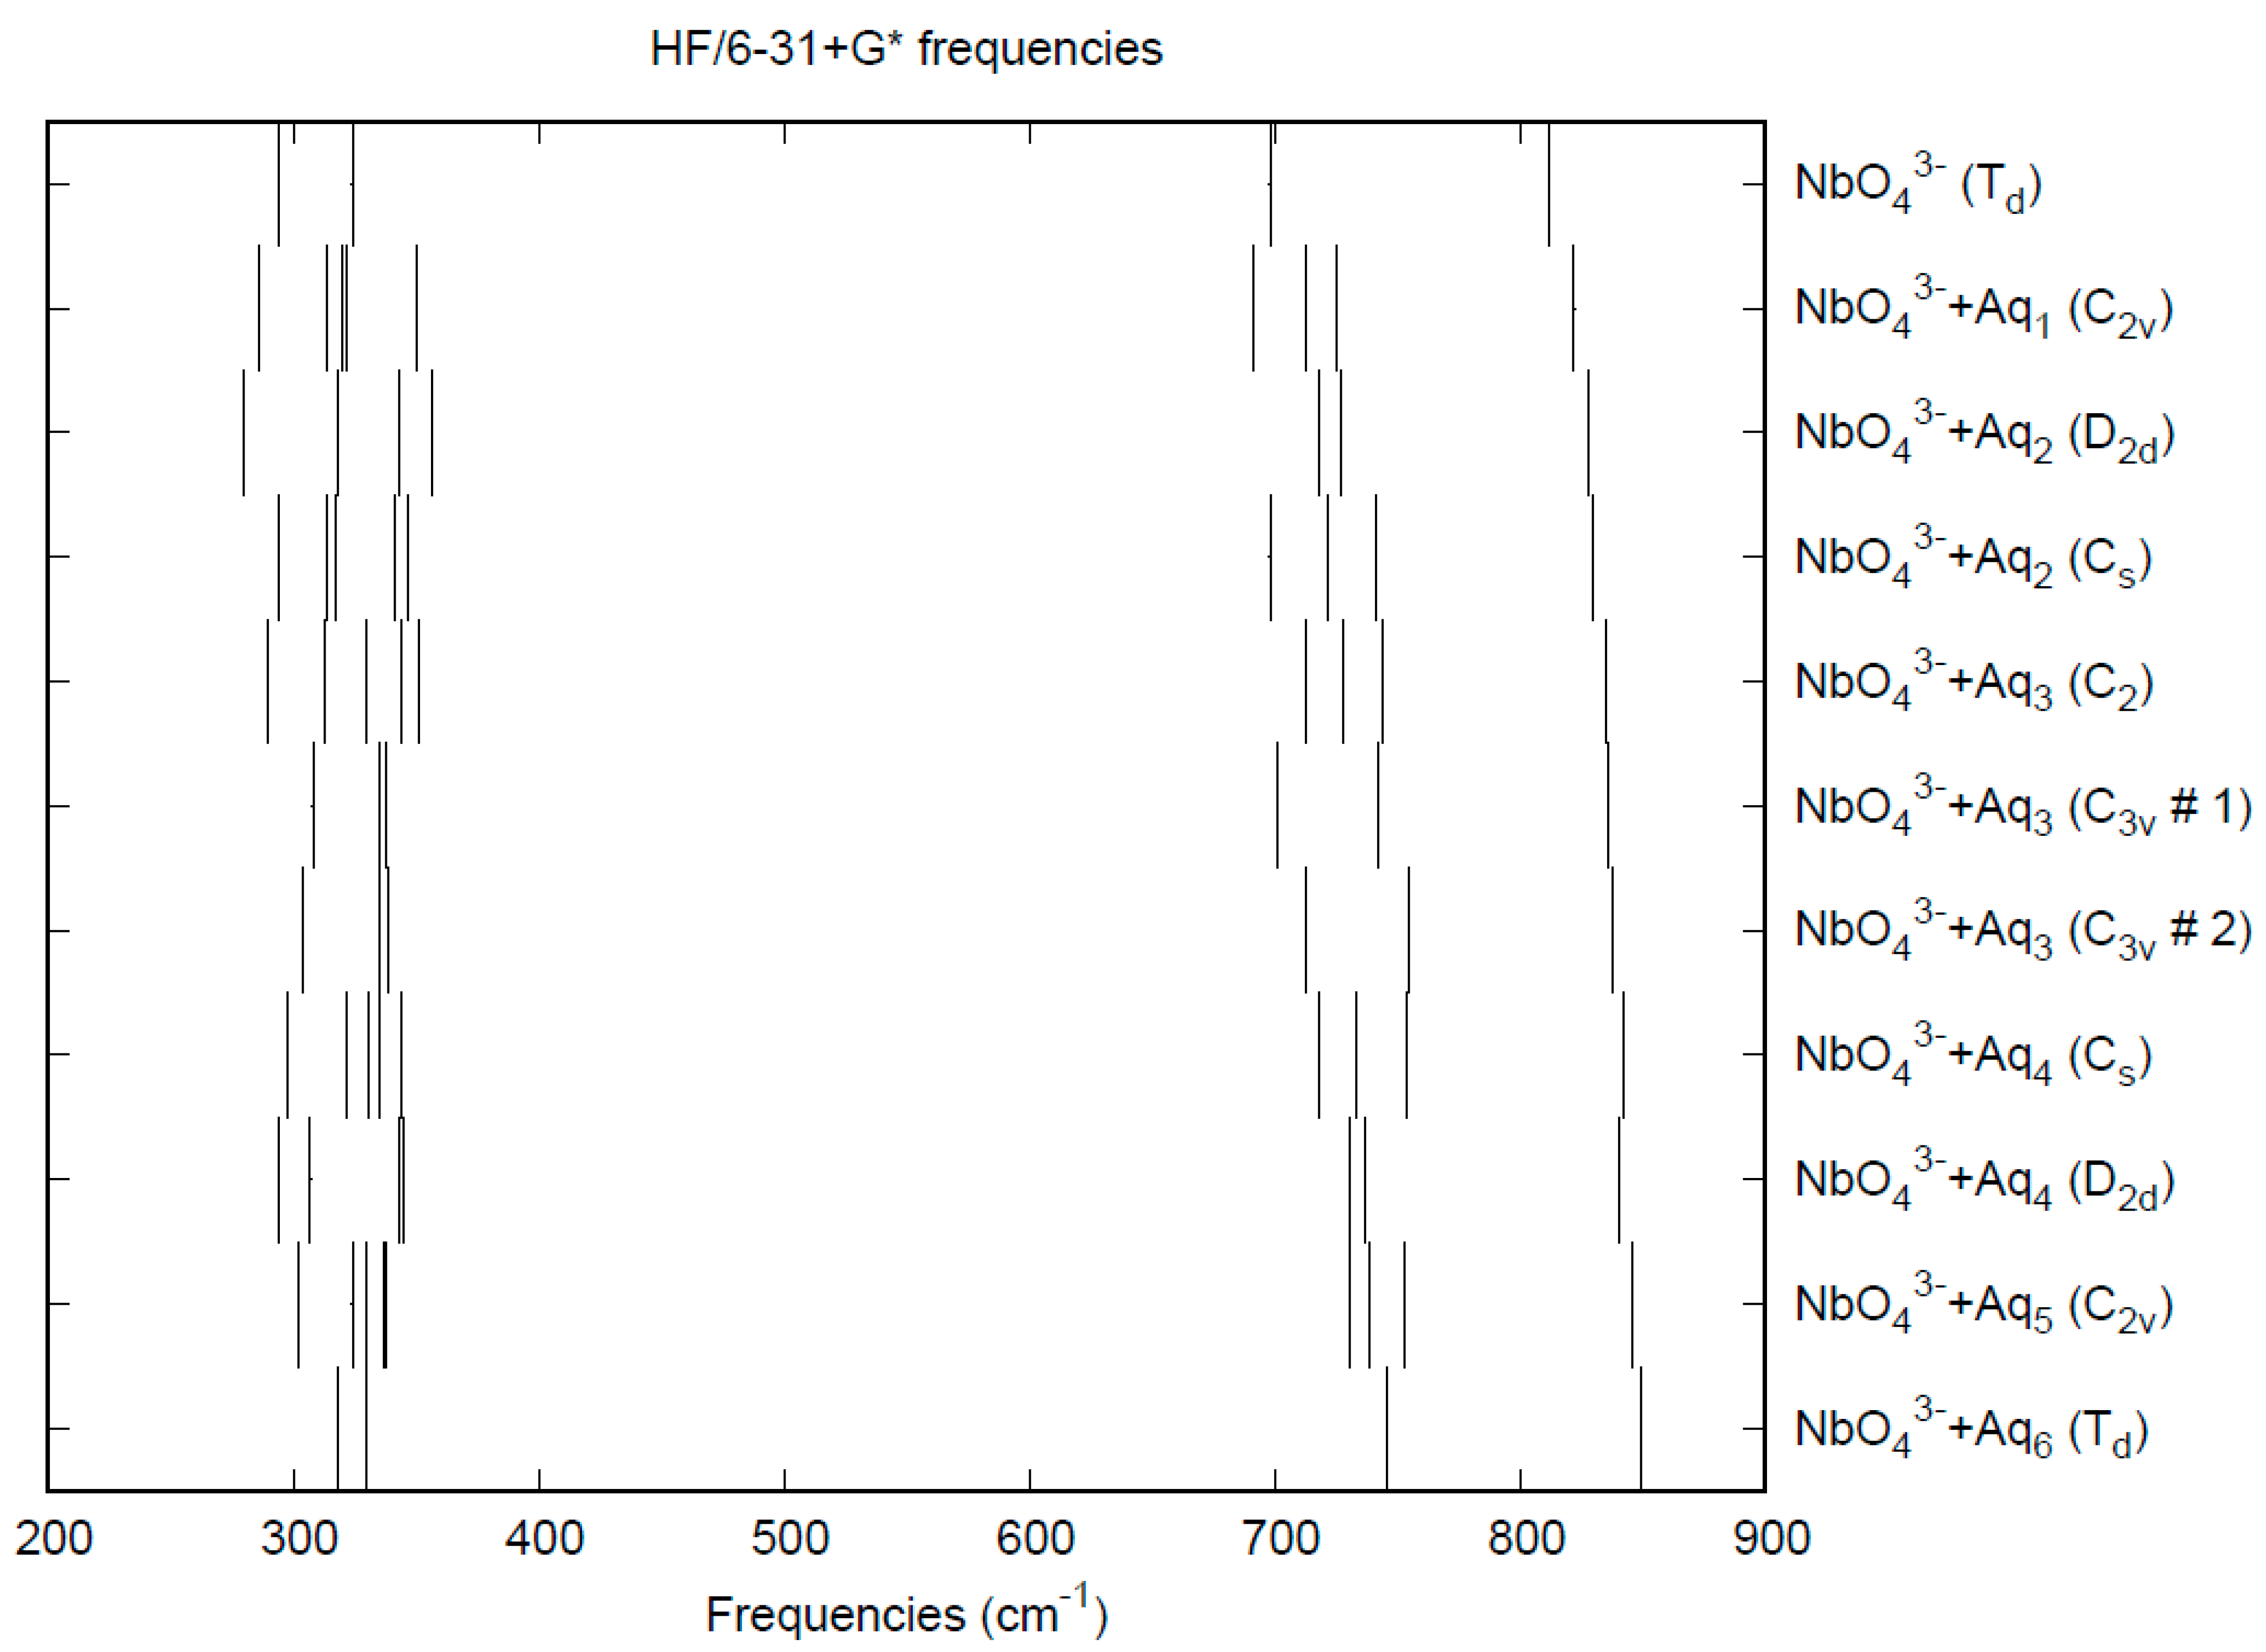
The effect of water upon the Nb-O distances (MP2/6-31+G(d)) in NbO43−nH2O (n = 0–6) is given in Figure 14. The net effect is a moderate shortening of the Nb-O distance by 0.025 Å (n = 6). The individual Nb-O distances vary by up to 0.04 Å. These changes are a little more pronounced than for the divalent ions. The Nb…O distance exhibits an odd behavior, decreasing from n = 1 to n = 3 and then leveling off or even increasing slightly. (Figure S18). For the O…H and O…O distances, the increase of about 0.1 Å upon going from mono to hexahydrate is consistent with the divalent ions (Figures S19 and S20). The vibrational frequencies (HF/6-31+G*) as a function of hydration number are shown in Figure 15. The effect of hydration is to increase the stretching frequencies by about 40 cm−1 going from n = 0 to n = 6, whereas the deformation frequencies only slightly increase. The splitting is large enough to obfuscate the correlation between the two deformation modes because of the overlap, and these might not be able to be observed separately in aqueous solution.

3.9. Tantalates

Like orthoniobate, the experimental evidence for the existence of orthotantalate (TaO43−), especially in aqueous solution, is scarce. We therefore review some of the literature on the complex chemistry of the Ta2O5·M2O·H2O (M = Li, Na, K, Rb, Cs) phase diagrams and the compounds therein.
The phases Na3TaO4, NaTaO3, and a compound intermediate in composition between Na2Ta4O11 and NaTa3O8 were identified by King et al. [223]. Reisman studied the phase diagrams of Li2O·Ta2O5, Na2O·Ta2O5 [224], and K2O·Ta2O5 [225]. Minor and coworkers studied the tantalum-rich portion of the Rb2O·Ta2O5 phase diagram [218]. Tantalum oxide, upon heating, slowly converts from the room-temperature β-phase to the α-phase at 1360 °C before melting at 1872 °C. The melting point of the β-phase is 1785 °C [225]. Lithium tantalates form with a tantalum to lithium ratio of 3:1 (LiTa3O8), 1:1 (LiTaO3), and 1:3 (Li3TaO4), whereas sodium tantalates form with a tantalum to lithium ratio of 3:1 (NaTa3O8), 2:1 (Na2Ta4O11) and 1:1 (NaTaO3) [224]. Potassium tantalates form with a tantalum-to-potassium ratio of 5:1 (KTa5O13), 2:1 (K2Ta4O11), 1:1 (KTaO3), and 1:3 (K3TaO4) [225].

3.9.1. Tantalum Oxide

For Ta2O5, Brauer found only a single structure that was isomorphic to the low-temperature form of Nb2O5 by powder diffraction [124]. However, Lagergren and Magneli found an additional high-temperature phase with a transition temperature at 1320 ± 20 °C [226], which was confirmed by Reisman et al. at 1360 ± 5 °C [224]. They could not index the lines but suggested a monoclinic or possibly triclinic system with only a small deviation from an orthorhombic system. Frevel and Rinn found a unit cell (a = 7.32 Å, b = 15.55 Å, c = 10.79 Å, β = 120.6°) and a pseudohexagonal modification (a = 3.60(2) Å, c = 3.88(1) Å) [128]. King and coworkers reported an orthorhombic (sub?)cell (a = 6.18 Å, b = 3.66 Å, c = 3.89 Å) with pseudohexagonal subcell a′ = 3.54–3.66 Å, c′ = 3.89 Å [223].

3.9.2. Lithium Tantalates

For Li3TaO4, Reisman was unable to index the powder diffraction patterns [224]. Blasse, however, found that it could be assigned a pseudo-tetragonal unit cell with a = 6.01 Å, c = 16.67 Å [227]. Zocchi and coworkers used X-ray and neutron diffraction to find the structures of the low-temperature β (C2/c, a = b = 8.500(3) Å, c = 9.344(3) Å, β = 117.05(2)°) and high-temperature α (P2/n, a = 6.018(1) Å, b = 5.995(1) Å, c = 12.865 Å, β = 103.53(2)°) phases [228]. Du Boulay reinvestigated the low-temperature form (C2/c, a = 8.508(1) Å, b = 8.516(1) Å, c = 9.338(1) Å, β = 116.869(10)°) [229].
For LiTaO3, Lapitskii and Simanov indexed this salt on the basis of a rhombohedral cell [230]. Abrahams and Bernstein also found it to be rhombohedral by single-crystal X-ray diffraction (R3c, aH = 5.15428(1) Å, cH = 13.78351(2) Å) and found the atomic coordinates to be analogous to the niobate [231]. They repeated the measurements with neutron diffraction to confirm the positions of the lithium atoms between one of the two models [232]. As the temperature increases, it transforms from the ferroelectric phase (R3c) to a paraelectric phase (940 K, R-3c, aT = 5.2203 Å, cT = 13.7631 Å) at the Curie temperature Tc = 907 K, as followed by neutron diffraction at 298K, 760 K, 820 K, 885 K, and 940 K [233]. Hsu and coworkers found the following unit cell parameters: R3c, rhombohedral, a = 5.471(2) Å, α = 56.16(3)° [150].
For LiTa3O8, Reisman was unable to index the powder diffraction patterns [224]. Whiston proposed that this might actually have been Li2Ta8O21 [138]. Gatehouse and Leverett showed that LiTa3O8 was isomorphous to the niobate (P21/c, a = 7.41(5), b = 5.10(4), c = 15.12(10), β = 107.2(1)°) [153]. Roth and coworkers found that there were three crystalline forms, a low-temperature form L-LiTa3O8 (monoclinic, P21/c, a = 7.41 Å, b = 5.10 Å, c = 15.12 Å, β = 107.2°) stable below 800 °C and isomorphic to LiNa3O8, an intermediate temperature form M-LiTa3O8 (monoclinic, Cc or C2/c, a = 9.420 Å, b = 11.536 Å, c = 5.055 Å, β = 91.53°) stable between 800–1100 °C, and a high-temperature form H-LiTa3O8 (orthorhombic, Pmma, P21ma, or Pm2a, a = 16.716 Å, b = 8.941 Å, c = 3.840 Å) stable between 1100°C and the melting temperature of 1600 °C [234]. Gatehouse et al. found by XRD that M-LiTa3O8 was monoclinic (C2/c, a = 9.413(5) Å, b = 11.522(6) Å, c = 5.050(3) Å, β = 91.05(10)°) and similar to the mineral wodginite Mn4B4Ta8O32 [235]. This was confirmed by Santoro et al. using neutron diffraction (C2/c, a = 9.410(2) Å, b = 11.522(2) Å, c = 5.0506(5) Å, β = 91.108(5)°) [236]. Nord and Thomas found by powder and crystal X-ray diffraction that H-LiTa3O8 was orthorhombic (Pmma, a = 16.705(2) Å, b = 3.836(1) Å, c = 8.928(1) Å) but could only locate the lithium atoms by powder neutron diffraction [237]. Werner et al. found by powder X-ray diffraction approximate lithium positions in a series of solid solutions of Li1−xTa3O8−xFx, including x = 0 (a = 16.702(1) Å, b = 3.8485(5) Å, c = 8.9340(5) Å) [238]. Fallon et al. found by single-crystal XRD the space group Pmma, a = 16.702(8) Å, b = 3.840(4) Å, c = 8.929(5) Å [239]. Hodeau et al. revised the space group by electron and neutron diffraction (Pmmn, a = 16.718(2) Å, b = 7.696(1) Å, c = 8.931(1) Å) [240].

3.9.3. Sodium Tantalates

For Na3TaO4, King and coworkers found a hexagonal unit cell (a = 16.40 Å, c = 16.81 Å) [223]. Whiston found a = 12.23 Å, b = 12.85 Å, c = 5.732 Å, β = 121.5° [138].
For NaTaO3, Vousden found an orthorhombic phase at ambient temperature (a = 5.5239 Å, b = 3.8831 Å, c = 5.4778 Å) [162]. King and coworkers found a larger tetragonal (or orthorhombic and pseudotetragonal) unit cell (a = 10.99 Å, b = 10.99 Å, c = 7.64 Å) [223]. Kay and Miles found the orthorhombic distorted perovskite structure from single crystal X-ray diffraction (Pc21n, a = 5.4941 Å, b = 7.7508 Å, c = 5.5130 Å) [241]. Reisman also used an orthorhombic cell (a = 5.5237 Å, b = 2(3.8961) Å, c = 5.4781 Å) [224]. Ismailzade showed that it underwent phase transitions from pseudomonoclinic (296 K, a = c = 3.8895 Å, b = 3.8859 Å, β = 90.37°) to another pseudomonoclinic (753 K, a = c = 3.918 Å, b = 3.8859 Å, β = 90.03°), to tetragonal (823 K, a = b = c = 3.923 Å, β = 90.02°), and then to cubic (903 K, a = b = c= 3.929 Å) [242]. Ahtee used powder diffraction difference reflection intensities to refine the structure to allow tilting of the TaO6 octahedra (Pcmn) [243]. Later, Ahtee used neutron diffraction to reexamine the room-temperature phase (Pcmn, a = 5.4842(2) Å, b = 7.7952(2) Å, c = 5.5213(2) Å), and two high-temperature phases: at 803 K (Bmmb, a = 7.8453(5) Å, b = 7.8541(8) Å, c = 7.8633 (5) Å) and 873 K (Bmmb, a = 7.8560(10) Å, b = 7.8724(7) Å, c = 7.8604 (9) Å); and at 893 K (P4/mbm, aT = 5.5552(3) Å; cT = 3.9338(4) Å) [244]. Darlington re-examined these high-temperature phases using neutron diffraction every 5 K and suggested that the low-temperature structure determined previously was incorrect [177]. Shanker found unit cell parameters: Pbnm, a = 5.5883(4) Å, b = 5.6584(3) Å, c = 7.9309(7) Å [179]. Kennedy and coworkers used powder neutron diffraction to study the phase transitions from 298 K to 933 K [245]. The orthorhombic structure (300 K, Pbnm, a = 5.4768(1) Å, b = 5.5212(1) Å, c = 7.7890(2) Å) transforms to orthorhombic (773 K, Cmcm, a = 7.8337(2), b = 7.8485(3), c = 7.8552(3)) at ~700 K, then to tetragonal (843 K, P4/mbm, a = 5.5503(1) Å, c = 3.9335 (1) Å) at 835 K, and finally to cubic (893 K, Pm-3m, a = 3.9313(1)) above 890 K.
For Na2Ta4O11, King and coworkers found a tetragonal unit cell (a = 11.00 Å, b = 11.00 Å, c = 14.6 Å) [223]. Reisman found an orthorhombic unit cell (a = 6.00 Å, b = 2(3.83) Å, c = 5.08 Å) [224]. Whiston found a tetragonal unit cell (a = 7.860(1) Å, c = 7.152(3) Å) [138]. Chaminade et al. were able to index it in the monoclinic lattice (a = 10.760 Å, b = 6.200 Å, c = 12.720 Å, β = 106.35°) and a hexagonal lattice (a = 6.208 ± 0.003 Å, c = 36.659 ± 0.010 Å) [246]. Similarities were found between this compound and the subsequently discovered mineral natrotantite, which was synthesized by Ercit and coworkers, who found the unit cell parameters (R-3c, a = 6.2092(1) Å, c = 36.619(1) Å) [247]. Mattes and Schaper found a very similar structure (R-3c, a = 6.198(3) Å, c = 36.56(2) Å) and also located the atoms [248].
For NaTa3O8, Reisman assumed an orthorhombic unit cell (a = 2(3.87) Å, b = 2(5.97) Å, c = 5.97 Å) [224]. Whiston claimed that this was actually Na2Ta8O21 with a tetragonal unit cell (a = 12.5 Å, c = 3.92 Å) [138]. Chaminade indexed the latter in an orthorhombic unit cell (a = 12.430 ± 0.005 Å, b = 37.290 ± 0.015 Å, c = 3.900 ± 0.002 Å) [246].

3.9.4. Potassium Tantalates

For K3TaO4, the interplanar spacings were reported but not indexed by Reisman et al. [225]. Whiston also failed to index them [138]. This was identified as a corrosion product of tantalum metal upon the action of potassium by comparison of the powder patterns [249]. Stecura was finally able to index the pattern of the hygroscopic corrosion product and found a body-centered orthorhombic system with a = 14.19(5) Å, b = 17.04(5) Å, and c = 12.41(4) Å [195].
For KTaO3, Vousden found a cubic phase at ambient temperature (a = 3.9885 Å) [162]. The X-ray line spacings of Reisman et al. agreed with those of Vousden [225]. Zhurova et al. also found a cubic system (Pm-3m, a = 3.9883(2)) [250].
For K2Ta4O11, the interplanar spacings were reported but not indexed by Reisman et al. [225]. Sawaguchi observed its formation from KTaO3 by slowly cooling the melt. This tetragonal bronze structure has a = 12.574 Å, c = 3.969 Å [251]. Whiston observed a tripling of one of the axes (a = 37.29 Å, c = 3.878 Å) [138].
For KTa5O13, the interplanar spacings were reported but not indexed by Reisman et al. [222]. Whiston also failed to index these [138]. Awadalla and Gatehouse were successful at determining the unit cell (Pbcm, a = 5.653(3), b = 10.708(5), c = 16.799(7)) and atomic positions [252].

3.9.5. Rubidium Tantalates

Rb3TaO4 was synthesized by Meyer and Hoppe [196]. They found a face-centered cubic structure (a = 8.90 Å).
Rb8Ta6O19·nH2O, n = 4,14 was synthesized by Hartl et al. who found the unit cell parameters (n = 4, C2/c, a = 12.169(4) Å, b = 14.592(5) Å, c = 14.147(4) Å, β = 90.734(6)° and n = 14, P21/n, a = 10.3130(6) Å, b = 15.9072(9) Å, c = 11.5043(6) Å, β = 100.060(1)°) [253]. These compounds consist of discrete [Ta6O19]8− ions.
RbTaO3 was found to be monoclinic by Serafin and Hoppe (C2/m, a = 9.589 Å, b = 8.503 Å, c = 8.135 Å, β = 94.87°) [254].
Du Boulay and coworkers identified orthorhombic Rb3Ta5O14 from synchrotron X-ray data (Pnma, a = 7.3677(3) Å, 14.7904(19) Å, c = 25.379(3) Å) [255].
Iyer and Smith found that RbTa3O8 crystallized with orthorhombic symmetry (space group C222, Cmm2, Cm2m, or Cmmm, a = 13.07 Å, b = 7.26 Å, c = 3.85 Å, β = 105°) [212], whereas Voronkova found a different space group and unit cell (R-3m, a = 7.486(9) Å, c = 43.02(3) Å) [217]. Minor and coworkers found this as well (9-L, hexagonal, a = 7.508 Å, c = 36.41 Å) [218] and also identified a compound Rb8Ta22O59 (11-L) along with some bronzes (labeled GTB—Gatehouse tetragonal bronze and HTB—hexagonal tungsten bronze). They found a hexagonal unit cell (a = 7.5065(7) Å, c = 43.194(5) Å) [218].

3.9.6. Cesium Tantalates

Cs3TaO4 was synthesized by Meyer and Hoppe [196]. They found a face-centered cubic structure (a = 9.29 Å).
Cs8Ta6O19·nH2O, n = 0,14 was synthesized by Hartl et al. who found the unit cell parameters (n = 0, I4/m, a = 9.859(1) Å, c = 14.033(1) Å and n = 14, P21/n, a = 10.554(1) Å, b = 16.149(6) Å, c = 11.714(1) Å, β = 99.97(2)°) [253]. These compounds consist of discrete [Ta6O19]8− ions.
Iyer and Smith found that CsTaO3 crystallized at 1400 °C with monoclinic symmetry (a = 12.90 Å, b = 7.51 Å, c = 14.81 Å, β = 105°) [212].
Serafin and Hoppe investigated the structure of Cs3Ta5O14 (Pbam, a = 26.235(2) Å, b = 7.429(1) Å, c = 7.388 (1) Å) [256]. A reinvestigation by Du Boulay et al. only marginally changed the parameters (Pbam, a = 26.219(6) Å, b = 7.4283(10) Å, c = 7.3914 (10) Å) [257].
Voronkova found for CsTa3O8 the following unit cell (R-3m, a = 7.473(2), c = 42.78(2)) [217].

3.9.7. Calculations on Orthotantalate

The calculated bond lengths and vibrational frequencies for TaO43− are given in Table 10. It is believed that the only structures containing discrete orthotantalate are the salts of rubidium and cesium [193]. To the best of our knowledge, the oxygen positions have not been precisely determined. Our predictions are quite similar for orthotantalate as for orthoniobate, with bond lengths following the trend HF < B3LYP < MP2. To the best of our knowledge, the vibrational frequencies of orthotantalate have not been measured. Like orthoniobate, we expect a clear separation of the symmetric and antisymmetric stretching frequencies but an accidental degeneracy of the deformation frequencies, which are mostly predicted to be within 30 cm−1 of each other. For the B3LYP frequencies, the degeneracy was not strictly maintained, most likely because the density matrix did not maintain full symmetry. The CPCM solvation model gives rise to smaller Ta-O distances and larger stretching frequencies.
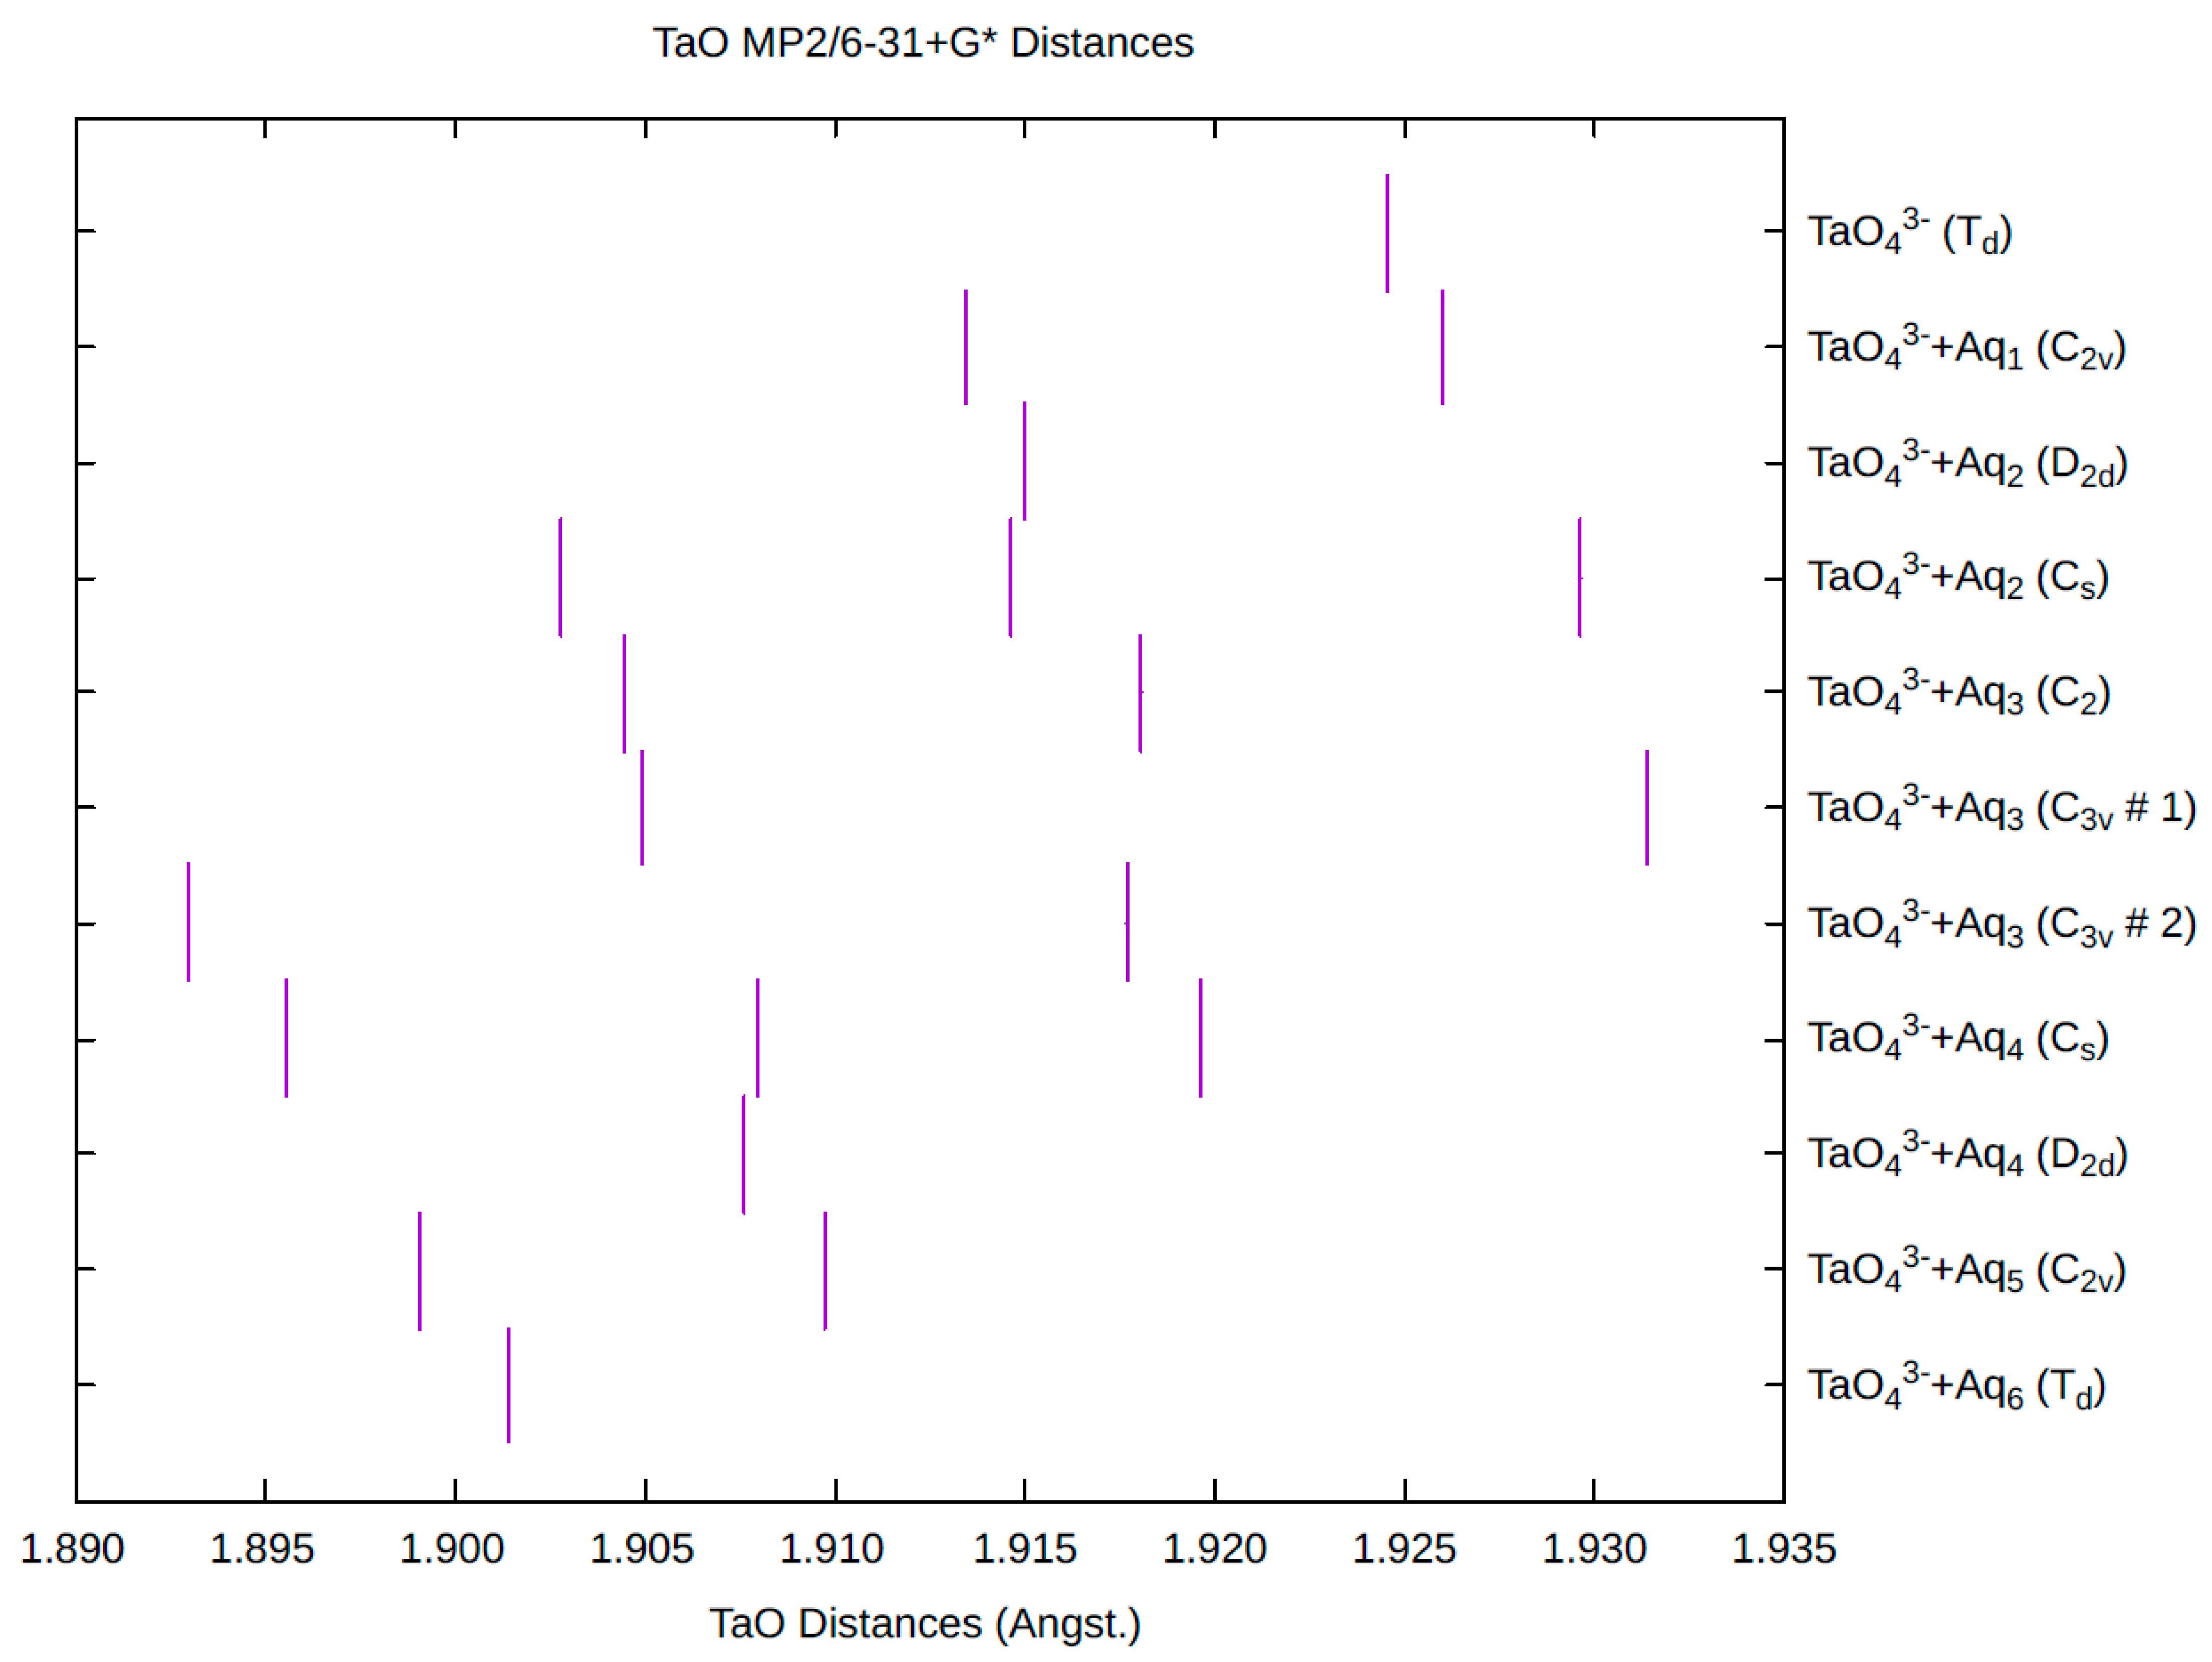
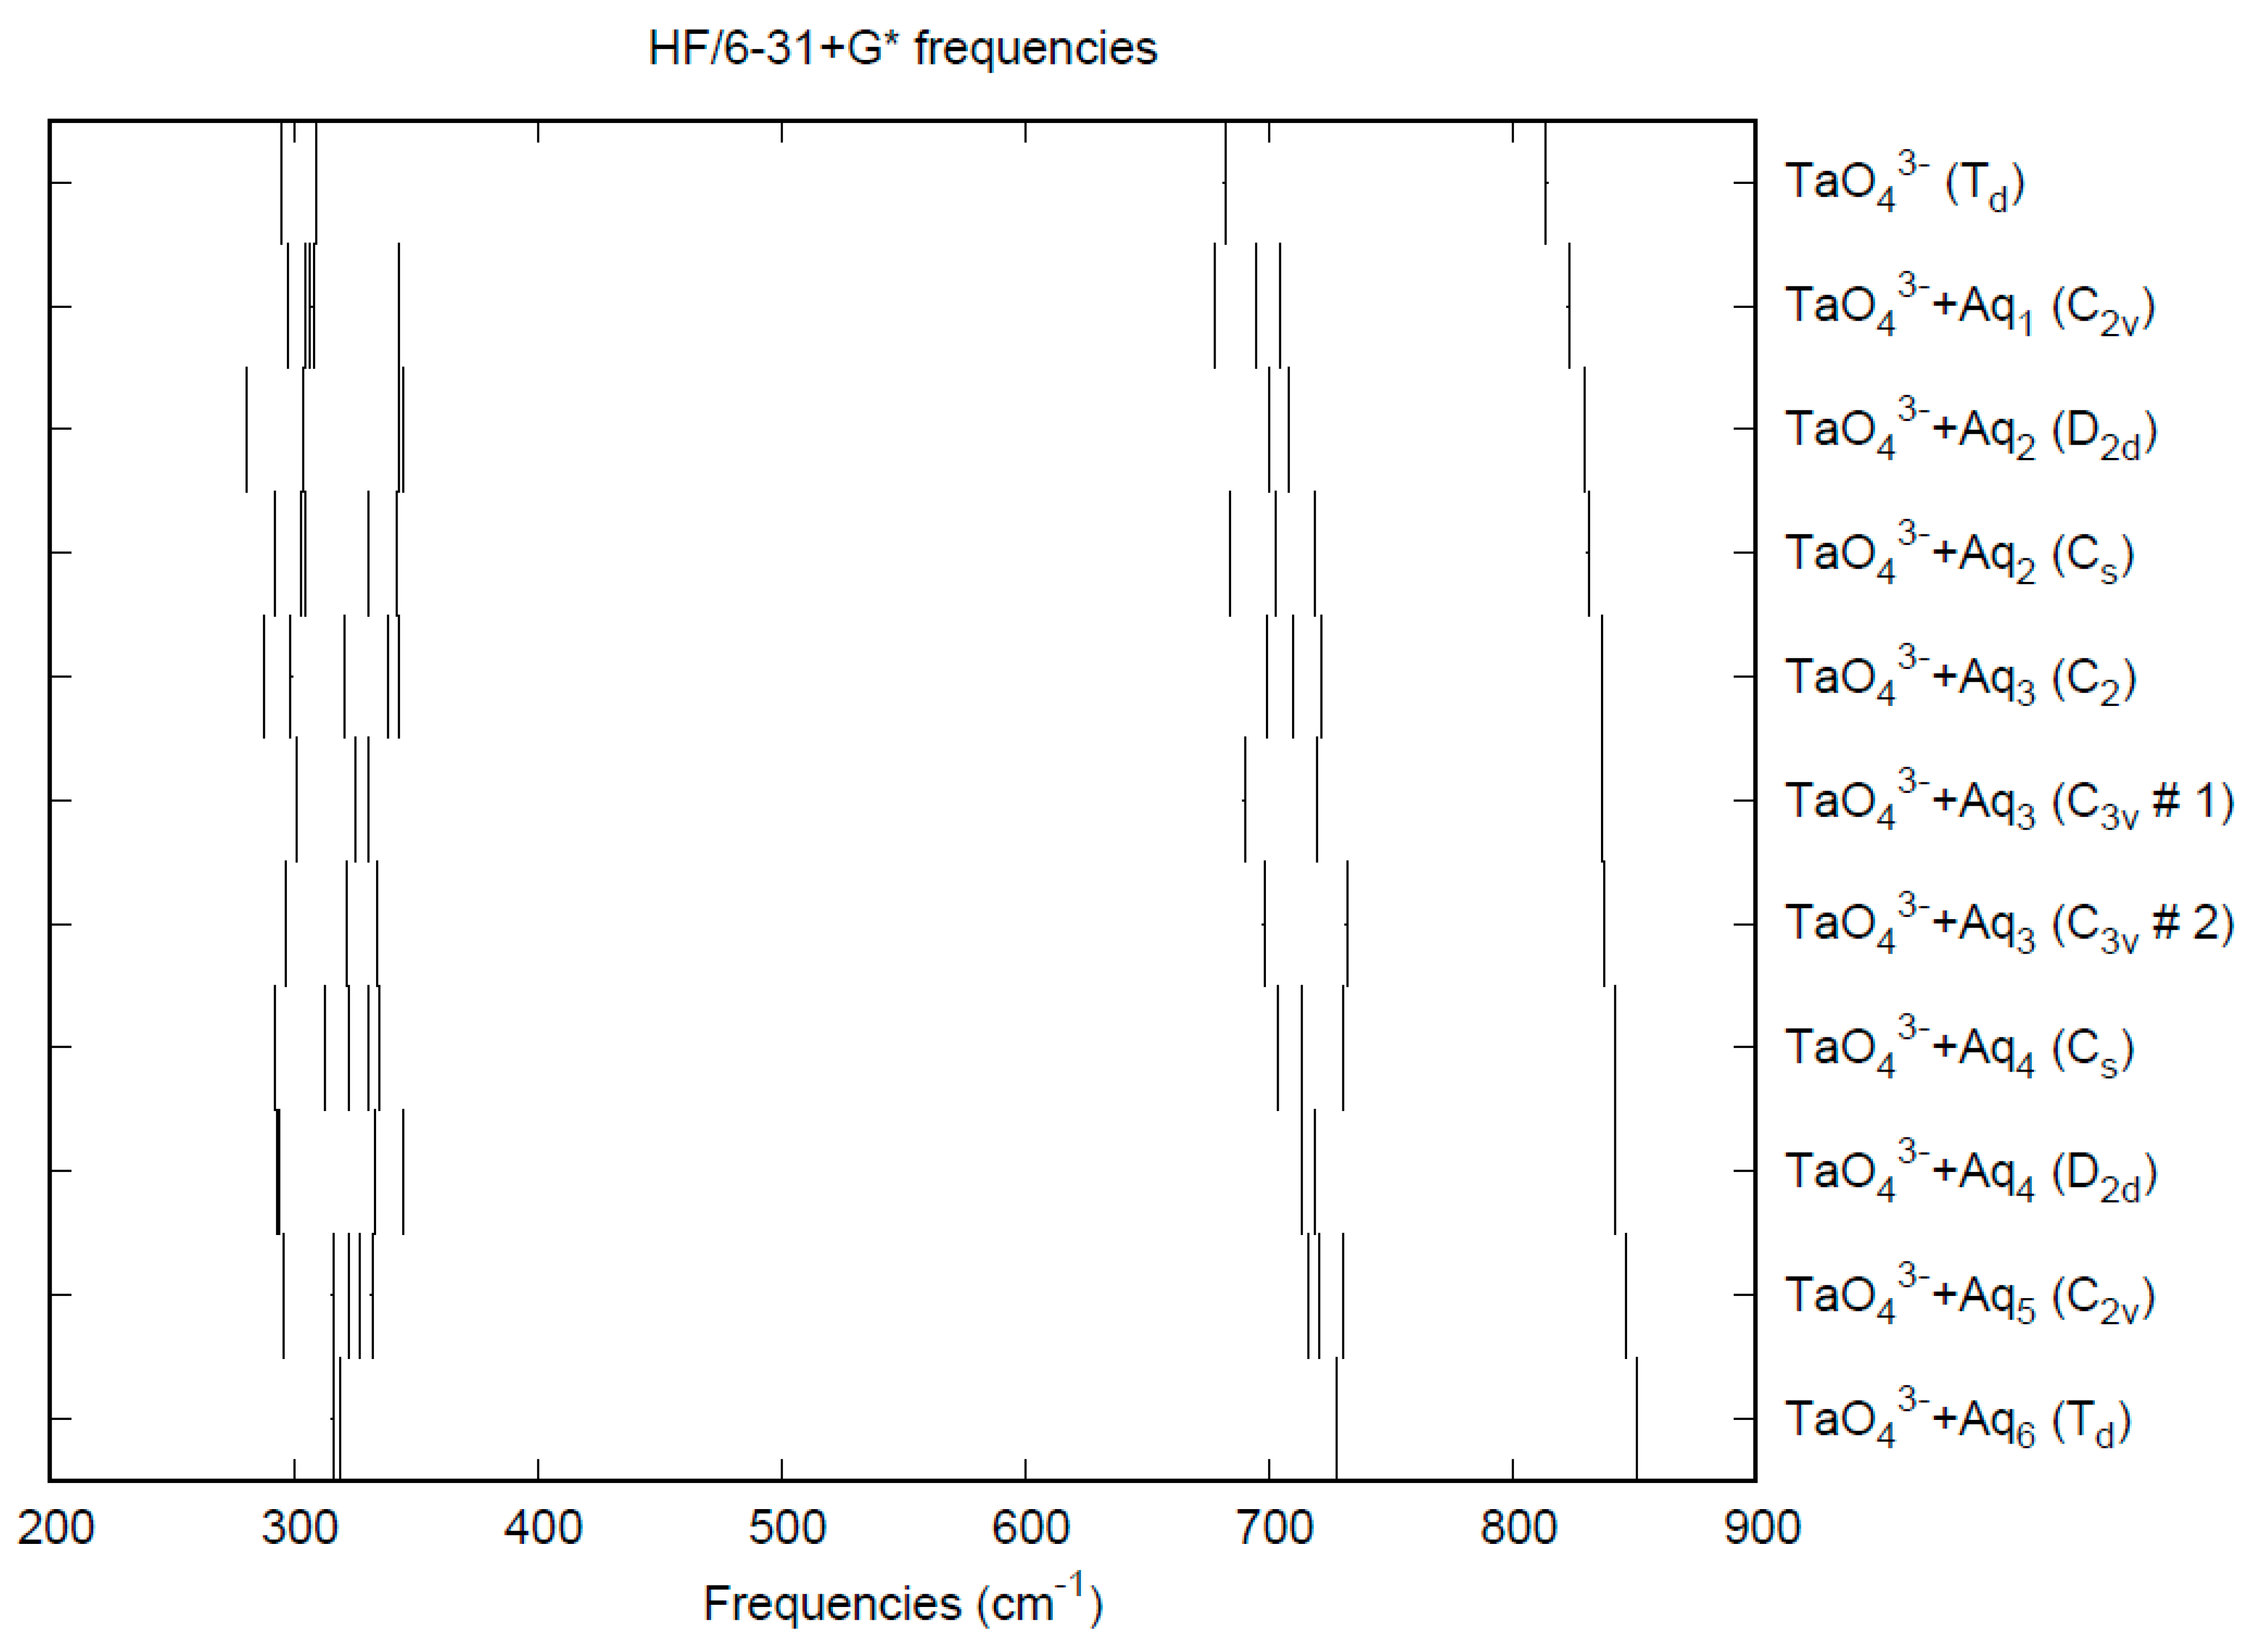
The effect of water upon the Ta-O distances (MP2/6-31+G(d)) in TaO43−nH2O (n = 0–6) is given in Figure 16. The net effect is a moderate shortening of the Ta-O distance by 0.022 Å (n = 6). The individual Ta-O distances vary by up to 0.04 Å. These changes are similar to orthoniobate. The Ta…O distance exhibits an odd behavior similar to orthoniobate, decreasing from n = 1 to n = 3 and then leveling off or even increasing slightly. (Figure S21). For the O…H and O…O distances, the increase of about 0.1 Å upon going from mono to hexahydrate is consistent with orthoniobate (Figures S22 and S23). The vibrational frequencies (HF/6-31+G*) as a function of hydration number are shown in Figure 17. The effect of hydration is to increase the stretching frequencies by about 40 cm−1 going from n = 0 to n = 6, whereas the deformation frequencies only slightly increase. The splitting is large enough to obfuscate the correlation between the two deformation modes because of the overlap, and these might not be able to be observed separately in aqueous solution. This behavior is similar to orthoniobate.

4. Discussion

For most of the tetrahedral species discussed above, the B3LYP/6-31+G* level of theory gives excellent values of the metal-oxygen bond distance and the vibrational frequencies. This result is encouraging, given the small basis set size and the lack of a solvation model. The overall trends for the anions upon hydration are, for the most part, consistent with our previous work on similar anions [8]. In some cases, the MP2-FC level severely overestimates the vibrational frequencies. Our standard assumption of the structures of the hydrated anions, based on our prior calculations, can sometimes give small imaginary frequencies, usually at the MP2/6-31G* and B3LYP/6-31G* levels, which may be due to the lack of diffuse functions on these basis sets. These assumptions were shown to be incorrect for the neutral species RuO4 and OsO4. For the highly charged orthoniobate and orthotantalate anions, convergence difficulties were observed for some structures for the B3LYP levels.
Based on these calculations, we predict that it will be difficult or impossible to prepare FeO4, especially in aqueous solution, as attempts to hydrate this molecule often led to hydrated forms of FeO22-O2), FeO(μ3-O3), O + FeO3, or even O + FeO2(OH)2. The extremely basic nature of NbO43− and TaO43− suggests that these could only exist in extremely basic aqueous solutions. Ions derived from niobium(V) and tantalum(V) tend to be octahedrally coordinated and/or strongly condensed into more complex ions such as NbO55−, NbO67−, Nb4O124−, Nb4O1612−, and Ta6O198−. We believe that the best chance to observe the NbO43− and TaO43− ions in aqueous solution would be by flowing concentrated rubidium or cesium hydroxide over the corresponding orthoniobate or tantalate salt and quickly observing downstream before these coordination expansion/condensation reactions can happen.

5. Conclusions

A series of ab initio and density functional calculations at several levels of theory on several hydrated permanganate, pertechnetate, perrhenate, chromate, molybdate, tungstate, orthoniobate, orthotantalate ions; and of iron(VIII), ruthenium(VIII), and osmium(VIII) oxide have been carried out and structural and vibrational characteristics determined. Based on a careful comparison of the experimental X-ray diffraction and solution vibrational spectra of known species to our calculations, the B3LYP/6-31+G* level of theory can reproduce experiment fairly well and allows us to make predictions for the as yet unknown FeO4, NbO43−, and TaO43− species.

Supplementary Materials

The following supporting information can be downloaded at: https://www.mdpi.com/article/10.3390/liquids4030031/s1, Figures S1–S23: Distances in the hydrated species; Tables S1 and S2: Total electronic energies; Table S3: Geometric and vibrational parameters.

Author Contributions

Conceptualization, C.C.P.; methodology, C.C.P.; validation, C.C.P.; formal analysis, C.C.P. and B.L.G.; investigation, C.C.P., B.L.G. and J.P.F.; data curation, C.C.P.; writing—original draft preparation, C.C.P.; writing—review and editing, C.C.P.; visualization, C.C.P.; supervision, C.C.P.; project administration, C.C.P.; funding acquisition, C.C.P. All authors have read and agreed to the published version of the manuscript.

Funding

This research was funded by Saint Mary’s University Faculty of Graduate Studies and Research Internal Research Grants Summer 2011 (BLG) and Summer 2013 (JPF) and by the Natural Sciences and Engineering Research Council of Canada.

Data Availability Statement

The total energies of all species are contained in the Supplementary Materials.

Acknowledgments

The authors thank ACEnet, Compute Canada, and the Digital Research Alliance of Canada for computational support.

Conflicts of Interest

The authors declare no conflicts of interest. The funders had no role in the design of the study, in the collection, analyses, or interpretation of data, in the writing of the manuscript, or in the decision to publish the results.

References

  1. Richens, D.T. The Chemistry of Aqua Ions; Wiley: Chichester, UK, 1997. [Google Scholar]
  2. Applegarth, L.M.S.G.A.; Corbeil, C.R.; Mercer, D.J.W.; Pye, C.C.; Tremaine, P.R. Raman and ab Initio Investigation of Aqueous Cu(I) Chloride Complexes from 25 to 80 °C. J. Phys. Chem. B 2014, 118, 204–214, and references 41, 42, 44 therein. [Google Scholar] [CrossRef] [PubMed]
  3. Pye, C.C.; Gunasekara, C.M. An Ab Initio Investigation of the Hydration of Thallium(III) and Mercury(II). J. Sol. Chem. 2020, 49, 1419–1429. [Google Scholar] [CrossRef]
  4. Pye, C.C.; Whynot, D.C.M.; Corbeil, C.R.; Mercer, D.J.W. Desymmetrization in geometry optimization: Application to an ab initio study of copper(I) hydration. Pure Appl. Chem. 2020, 92, 1643–1654. [Google Scholar] [CrossRef]
  5. Pye, C.C.; Gunasekara, C.M. An Ab Initio Investigation of the Hydration of Lead(II). Liquids 2022, 2, 39–49. [Google Scholar] [CrossRef]
  6. Pye, C.C.; Gunasekara, C.M. An Ab Initio Investigation of the Hydration of Tin(II). Liquids 2022, 2, 465–473. [Google Scholar] [CrossRef]
  7. Pye, C.C.; Gunasekara, C.M. An Ab Initio Investigation of the Hydration of Antimony(III). Liquids 2024, 4, 322–331. [Google Scholar] [CrossRef]
  8. Pye, C.C.; Walker, V.E.J. Ab Initio Investigation of the Hydration of the Tetrahedral Perchlorate, Perbromate, Selenate, Arsenate, and Vanadate Anions. J. Phys. Chem. A 2011, 115, 13007–13015, and references 9, 10 therein. [Google Scholar] [CrossRef] [PubMed]
  9. Pye, C.C.; Michels, M.R. An ab Initio Investigation of Hydrogen Phosphate Ion Hydration. Can. J. Anal. Sci. Spectrosc. 2004, 49, 175–184. [Google Scholar]
  10. Pye, C.C.; Michels, M.R. An ab Initio Investigation of Dihydrogen Phosphate Ion Hydration. Can. J. Anal. Sci. Spectrosc. 2005, 50, 70–86. [Google Scholar]
  11. Pye, C.C. An ab initio study of the effect of hydration on the vibrational spectrum of hydrogen sulfate. Comp. Theor. Chem. 2020, 1176, 112749. [Google Scholar] [CrossRef]
  12. Pye, C.C.; Akbari, P.; Goodall, B.L.; Shah Alam, M.Y. An ab initio study of the effect of hydration on the vibrational spectrum of hydrogen selenate ion. J. Mol. Liq. 2022, 359, 119383. [Google Scholar] [CrossRef]
  13. Pye, C.C.; Chiome, T.; Goodall, B.L. An ab initio study of the effect of hydration on the vibrational spectrum of hydrogen arsenate ion. Comp. Theor. Chem. 2022, 1215, 113838. [Google Scholar] [CrossRef]
  14. Pye, C.C.; Berryman, V.E.J.; Goodall, B.L. An Ab Initio Study of the Effect of Hydration on the Vibrational Spectrum of Hydrogen Vanadate Ion. J. Solution Chem. 2024, 53, 626–641. [Google Scholar] [CrossRef]
  15. Applegarth, L.M.S.G.A.; Pye, C.C.; Cox, J.S.; Tremaine, P.R. Raman Spectroscopic and ab Initio Investigation of Aqueous Boric Acid, Borate, and Polyborate Speciation from 25 to 80 °C. Ind. Eng. Chem. Res. 2017, 56, 13983–13996. [Google Scholar] [CrossRef]
  16. Pye, C.C. A Crystallographic Review of Alkali Borate Salts and Ab Initio Study of Borate Ions/Molecules. In Concepts, Methods and Applications of Quantum Systems in Chemistry and Physics, Progress in Theoretical Chemistry and Physics; Wang, Y.A., Thachuk, M., Krems, R., Maruani, J., Eds.; Springer: Cham, Switzerland, 2018; Volume 31, pp. 107–142. [Google Scholar]
  17. Pye, C.C. An Ab Initio Study of Boric Acid, Borate, and their Interconversion. In Concepts, Methods and Applications of Quantum Systems in Chemistry and Physics, Progress in Theoretical Chemistry and Physics; Wang, Y.A., Thachuk, M., Krems, R., Maruani, J., Eds.; Springer: Cham, Switzerland, 2018; Volume 31, pp. 143–177. [Google Scholar]
  18. Sasidharanpillai, S.; Cox, J.S.; Pye, C.C.; Tremaine, P.R. A Raman spectroscopic and ab initio investigation of aqueous boron speciation under alkaline hydrothermal conditions: Evidence for the structure and thermodynamic stability of the diborate ion. Dalton Trans. 2023, 52, 18391–18406. [Google Scholar] [CrossRef] [PubMed]
  19. Goodall, B.L. An Ab Initio Investigation of the Hydration of the d0 Transition Metal Tetraoxo Complexes: CrO42−, MnO4, FeO4. Honours Thesis, Saint Mary’s University, Halifax, UK, 2012. [Google Scholar]
  20. Frisch, M.J.; Trucks, G.W.; Schlegel, H.B.; Scuseria, G.E.; Robb, M.A.; Cheeseman, J.R.; Montgomery, J.A., Jr.; Vreven, T.; Kudin, K.N.; Burant, J.C.; et al. Gaussian 03, Revision D.02; Gaussian, Inc.: Wallingford, CT, USA, 2004.
  21. Frisch, M.J.; Trucks, G.W.; Schlegel, H.B.; Scuseria, G.E.; Robb, M.A.; Cheeseman, J.R.; Scalmani, G.; Barone, V.; Petersson, G.A.; Nakatsuji, H.; et al. Gaussian 16, Revision C.01; Gaussian, Inc.: Wallingford, CT, USA, 2019.
  22. Mooney, R.C.L. The Crystal Structure of Potassium Permanganate. Phys. Rev. 1931, 37, 1306–1310. [Google Scholar] [CrossRef]
  23. Ramaseshan, S.; Venkatesan, K.; Mani, N.V. The use of anomalous scattering for the determination of crystal structures—KMnO4. Proc. Indian Acad. Sci. A 1957, 46, 95–111. [Google Scholar] [CrossRef]
  24. Palenik, G.J. Crystal Structure of Potassium Permanganate. Inorg. Chem. 1967, 6, 503–507. [Google Scholar] [CrossRef]
  25. Hoppe, R.; Fischer, D.; Schneider, J. Zur Kenntnis von Oxyden A[MO4]: Über LiMnO4, KMnO4, RbMnO4, CsMnO4 sowie RbIO4 und CsIO4. (-Was heißt eigenlich „Die Kristallstruktur von...“?-) [On the Knowledge of Oxides A[MO4]: On LiMnO4, KMnO4, RbMnO4, CsMnO4 as well as RbIO4, CsIO4. (– What does ”The Crystal Structure of...“ mean? –)]. Z. Anorg. Allg. Chem. 1999, 625, 1135–1142. (In German) [Google Scholar]
  26. Marabello, D.; Bianchi, R.; Gervasio, G.; Cargnoni, F. An experimental (120 K) and theoretical electron-density study of KMnO4 and KClO4. Acta Crystallogr. A 2004, 60, 494–501. [Google Scholar] [CrossRef]
  27. Fischer, D.; Hoppe, R.; Schaefer, W.; Knight, K.S. Koordinationszahl 4 oder 6 für Lithium?: Die Kristallstruktur von Wasserfreiem Lithiumpermanganat, Li[MnO4] [Coordination number 4 or 6 for Lithium?: The Crystal Structure of Lithium Permanganate Li[MnO4]]. Z. Anorg. Allg. Chem. 1993, 619, 1419–1425. (In German) [Google Scholar] [CrossRef]
  28. Bauchert, J.M.; Henning, H.; Schleid, T. Synthesis and crystal structure of anhydrous Na[MnO4]. Z. Naturforsch. B 2016, 71, 993–995. [Google Scholar] [CrossRef]
  29. Ketelaar, J.A.A. Die Kristallstruktur von K-, Rb-, Cs-, und Tl-Silicofluorid und von LiMnO4·3H2O [The crystal structure of K-, Rb-, Cs-, and Tl-hexafluorosilicate, and of LiMnO4·3H2O]. Z. Krist. 1935, 92, 155–156. (In German) [Google Scholar]
  30. Fischer, D.; Hoppe, R. Uber den Aufbau von LiMnO4·3H2O = [Li(OH2)6/2][MnO4] [On the structure of LiMnO4·3H2O = [Li(OH2)6/2][MnO4]]. Z. Anorg. Allg. Chem. 1990, 590, 18–22. (In German) [Google Scholar] [CrossRef]
  31. Kiefer, W.; Bernstein, H.J. Resonance Raman effect in MnO4 with 5145 Å laser excitation. Chem. Phys. Lett. 1971, 8, 381–383. [Google Scholar] [CrossRef]
  32. Kiefer, W.; Bernstein, H.J. The resonance Raman effect of the permanganate and chromate ions. Mol. Phys. 1972, 23, 835–851. [Google Scholar] [CrossRef]
  33. Weinstock, N.; Schulze, H.; Müller, A. Assignment of ν2(E) and ν4(F2) of tetrahedral species by the calculation of the relative Raman intensities: The vibrational spectra of VO43−, CrO42−, MoO42−, WO42−, MnO4, TcO4, ReO4, RuO4, and OsO4. J. Chem. Phys. 1973, 59, 5063–5067. [Google Scholar] [CrossRef]
  34. Dong, J.; Wang, Y.; Zhou, M. The vibrational spectrum of the MnO2 and MnO4 anions in solid argon. Chem. Phys. Lett. 2002, 364, 511–516. [Google Scholar] [CrossRef]
  35. Wolfsberg, M.; Helmholz, L. The Spectra and Electronic Structure of the Tetrahedral Ions MnO4, CrO42−, and ClO4. J. Chem. Phys. 1952, 20, 837–843. [Google Scholar] [CrossRef]
  36. Ballhausen, C.J. A vibrational analysis of the MnO4 bands. Theor. Chim. Acta 1963, 1, 285–293. [Google Scholar] [CrossRef]
  37. Holt, S.L.; Ballhausen, C.J. Low temperature absorption spectra of KMnO4 in KClO4. Theor. Chim. Acta 1967, 7, 313–320. [Google Scholar] [CrossRef]
  38. Hillier, I.H.; Saunders, V.R. Ab initio Molecular Orbital Calculations of the Ground and Excited States of the Permanganate and Chromate Ions. Proc. Roy. Soc. London A 1970, 320, 161–173. [Google Scholar]
  39. Wood, M.H. An ab initio study of the ground and low-lying excited states of the permanganate ion. Theor. Chim. Acta 1975, 36, 309–315. [Google Scholar] [CrossRef]
  40. Dickson, R.M.; Ziegler, T. A Density Functional Study of the Electronic Spectrum of Permanganate. Int. J. Quant. Chem. 1996, 58, 681–687. [Google Scholar] [CrossRef]
  41. Stuckl, A.C.; Daul, C.A.; Gudel, H.U. Excited-state energies and distortions of d transition metal tetraoxo complexes: A density functional study. J. Chem. Phys. 1997, 107, 4606–4617. [Google Scholar] [CrossRef]
  42. Buhl, M. Structure, Dynamics, and Magnetic Shieldings of Permanganate Ion in Aqueous Solution. A Density Functional Study. J. Phys. Chem. A 2002, 106, 10505–10509. [Google Scholar] [CrossRef]
  43. Carbonniere, P.; Ciofini, I.; Adamo, C.; Pouchan, C. Vibrational behavior of tetrahedral d0 oxo-compounds: A theoretical study. Chem. Phys. Lett. 2006, 429, 52–57. [Google Scholar] [CrossRef]
  44. Jose, L.; Seth, M.; Ziegler, T. Molecular and Vibrational Structure of Tetroxo d0 Metal Complexes in their Excited States. A Study Based on Time-Dependent Density Functional Calculations and Franck-Condon Theory. J. Phys. Chem. A 2012, 116, 1864–1876. [Google Scholar] [CrossRef] [PubMed]
  45. Su, J.; Xu, W.-H.; Xu, C.-F.; Schwarz, W.H.E.; Li, J. Theoretical Studies on the Photoelectron and Absorption Spectra of MnO4 and TcO4. Inorg. Chem. 2013, 52, 9867–9874. [Google Scholar] [CrossRef]
  46. Almeida, N.M.S.; McKinlay, R.G.; Paterson, M.J. Excited electronic states of MnO4: Challenges for wavefunction and density functional response theories. Chem. Phys. 2015, 446, 86–91. [Google Scholar] [CrossRef]
  47. Olsen, J.M.H.; Hedegard, E.D. Modeling the absorption spectrum of the permanganate ion in vacuum and in aqueous solution. Phys. Chem. Chem. Phys. 2017, 19, 15870–15875. [Google Scholar] [CrossRef] [PubMed]
  48. Smiechowski, M.; Persson, I. Hydration of Oxometallate Ions in Aqueous Solution. Inorg. Chem. 2020, 59, 8231–8239. [Google Scholar] [CrossRef] [PubMed]
  49. Krebs, B.; Hasse, K.-D. Refinements of the Crystal Structures of KTcO4, KReO4 and OsO4. The Bond Lengths in Tetrahedral Oxo-Anions and Oxides of d0 Transition Metals. Acta Crystallogr. B 1976, 32, 1334–1337. [Google Scholar] [CrossRef]
  50. German, K.F.; Grigoriev, M.S.; Garashchenko, B.L.; Kopytin, A.V.; Tyupina, E.A. Redetermination of the crystal structure of NaTcO4 at 100 and 296 K based on single-crystal X-ray data. Acta Crystallogr. E 2017, 73, 1037–1040. [Google Scholar] [CrossRef]
  51. Weaver, J.; Soderquist, C.Z.; Washton, N.M.; Lipton, A.D.; Gassman, P.L.; Lukens, W.W.; Kruger, A.A.; Wall, N.A.; McCloy, J.S. Chemical Trends in Solid Alkali Pertechnetates. Inorg. Chem. 2017, 56, 2533–2544. [Google Scholar] [CrossRef]
  52. Meyer, G.; Hoppe, R. Die Kristallstruktur von CsTcO4 [The crystal structure of CsTcO4]. Z. Anorg. Allg. Chem. 1976, 420, 40–50. (In German) [Google Scholar] [CrossRef]
  53. Maruk, A.Y.; Grigorev, M.S.; German, K.E. Lithium Pertechnetate Trihydrate LiTcO4·3H2O: Synthesis and Crystal Structure. Russ. J. Coord. Chem. 2011, 37, 444–446. [Google Scholar]
  54. Busey, R.H.; Keller, O.L., Jr. Structure of the Aqueous Pertechnetate Ion by Raman and Infrared Spectroscopy. Raman and Infrared Spectra of Crystalline KTcO4, KReO4, Na2MoO4, Na2WO4, Na2MoO4·2H2O, and Na2WO4·2H2O. J. Chem. Phys. 1964, 41, 215–225. [Google Scholar] [CrossRef]
  55. Morrow, J.C. The crystal structure of KReO4. Acta Crystallogr. 1960, 13, 443–445. [Google Scholar] [CrossRef]
  56. Lock, C.J.L.; Turner, G. A Reinvestigation of the Crystal Structure of Potassium Perrhenate. Acta Crystallogr. B 1975, 31, 1764–1765. [Google Scholar]
  57. Brown, R.J.C.; Powell, B.M.; Stuart, S.N. Thermal Effects in the Structure of Potassium Perrhenate. Acta Crystallogr. C 1993, 49, 214–216. [Google Scholar] [CrossRef]
  58. Atzesdorfer, A.; Range, K.-J. Sodium Metaperrhenate, NaReO4: High Pressure Synthesis of Single Crystals and Structure Refinement. Z. Naturforsch. B 1995, 50, 1417–1418. [Google Scholar] [CrossRef]
  59. Beintema, J. Die Kristallstruktur der Alkaliperrhenate und -perjodate [The crystal structure of alkali perrhenate and periodate]. Z. Kristallogr. 1937, 97, 300–322. (In German) [Google Scholar] [CrossRef]
  60. Rogner, P.; Range, K.-J. Strukturverfeinerung von Rubidiumperrhenat bei 297 und 159 K [Structure Refinement of Rubidium Perrhenate at 297 and 159 K]. Z. Naturforsch. B 1993, 48, 233–234. (In German) [Google Scholar] [CrossRef]
  61. Jaeger, F.M.; Beintema, J. The Crystalstructure of Cesium-, Thallium- and Rubidium-Perrhenates. Proc. K. Ned. Akad. Wet. 1933, 36, 523–528. [Google Scholar]
  62. Rogner, P.; Range, K.-J. The Crystal Structure of β-CsReO4, the Room-Temperature Modification of Cesium Perrhenate. Z. Naturforsch. B 1993, 48, 685–687. [Google Scholar] [CrossRef]
  63. Range, K.-J.; Rogner, P.; Heyns, A.M.; Prinsloo, L.C. An X-Ray, Raman and IR Study of α-CsReO4, the High-Temperature Modification of Cesium Perrhenate. Z. Naturforsch. B 1992, 47, 1513–1520. [Google Scholar] [CrossRef]
  64. Betz, T.; Hoppe, R. Über Perrhenate.1. Zur Kenntnis von LiReO4 [About Perrhenates. 1. On LiReO4]. Z. Anorg. Allg. Chem. 1983, 500, 23–30. (In German) [Google Scholar] [CrossRef]
  65. Abakumov, A.M.; Rozova, M.G.; Shpanchenko, R.V.; Mironov, A.V.; Antipov, E.V.; Bramnik, K.G. Synthesis and crystal structure of the lithium perrhenate monohydrate LiReO4·H2O. Solid State Sci. 2001, 3, 581–586. [Google Scholar] [CrossRef]
  66. Khrustalev, V.N.; Varfolomeev, M.B.; Shamrai, N.B.; Lindeman, S.V.; Struchkov, Y.T. The Crystal Structure of Lithium Perrhenate Sesquihydrate. Russ. J. Inorg. Chem. 1995, 40, 197–201, Translation of Zh. Neorg. Khim. pp. 208–213. [Google Scholar]
  67. Pley, M.; Wickleder, M.S. Two crystalline modifications of RuO4. J. Solid State Chem. 2005, 178, 3206–3209. [Google Scholar] [CrossRef]
  68. Trehoux, J.; Thomas, D.; Nowogrocki, G.; Tridot, G. Étude cristallographique du tétroxyde de ruthenium, du nitrosopentachlorure d’ammonium et du dichlorure de ruthenium chloropentammine [Crystallographic study of ruthenium tetroxide, ammonium nitrosopentachlororuthenide(III) and chloropentammineruthenium(III) dichloride]. Compt. Rend. C 1969, 268, 246–249. (In French) [Google Scholar]
  69. Ueki, T.; Zalkin, A.; Templeton, D.H. The Crystal Structure of Osmium Tetroxide. Acta Crystallogr. 1965, 19, 157–160. [Google Scholar] [CrossRef]
  70. Seip, H.M.; Stolevik, R. Studies on the Failure of the First Born Approximation In Electron Diffraction. II. Osmium Tetroxide. Acta Chem. Scand. 1966, 20, 385–394. [Google Scholar] [CrossRef]
  71. Dodd, R.E. Infra-red Spectra of Ruthenium and Osmium Tetroxides. Trans. Faraday Soc. 1959, 55, 1480–1483. [Google Scholar] [CrossRef]
  72. Ortner, M.H. Infrared Spectrum and Thermodynamic Properties of Ruthenium Tetroxide. J. Chem. Phys. 1961, 34, 556–558. [Google Scholar] [CrossRef]
  73. Griffith, W.P. Raman spectra of ruthenium tetroxide and related species. J. Chem. Soc. A 1968, 1663–1664. [Google Scholar] [CrossRef]
  74. Woodward, L.A.; Roberts, H.L. The Raman and Infra-red Absorption Spectra of Osmium Tetroxide: Relation to the Structure of the Perrhenate and Tungstate Ions in Aqueous Solution. Trans. Faraday Soc. 1956, 52, 615–619. [Google Scholar] [CrossRef]
  75. Huston, J.L.; Claassen, H.H. Raman Spectra and Force Constants for OsO4 and XeO4. J. Chem. Phys 1970, 52, 5646–5648. [Google Scholar] [CrossRef]
  76. McDowell, R.S.; Goldblatt, M. The Vibrational Spectrum and Force Field of Osmium Tetroxide. Inorg. Chem. 1971, 10, 625–630. [Google Scholar] [CrossRef]
  77. Huang, W.; Xing, D.-H.; Lu, J.-B.; Long, B.; Schwarz, W.H.E.; Li, J. How Much Can Density Functional Approximations (DFA) Fail? The Extreme Case of the FeO4 Species. J. Chem. Theory Comput. 2016, 12, 1525–1533. [Google Scholar] [CrossRef] [PubMed]
  78. Miller, J.J. The Crystal Structure of Anhydrous Sodium Chromate, Na2CrO4. Z. Kristallogr. 1936, 94, 131–136. [Google Scholar] [CrossRef]
  79. Zachariasen, W.H.; Ziegler, G.E. The Crystal Structure of Potassium Chromate, K2CrO4. Z. Kristallogr. 1931, 80, 164–173. [Google Scholar] [CrossRef]
  80. Smith, H.W., Jr.; Colby, M.Y. The Crystal Structure of Rubidium Chromate, Rb2CrO4. Z. Kristallogr. 1941, 103, 90–95. [Google Scholar] [CrossRef]
  81. Miller, J.J. The Crystal Structure of Caesium Chromate, Cs2CrO4. Z. Kristallogr. 1938, 99, 32–37. [Google Scholar] [CrossRef]
  82. McGinnety, J.A. Redetermination of the Structures of Potassium Sulphate and Potassium Chromate: The Effect of Electrostatic Crystal Forces upon Observed Bond Lengths. Acta Crystallogr. B 1972, 28, 2845–2852. [Google Scholar] [CrossRef]
  83. Toriumi, K.; Saito, Y. Electron-Density Distribution in Crystals of α-K2CrO4. Acta Crystallogr. B 1978, 34, 3149–3156. [Google Scholar] [CrossRef]
  84. Brown, I.D.; Faggiani, R. Refinement of the Crystal Structure of Lithium Chromate. Acta Crystallogr. B 1975, 31, 2364–2365. [Google Scholar] [CrossRef]
  85. Nimmo, J.K. Sodium Chromate (II) at 296 K (Neutron). Acta Crystallogr. B 1981, 37, 431–433. [Google Scholar] [CrossRef]
  86. Aleksovska, S.; Nyburg, S.C.; Pejov, L.; Petrusevski, V.M. β-K2SO4-Type Isomorphs: Prediction of Structures and Refinement of Rb2CrO4. Acta Crystallogr. B 1998, 54, 115–120. [Google Scholar] [CrossRef]
  87. Morris, A.J.; Kennard, C.H.L.; Moore, F.H.; Smith, G.; Montgomery, H. Cesium Chromate, CrCs2O4 (Neutron). Cryst. Struct. Comm. 1981, 10, 529–532. [Google Scholar]
  88. Ruben, H.; Olovsson, I.; Zalkin, A.; Templeton, D.H. Sodium Chromate Tetrahydrate. Acta Crystallogr. B 1973, 29, 2963–2964. [Google Scholar] [CrossRef]
  89. Kahlenberg, V. Crystal structures of two hydrated sodium chromates: Na2CrO4 × 10H2O and Na2CrO4 × 1.5H2O. Z. Kristallogr. 2012, 227, 621–628. [Google Scholar] [CrossRef]
  90. Cadbury, W.E., Jr.; Meldrum, W.B.; Lucasse, W.W. Transition Phenomena Involving Decahydrated Mixed Crystals of Sodium Sulfate and Sodium Chromate. J. Am. Chem. Soc. 1941, 63, 2262–2267. [Google Scholar] [CrossRef]
  91. Richards, T.W.; Kelley, G.L. The Transition Temperatures of Sodium Chromate as Convenient Fixed Points in Thermometry. J. Am. Chem. Soc. 1911, 33, 847–863. [Google Scholar] [CrossRef]
  92. Venkateswaran, C.S. The Raman Spectra of Some Inorganic Compounds. Proc. Indian Acad. Sci. 1938, 7, 144–155. [Google Scholar] [CrossRef]
  93. Stammreich, H.; Bassi, D.; Sala, O. Raman spectrum and force constants of the chromate ion. Spectrochim. Acta 1958, 12, 403–405. [Google Scholar] [CrossRef]
  94. Michel, G.; Machiroux, R. Raman Spectroscopic Investigations of the CrO42−/Cr2O72− Equilibrium in Aqueous Solution. J. Raman. Spectrosc. 1983, 14, 22–27. [Google Scholar] [CrossRef]
  95. Hoffmann, M.M.; Darab, J.G.; Fulton, J.L. An Infrared and X-ray Absorption Study of the Equilibria and Structures of Chromate, Bichromate, and Dichromate in Ambient Aqueous Solutions. J. Phys. Chem. A 2001, 105, 1772–1782. [Google Scholar] [CrossRef]
  96. Barinova, A.V.; Rastsvetaeva, R.K.; Nekrasov, Y.V.; Pushcharovskii, D.Y. Crystal structure of Li2MoO4. Dokl. Chem. 2001, 376, 16–19, translation of Dokl. Akad. Nauk 2001, 376, 343–346. [Google Scholar] [CrossRef]
  97. Yip, T.W.S.; Cussen, E.J.; Wilson, C. Spontaneous formation of crystalline lithium molybdate from solid reagents at room temperature. Dalton Trans. 2010, 39, 411–417. [Google Scholar] [CrossRef] [PubMed]
  98. Kolitsch, U. The crystal structures of phenacite-type Li2(MoO4), and scheelite-type LiY(MoO4)2 and LiNd(MoO4)2. Z. Kristallogr. 2001, 216, 449–454. [Google Scholar] [CrossRef]
  99. Zachariasen, W. Notiz Über die Kristallstruktur von Phenacit, Willemit und Verwandten Verbindungen [Note about the crystal structure of phenacite, willemite, and related compounds]. Nor. Geol. Tidsskr. 1926, 9, 65–73. (In German) [Google Scholar]
  100. Bramnik, K.G.; Ehrenberg, H. Study of the Na2O-MoO3 System. Na5Mo11O36—A New Oxide with Anatase-related Structure, and the Crystal Structures of Na2MoO4. Z. Anorg. Allg. Chem. 2004, 630, 1336–1341. [Google Scholar] [CrossRef]
  101. Fortes, A.D. Crystal structures of spinel-type Na2MoO4 and Na2WO4 revisited using neutron powder diffraction. Acta Crystallogr. E 2015, 71, 592–596. [Google Scholar] [CrossRef] [PubMed]
  102. Gatehouse, B.M.; Leverett, P. Crystal structure of potassium molybdate, K2MoO4. J. Chem. Soc. A 1969, 849–854. [Google Scholar] [CrossRef]
  103. Kools, F.X.N.M.; Koster, A.S.; Rieck, G.D. The Structures of Potassium, Rubidum and Cesium Molybdate and Tungstate. Acta Crystallogr. B 1970, 26, 1974–1977. [Google Scholar] [CrossRef]
  104. Shigematsu, H.; Nomura, K.; Nishiyama, K.; Tojo, T.; Kawaji, H.; Atake, T.; Kawamura, Y.; Miyoshi, T.; Matsushita, Y.; Tanaka, M.; et al. Structures and Phase Transitions in Rb2MoO4 and Rb2WO4. Ferroelectrics 2011, 414, 195–200. [Google Scholar] [CrossRef]
  105. Gonschorek, W.; Hahn, T. Die Kristallstruktur des Caesiummolybdats, Cs2MoO4 [The Crystal Structure of Cesium Molybdate, Cs2MoO4]. Z. Kristallogr. 1973, 138, 167–176. (In German) [Google Scholar] [CrossRef]
  106. Mitra, R.P.; Verma, H.K.L. Crystal Structures of Dihydrates of Sodium Tungstate & Sodium Molybdate. Indian J. Chem. 1969, 7, 598–602. [Google Scholar]
  107. Atovmyan, L.O.; Dyachenko, O.A. X-ray Structural Investigation of Na2MoO4·2H2O Crystals. J. Struct. Chem. 1969, 10, 416–418, translation of Zh. Strukt. Khim. 1969, 10, 504–507. [Google Scholar] [CrossRef]
  108. Matsumoto, K.; Kobayashi, A.; Sasaki, Y. The Crystal Structure of Sodium Molybdate Dihydrate, Na2MoO4·2H2O. Bull. Chem. Soc. Jpn. 1975, 48, 1009–1013. [Google Scholar] [CrossRef]
  109. Capitelli, F.; Selim, M.; Mukherjea, K.K. Synthesis and Crystal Structure Determination of Sodium Molybdate Dihydrate. Asian J. Chem. 2006, 18, 2856–2860. [Google Scholar]
  110. Fortes, A.D. Crystal structures of deuterated sodium molybdate dihydrate and sodium tungstate dihydrate from time-of-flight neutron powder diffraction. Acta Crystallogr. E 2015, 71, 799–806. [Google Scholar] [CrossRef] [PubMed]
  111. Dean, K.J.; Wilkinson, G.R. Precision Raman Investigation of the ν1 Mode of Vibration of SO42−, WO42− and MoO42− in Aqueous Solutions of Different Concentrations. J. Raman. Spectrosc. 1983, 14, 130–134. [Google Scholar] [CrossRef]
  112. Johansson, G.; Caminiti, R. The Hydration of Tungstate and Molybdate Ions in Aqueous Solution. Z. Naturforsch. A 1986, 41, 1325–1329. [Google Scholar] [CrossRef]
  113. Zachariasen, W.H.; Plettinger, H.A. The Crystal Structure of Lithium Tungstate. Acta Crystallogr. 1961, 14, 229–230. [Google Scholar] [CrossRef]
  114. Okada, K.; Morikawa, H.; Marumo, F.; Iwai, S. Sodium Tungstate. Acta Crystallogr. B 1974, 30, 1872–1873. [Google Scholar] [CrossRef]
  115. Koster, A.S.; Kools, F.X.N.M.; Rieck, G.D. The Crystal Structure of Potassium Tungstate, K2WO4. Acta Crystallogr. B 1969, 25, 1704–1708. [Google Scholar] [CrossRef]
  116. Holtzberg, F.; Reisman, A.; Berry, M.; Berkenblit, M. Chemistry of the Group VB Pentoxides. VI. The Polymorphism of Nb2O5. J. Am. Chem. Soc. 1957, 79, 2039–2043, Correction, p. 6579. [Google Scholar] [CrossRef]
  117. Reisman, A.; Holtzberg, F. Further Comments on the Polymorphism of Nb2O5. The High Temperature Metastable Phase. J. Am. Chem. Soc. 1959, 81, 3182–3184. [Google Scholar] [CrossRef]
  118. Reisman, A.; Holtzberg, F. Heterogeneous Equilibria in the Systems Li2O-, Ag2O-Nb2O5 and Oxide-Models. J. Am. Chem. Soc. 1958, 80, 6503–6507. [Google Scholar] [CrossRef]
  119. Reisman, A.; Holtzberg, F.; Banks, E. Reactions of the Group VB Pentoxides with Alkali Oxides and Carbonates. VII. Heterogeneous Equilibria in the system Na2O or Na2CO3-Nb2O5. J. Am. Chem. Soc. 1958, 80, 37–42. [Google Scholar] [CrossRef]
  120. Reisman, A.; Holtzberg, F. Phase Equilibria in the System K2CO3-Nb2O5 by the Method of Differential Thermal Analysis. J. Am. Chem. Soc. 1955, 77, 2115–2119. [Google Scholar] [CrossRef]
  121. Reisman, A.; Holtzberg, F. Equilibria in the System Rb2O-Nb2O5 and Sequential Trends in Oxide-Oxide Interactions: The Prediction of Compound Retention. J. Phys. Chem. 1960, 64, 748–753. [Google Scholar] [CrossRef]
  122. Reisman, A.; Mineo, J. Compound Repetition in Oxide-Oxide Interactions. The System Cs2O-Nb2O5. J. Phys. Chem. 1961, 65, 996–998. [Google Scholar] [CrossRef]
  123. Reisman, A.; Holtzberg, F.; Berkenblit, M. Metastability in Niobate Systems. J. Am. Chem. Soc. 1959, 81, 1292–1295. [Google Scholar] [CrossRef]
  124. Brauer, G. Die Oxyde des Niobs [The Oxide of Niobium]. Z. Anorg. Allg. Chem. 1941, 248, 1–31. (In German) [Google Scholar] [CrossRef]
  125. Gatehouse, B.M.; Wadsley, A.D. The Crystal Structure of the High Temperature form of Niobium Pentoxide. Acta Crystallogr. 1964, 17, 1545–1553. [Google Scholar] [CrossRef]
  126. Kato, K. Structure Refinement of H-Nb2O5. Acta Crystallogr. B 1976, 32, 764–767. [Google Scholar] [CrossRef]
  127. Hahn, R.B. Phosphates of Niobium and Tantalum. J. Am. Chem. Soc. 1951, 73, 5091–5093. [Google Scholar] [CrossRef]
  128. Frevel, L.K.; Rinn, H.W. Powder Diffraction Standards for Niobium Pentoxide and Tantalum Pentoxide. Anal. Chem. 1955, 27, 1329–1330. [Google Scholar] [CrossRef]
  129. Nolander, B.; Norin, R. Note on the Crystal Structure of T-Nb2O5 and of an Isostructural High-Temperature Zr-Nb-oxide. Acta Chem. Scand. 1972, 26, 3814–3816. [Google Scholar] [CrossRef]
  130. Kato, K.; Tamura, S. Die Kristallstruktur von T-Nb2O5. [The Crystal Structure of T-Nb2O5]. Acta Crystallogr. B 1975, 31, 673–677. (In German) [Google Scholar] [CrossRef]
  131. Mertin, W.; Andersson, S.; Gruehn, R. Über die Kristallstructur von M-Nb2O5 [On the Crystal Structure of M-Nb2O5]. J. Solid State Chem. 1970, 1, 419–424. (In German) [Google Scholar] [CrossRef]
  132. Laves, F.; Petter, W.; Wulf, H. Die Kristalstruktur von ζ-Nb2O5 [The Crystal Structure of ζ-Nb2O5]. Naturwissenschaften 1964, 51, 633–634. [Google Scholar] [CrossRef]
  133. Andersson, S. The Crystal Structure of N-Nb2O5, Prepared in the Presence of Small Amounts of LiF. Z. Anorg. Allg. Chem. 1967, 351, 106–112. [Google Scholar] [CrossRef]
  134. Norin, R.; Nolander, B. Note on the Crystal Structures of a Niobium-rich Phase in the Li2O-Nb2O5 System and of the Isostructural Compound N-Nb2O5. Acta Chem. Scand. 1971, 25, 741–743. [Google Scholar] [CrossRef]
  135. Blasse, G. New Types of Cation-Order in the Rocksalt Lattice: The Structure of Li3SbO4 and Li3NbO4. Z. Anorg. Allg. Chem. 1963, 326, 44–46. [Google Scholar] [CrossRef]
  136. Grenier, J.-C.; Martin, C.; Durif, A. Étude cristallographique des orthoniobates et orthotantalates de lithium [Crystallographic study of the orthoniobates and orthotantalates of lithium]. Bull Soc. Fr. Min. Crist. 1964, 87, 316–320. (In French) [Google Scholar]
  137. Grenier, J.-C.; Bassi, G. Affinement de la structure de NbLi3O4 [Refinement of the structure of NbLi3O4]. Bull Soc. Fr. Min. Crist. 1965, 88, 345–346. (In French) [Google Scholar]
  138. Whiston, C.D.; Smith, A.J. Double Oxides Containing Niobium or Tantalum. I. Systems Including Alkali Metals. Acta Crystallogr. 1965, 19, 169–173. [Google Scholar] [CrossRef]
  139. Ukei, K.; Suzuki, H.; Shishido, T.; Fukuda, T. Li3NbO4. Acta Crystallogr. C 1994, 50, 655–656. [Google Scholar] [CrossRef]
  140. Bailey, P. An X-ray Diffraction Investigation of the Structures of Anti-Ferroelectric Calcium Titanate and Ferroelectric Lithium Columbate. Ph.D. Thesis, University of Bristol, Bristol, UK, 1952. [Google Scholar]
  141. Megaw, H.D. Ferroelectricity and Crystal Structure. II. Acta Crystallogr. 1954, 7, 187–194. [Google Scholar] [CrossRef]
  142. Shiozaki, Y.; Mitsui, T. Powder Neutron Diffraction Study of LiNbO3. J. Phys. Chem. Solids 1963, 24, 1057–1061. [Google Scholar] [CrossRef]
  143. Abrahams, S.C.; Reddy, J.M.; Bernstein, J.L. Ferroelectric Lithium Niobate. 3. Single Crystal X-ray Diffraction Study at 24 °C. J. Phys. Chem. Solids 1966, 27, 997–1012. [Google Scholar] [CrossRef]
  144. Abrahams, S.C.; Hamilton, W.C.; Reddy, J.M. Ferroelectric Lithium Niobate. 4. Single Crystal Neutron Diffraction Study at 24 °C. J. Phys. Chem. Solids 1966, 27, 1013–1018. [Google Scholar] [CrossRef]
  145. Abrahams, S.C.; Levinstein, H.J.; Reddy, J.M. Ferroelectric Lithium Niobate. 5. Polycrystal X-ray Diffraction Study between 24 °C and 1200 °C. J. Phys. Chem. Solids 1966, 27, 1019–1026. [Google Scholar] [CrossRef]
  146. Abrahams, S.C.; Marsh, P. Defect Structure Dependence on Composition in Lithium Niobate. Acta Crystallogr. B 1986, 42, 61–68. [Google Scholar] [CrossRef]
  147. Oghaki, M.; Tanaka, K.; Marumo, F. Structure Refinement of lithium (I) niobium (V) trioxide, LiNbO3, with anharmonic thermal vibration model. Miner. J. 1992, 16, 150–160. [Google Scholar]
  148. Kumada, N.; Kinomura, N.; Muto, F. イルメナイト型 LiNbO3 及び NaNbO3 の結晶構造 [Crystal Structures of Ilmenite Type LiNbO3 and NaNbO3]. J. Ceramic Soc. Jpn. 1990, 98, 384–388. (In Japanese) [Google Scholar] [CrossRef]
  149. Boysen, H.; Altorfer, F. A Neutron Powder Investigation of the High-Temperature Structure and Phase Transition in LiNbO3. Acta Crystallogr. B 1994, 50, 405–414. [Google Scholar] [CrossRef]
  150. Hsu, R.; Maslen, E.N.; Du Boulay, D.; Ishizawa, N. Synchrotron X-ray Studies of LiNbO3 and LiTaO3. Acta Crystallogr. B 1997, 53, 420–428. [Google Scholar] [CrossRef]
  151. Etschmann, B.; Ishikawa, N.; Streltsov, V.; Oishi, S. A Synchrotron X-ray diffraction analysis of near-stoichiometric LiNbO3. Z. Kristallogr. 2001, 216, 455–461. [Google Scholar] [CrossRef]
  152. Lundberg, M. The Crystal Structure of LiNb3O8. Acta Chem. Scand. 1971, 25, 3337–3346. [Google Scholar] [CrossRef]
  153. Gatehouse, B.M.; Leverett, P. Lithium Triniobate(V), LiNb3O8. Cryst. Struct. Commun. 1972, 1, 83–85. [Google Scholar]
  154. Scholder, R.; Glaser, H. Über Lithium- und Natriumuranate(V) und über strukturelle Beziehungem zwischen den Verbindungstypen Li7AO6 und Li8AO6 [About lithium and sodium uranates (V) and about structural relationships between the compound types Li7AO6 and Li8AO6]. Z. Anorg. Allg. Chem. 1964, 327, 15–27. (In German) [Google Scholar] [CrossRef]
  155. Muhle, C.; Dinnebier, R.E.; van Wullen, L.; Schwering, G.; Jansen, M. New Insights into the Structural and Dynamical Features of Lithium Hexaoxometalates Li7MO6 (M = Nb, Ta, Sb, Bi). Inorg. Chem. 2004, 43, 874–881. [Google Scholar] [CrossRef]
  156. Braun, R.M.; Hoppe, R. Zur Kenntnis von Li16Nb4O18 [On the knowledge of Li16Nb4O18]. Z. Anorg. Allg. Chem. 1982, 493, 7–16. (In German) [Google Scholar] [CrossRef]
  157. Bouillaud, Y. Polymorphisme de l’orthoniobate de sodium [Polymorphism of sodium orthoniobate]. Bull. Soc. Chim. Fr. 1967, 34, 3879–3880. (In French) [Google Scholar]
  158. Barker, M.G.; Wood, D.J. Preparation and Characterisation of the Compounds Sodium Tetraoxoniobate(V) Na3NbO4 and Sodium Tetraoxotantalate(V) Na3TaO4. J. Chem. Soc. Dalton Trans. 1972, 9–13. [Google Scholar] [CrossRef]
  159. Meyer, G.; Hoppe, R. Na3NbO4, das erste Orthioniobat mit Inselstruktur: Na12[Nb4O16] [Na3NbO4, the first orthoniobate with an island structure: Na12[Nb4O16]]. Naturwissenschaften 1974, 61, 501. (In German) [Google Scholar] [CrossRef]
  160. Barth, T. Die Kristallstruktur von Perowskit und Verwandten Verbindungen [The crystal structure of perovskite and related compounds]. Norsk. Geolog. Tidsskr. 1925, 8, 201–216. [Google Scholar]
  161. Wood, E.A. Polymorphism in Potassium Niobate, Sodium Niobate, and other ABO3 Compounds. Acta Crystallogr. 1951, 4, 353–362. [Google Scholar] [CrossRef]
  162. Vousden, P. A Study of the Unit-cell Dimensions and Symmetry of certain Ferroelectric Compounds of Niobium and Tantalum at Room Temperature. Acta Crystallogr. 1951, 4, 373–376. [Google Scholar] [CrossRef]
  163. Vousden, P. The Structure of Ferroelectric Sodium Niobate at Room Temperature. Acta Crystallogr. 1951, 4, 545–551. [Google Scholar] [CrossRef]
  164. Pepinsky, R. Remarks on Vousden’s structure of ferroelectric sodium niobate. Acta Crystallogr. 1952, 5, 288. [Google Scholar] [CrossRef]
  165. Vousden, R. The non-polarity of sodium niobate. Acta Crystallogr. 1952, 5, 690. [Google Scholar] [CrossRef]
  166. Shirane, G.; Newnham, R.; Pepinsky, R. Dielectric Properties and Phase Transitions of NaNbO3 and (Na,K)NbO3. Phys. Rev. 1954, 96, 581–588. [Google Scholar] [CrossRef]
  167. Francombe, M.H. High-Temperature Structure Transitions in Sodium Niobate. Acta Crystallogr. 1956, 9, 256–259. [Google Scholar] [CrossRef]
  168. Solovev, S.P.; Venevtsev, Y.N.; Zhdanov, G.S. An X-ray Study of Phase Transitions in NaNbO3. Sov. Phys. Crystallogr. 1961, 6, 171–175, translated from Kristallographiya, 218–224. [Google Scholar]
  169. Bouillaud, Y. Métaniobate de sodium non stœchiométrique [Nonstoichiometric sodium metaniobate]. Bull. Soc. Fr. Miner. Crist. 1969, 92, 347–351. (In French) [Google Scholar]
  170. Sakowski-Cowley, A.C.; Lukaszewicz, K.; Megaw, H.D. The Structure of Sodium Niobate at Room Temperature, and the Problem of Reliability in Pseudosymmetric Structures. Acta Crystallogr. B 1969, 25, 851–865. [Google Scholar] [CrossRef]
  171. Hewat, A.W. Neutron powder profile refinement of ferroelectric and antiferroelectric crystal structures: Sodium niobate at 22 °C. Ferroelectrics 1974, 7, 83–85. [Google Scholar] [CrossRef]
  172. Darlington, C.N.; Megaw, H.D. The Low-Temperature Phase Transition of Sodium Niobate and the Structure of the Low-Temperature Phase. N. Acta Crystallogr. B 1973, 29, 2171–2185. [Google Scholar] [CrossRef]
  173. Seidel, P.; Hoffmann, W. Verfeinerung der Kristallstruktur von NaNbO3 N. Bestimmung der absoluten Konfiguration und des Zwillingsgesetzes [Refinement of the crystal structure of NaNbO3 N. Determination of the absolute configuration and twin’s law]. Z. Kristallogr. 1976, 143, 444–459. (In German) [Google Scholar] [CrossRef]
  174. Glazer, A.M.; Megaw, H.D. Studies of the Lattice Parameters and Domains in the Phase Transitions of NaNbO3. Acta Crystallogr. A 1973, 29, 489–495. [Google Scholar] [CrossRef]
  175. Glazer, A.M.; Megaw, H.D. The structure of sodium niobate (T2) at 600 °C, and the cubic-tetragonal transition in relation to soft-phonon modes. Phil. Mag. 1972, 25, 1119–1135. [Google Scholar] [CrossRef]
  176. Ishida, K.; Honjo, G. Soft modes and Superlattice Structures in NaNbO3. J. Phys. Soc. Jpn. 1973, 34, 1279–1288. [Google Scholar] [CrossRef]
  177. Darlington, C.N.W.; Knight, K.S. High-temperature phases of NaNbO3 and NaTaO3. Acta Crystallogr. B 1999, 55, 24–30. [Google Scholar] [CrossRef]
  178. Ahtee, M.; Glazer, A.M.; Megaw, H.D. The structures of sodium niobate between 480 ° and 575 °C, and their relevance to soft-phonon modes. Philos. Mag. 1972, 25, 995–1014. [Google Scholar] [CrossRef]
  179. Shanker, V.; Samal, S.L.; Pradhan, G.K.; Narayana, C.; Ganguli, A.K. Nanocrystalline NaNbO3 and NaTaO3: Rietveld studies, Raman spectroscopy and dielectric properties. Solid State Sci. 2009, 11, 562–569. [Google Scholar] [CrossRef]
  180. Johnston, K.E.; Tang, C.C.; Parker, J.E.; Knight, K.S.; Lightfoot, P.; Ashbrook, S.E. The Polar Phase of NaNbO3: A Combined Study by Powder Diffraction, Solid-State NMR, and First-Principles Calculations. J. Am. Chem. Soc. 2010, 132, 8732–8746. [Google Scholar] [CrossRef]
  181. Darlington, C.N.W.; Knight, K.S. On the lattice parameters of sodium niobate at room temperature and above. Physica B 1999, 266, 368–372. [Google Scholar] [CrossRef]
  182. Koruza, J.; Tellier, J.; Malic, B.; Bobnar, V.; Kosec, M. Phase transitions of sodium niobate powder and ceramics, prepared by solid state synthesis. J. Appl. Phys. 2010, 108, 113509-1–113509-9. [Google Scholar] [CrossRef]
  183. Mishra, S.K.; Mittal, R.; Pomjakushin, V.Y.; Chaplot, S.L. Phase stability and structural temperature dependence in sodium niobate: A high-resolution powder neutron diffraction study. Phys. Rev. B 2011, 83, 134105-1–1134105-9. [Google Scholar] [CrossRef]
  184. Peel, M.D.; Thompson, S.P.; Daoud-Aladine, A.; Ashbrook, S.E.; Lightfoot, S. New Twists on the Perovskite Theme: Crystal structures of the Elusive Phases R and S of NaNbO3. Inorg. Chem. 2012, 51, 6876–6889. [Google Scholar] [CrossRef]
  185. Darriet, J.; Maazaz, A.; Bouloux, J.C.; Delman, C. Les Phases Na5NbO5 et Na5TaO5: Structure Cristalline de Na5NbO5 [The Phases Na5NbO5 and Na5TaO5: Crystal Structure of Na5NbO5]. Z. Anorg. Allg. Chem. 1982, 485, 115–121. (In French) [Google Scholar] [CrossRef]
  186. Jahnberg, L. Crystal Structures of Na2Nb4O11 and CaTa4O11. J. Solid State Chem. 1970, 1, 454–462. [Google Scholar] [CrossRef]
  187. Andersson, S. Phase Analysis Studies on the NaNbO3-Nb2O5, NaF-Nb2O5, and NaNbO3-Nb2O5-H2O Systems. Acta Chem. Scand. 1967, 21, 1777–1782. [Google Scholar] [CrossRef]
  188. Masó, N.; West, A.R. A new family of ferroelectric materials: Me2Nb4O11 (Me = Na and Ag). J. Mater. Chem. 2010, 20, 2082–2084. [Google Scholar] [CrossRef]
  189. Bouillaud, Y. Mise en evidence et étude cristallographique d’une solution solide entre les composés NaNb3O8 et Nb2W3O14 [Demonstration and crystallographic study of a solid solution between the compounds NaNb3O8 and Nb2W3O14]. Bull. Soc. Fr. Mineral. Crist. 1968, 91, 289–291. (In French) [Google Scholar]
  190. Nedjar, R.; Borel, M.M.; Leclaire, A.; Raveau, B. The Sodium Niobate NaNb3O8: A Novel Lamellar Oxide Synthesized by Soft Chemistry. J. Solid State Chem. 1987, 71, 182–188. [Google Scholar] [CrossRef]
  191. Range, K.-J.; Wildenauer, M.; Heyns, A.M. Extremely short non-Bonding Oxygen-Oxygen Distances: The Crystal Structures of NbBO4, NaNb3O8, and NaTa3O8. Angew. Chem. Int. Ed. 1988, 27, 969–971. [Google Scholar] [CrossRef]
  192. Andersson, S. The Crystal Structure of NaNb13O33 and the Geometrical Principles of the Homologous Series NaM3n+1O8n+1. Acta Chem. Scand. 1965, 19, 557–563. [Google Scholar] [CrossRef]
  193. Guerchais, J.-E. Réactions entre l’oxyde de niobium et le carbonate de potassium par voie sèche; hydrolyse des produits obtenus [Reactions between niobium oxide and potassium carbonate by dry method: Hydrolysis of the products obtained]. Bull. Soc. Chim. Fr. 1962, 82, 103–107. [Google Scholar]
  194. Addison, C.C.; Barker, M.G.; Lintonbon, R.M. Reactions of the Oxides of Niobium with Liquid Potassium. J. Chem. Soc. A 1970, 1465–1468. [Google Scholar] [CrossRef]
  195. Stecura, S. Recovery and Determination of Crystallographic Modifications of K3TaO4 and K3NbO4. J. Less-Common Met. 1971, 25, 1–10. [Google Scholar] [CrossRef]
  196. Meyer, G.; Hoppe, R. Zur Kenntnis der Strukturfamilie A3MO4 (A = K, Rb, Cs): Darstellung, kristallographische und magnetische Eigenschaften [Knowledge of the structure family A3MO4 (A = K, Rb, Cs): Representation, crystallographic and magnetic properties]. Rev. Chim. Miner. 1975, 12, 454–465. (In German) [Google Scholar]
  197. Reisman, A.; Holtzberg, F.; Triebwasser, S.; Berkenblit, M. Preparation of Pure Potassium Metaniobate. J. Am. Chem. Soc. 1956, 78, 719–720. [Google Scholar] [CrossRef]
  198. Katz, L.; Megaw, H.D. The Structure of Potassium Niobate at Room Temperature: The Solution of a Pseudosymmetric Structure by Fourier Methods. Acta Crystallogr. 1967, 22, 639–648. [Google Scholar] [CrossRef]
  199. Hewat, A.W. Soft modes and the structure, spontaneous polarization and Curie constants of perovskite ferroelectrics: Tetragonal potassium niobate. J. Phys. C Solid State Phys. 1973, 6, 1074–1084. [Google Scholar] [CrossRef]
  200. Hewat, A.W. Cubic-tetragonal-orthorhombic-rhombohedral ferroelectric transitions in perovskite potassium niobate: Neutron powder profile refinement of the structures. J. Phys. C Solid State Phys. 1973, 6, 2559–2572. [Google Scholar] [CrossRef]
  201. Sugimoto, W.; Mimuro, K.; Sugahara, Y.; Kuroda, K. Synthesis and Structural Study of the KNb4O6-Type Compound. J. Ceramic Soc. Jpn. 1999, 107, 318–321. [Google Scholar] [CrossRef]
  202. Kim, S.; Lee, J.-H.; Lee, J.; Kim, S.-W.; Kim, M.H.; Park, S.; Chung, H.; Kim, Y.-I.; Kim, W. Synthesis of Monoclinic Potassium Niobate Nanowires That Are Stable at Room Temperature. J. Am. Chem. Soc. 2012, 135, 6–9. [Google Scholar] [CrossRef] [PubMed]
  203. Gasperin, M.; Le Bihan, M.T. Mecanisme d’hydratation des niobates alcalins lamellaires de formule A3Nb4O17 (A = K, Rb, Cs) [Mechanism of hydration of lamellar alkaline niobates of formula A3Nb4O17 (A = K, Rb, Cs)]. J. Solid State Chem. 1982, 43, 346–353. (In French) [Google Scholar] [CrossRef]
  204. Becker, P.; Held, P. Crystal structure of potassium niobate, K6Nb10.80O30, a partially filled tetragonal tungsten bronze-type structure. Z. Kristallogr. NCS 2000, 215, 319–320. [Google Scholar] [CrossRef]
  205. Fallon, G.D.; Gatehouse, B.M.; Guddat, L. Crystal Structures of Some Niobium and Tantalum Oxides. IX. K3Nb7O19: A New Potassium Niobium Oxide Tunnel Structure. J. Solid State Chem. 1986, 61, 181–187. [Google Scholar] [CrossRef]
  206. Gasperin, M. Structure du Triniobate(V) de Potassium KNb3O8, un Niobate Lamellaire [Structure of Potassium Triniobate(V) KNb3O8, a Lamellar Niobate]. Acta Crystallogr. B 1982, 38, 2024–2026. (In French) [Google Scholar] [CrossRef]
  207. Kwak, J.; Yun, H.; Chae, H.K. A new potassium niobate, KNb5O13. Acta Crystallogr. E 2005, 61, i132–i134. [Google Scholar] [CrossRef]
  208. Hu, J.J.; Li, F.H.; Fan, H.F. Crystal structure determination of K2O·7Nb2O5 by combining high-resolution electron microscopy and electron diffraction. Ultramicroscopy 1992, 41, 387–397. [Google Scholar] [CrossRef]
  209. Serafin, M.; Hoppe, R. Die Koordinationszahl 5 bei RbNbO3: Eine Pyrgomstruktur [The Coordination Number 5 for RbNbO3: A tower structure]. Naturwissenschaften 1979, 66, 50–51. (In German) [Google Scholar] [CrossRef]
  210. Serafin, M.; Hoppe, R. Zur Kenntnis von RbNbO3—Ein Metaniobat mit Pyrgomstruktur [About RbNbO3—A metaniobate with a tower structure]. J. Less Common Met. 1980, 76, 299–316. (In German) [Google Scholar] [CrossRef]
  211. Kafalas, J.A. Influence of Madelung Energy and Covalency on the Structure of A+B5+O3 Compounds. In Proceedings of the 5th Materials Research Symposium Sponsored by the Institute for Materials Research, National Bureau of Standards, Gaithersburg, Maryland, 18–21 October 1972; pp. 287–293. [Google Scholar]
  212. Iyer, P.N.; Smith, A.J. Double Oxides Containing Niobium, Tantalum, or Protactinium. IV. Further Systems Involving Alkali Metals. Acta Crystallogr. B 1971, 27, 731–734. [Google Scholar] [CrossRef]
  213. Gasperin, M.; Le Bihan, M.T. Un niobate de rubidium d’un type structural nouveau: Rb4Nb6O17·3H2O [A rubidium niobate of a new structural type: Rb4Nb6O17·3H2O]. J. Solid State Chem. 1980, 33, 83–89. (In French) [Google Scholar] [CrossRef]
  214. Fallon, G.D.; Gatehouse, B.M. Crystal Structures of Some Niobium and Tantalum Oxides. II. The 4Rb2O:11Nb2O5 Phase—A Tunnel Structure. J. Solid. State Chem. 1977, 22, 405–409. [Google Scholar] [CrossRef]
  215. Dewan, J.C.; Edwards, A.J.; Jones, G.R. Crystal Structures of Octacesium and Octarubidium Docosaniobates. J. Chem. Soc. Dalton Trans. 1978, 968–972. [Google Scholar] [CrossRef]
  216. Jones, G.R.; Robertson, D.S. The Growth and Properties of Crystalline Rubidium and Cesium Niobates. J. Crystal Growth 1978, 43, 115–119. [Google Scholar] [CrossRef]
  217. Voronkova, V.I.; Yanovskii, V.K.; Leontyeva, I.N.; Kharitonova, E.P.; Sorokina, N.I.; Simonov, V.I. Growth and Properties of RM3O8 (R = Rb, Cs; M = Nb, Ta) Crystals. Cryst. Rep. 1998, 43, 345–347, translated from Kristallographiya, 379–381. [Google Scholar]
  218. Minor, D.B.; Roth, R.S.; Parker, H.S.; Brower, W.S. Phase Equilibria and Crystal Chemistry of Rubidium Niobates and Rubidium Tantalates. J. Res. Nat. Bur. Stds. 1977, 82, 151–165. [Google Scholar] [CrossRef] [PubMed]
  219. Gatehouse, B.M.; Lloyd, D.J.; Miskin, B.K. The Single Crystal X-ray Structure Determination of Some Alkali Metal Molybdates and Niobates. In Proceedings of the 5th Materials Research Symposium Sponsored by the Institute for Materials Research, National Bureau of Standards, Gaithersburg, Maryland, 18–21 October 1972; pp. 15–27. [Google Scholar]
  220. Meyer, G.; Hoppe, R. Über Oxoniobate(V): Die Kristallstructur von CsNbO3 [On Oxoniobate(V): The Crystal Structure of CsNbO3]. Z. Anorg. Allg.Chem. 1977, 436, 75–86. (In German) [Google Scholar] [CrossRef]
  221. Gasperin, M. Structure du Niobate de Césium Cs2Nb4O11 [Structure of Cesium Niobate Cs2Nb4O11]. Acta Crystallogr. B 1982, 37, 641–643. (In French) [Google Scholar] [CrossRef]
  222. Smith, R.W.; Luo, G.; Mei, W.-M. High-temperature crystal structure and electronic properties of cesium niobate Cs2Nb4O11. J. Phys. Chem. Solids 2010, 71, 1357–1361. [Google Scholar] [CrossRef]
  223. King, B.W.; Schultz, J.; Durbin, E.A.; Duckworth, W.H. Some Properties of Tantala Systems; Report #BMI-1106, Metallurgy and Ceramics (TID-4500, 11th Ed.); Battelle Memorial Institute, U.S. Government: Columbus, OH, USA, 1956; pp. 1–39.
  224. Reisman, A. Compound Repetition in Oxide Systems. Solid Phases in the System Li2O-Ta2O5 and Na2O-Ta2O5. J. Phys. Chem. 1962, 66, 15–21. [Google Scholar] [CrossRef]
  225. Reisman, A.; Holtzberg, F.; Berkenblit, M.; Berry, M. Reactions of the Group VB Pentoxides with Alkali Oxides and Carbonates. III. Thermal and X-ray Phase Diagrams of the System K2O or K2CO3 with Ta2O5. J. Am Chem. Soc. 1956, 78, 4514–4520. [Google Scholar] [CrossRef]
  226. Lagergren, S.; Magneli, A. On the Tantalum—Oxygen System. Acta Chem. Scand. 1952, 6, 444. [Google Scholar] [CrossRef]
  227. Blasse, G. On the Structure of some Compounds Li3Me5+O4 and some other Mixed Metal Oxides Containing Lithium. Z. Anorg. Allg. Chem. 1964, 331, 44–50. [Google Scholar] [CrossRef]
  228. Zocchi, M.; Gatti, M.; Santoro, A.; Roth, R.S. Neutron and X-ray Diffraction Study on Polymorphism in Lithium Orthotantalate, Li3TaO4. J. Solid State Chem. 1983, 48, 420–430, Correction, Ibid. 1984, 53, 277–278. [Google Scholar] [CrossRef]
  229. Du Boulay, D.; Sakaguchi, A.; Suda, K.; Ishizawa, N. Reinvestigation of β-Li3TaO4. Acta Crystallogr. E 2003, 59, i80–i82. [Google Scholar] [CrossRef]
  230. Lapitskii, A.V.; Simanov, Y.P. METAHИOБAT И METATAHTAЛAT ЛИTИЯ [Lithium Metaniobate and Metatantalate]. Zh. Fiz. Khim. (Russ. J. Phys. Chem.) 1955, 29, 1201. (In Russian) [Google Scholar]
  231. Abrahams, S.C.; Bernstein, J.L. Ferroelectric Lithium Tantalate-2. Single Crystal X-ray Diffraction Study at 24 °C. J. Phys. Chem. Solids 1967, 28, 1685–1692. [Google Scholar] [CrossRef]
  232. Abrahams, S.C.; Hamilton, W.C.; Sequeira, A. Ferroelectric Lithium Tantalate-2. Single Crystal Neutron Diffraction Study at 24 °C. J. Phys. Chem. Solids 1967, 28, 1693–1698. [Google Scholar] [CrossRef]
  233. Abrahams, S.C.; Buehler, E.; Hamilton, W.C.; Laplaca, S.J. Ferroelectric Lithium Tantalate-III. Temperature Dependence of the Structure in the Ferroelectric Phase and the Paraelectric Structure at 940 °K. J. Phys. Chem. Solids 1973, 34, 521–532. [Google Scholar] [CrossRef]
  234. Roth, R.S.; Parker, H.S.; Brewer, W.S.; Minor, D. Alkali Oxide-Tantalum Oxide and Alkali Oxide-Niobium Oxide Ionic Conductors; NASA Report CR-134599; National Bureau of Standards: Washington, DC, USA, 1974; p. 54.
  235. Gatehouse, B.M.; Negas, T.; Roth, R.S. The Crystal Structure of M-LiTa3O8 and Its Relationship to the Mineral Wodginite. J. Solid State Chem. 1976, 18, 1–7. [Google Scholar] [CrossRef]
  236. Santoro, A.; Roth, R.S.; Minor, D. Neutron Powder Diffraction Study of the Intermediate-Temperature Form of Lithium Tantalate. Acta Crystallogr. B 1977, 33, 3945–3947. [Google Scholar] [CrossRef]
  237. Nord, A.G.; Thomas, J.O. Structural Studies of the Solid Electrolyte High-LiTa3O8. Acta Chem. Scand. A 1978, 32, 539–544. [Google Scholar] [CrossRef]
  238. Werner, P.-E.; Marinder, B.-O.; Magneli, A. Structural Studies on Li1−xTa3O8−xFx Solid Solutions by Full-profile Refinements of Guinier-Hagg X-ray Film Data. Mat. Res. Bull. 1978, 13, 1371–1378. [Google Scholar] [CrossRef]
  239. Fallon, G.D.; Gatehouse, B.M.; Roth, R.S.; Roth, S.A. Crystal Structures of Some Niobium and Tantalum Oxides. Part VI. The Structure of H-LiTa3O8. J. Solid State Chem. 1979, 27, 255–259. [Google Scholar] [CrossRef]
  240. Hodeau, J.L.; Marezio, M.; Santoro, A.; Roth, R.S. Neutron Diffraction Structure Determination of the High-Temperature Form of Lithium Tritantalate, H-LiTa3O8. J. Solid State Chem. 1984, 51, 275–292. [Google Scholar] [CrossRef]
  241. Kay, H.F.; Miles, J.L. The Structure of Cadmium Titanate and Sodium Tantalate. Acta Crystallogr. 1957, 10, 213–218. [Google Scholar] [CrossRef]
  242. Ismailzade, I.G. An X-ray Diffraction Study of Phase Transitions in Sodium Tantalate. Sov. Phys. Cryst. 1963, 7, 584–587, Translation of Kristallografiya 1962, 7, 718–723. [Google Scholar]
  243. Ahtee, M.; Unonius, L. The Structure of NaTaO3 by X-ray Powder Diffraction. Acta Crystallogr. A 1977, 33, 150–154. [Google Scholar] [CrossRef]
  244. Ahtee, M.; Darlington, C.N.W. Structures of NaTaO3 by Neutron Powder Diffraction. Acta Crystallogr. B 1980, 36, 1007–1014. [Google Scholar] [CrossRef]
  245. Kennedy, B.J.; Prodjosantoso, A.K.; Howard, C.J. Powder neutron diffraction study of the high temperature phase transitions in NaTaO3. J. Phys. Condens. Matter 1999, 11, 6319–6327. [Google Scholar] [CrossRef]
  246. Chaminade, J.-P.; Pouchard, M.; Hagenmuller, P. Tantalates et oxyfluorotantalates de sodium [Tantalates and oxyfluorotantalates of sodium]. Rev. Chim. Miner. 1972, 9, 381–402. (In French) [Google Scholar]
  247. Ercit, T.S.; Hawthorne, F.C.; Cerny, P. The crystal structure of synthetic natrotantite. Bull. Mineral. 1985, 108, 541–549. [Google Scholar] [CrossRef]
  248. Mattes, R.; Schaper, J. Die Struktur von Na2Ta4O11 [The Structure of Na2Ta4O11]. Rev. Chim. Miner. 1985, 22, 817–820. (In German) [Google Scholar]
  249. Hickam, C.W., Jr. Corrosion Product of the Tantalum-Interstitial Oxygen-Potassium System at 1800 °F (982 °C). J. Less-Common Met. 1968, 14, 315–322. [Google Scholar] [CrossRef]
  250. Zhurova, E.A.; Ivanov, Y.; Zavodnik, V.; Tsirelson, V. Electron density and atomic displacements in KTaO3. Acta Crystallogr. B 2000, 56, 594–600. [Google Scholar] [CrossRef]
  251. Sawaguchi, E.; Kikuchi, A. Crystal Structure and the Dielectric Properties of K2O·2Ta2O5. J. Phys. Soc. Jpn. 1964, 19, 579. [Google Scholar] [CrossRef]
  252. Awadalla, A.A.; Gatehouse, B.M. Crystal structure of Some Niobium and Tantalum Oxides. IV. The Structure of KTa5O13 and its relationship to the α-PbO2 structure. J. Solid State Chem. 1978, 24, 183–187. [Google Scholar] [CrossRef]
  253. Hartl, H.; Pickhard, F.; Emmerling, F.; Rohr, C. Rubidium- und Caesium-Verbindungen mit dem Isopolyanion [Ta6O19]8−—Synthesen, Kristallstructuren, thermische und schwingungensspektroskopische Untersuchungen der Oxotantalate A8[Ta6O19]·nH2O (A = Rb, Cs; n = 0, 4, 14) [Rubidium and Caesium Compounds with the Isopolyanion [Ta6O19]8−—Synthesis, Crystal Structures, Thermogravimetric and Vibrational Spectroscopic Analys of the Oxotantalates A8[Ta6O19]·nH2O (A = Rb, Cs; n = 0, 4, 14)]. Z. Anorg. Allg. Chem. 2001, 627, 2630–2638. (In German) [Google Scholar]
  254. Serafin, M.; Hoppe, R. Coordination Number 5 and 6 in RbTaO3: Rb4∞2[Ta4O12]. Angew. Chem. Int. Ed. 1978, 17, 354–355. [Google Scholar] [CrossRef]
  255. Du Boulay, D.; Yamashita, R.; Ishizawa, N. Synchrotron X-ray study of orthorhombic Rb3Ta5O14 with a modified pyrochlore structure. Acta Crystallogr. C 2002, 58, i40–i44. [Google Scholar] [CrossRef]
  256. Serafin, M.; Hoppe, R. Ein Oxotantalat mit Gerüststruktur: Cs3Ta5O14. [A scaffolded oxotantalate: Cs3Ta5O14.]. Z. Anorg. Allg. Chem. 1982, 493, 77–92. (In German) [Google Scholar] [CrossRef]
  257. Du Boulay, D.; Oono, A.; Ishizawa, N. A reinvestigation of the structure of Cs3Ta5O14. Acta Crystallogr. E 2003, 59, i86–i88. [Google Scholar] [CrossRef]
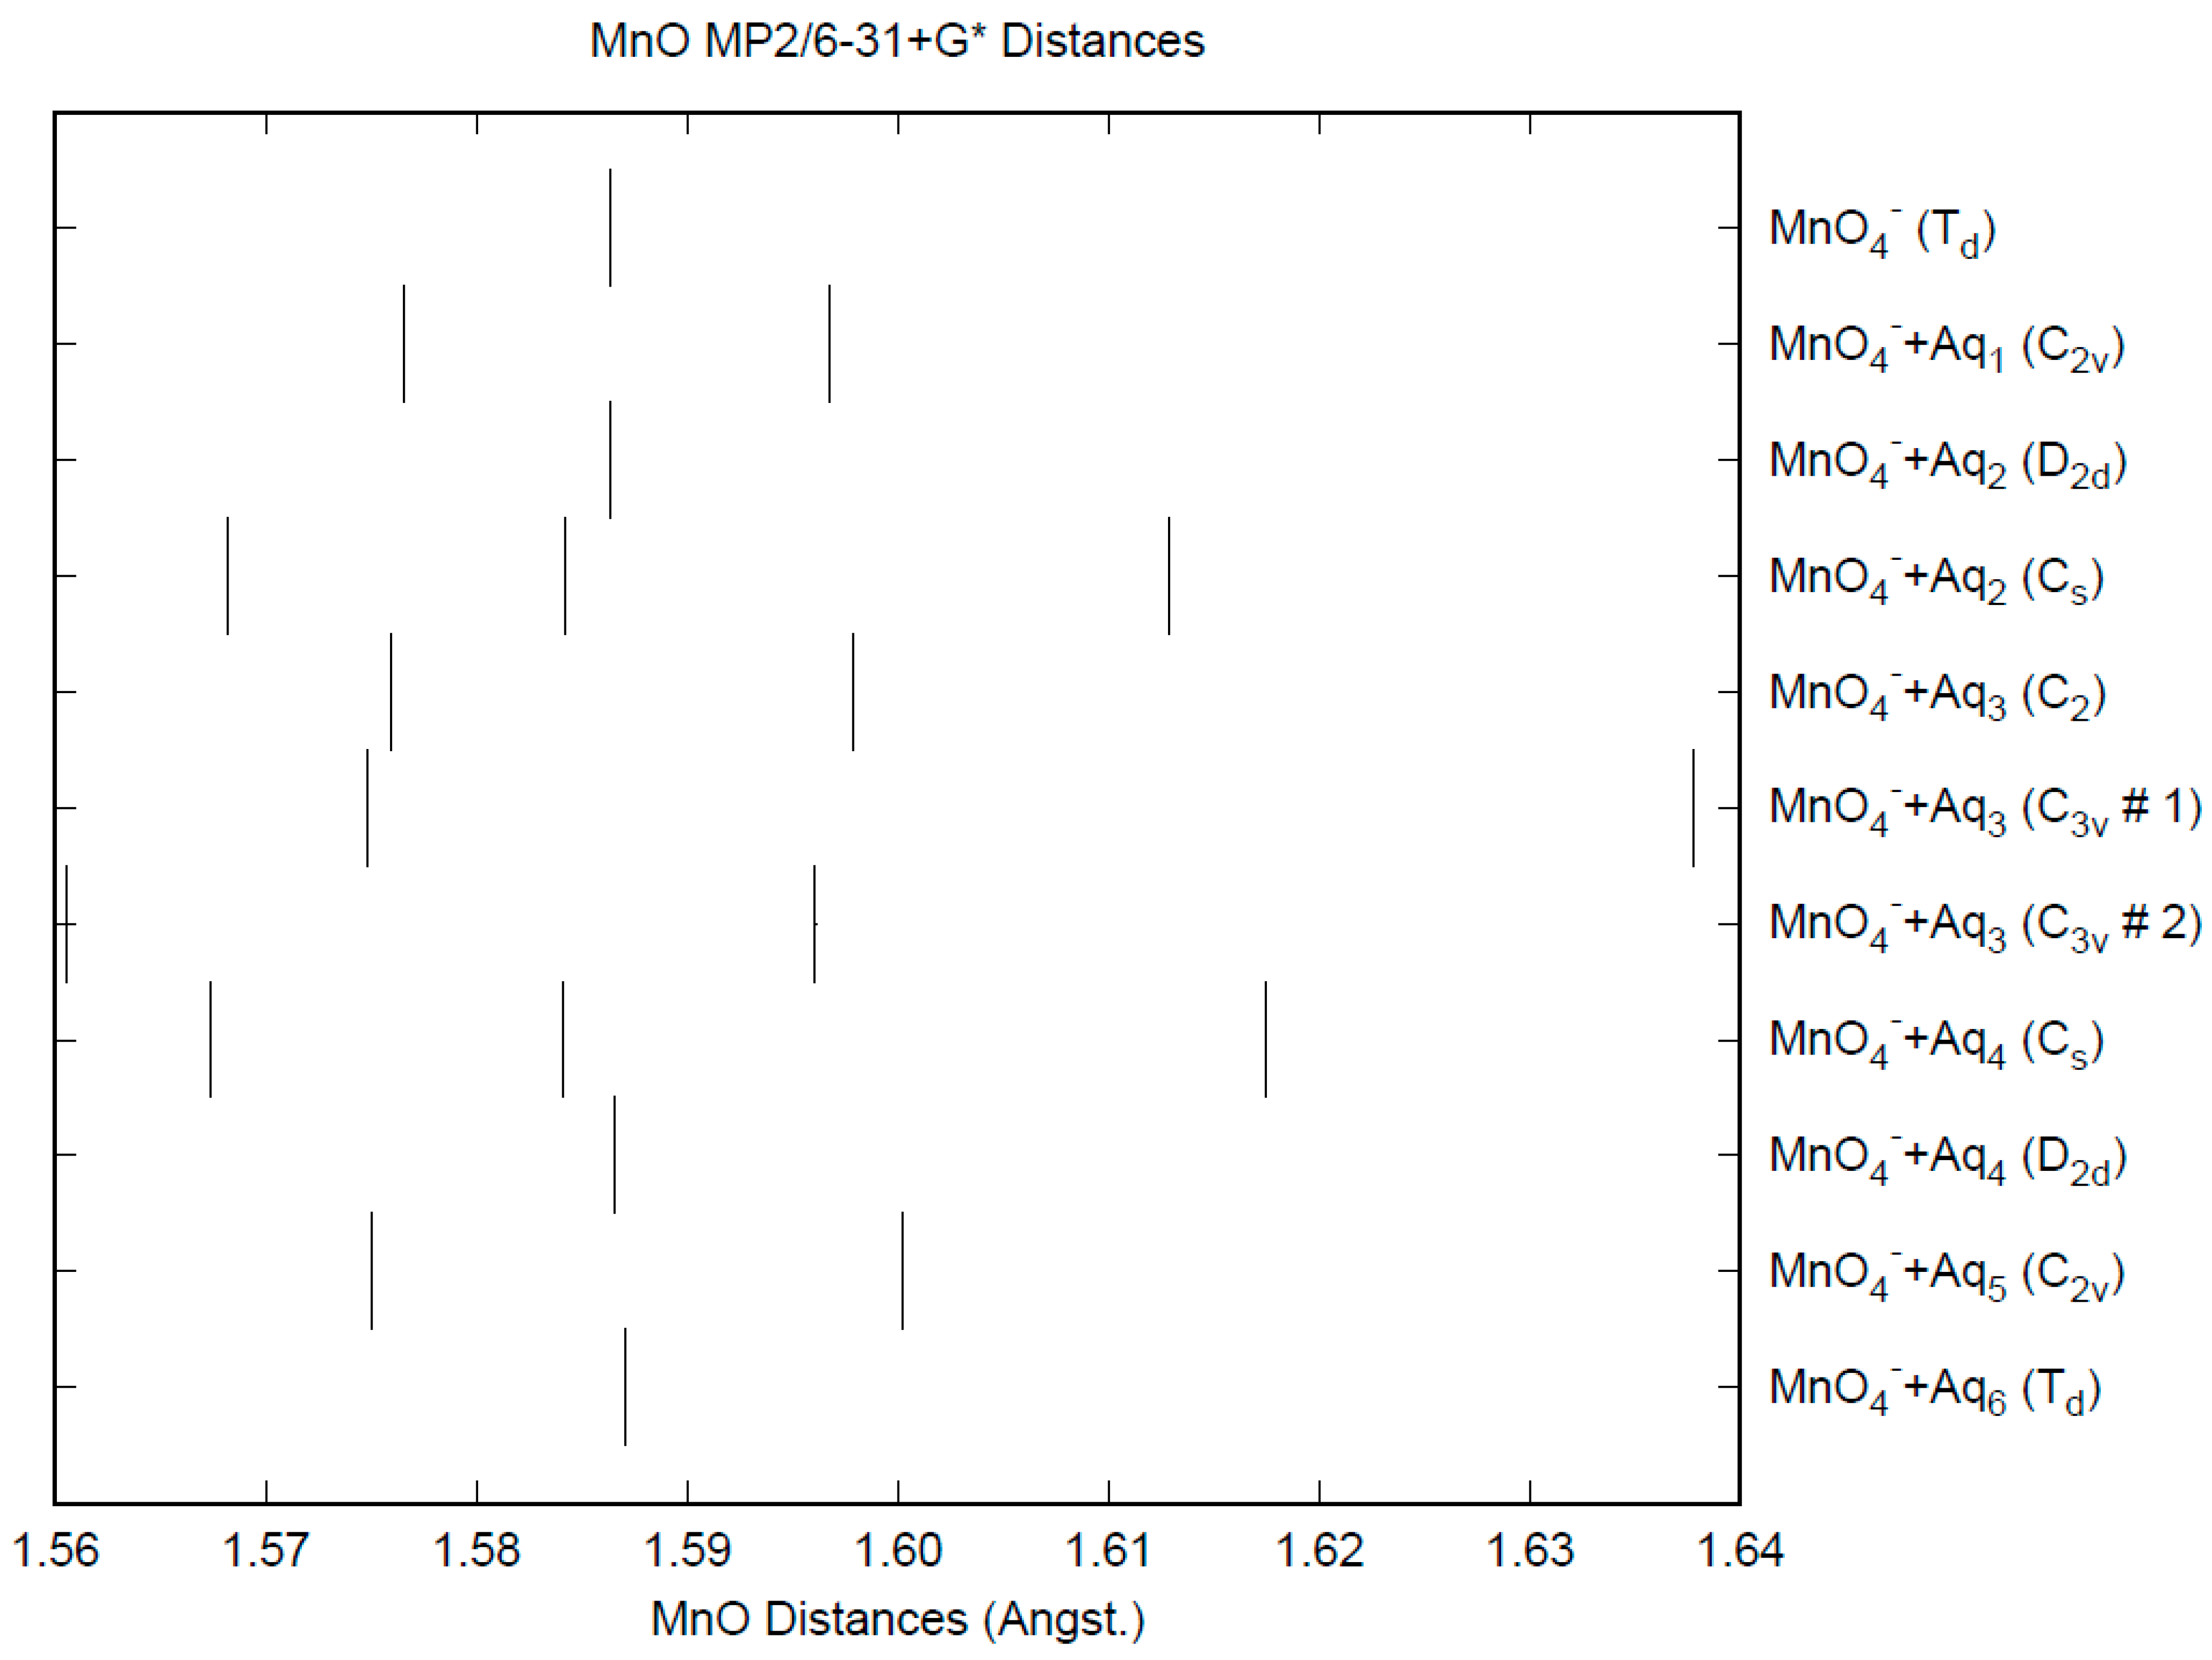
Figure 1. The Mn-O distances (MP2/6-31+G*) in hydrated permanganate.
Liquids 04 00031 g001
Figure 2. The Mn...O distances (MP2/6-31+G*) in hydrated permanganate.
Liquids 04 00031 g002
Figure 3. The O...O distances (MP2/6-31+G*) in hydrated permanganate.
Liquids 04 00031 g003
Figure 4. The O...H distance (MP2/6-31+G*) in hydrated permanganate.
Liquids 04 00031 g004
Figure 5. Vibrational frequencies (HF/6-31+G*) of hydrated permanganate.
Liquids 04 00031 g005
Figure 6. The Tc-O distances (MP2/6-31+G*) in hydrated pertechnetate.
Liquids 04 00031 g006
Figure 7. Vibrational frequencies (HF/6-31+G*) of hydrated pertechnetate.
Liquids 04 00031 g007
Figure 8. Vibrational frequencies (HF/6-31+G*) of hydrated perrhenate.
Liquids 04 00031 g008
Figure 9. The Cr-O distances (MP2/6-31+G*) in hydrated chromate.
Liquids 04 00031 g009
Figure 10. Vibrational frequencies (HF/6-31+G*) of hydrated chromate.
Liquids 04 00031 g010
Figure 11. The Mo-O distances (MP2/6-31+G*) in hydrated molybdate.
Liquids 04 00031 g011
Figure 12. Vibrational frequencies (HF/6-31+G*) of hydrated molybdate.
Liquids 04 00031 g012
Figure 13. Vibrational frequencies (HF/6-31+G*) of hydrated tungstate.
Liquids 04 00031 g013
Figure 14. The Nb-O distances (MP2/6-31+G*) in hydrated orthoniobate.
Liquids 04 00031 g014
Figure 15. Vibrational frequencies (HF/6-31+G*) of hydrated orthoniobate.
Liquids 04 00031 g015
Figure 16. The Ta-O distances (MP2/6-31+G*) in hydrated orthotantalate.
Liquids 04 00031 g016
Figure 17. Vibrational frequencies (HF/6-31+G*) of hydrated orthotantalate.
Liquids 04 00031 g017
Table 1. Bond lengths (Å) and vibrational frequencies (unscaled, cm−1) of permanganate, MnO4.
d(Mn-O)ν1 (A1)ν2 (E)ν3 (T2)ν4 (T2)
HF/6-31G(d)1.539910824381039490
HF/6-31+G(d)1.544910684261011480
MP2/6-31G(d)1.579716954381761446
MP2/6-31+G(d)1.586416944381710447
B3LYP/6-31G(d)1.59479573791018426
B3LYP/6-31+G(d)1.6018936368986417
BLYP/6-31G(d)1.6232888354959401
BLYP/6-31+G(d)1.6315865344927392
PBE/6-31G(d)1.6116909360982406
PBE/6-31+G(d)1.6194886350949396
CPCM-HF/6-31G(d)1.538610844371008480
CPCM-HF/6-31+G(d)1.54381070426972469
CPCM-MP2/6-31G(d)1.578016914391644454
CPCM-MP2/6-31+G(d)1.584716884381562453
CPCM-B3LYP/6-31G(d)1.59279623771006419
CPCM-B3LYP/6-31+G(d)1.5998941366967409
CPCM-BLYP/6-31G(d)1.6210890352952392
CPCM-BLYP/6-31+G(d)1.6294866342914382
CPCM-PBE/6-31G(d)1.6094912358975398
CPCM-PBE/6-31+G(d)1.6173889348936389
Table 2. Bond lengths (Å) and vibrational frequencies (unscaled, cm−1) of pertechnetate, TcO4.
d(Tc-O)ν1 (A1)ν2 (E)ν3 (T2)ν4 (T2)
HF/6-31G(d)1.682210773761021400
HF/6-31+G(d)1.683510723771003396
MP2/6-31G(d)1.7847824291978304
MP2/6-31+G(d)1.7902813295962304
B3LYP/6-31G(d)1.7305935322935342
B3LYP/6-31+G(d)1.7333927325917340
BLYP/6-31G(d)1.7558875304886325
BLYP/6-31+G(d)1.7593865308867324
PBE/6-31G(d)1.7442895310904329
PBE/6-31+G(d)1.7470886313887328
CPCM-HF/6-31G(d)1.68311068370981345
CPCM-HF/6-31+G(d)1.68451062371955339
CPCM-MP2/6-31G(d)1.7863833291964289
CPCM-MP2/6-31+G(d)1.7929823297941290
CPCM-B3LYP/6-31G(d)1.7315912284910297
CPCM-B3LYP/6-31+G(d)1.7346900280885290
CPCM-BLYP/6-31G(d)1.7575858274869285
CPCM-BLYP/6-31+G(d)1.7615846276845281
CPCM-PBE/6-31G(d)1.7451877277885288
CPCM-PBE/6-31+G(d)1.7484865277863283
Table 3. Bond lengths (Å) and vibrational frequencies (unscaled, cm−1) of perrhenate, ReO4.
d(Re-O)ν1 (A1)ν2 (E)ν3 (T2)ν4 (T2)
HF/6-31G(d)1.708910983751009374
HF/6-31+G(d)1.71011094275993372
MP2/6-31G(d)1.7885844304906297
MP2/6-31+G(d)1.7927833308887299
B3LYP/6-31G(d)1.7511963325922321
B3LYP/6-31+G(d)1.7535956327905321
BLYP/6-31G(d)1.7740905308875306
BLYP/6-31+G(d)1.7770896312858306
PBE/6-31G(d)1.7635924314892309
PBE/6-31+G(d)1.7659916317876309
CPCM-HF/6-31G(d)1.71171057322964284
CPCM-HF/6-31+G(d)1.71321049314940276
CPCM-MP2/6-31G(d)1.7890852299907264
CPCM-MP2/6-31+G(d)1.7939841306884268
CPCM-B3LYP/6-31G(d)1.7548933277899260
CPCM-B3LYP/6-31+G(d)1.7578923277876256
CPCM-BLYP/6-31G(d)1.7780889284864257
CPCM-BLYP/6-31+G(d)1.7817879288843256
CPCM-PBE/6-31G(d)1.7667904282878256
CPCM-PBE/6-31+G(d)1.7697894284857254
Table 4. Vibrational Frequencies (cm−1) of RuO4 and OsO4.
ν1 (A1)ν2 (E)ν3 (T2)ν4 (T2)TypeRef.
RuO4
920 IR, gas[71]
(880) 1 914 IR, CCl4 sol.[71]
(879) 913330IR, liquid[72]
882323914334R, liquid[73]
883318921332R, sat. aq.[73]
881obscured916obscuredR, CCl4 sol.[73]
OsO4
965335954335R, liquid[74]
953325IR, solid[74]
(968) 2 960 IR, gas[71]
(967) 3 954 IR, CCl4 sol.[71]
964338953334R, liquid[73]
962333952333R, sat. aq.[73]
965.5333.1960.1322.7R, gas[75]
964.5335.2954 R, CCl4 sol.[76]
960.5329.0IR, gas[76]
955.0326.0IR, CCl4 sol.[76]
1 For RuO4(CCl4), combination and overtone bands were observed at 1794 cm−11 + ν3), 1831 cm−1 (2ν3). 2 For OsO4(g), combination and overtone bands were observed at 1919 cm−11 + ν3), 1928 cm−1 (2ν3). 3 For OsO4(CCl4), combination and overtone bands were observed at 1910 cm−11 + ν3), 1921 cm−1 (2ν3).
Table 5. Bond lengths (Å) and vibrational frequencies (unscaled, cm−1) of iron tetroxide, FeO4; ruthenium tetroxide, RuO4; and osmium tetroxide, OsO4.
d(Fe-O)ν1 (A1)ν2 (E)ν3 (T2)ν4 (T2)
HF/6-31G(d)1.5199927426513446
HF/6-31+G(d)1.5222932419508456
MP2/6-31G(d)1.502324935783136524
MP2/6-31+G(d)1.506925145753143528
B3LYP/6-31G(d)1.57119683861038437
B3LYP/6-31+G(d)1.57689503771015439
BLYP/6-31G(d)1.6009895361978411
BLYP/6-31+G(d)1.6078875352953402
PBE/6-31G(d)1.58919173681003418
PBE/6-31+G(d)1.5955898359978409
CPCM-HF/6-31G(d)1.5206913413481397
CPCM-HF/6-31+G(d)1.5229917408472407
CPCM-MP2/6-31G(d)1.502625105723032517
CPCM-MP2/6-31+G(d)1.507025315703012522
CPCM-B3LYP/6-31G(d)1.57229663801023422
CPCM-B3LYP/6-31+G(d)1.5776951371999414
CPCM-BLYP/6-31G(d)1.6020892347966395
CPCM-BLYP/6-31+G(d)1.6087869335939385
CPCM-PBE/6-31G(d)1.5901918360992404
CPCM-PBE/6-31+G(d)1.5963898349966395
d(Ru-O)ν1 (A1)ν2 (E)ν3 (T2)ν4 (T2)
HF/6-31G(d)1.639411163931060405
HF/6-31+G(d)1.639611153921052403
MP2/6-31G(d)1.763110803121683350
MP2/6-31+G(d)1.765410823151698352
B3LYP/6-31G(d)1.6977951333974350
B3LYP/6-31+G(d)1.6989947334964348
BLYP/6-31G(d)1.7259883313916332
BLYP/6-31+G(d)1.7277877314905331
PBE/6-31G(d)1.7132907320940338
PBE/6-31+G(d)1.7145903321930337
CPCM-HF/6-31G(d)1.642210893481014334
CPCM-HF/6-31+G(d)1.642510873481001331
CPCM-MP2/6-31G(d)1.767410852861660322
CPCM-MP2/6-31+G(d)1.770510902911675324
CPCM-B3LYP/6-31G(d)1.7010935328952295
CPCM-B3LYP/6-31+G(d)1.7026926319937289
CPCM-BLYP/6-31G(d)1.7308842227891266
CPCM-BLYP/6-31+G(d)1.7333833224875262
CPCM-PBE/6-31G(d)1.7168873257916274
CPCM-PBE/6-31+G(d)1.7186865251902270
d(Os-O)ν1 (A1)ν2 (E)ν3 (T2)ν4 (T2)
HF/6-31G(d)1.667211523911075383
HF/6-31+G(d)1.666811543901070382
MP2/6-31G(d)1.78638613101126311
MP2/6-31+G(d)1.78678593141124314
B3LYP/6-31G(d)1.7192991335975330
B3LYP/6-31+G(d)1.7197988335966329
BLYP/6-31G(d)1.7449925317921313
BLYP/6-31+G(d)1.7459920317910313
PBE/6-31G(d)1.7334947324942319
PBE/6-31+G(d)1.7340944324933318
CPCM-HF/6-31G(d)1.671511313591039302
CPCM-HF/6-31+G(d)1.671211323581029299
CPCM-MP2/6-31G(d)1.78738702951120320
CPCM-MP2/6-31+G(d)1.78858672991117324
CPCM-B3LYP/6-31G(d)1.7228965282957280
CPCM-B3LYP/6-31+G(d)1.7238959278943277
CPCM-BLYP/6-31G(d)1.7494896264903292
CPCM-BLYP/6-31+G(d)1.7511889264888292
CPCM-PBE/6-31G(d)1.7370920269925282
CPCM-PBE/6-31+G(d)1.7380914267913281
Table 6. Bond lengths (Å) and vibrational frequencies (unscaled, cm−1) of chromate, CrO42−.
d(Cr-O)ν1 (A1)ν2 (E)ν3 (T2)ν4 (T2)
HF/6-31G(d)1.596810434101010455
HF/6-31+G(d)1.60561017395967443
MP2/6-31G(d)1.686810293271100377
MP2/6-31+G(d)1.69969983191018369
B3LYP/6-31G(d)1.6479897348925391
B3LYP/6-31+G(d)1.6572872338887384
BLYP/6-31G(d)1.6756830323865364
BLYP/6-31+G(d)1.6859804316832361
PBE/6-31G(d)1.6642849328885368
PBE/6-31+G(d)1.6737823321851364
CPCM-HF/6-31G(d)1.58961065410993452
CPCM-HF/6-31+G(d)1.59841035391934434
CPCM-MP2/6-31G(d)1.680210233221028380
CPCM-MP2/6-31+G(d)1.6920993319916375
CPCM-B3LYP/6-31G(d)1.6397902334924378
CPCM-B3LYP/6-31+G(d)1.6488881328873372
CPCM-BLYP/6-31G(d)1.6672842317874359
CPCM-BLYP/6-31+G(d)1.6769822316828356
CPCM-PBE/6-31G(d)1.6558856315892358
CPCM-PBE/6-31+G(d)1.6650837315845357
Table 7. Bond lengths (Å) and vibrational frequencies (unscaled, cm−1) of molybdate, MoO42−.
d(Mo-O)ν1 (A1)ν2 (E)ν3 (T2)ν4 (T2)
HF/6-31G(d)1.7569977341901370
HF/6-31+G(d)1.7601966342874365
MP2/6-31G(d)1.8241784280803295
MP2/6-31+G(d)1.8320766286775296
B3LYP/6-31G(d)1.7951863291825314
B3LYP/6-31+G(d)1.8005849298801314
BLYP/6-31G(d)1.8182812276782298
BLYP/6-31+G(d)1.8248797285760300
PBE/6-31G(d)1.8070828280798301
PBE/6-31+G(d)1.8126814288776302
CPCM-HF/6-31G(d)1.7534968315876318
CPCM-HF/6-31+G(d)1.7569953313838310
CPCM-MP2/6-31G(d)1.8188810291808297
CPCM-MP2/6-31+G(d)1.8271787295764291
CPCM-B3LYP/6-31G(d)1.7898881298829309
CPCM-B3LYP/6-31+G(d)1.7950867303795308
CPCM-BLYP/6-31G(d)1.8117835286794297
CPCM-BLYP/6-31+G(d)1.8178819292762295
CPCM-PBE/6-31G(d)1.8007850289807299
CPCM-PBE/6-31+G(d)1.8059836295776298
Table 8. Bond lengths (Å) and vibrational frequencies (unscaled, cm−1) of tungstate, WO42−.
d(W-O)ν1 (A1)ν2 (E)ν3 (T2)ν4 (T2)
HF/6-31G(d)1.7781989341881349
HF/6-31+G(d)1.7806979341857345
MP2/6-31G(d)1.8305828293791289
MP2/6-31+G(d)1.8349815298769290
B3LYP/6-31G(d)1.8107883297807298
B3LYP/6-31+G(d)1.8150870301786297
BLYP/6-31G(d)1.8315835282768283
BLYP/6-31+G(d)1.8367821288748284
PBE/6-31G(d)1.8212849287782284
PBE/6-31+G(d)1.8255837292763286
CPCM-HF/6-31G(d)1.7762985324868315
CPCM-HF/6-31+G(d)1.7792974323834313
CPCM-MP2/6-31G(d)1.8221859305805288
CPCM-MP2/6-31+G(d)1.8267843309771287
CPCM-B3LYP/6-31G(d)1.8060903306816296
CPCM-B3LYP/6-31+G(d)1.8105889308785294
CPCM-BLYP/6-31G(d)1.8257854290779274
CPCM-BLYP/6-31+G(d)1.8309838293749271
CPCM-PBE/6-31G(d)1.8156870295793281
CPCM-PBE/6-31+G(d)1.8199856298765278
Table 9. Bond lengths (Å) and vibrational frequencies (unscaled, cm−1) of orthoniobate, NbO43−.
d(Nb-O)ν1 (A1)ν2 (E)ν3 (T2)ν4 (T2)
HF/6-31G(d)1.8669832289726328
HF/6-31+G(d)1.8754812294699325
MP2/6-31G(d)1.9054716237614257
MP2/6-31+G(d)1.9191694253610266
B3LYP/6-31G(d)1.8796736248642278
B3LYP/6-31+G(d)1.8966699256624278
BLYP/6-31G(d)1.8956739246–257556–605208–237
BLYP/6-31+G(d)1.9044719235–252568–573223–229
PBE/6-31G(d)1.8851752212–235593–602184
PBE/6-31+G(d)1.8929730241–262547–592217–240
CPCM-HF/6-31G(d)1.8490859285757292
CPCM-HF/6-31+G(d)1.8570834287705284
CPCM-MP2/6-31G(d)1.8911764258694266
CPCM-MP2/6-31+G(d)1.9030735263641258
CPCM-B3LYP/6-31G(d)1.8736786254708262
CPCM-B3LYP/6-31+G(d)1.8830766265667261
CPCM-BLYP/6-31G(d)1.8934752244678253
CPCM-BLYP/6-31+G(d)1.9035729250641253
CPCM-PBE/6-31G(d)1.8830760245687253
CPCM-PBE/6-31+G(d)1.8916742257652253
Table 10. Bond lengths (Å) and vibrational frequencies (unscaled, cm−1) of orthotantalate, TaO43−.
d(Ta-O)ν1 (A1)ν2 (E)ν3 (T2)ν4 (T2)
HF/6-31G(d)1.8807835292709313
HF/6-31+G(d)1.8894814296682309
MP2/6-31G(d)1.9118737245611250
MP2/6-31+G(d)1.9245714258604257
B3LYP/6-31G(d)1.8870784208575–612235–244
B3LYP/6-31+G(d)1.8960766218–220551–589243–252
BLYP/6-31G(d)1.9030753209597–599220–232
BLYP/6-31+G(d)1.9117730258548–583213–229
PBE/6-31G(d)1.8933762208604–607221–233
PBE/6-31+G(d)1.9009741259–261559–593212–228
CPCM-HF/6-31G(d)1.86348582887442872
CPCM-HF/6-31+G(d)1.8721833288698264
CPCM-MP2/6-31G(d)1.8907789266697252
CPCM-MP2/6-31+G(d)1.9012762269650247
CPCM-B3LYP/6-31G(d)1.8831798261696248
CPCM-B3LYP/6-31+G(d)1.8925775269659246
CPCM-BLYP/6-31G(d)1.9009765248667236
CPCM-BLYP/6-31+G(d)1.9109740255632234
CPCM-PBE/6-31G(d)1.8912773252675238
CPCM-PBE/6-31+G(d)1.8998752261642237
Disclaimer/Publisher’s Note: The statements, opinions and data contained in all publications are solely those of the individual author(s) and contributor(s) and not of MDPI and/or the editor(s). MDPI and/or the editor(s) disclaim responsibility for any injury to people or property resulting from any ideas, methods, instructions or products referred to in the content.