Abstract
The dynamics of pure ionic liquids and solutions with acetonitrile have been investigated through quasielastic neutron scattering (QENS). The translational diffusive motion of the 1-butyl-3-methyl-imidazolium cation was revealed as a function of concentration and temperature. The diffusion coefficients obtained are in reasonably good agreement with molecular dynamics (MD) computer simulations based on a classical potential. The diffusive mobility of the cation dramatically increases when adding acetonitrile. This increase in diffusivity is directly related to a maximum in conductivity of these ionic liquid solutions and might pave the way for new design of electrolytes. The translational motions in pure ionic liquids are too slow to be resolved by our experiment. However, localized motion resembling rotation on a sphere of the measured proton signal could be identified in the pure ionic liquids.
1. Introduction
Ionic liquids are the room temperature relatives of molten salts. They consist of an organic cation and an inorganic or organic anion. A wide range of cations and anions exist, which can be combined to form ionic liquids with different properties [1]. Unlike high-temperature molten salts, ionic liquids have a melting point below C. Due to their low vapor pressure, high thermal stability and almost non-flammable nature, ionic liquids are currently being applied as reaction media, green solvents and electrolytes [1,2]. One particular field of interest for application of ionic liquids is their use of an as an electrolyte in batteries [3]. Here, lithium salts are used in a solution with an ionic liquid as electrolyte, and one important performance aspect is the ion conductivity.
Structural studies with X-ray scattering and neutron scattering have been employed to reveal the molecular structural arrangements in ionic liquids [4,5,6,7,8,9,10]. The dominating force between the ions is Coulomb forces, which result in an alternating shell structure of the ions, similar to the high-temperature-melting molten salts. Further interactions, such as hydrogen bonding, and geometric constraints of the molecules influence the liquid structure and can lead to further structural motifs. One common feature of all the structural studies is a diffraction peak in the measured total structure factor, which reflects the intramolecular and close intermolecular ordering on a 5–7 Å length scale in the partial pair correlation function. For imidazolium chloride ionic liquids, the structure factor has a peak around Å [11]. To unravel the complex structural motifs, diffraction experiments have been combined with simulation studies [12]. Further structural studies have focused on longer length scales, resulting in the observation of an additional structural peak at small Q, which might be related to a segregation on a nanometer scale [13,14,15,16,17,18].
In contrast to the dynamics of the high-temperature molten salts, the dynamics in ionic liquids is much more complex. In molten alkali halides, for example, the self-dynamics describes the translational diffusion of the ions, and no rotational component appears [19,20,21]. For molten salts, as one step of increased complexity, it was demonstrated that the inclusion of ion polarization is necessary to allow properly describing the diffusive dynamics in simulations, which demonstrates the importance of a well-defined force field for proper description of the dynamics in these ionic liquids. Ion polarization acts like a lubricant for ion mobility and decisively enhances the diffusion coefficients.
In ionic liquids, the molecules will not only have translational motion but also show a large degree of all sorts of rotational and localized motions, which can occur on a similar timescale and are hence difficult to separate experimentally. Quasielastic neutron scattering (QENS) is a valuable tool to resolve the self-dynamics in the 1 to 1000 ps time regime. QENS is particular sensitive to the movement of hydrogen and might hence allow resolving the dynamics of a specific ion, provided the scattering cross sections are chosen in a suitable way. Several studies have been performed to reveal the different contributions to the measured QENS signal in ionic liquids; see, for example [22,23,24,25,26,27,28,29,30,31,32,33]. Due to the complex behavior of the stochastic movements, it remains a challenge to decipher the measured signal into the most basic motions of the ions. For example, in the imidazolium ion alone, four different reorientational motions have been identified, which might contribute to the measured QENS signal [30]. The interlinked translational and rotational dynamics, extending over a wide range of time scales, are not yet fully understood.
Further experimental techniques such as Raman spectroscopy, nuclear magnetic resonance (NMR), dielectric spectroscopy and light scattering have been employed to unravel the complex phase behavior and dynamics of ionic liquids [34,35,36,37,38]. Molecular dynamics (MD) simulations were also applied to the understanding of ionic liquids; see, for example [30,39,40,41,42,43,44,45,46]. With simulations, the partial contributions to the structure and dynamics can be investigated in detail, which is an advantage compared to scattering experiments, which can often only measure the integrated response of the liquid. With isotopic substitution of parts of the ions, more specific information can be obtained, which was used in structural neutron scattering studies; see, for example [4].
In the case of electrochemical applications of ILs, the diversity of systems can be further expanded by combining them with common solvents. A number of studies have been performed to assess the dynamics of water/IL solutions [47]. Less studied are IL solutions with acetonitrile and their properties for electrochemical applications. The diffusion coefficient of pure acetonitrile ( cm/s) [48,49] is up to two orders of magnitude larger than the diffusion coefficients of ILs ( cm/s [31,50]). Therefore, one can expect a sizeable influence on the ion conductivity of ILs with the concentration of the solvent. Within an IL solution with acetonitrile, a conductivity maximum around 20 mole % IL was found [51]. MD-simulation has shown that the ion conductivity is strongly influenced by the acetonitrile concentration through a large change in diffusivity of the ions [44]. Using NMR, the increase in ion conductivity with acetonitrile concentration has been shown for an imidazolium salt [36]. That behavior opens up an avenue for designing an electrolyte that has a specific conductivity at operational temperatures. In this case, a thorough understanding of molecular properties, such as diffusivity, is required to optimize the electrolyte.
Here, we present a QENS study to elucidate the microscopic aspects of the translational diffusion of the cations inside IL solutions depending on the mole concentration of the IL with acetonitrile and the temperature. A direct comparison with results from a classical MD-simulation is conducted to determine the origin of the concentration dependence of the conductivity in these solutions. With the aim of measuring the translational diffusive motion of 1-butyl-3-methyl-imidazolium BMIM cations in BMIM PF and BMIM TfO ionic liquids and their solutions in deuterated acetonitrile, QENS measurements were carried out. The deuterated acetonitrile will enhance the QENS signal from the moving cations, which is the source of dominating incoherent scattering.
2. Experimental Details
1-Butyl-3-methyl imidazolium hexafluorophosphate (in short, BMIM PF) and 1-butyl-3-methyl imidazolium trifluoromethanesulfonate (in short, BMIM TfO) are the investigated ionic liquids. Measurements were performed on pure ILs BMIM PF and BMIM TfO at K and K and their solutions in deuterated acetonitrile () with mole fractions of ILs 50%, 15% and 1% at three temperatures K, K, K.
The scattering of neutrons is dominated by the large incoherent cross section of hydrogen (about 81 barn [52]). The incoherent cross section is directly related to the self-motion of hydrogen, and the measured QENS signal will provide information about self-diffusion and the rotational motions of the moving hydrogens in the sample [53]. The cross section of all the other atoms are about one order of magnitude smaller. The use of deuterated acetonitrile leaves the overwhelming scattering power with the 15 hydrogen atoms on the cation of the ionic liquid, and the dynamics of the anion and the deuterated acetonitrile is small.
The ILs and their solutions have been filled into annular-shaped PTFE (polytetrafluoroethylene) cells. PTFE does not react with the ionic liquids, and the neutron cross section of PTFE is coherent. Hence, the cell contribution is from the disordered structure factor of the PTFE, which has a modest structural peak around Å. The gap in the cell is 1 mm, and the outer diameter of the cylindrical cell is 20 mm. The lower concentration limit is restricted by the sensitivity of the experimental technique. The appropriate weighted amount of acetonitrile and IL was filled into the cells inside a glovebox.
Quasielastic neutron scattering measurements were performed on the OSIRIS spectrometer at the ISIS Facility, UK. OSIRIS is an indirect time of flight backscattering spectrometer [54,55]. With a final energy of meV, the energy resolution is meV. A wide dynamic range from to meV in energy transfer was used to cover a wide range of molecular motions. A typical runtime for a single scan is about 3–4 h. Pure acetonitrile measurements were performed in addition at the same temperatures. Pure IL in the solid state at 245 K was measured to provide a resolution function for the data analysis.
The data reduction included grouping of the spectra into 18 momentum transfer values. The detector range where the PTFE empty cell has its structural peak (around Å) was excluded from the data analysis. The measurement with the deuterated acetonitrile was subtracted from the IL solution measurements with appropriate absorption factors for the different concentrations, assuming that the dynamics from the pure acetonitrile and within the solutions does not change too much. In this procedure, the coherent elastic contribution from the PTFE cell is subtracted, and the remaining quasielastic scattering contribution from the deuterated acetonitrile is also eliminated, which for the low concentrations of the IL (1%) is still a considerable amount of scattering and would overlay the signal from the motion of the ionic liquid. In addition, the incoherent contribution from deuterium is not negligible and will be subtracted in this way. Nevertheless, such a subtraction procedure always has its limitations. For the pure ionic liquids, a measured empty cell scan was subtracted.
When the scattering power of the sample is relatively large (typically larger than 15%) the probability for a further scattering event within the sample increases accordingly, and the additional multiple scattering events can overshadow the single scattering signal. The scattering power of the 1% and 15% solutions are less or similar to 10%, and multiple scattering correction was not performed for these concentrations. The correction procedure is based on an approximation for the scattering probability as input and hence cannot be regarded as an exact methodology to obtain fully corrected single scattering data. For the higher concentration measurements, multiple scattering correction is needed. This correction was achieved using a Monte Carlo code, which simulates the twice-scattered neutrons with a scattering function input resembling the measured liquid; for more details, see [21,56]. The so-simulated ratio between single- and twice-scattered neutrons was then multiplied with the measured signal to correct for multiple scattering events.
For the data analysis, a simple model was used that incorporates the main motions of the ions:
Here, the first term represents the elastic part of the signal, which might stem from motions that cannot be resolved within the spectrometer resolution. In addition, localized motions, for example rotation of the molecule, will add a further contribution to the elastic line. The first Lorentzian function models the translational motion of the molecule, which will show up as a dependence toward of the line width . The second Lorentzian will encompass all rotational and localized motions, which often occur on a faster time scale and only show a modest dependence on the momentum transfer Q. The most obvious and fastest rotational motion will be the rotation of the methyl groups. Further rotational motions can be expected from the ethyl groups, or the whole molecule, which is the slowest rotation. All these motions might occur on a similar time scale and would overlap in the measured spectrum. Hence, they are in general not resolvable and we treat them as a single relaxation process. With increasing momentum transfer, the width of the translational diffusion process increases and will approach and interfere with the time scale of the localized motions. Therefore, values for both processes are only unambiguously separable at small Q values.
That model function is then convoluted with the measured resolution function and fitted to the measured data. For most of the fits, an algorithm using a Bayesian statistical approach was used [57]. For the 50% concentrations, the width of the broader line was fitted globally to a constant Q-independent value. The translational dynamics of the pure ionic liquids was too slow to be unambiguously revealed by the spectrometer. Hence, a fit with a single Lorentzian lineshape and an elastic line was performed, where the Lorentzian covered all rotational and localized motions. All analysis steps have been performed using the Mantid software framework [58].
In Figure 1a, a spectrum at Å is plotted on a logarithmic scale. The total fit according to Equation (1) is included as a dashed line. The two separate fits with a Lorentzian are shown as full lines and represent the two dynamic ranges observed in the experiment. The measured resolution function (thin line) clearly demonstrates the quasielastic signal of the 15% sample at 333 K. Panel (b) shows the Q-dependence of the quasielastic signal on a logarithmic scale for a reduced range of energy transfers. With increasing momentum transfer, the width increases, which implies that this signal stems from translational diffusive motion. In panel (c), a reduced range in energy transfer of at K at Å is plotted for two concentrations of the ionic liquid solution on a linear scale. The lines are fits to the slower motion and demonstrate that with reduced concentration of the ionic liquid, the cation dynamics become faster. The spectrum for the 1% solution is accordingly much smaller and shows an elastic contribution on top of the quasielastic signal. This indicates a further slow motion of the molecules, which cannot be resolved by the spectrometer.
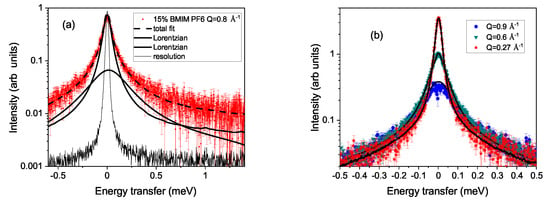
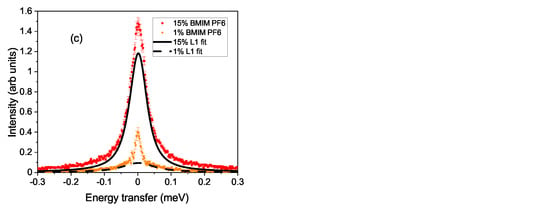
Figure 1.
Plot (a) shows a spectrum on a logarithmic scale. Included are the two fitted Lorentzian contributions and as a dashed line the total fit. The thin line represents the resolution function. Panel (b) shows the Q dependence of the translational motion for 15% solution of BMIM PF at K. In plot (c), the energy window with the translational movement is shown for the 1% and 15% concentration of BMIM PF for K at Å. The full and dashed line denote the Lorentzian contributions of the slower translational movement.
3. Results and Discussion
In Figure 2, the widths of the two Lorentzian fits for the 15% concentrated samples at K are shown. The smaller line width shows a decrease toward zero with decreasing Q, a sign of translational motion. The broader line does not decrease to a zero width value with decreasing Q-vector and might be related to rotation. In a QENS study for BmimBr, a broader Lorentzian line with similar values was observed and related to localized motion [30]. The increase in the line width with Q was assigned to coupling between translational and rotational motions in this wave vector range. For a dimethylimizadolium hexafluorophosphate ionic liquid, a structural peak around Å was reported [5], and for the 1-alkyl-3-methylimidazolium PF6 ionic liquid, a peak at the same position was reported [10]. These structural correlations also influence the self-dynamics of the particles. For molten NaBr, it was shown that around the structure peak, the width of the diffusing particles shows a modest minimum with increasing wave vectors [21]. This reduction in line width and hence increase in relaxation time can be understood as the particle needing more time to move to a nearest neighbor position within a dense liquid. Therefore, the modulation of the line width around Å might be caused by the structure in the dense liquid. Please note that this wave vector-dependent change in line width might also be attributed to imperfect subtraction of the empty cell, which has a structural peak at the same Q-vector. In addition, the coherent scattering from the liquids might also influence the fit. The fit results indicate that a change with different anions in the here-regarded ionic liquids only marginally influences the cation dynamics.
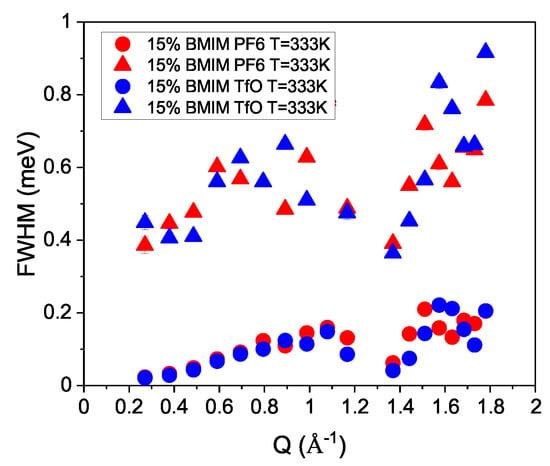
Figure 2.
The line widths of both Lorentzians are depicted for the 15% concentration of both ILs at K. Circles depict the widths of the slower translational movements and the triangles the rotation.
With increasing temperature, the width increases and the cation dynamics becomes faster. In Figure 3, we present the concentration dependence of the translational diffusion dynamics. The widths are shown for the and concentration of the BMIM PF solution at K. With increasing concentration of the ionic liquid, the dynamics distinctly slow down. The widths decrease toward and demonstrate that the observed process originates from translational cation diffusion. For the modeling of concentration, the broader Lorentzian was fitted globally to a Q-independent value, which resulted in a smoother fit result for the width representing the translational motion, in contrast to the lower concentrations where both widths were Q-dependent-fitted. The spectrometer resolution is indicated as a dashed line, which shows that the line width at the smallest Q vector is smaller than the spectral resolution, which still can be deconvoluted with data of good statistical quality.
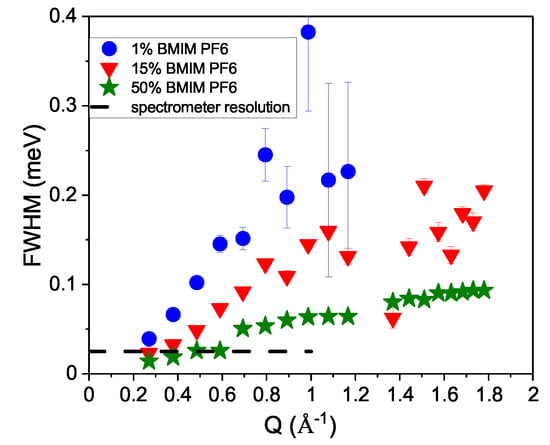
Figure 3.
The molar concentration dependence for the line width representing the translational diffusive motion is plotted for K. Included as a dashed line is the spectrometer resolution (FWHM).
In Figure 4, the widths are plotted against in a small Q-range up to Å. At long distances and therefore small Q, the Fick diffusion law applies, and the line width is related to Q in the following way: . Hence, this relationship provides a linear dependence on with the diffusion coefficient as the slope. The fit has been applied to data points up to Å. Please note that at the smallest wave vector, there is a small deviation from the straight line, which is probably the result of not correcting for multiple scattering at this concentration.
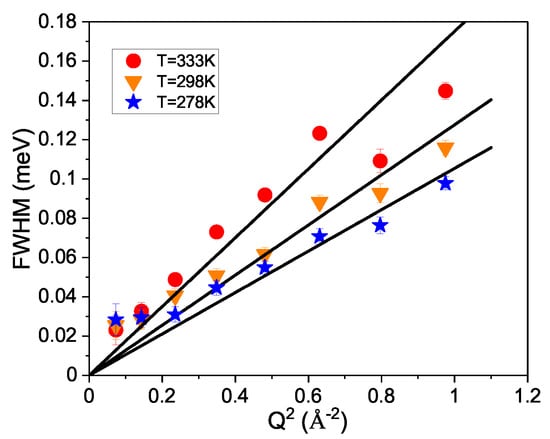
Figure 4.
The line width of solution for the three measured temperatures is plotted against to extract the diffusion coefficients. The lines describe the fitted diffusion behavior.
The measured diffusion coefficients are plotted on a logarithmic scale against the inverse temperature in Figure 5. Included are the values from the classical MD-simulation [44], which were performed at slightly different temperatures and concentrations. There is a fair agreement between QENS and MD-simulation concerning the evolution with temperature, even though the MD-simulation seems to provide a slower dynamics. For the MD-simulation, it was mentioned that the model delivered an about 25% slower dynamics than experimentally observed for acetonitrile [44]. Taking this mismatch into account, the experimentally observed diffusion coefficients are in good agreement with the MD-simulation results. With NMR a BMIM cation self-diffusion coefficients of cm/s at K has been reported for a 15% mole solution of an IL in acetonitrile [36].
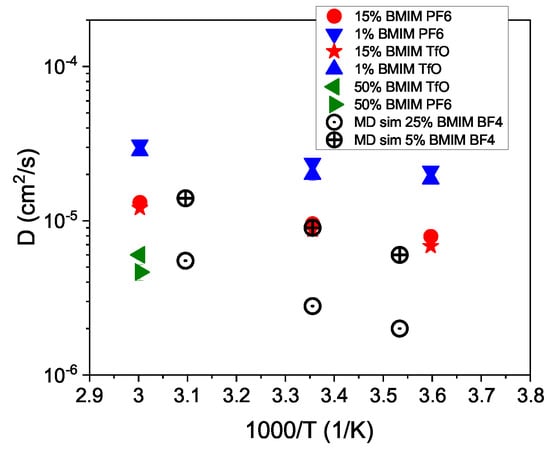
Figure 5.
The derived diffusion coefficients are plotted in an Arrhenius-type representation against the inverse temperature. Included are results from a classical MD-simulation (open symbols) [44].
Assuming an Arrhenius-type temperature dependence for the diffusion process, activation energies can be derived. We obtain for the 15% solutions activation energies of meV and = meV. For the 1% solution, the values are slightly lower: = meV and = meV.
The concentration dependence of the diffusion coefficients is plotted in Figure 6. It clearly shows the strong dependence of the diffusion coefficients with concentration of acetonitrile. The difference in the diffusion coefficient between the 1% and 50% concentration is about a factor of 8. Diluting the IL with acetonitrile considerably speeds up cation diffusion. The ionic conductivity is given by a product of diffusion coefficient and the ion density. Combined with the cation density in the solution, this increase in D provides a maximum conductivity of around 20% [44]. Macroscopic conductivity measurements on IL–acetonitrile solutions related the mobility of the ions to the viscosity of the surrounding fluid [59]. Structural changes with the addition of acetonitrile were reported [60]. The QENS measurements confirm the conclusion from the MD-simulation.
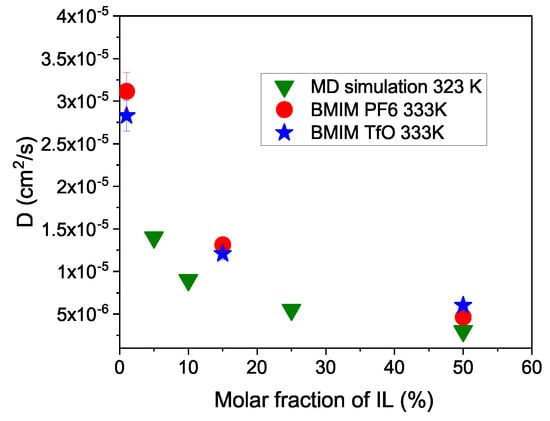
Figure 6.
The concentration dependence of the diffusion coefficients is plotted together with results from a MD-simulation [44].
Finally, we wish to discuss the dynamics in the pure ionic liquids. In this case, no translational motion could be resolved because its dynamics were too slow for the spectrometer resolution. Therefore, we applied a fit with a single Lorentzian function to resolve all localized motions together. This model fit delivers an amplitude for the quasielastic broadening and a contribution for the elastic part of the signal. From the ratio of these intensities, the elastic incoherent structure factor (EISF) can be obtained [53]. From the modeling of the spectra, the EISF is extracted and the EISFs for both ILs are plotted in Figure 7. The EISF provides a measure for the geometry of the localized motion of the hydrogen atoms. The shape of the EISF indicates a motion, which might be described by a rotation of the hydrogens on a sphere. In this case the EISF is given by:
where r indicates the radius of the sphere. The lines in Figure 7 show the fit result with this equation and demonstrate a good agreement with this model. For the radius, we obtain Å, which is larger than the radius expected for a single methyl rotation; hence, we conclude that the whole cation is involved in this motion. The dashed line indicates the expected behavior of a single rotating methyl group. The experimental data rule out this interpretation, and more complex rotational motion must be assumed. For the BmimBr ionic liquid, localized motion was identified from fitting the EISF [30]. A sphere radius of Å was obtained, which might indicate that we observe the same type of motion. A QENS study on C8mimTFSI found slow localized motion, which was interpreted as restricted diffusive motion in a sphere [31]. The analysis delivered a radius of Å, in perfect agreement with our result.
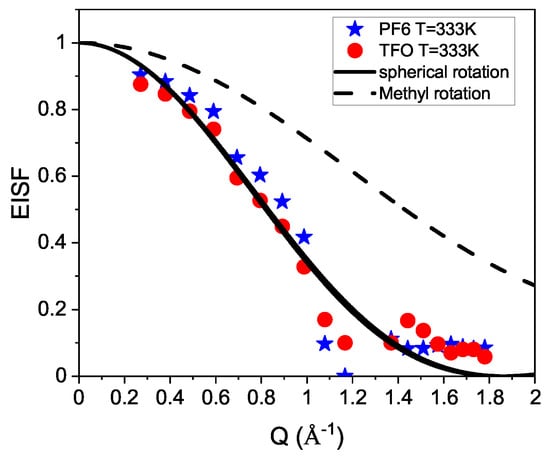
Figure 7.
The EISFs for the pure ILs are shown together with a fit (lines) that assumes rotational movement on a sphere of hydrogens. The dashed line indicates the EISF for a methyl rotation.
4. Conclusions
A quasielastic neutron scattering experiment on pure ILs and solutions of different concentrations of ILs in acetonitrile was performed. The QENS experiment is mostly sensitive to the motions of the cations in the solutions due to the choice of a deuterated solvent. The translational diffusive dynamics was resolved for 1%, 15% and 50% concentrations of the IL. Two different ILs with different anions were investigated, and no significant difference in the cation dynamics appeared with different anions. With decreasing concentration, the diffusivity increases by nearly an order of magnitude, in agreement with results from a classical MD-simulation. Changing the temperature resulted in an Arrhenius-type behavior of the diffusion coefficients. This concentration dependence is the reason for the strong increase in conductivity of the IL within acetonitrile, which might peak at an IL concentration of about 20%. For the pure IL, the translational dynamics could not be resolved; however, the localized motion of the cations could be described as spherical rotation. The creation of appropriate solutions paves the way to engineer the required conductivity for an application.
Author Contributions
Experiment, F.D., W.S.H.; data analysis, F.D., W.S.H.; writing, review and editing, F.D., W.S.H. All authors have read and agreed to the published version of the manuscript.
Funding
This work was supported by the Science and Technology Facilities Council, STFC.
Data Availability Statement
The data can be obtained through reasonable demand from the authors.
Acknowledgments
This study was initiated by our colleague and friend Ashok Adya, who passed away too early to finish this work. We dedicate this paper in memoriam to Ashok. We thank Oleg Kalugin for support during the measurements.
Conflicts of Interest
The authors declare no conflict of interest.
References
- Plechkova, N.V.; Seddon, K.R. Applications of ionic liquids in the chemical industry. Chem. Soc. Rev. 2008, 37, 123. [Google Scholar] [CrossRef]
- Welton, T. Room-Temperature Ionic Liquids. Solvents for Synthesis and Catalysis. Chem. Rev. 1999, 99, 2071. [Google Scholar] [CrossRef] [PubMed]
- Armand, M.; Endres, F.; MacFarlane, D.R.; Ohno, H.; Scrosati, B. ionic-liquid materials for the electrochemical challenges of the future. Nat. Mater. 2009, 8, 621. [Google Scholar] [CrossRef] [PubMed]
- Hardacre, C.; Holbrey, J.D.; McMath, S.E.J.; Bowron, D.T.; Soper, A.K. Structure of molten 1,3-dimethylimidazolium chloride using neutron diffraction. J. Chem. Phys. 2003, 118, 273. [Google Scholar] [CrossRef]
- Hardacre, C.; McMath, S.E.J.; Nieuwenhuyzen, M.; Bowron, D.T.; Soper, A.K. Liquid structure of 1,3-dimethylimidazolium salts. J. Phys. Condens. Matter 2003, 15, S159. [Google Scholar] [CrossRef]
- Deetlefs, M.; Hardacre, C.; Nieuwenhuyzen, M.; Padua, A.A.H.; Sheppard, O.; Soper, A.K. Liquid Structure of the Ionic Liquid 1,3-Dimethylimidazolium Bis(trifluoromethyl)sulfonylamide. J. Phys. Chem. B 2006, 110, 12055. [Google Scholar] [CrossRef]
- Hardacre, C.; Holbrey, J.D.; Nieuwenhuyzen, M.; Youngs, T.G.A. Structure and Solvation in Ionic Liquids. ACC Chem. Res. 2007, 40, 1146. [Google Scholar] [CrossRef]
- Bowron, D.T.; D’Agostino, C.; Gladden, L.F.; Hardacre, C.; Holbrey, J.D.; Lagunas, M.C.; McGregor, J.; Mantle, M.D.; Mullan, C.L.; Youngs, T.G.A. Structure and Dynamics of 1-Ethyl-3-methylimidazolium Acetate via Molecular Dynamics and Neutron Diffraction. J. Phys. Chem. B 2010, 114, 7760. [Google Scholar] [CrossRef]
- Aoun, B.; Goldbach, A.; Kohara, S.; Wax, J.F.; Gonzalez, M.A.; Saboungi, M.L. Structure of a Prototypic Ionic Liquid: Ethyl-methylimidazolium Bromide. J. Phys. Chem. B 2010, 114, 12623. [Google Scholar] [CrossRef]
- Macchiagodena, M.; Gontrani, L.; Ramondo, F.; Triolo, A.; Caminiti, R. Liquid structure of 1-alkyl-3-methylimidazolium-hexauorophosphates by wide angle X-ray and neutron scattering and molecular dynamics. J. Chem. Phys. 2011, 134, 114521. [Google Scholar] [CrossRef]
- Kastner, E.W.; Margulis, C.J.; Maroncelli, M.; Wishart, J.F. Ionic Liquids: Structure and Photochemical Reactions. Annu. Rev. Phys. Chem. 2011, 62, 85. [Google Scholar] [CrossRef] [PubMed]
- Bodo, E.; Gontrani, L.; Caminiti, R.; Plechkova, N.V.; Seddon, K.R.; Triolo, A. Structural Properties of 1-Alkyl-3-methylimidazolium Bis(trifluoromethyl)sulfonylamide Ionic Liquids: X-ray Diffraction Data and Molecular Dynamics Simulations. J. Phys. Chem. B 2010, 114, 16398. [Google Scholar] [CrossRef] [PubMed]
- Triolo, A.; Russina, O.; Bleif, H.J.; Di Cola, E. Nanoscale Segregation in Room Temperature Ionic Liquids. J. Phys. Chem. B 2007, 111, 4641. [Google Scholar] [CrossRef] [PubMed]
- Triolo, A.; Russina, O.; Fazio, B.; Triolo, R.; Di Cola, E. Morphology of 1-alkyl-3-methylimidazolium hexafluorophosphate room temperature ionic liquids. Chem. Phys. Lett. 2008, 457, 362. [Google Scholar]
- Triolo, A.; Russina, O.; Fazio, B.; Appetecchi, G.B.; Carewska, M.; Passerini, S. Nanoscale organization in piperidinium-based room temperature ionic liquids. J. Chem. Phys. 2009, 130, 164521. [Google Scholar] [CrossRef]
- Russina, O.; Triolo, A.; Gontrani, L.; Caminiti, R.; Xiao, D.; Hines, L.G., Jr.; Bartsch, R.A.; Quitevis, E.L.; Plechkova, N.; Seddon, K.R. Morphology and intermolecular dynamics of 1-alkyl-3-methylimidazolium bis(trifluoromethane)sulfonylamide ionic liquids: Structural and dynamic evidence of nanoscale segregation. J. Phys. Condens. Matter 2009, 21, 424121. [Google Scholar] [CrossRef]
- Hardacre, C.; Holbrey, J.D.; Mullan, C.L.; Youngs, T.G.A.; Bowron, D.T. Small angle neutron scattering from 1-alkyl-3-methylimidazolium hexafluorophosphate ionic liquids Cnmim PF6, n=4, 6, and 8. J. Chem. Phys. 2010, 133, 074510. [Google Scholar] [CrossRef]
- Aoun, B.; Goldbach, A.; Gonzalez, M.A.; Kohara, S.; Price, D.L.; Saboungi, M.L. Nanoscale heterogeneity in alkyl- methylimidazolium bromide ionic liquids. J. Chem. Phys. 2011, 134, 104509. [Google Scholar] [CrossRef]
- Alcaraz, O.; Demmel, F.; Trullas, J. Single ion dynamics in molten sodium bromide. J. Chem. Phys. 2014, 141, 244508. [Google Scholar] [CrossRef]
- Demmel, F.; Mukhopadhyay, S. Quasielastic neutron scattering measurements and ab initio MD-simulations on single ion motions in molten NaF. J. Chem. Phys. 2016, 144, 014503. [Google Scholar] [CrossRef]
- Demmel, F. Sodium ion self-diffusion in molten NaBr probed over different length scale. Phys. Rev. E 2020, 101, 062603. [Google Scholar] [CrossRef] [PubMed]
- Triolo, A.; Russina, O.; Arrighi, V.; Juranyi, F.; Janssen, S.; Gordon, C.M. Quasielastic neutron scattering characterization of the relaxation processes in a room temperature ionic liquid. J. Chem. Phys. 2003, 119, 8549. [Google Scholar] [CrossRef]
- Triolo, A.; Russina, O.; Hardacre, C.; Nieuwenhuyzen, M.; Gonzalez, M.A.; Grimm, H. Relaxation Processes in Room Temperature Ionic Liquids: The Case of 1-Butyl-3-Methyl Imidazolium Hexafluorophosphate. J. Phys. Chem. B 2005, 109, 22061. [Google Scholar] [CrossRef] [PubMed]
- Triolo, A.; Mandanici, A.; Russina, O.; Rodriguez-Mora, V.; Cutroni, M.; Hardacre, C.; Nieuwenhuyzen, M.; Bleif, H.J.; Keller, L.; Ramos, M.A. Thermodynamics, Structure, and Dynamics in Room Temperature Ionic Liquids: The Case of 1-Butyl-3-methyl Imidazolium Hexafluorophosphate ([bmim][PF6]). J. Phys. Chem. B 2006, 110, 21357. [Google Scholar] [CrossRef]
- Mamontov, E.; Luo, H.; Dai, S. Proton Dynamics in N,N,N’,N’-Tetramethylguanidinium Bis(perfluoroethylsulfonyl)imide Protic Ionic Liquid Probed by Quasielastic Neutron Scattering. J. Phys. Chem. B 2009, 113, 159. [Google Scholar] [CrossRef]
- Russina, O.; Beiner, M.; Pappas, C.; Russina, M.; Arrighi, V.; Unruh, T.; Mullan, C.L.; Hardacre, C.; Triolo, A. Temperature Dependence of the Primary Relaxation in 1-Hexyl-3-methylimidazolium bis(trifluoromethyl)sulfonylimide. J. Phys. Chem. B 2009, 113, 8469. [Google Scholar] [CrossRef] [PubMed]
- Aoun, B.; Gonzalez, M.A.; Olivier, J.; Russina, M.; Izaola, Z.; Price, D.L.; Saboungi, M.L. Translational and Reorientational Dynamics of an Imidazolium-Based Ionic Liquid. J. Phys. Chem. Lett. 2010, 1, 2503. [Google Scholar] [CrossRef]
- Kofu, M.; Someya, T.; Tatsumi, S.; Ueno, K.; Ueki, T.; Watanabe, M.; Matsunaga, T.; Shibayama, M.; Garcia Sakai, V.; Tyagi, M.; et al. Microscopic insights into ion gel dynamics using neutron spectroscopy. Soft Matter 2012, 8, 7888. [Google Scholar] [CrossRef]
- Embs, J.P.; Burankova, T.; Reichert, E.; Fossog, V.; Hempelmann, R. QENS Study of Diffusive and Localized Cation Motions of Pyridinium-based Ionic Liquids. J. Phys. Soc. Jpn. 2013, 82, SA003. [Google Scholar] [CrossRef]
- Aoun, B.; Gonzlez, M.A.; Russina, M.; Price, D.L.; Saboungi, M.-L. Dynamics of butyl- and hexyl-methylimidazolium bromide ionic liquids. J. Phys. Soc. Jpn. 2013, 82, SA002. [Google Scholar] [CrossRef]
- Kofu, M.; Tyagi, M.; Inamura, Y.; Miyazaki, K.; Yamamuro, O. Quasielastic neutron scattering studies on glass-forming ionic liquids with imidazolium cations. J. Chem. Phys. 2015, 143, 234502. [Google Scholar] [CrossRef]
- Berrod, Q.; Ferdeghini, F.; Zanotti, J.M.; Judeinstein, J.; Lairez, D.; Garca Sakai, V.; Czakkel, O.; Fouquet, P.; Constantin, D. Ionic Liquids: Evidence of the viscosity scale-dependence. Sci. Rep. 2017, 7, 2241. [Google Scholar] [CrossRef]
- Lundin, F.; Aguilera, L.; Hansen, H.W.; Lages, S.; Labrador, A.; Niss, K.; Frick, B.; Matic, A. Structure and dynamics of highly concentrated LiTFSI/acetonitrile electrolytes. Phys. Chem. Chem. Phys. 2021, 23, 13819. [Google Scholar] [CrossRef] [PubMed]
- De Roche, J.; Gordon, C.M.; Imrie, C.T.; Ingram, M.D.; Kennedy, A.R.; Lo Celso, F.; Triolo, A. Application of Complementary Experimental Techniques to Characterization of the Phase Behavior of [C16mim][PF6] and [C14mim][PF6]. Chem. Mater. 2003, 15, 3089. [Google Scholar] [CrossRef]
- Rivera, A.; Brodin, A.; Pugachev, A.; Rössler, E.A. Orientational and translational dynamics in room temperature ionic liquids. J. Chem. Phys. 2007, 126, 114503. [Google Scholar] [CrossRef] [PubMed]
- Keaveney, S.T.; Schaffarczyk McHale, K.S.; Stranger, J.W.; Ganbold, B.; Price, W.S.; Harper, J.B. NMR Diffusion Measurements as a Simple Method to Examine SolventSolvent and SolventSolute Interactions in Mixtures of the Ionic Liquid [Bmim][N(SO2CF3)2] and Acetonitrile. ChemPhysChem 2016, 17, 3853. [Google Scholar] [CrossRef]
- Hoarfrost, M.L.; Tyagi, M.; Segalman, R.A.; Reimer, J.A. Proton Hopping and Long-Range Transport in the Protic Ionic Liquid [Im][TFSI], Probed by Pulsed-Field Gradient NMR and Quasi-Elastic Neutron Scattering. J. Phys. Chem. B 2012, 116, 8201. [Google Scholar] [CrossRef] [PubMed]
- Lengvinaite, D.; Klimavicius, V.; Balevicius, V.; Aidas, K. Computational NMR Study of Ion Pairing of 1-Decyl-3-methyl-imidazolium Chloride in Molecular Solvents. J. Phys. Chem. B 2020, 124, 10776. [Google Scholar] [CrossRef] [PubMed]
- Urahata, S.M.; Ribeiro, M.C.C. Structure of ionic liquids of 1-alkyl-3-methylimidazolium cations: A systematic computer simulation study. J. Chem. Phys. 2004, 124, 1855. [Google Scholar] [CrossRef]
- Urahata, S.M.; Ribeiro, M.C.C. Single particle dynamics in ionic liquids of 1- alkyl-3-methylimidazolium cations. J. Chem. Phys. 2005, 122, 024511. [Google Scholar] [CrossRef]
- Ribeiro, M.C.C. Correlation between Quasielastic Raman Scattering and Configurational Entropy in an Ionic Liquid. J. Phys. Chem. B 2007, 111, 5008. [Google Scholar] [CrossRef] [PubMed]
- Schröder, C.; Wakai, C.; Weingärtner, H.; Steinhauser, O. Collective rotational dynamics in ionic liquids: A computational and experimental study of 1-butyl-3-methyl-imidazolium tetra?uoroborate. J. Chem. Phys. 2007, 126, 084511. [Google Scholar] [CrossRef] [PubMed]
- Chaban, V.V.; Voroshylova, I.V.; Kalugin, O.N. A new force field model for the simulation of transport properties of imidazolium-based ionic liquids. Phys. Chem. Chem. Phys. 2011, 13, 7910. [Google Scholar] [CrossRef]
- Chaban, V.V.; Voroshylova, I.V.; Kalugin, O.N.; Prezhdo, O.V. Acetonitrile Boosts Conductivity of Imidazolium Ionic Liquids. J. Phys. Chem. B 2012, 116, 7719. [Google Scholar] [CrossRef] [PubMed]
- Paschoal, V.H.; Faria, L.F.O.; Ribeiro, M.C.C. Vibrational Spectroscopy of Ionic Liquids. Chem. Rev. 2017, 117, 7053. [Google Scholar] [CrossRef]
- Bodo, E. Perspectives in the Computational Modeling of New Generation, Biocompatible Ionic Liquids. J. Phys. Chem. B 2022, 126, 3. [Google Scholar] [CrossRef]
- Ruiz-Martin, M.D.; Quereshi, N.; Gonzales, M.A.; Olivier, J.; Frick, B.; Farago, B. Influence of water on the microscopic dynamics of 1-butyl-3-methylimidazolium tetrafluoroborate studied by means of quasielastic neutron scattering. J. Chem. Phys. 2022, 156, 084505. [Google Scholar] [CrossRef] [PubMed]
- Hurle, R.L.; Woolfe, L.A. Self-diffusion in Liquid Acetonitrile under Pressure. J. Chem. Phys. Faraday Trans. 1982, 78, 2233. [Google Scholar] [CrossRef]
- Cohen, S.R.; Plazanet, M.; Rols, S.; Voneshen, D.J.; Fourkas, J.T.; Coasne, B. Structure and dynamics of acetonitrile: Molecular simulation and neutron scattering. J. Mol. Liqu. 2022, 348, 118423. [Google Scholar] [CrossRef]
- Tokuda, H.; Tsuzuki, S.; Hasan Susan, A.B.; Hayamizu, K.; Watanabe, M. How Ionic Are Room-Temperature Ionic Liquids? An Indicator of the Physicochemical Properties. J. Phys. Chem. B 2006, 110, 19593. [Google Scholar] [CrossRef]
- Stoppa, A.; Hunger, J.; Buchner, R. Conductivities of Binary Mixtures of Ionic Liquids with Polar Solvents. J. Chem. Eng. Data 2009, 54, 472. [Google Scholar] [CrossRef]
- Sears, V.F. Neutron scattering lengths and cross sections. Neutron News 1992, 3, 26–37. [Google Scholar] [CrossRef]
- Bee, M. Quasielastic Neutron Scattering; Adam Hilger: Bristol, UK, 1988. [Google Scholar]
- Telling, M.T.F.; Andersen, K.H. Spectroscopic characteristics of the OSIRIS near-backscattering crystal analyser spectrometer on the ISIS pulsed neutron source. Phys. Chem. Chem. Phys. 2005, 7, 1255. [Google Scholar] [CrossRef] [PubMed]
- Demmel, F.; Pokhilchuk, K. The resolution of the tof-backscattering spectrometer OSIRIS: Monte Carlo simulations and analytical calculations. Nucl. Instr. Meth. A 2014, 767, 426. [Google Scholar] [CrossRef]
- Demmel, F.; Pasqualini, D.; Morkel, C. Inelastic collective dynamics of liquid rubidium with increasing temperature by neutron scattering studies. Phys. Rev. B 2006, 74, 184207. [Google Scholar] [CrossRef]
- Sivia, D.S.; Carlile, C.J.; Howells, W.S.; König, S. Bayesian analysis of quasielastic neutron scattering data. Phys. B 1992, 182, 341. [Google Scholar] [CrossRef]
- Arnold, O.; Bilheux, J.C.; Borreguero, J.M.; Buts, A.; Campbell, J.I.; Chapon, L.; Doucet, M.; Draper, N.; Leal, R.F.; Gigg, M.A.; et al. Mantid-Data analysis and visualization package for neutron scattering and mu SR experiments. Nucl. Instr. Meth. A 2014, 764, 156. [Google Scholar] [CrossRef]
- Pinkert, A.; Ang, K.L.; Marsh, K.N.; Pang, S. Density, viscosity and electrical conductivity of protic alkanolammonium ionic liquids. Phys. Chem. Chem. Phys. 2011, 13, 5136. [Google Scholar] [CrossRef]
- Zheng, Y.Z.; Wang, N.N.; Luo, J.J.; Zhoua, Y.; Yu, Z.W. Hydrogen-bonding interactions between [BMIM][BF4] and acetonitrile. Phys. Chem. Chem. Phys. 2013, 15, 18055. [Google Scholar] [CrossRef]
Disclaimer/Publisher’s Note: The statements, opinions and data contained in all publications are solely those of the individual author(s) and contributor(s) and not of MDPI and/or the editor(s). MDPI and/or the editor(s) disclaim responsibility for any injury to people or property resulting from any ideas, methods, instructions or products referred to in the content. |
© 2023 by the authors. Licensee MDPI, Basel, Switzerland. This article is an open access article distributed under the terms and conditions of the Creative Commons Attribution (CC BY) license (https://creativecommons.org/licenses/by/4.0/).