Article

Plasma-Treated Water Effect on Sporulating Bacillus cereus vs. Non-Sporulating Listeria monocytogenes Biofilm Cell Vitality

Leibniz Institute for Plasma Science and Technology, 17489 Greifswald, Germany
*
Author to whom correspondence should be addressed.
Appl. Microbiol. 2025, 5(3), 80; https://doi.org/10.3390/applmicrobiol5030080 (registering DOI)
Submission received: 3 July 2025 / Revised: 30 July 2025 / Accepted: 2 August 2025 / Published: 5 August 2025

Abstract

Foodborne illness caused by bacterial pathogens is a global health concern and results in millions of infections annually. Therefore, food products typically undergo several processing stages, including sanitation steps, before being distributed in an attempt to remove pathogens. However, many sanitation methods have compounding effects on the color, texture, flavor, and nutritional quality of the product or do not effectively reduce the pathogens that food can be exposed to. Some bacterial pathogens particularly possess traits and tactics that make them even more difficult to mitigate such as biofilm formation. Non-thermal plasma sanitation techniques, including plasma-treated water (PTW), have proven to be promising methods that significantly reduce pathogenic bacteria that food is exposed to. Published work reveals that PTW can effectively mitigate both gram-positive and gram-negative bacterial biofilms. This study presents a novel analysis of the differences in antimicrobial effects of PTW treatment between biofilm-forming gram-positive bacteria, commonly associated with foodborne illness, that are sporulating (Bacillus cereus) and non-sporulating (Listeria monocytogenes). After treatment with PTW, the results suggest the following hypotheses: (1) that the non-sporulating species experiences less membrane damage but a greater reduction in metabolic activity, leading to a possible viable but non-culturable (VBNC) state, and (2) that the sporulating species undergoes spore formation, which may subsequently convert into vegetative cells over time. PTW treatment on gram-positive bacterial biofilms that persist in food processing environments proves to be effective in reducing the proliferating abilities of the bacteria. However, the variance in PTW’s effects on metabolic activity and cell vitality between sporulating and non-sporulating species suggest that other survival tactics might be induced. This analysis further informs the application of PTW in food processing as an effective sanitation method.

Graphical Abstract

1. Introduction

In 2021, surveys estimated that, throughout the world, the average daily consumption of food per adult was 2573–3878 kcal [1], representing a high demand and supply of food products. Most of these food products go through at least some of the food processing steps, including raw material preparation, mixing ingredients, processing, storage, and distribution before being consumed [2]. Depending on the type of processing required to meet the demand for various food groups, there is a probability that the food product is exposed to contamination at any of these processing stages, which can ultimately lead to very dangerous foodborne outbreaks [3]. Particularly, procedures within food processing plants such as inadequate heat processing, cross-contamination of raw ingredients, and improper cleaning of equipment are main contributors to foodborne outbreaks [4,5].
Several sanitation techniques have been explored to combat microbial contamination of food products; however, many of these techniques have negative compounding effects on the products. Historically, high thermal treatment (typically around 121 °C) has been the most common form of sterilization, which effectively eliminates a wide range of bacteria and spores that cause foodborne outbreaks [6]. This technique, while increasing the shelf life of the product, significantly reduces the quality of the food [7], including changes in nutritional value (e.g., of goose breast meat [8]), flavor (e.g., of camel milk [9]), color (e.g., of pea puree [10]), and texture (e.g., of carrots [11]). Other sanitation techniques that have been developed such as high pressure processive, UV light treatment, ultrasonic sterilization, and pulsed electric field treatments have been shown to have antimicrobial effects but typically need to be combined with another method, such as thermal treatment, to effectively decrease microbial activity, particularly when spores are present [7,12,13,14,15].
Nevertheless, non-thermal plasma (NTP) treatment is another new promising technique that has been reported to have a lethal effect on microorganisms and spores [16,17] through methods of indirect and direct exposure. There are two defined categories of plasma: thermal and non-thermal. Thermal plasmas are characterized by a local thermodynamic equilibrium between electrons and heavy species, including positive and negative ions, free radicals, molecules, and atoms, and the gas can reach very high temperatures ( 5   t o   20 · 10 3 K) [18]. Non-thermal plasmas, such as those used in this study, have electron temperatures that are much higher than the gas temperatures; therefore, the plasma is in non-equilibrium. The ability of non-thermal plasmas to remain near ambient temperatures allows it to be directly projected onto a target surface or to indirectly interact with gas or liquid to form reactive species [18].
Plasma generated compounds such as plasma-activated gas and plasma-treated water (PTW) can be used as effective indirect NTP approaches to mitigate microbial contamination on food and food processing equipment while preserving quality characteristics, such as color and texture, of the food product [19,20]. Notably, new microwave plasma sources, such as the MidiPLexc (in-house invention by Leibniz Institute for Plasma Science and Technology; Greifswald, Germany), can operate using compressed atmospheric air instead of inert gases, presenting a cost-efficient and up-scalable sanitation method in food processing [21]. This system works due to high-energy electrons and ions in the plasma producing reactive species, such as reactive oxygen (ROS) and nitrogen species (RNS), through reactions with the air and water molecules in a concealed space (Figure 1) [22]. The MidiPLexc induces formation of RNS, namely nitrite ( N O 2 ) nitrate ( N O 3 ), and peroxynitrite ( O N O O ), as well as the ROS hydrogen peroxide ( H 2 O 2 ) [23].
Bacteria that cause foodborne illness outbreaks on food surfaces and processing equipment typically exist in biofilms [24,25]. Bacterial biofilms are coordinated, functional microbial communities with complex compositions that are encased by extracellular polymeric substances that stick to surfaces [26]. The pathogenic species Bacillus cereus and Listeria monocytogenes are two important bacteria known to cause severe foodborne illness due to their ability to form treatment-resistant biofilms [5]. B. cereus is a facultative anaerobic, gram-positive, and spore-forming species known for its ability to grow as biofilms in a wide range of temperatures (4–50 °C) and is resistant to heat, chemical, and radiation treatments [27]. Bacteria species capable of forming endospores present an extreme risk to food safety due to their ability to survive high temperatures, ethanol treatments, ultraviolet radiation, and extreme pH gradients that are sanitation methods commonly used in food processing [28]. B. cereus spores have been shown to be highly resistant to pasteurization temperatures between 72 and 150 °C, can survive doses of gamma radiation up to 4 kGy, and remain present in dairy products refrigerated for 90 days [29,30,31]. B. cereus causes illness through the production of diarrheal enterotoxins that cause diarrhea and abdominal pain, as well as emetic toxin (cereulide) causing vomiting [25]. L. monocytogenes is also a gram-positive, facultative anaerobic pathogen; however, it is non-sporulating [32]. L. monocytogenes presents a hazardous issue in food processing due to its ability to grow biofilms on many different surface types [33], even in harsh conditions such as low temperatures of 4 °C (typical refrigerator temperature), extreme pHs, or high salt concentrations [32]. Listeriosis caused by L. monocytogenes can lead to meningitis in immunocompromised individuals, abortions in pregnant people, and gastroenteritis in healthy individuals, with a mortality rate of 20–30% [32].
During 2023 in Europe, B. cereus toxins were responsible for 4665 reported foodborne illness cases and, in the United States, it is estimated that this pathogen was responsible for approximately 63,400 cases annually from 2000 to 2008 [34,35]. B. cereus foodborne illness is commonly associated with meats, beans, vegetables, dairy products, rice, and other starchy foods [36]. Due to contamination, large amounts of food products have been recalled between 2021 and 2025 such as ground ginger and various shoot products in Germany as well as oat milk and ready-to-eat pepperoni in the United States [37,38,39,40]. L. monocytogenes caused 133 foodborne illness cases and 11 deaths in Europe in 2023 and is estimated to have caused approximately 1591 cases and 1455 hospitalizations yearly in the United States from 2000 to 2008 [34,35]. Recent Listeria outbreaks have been linked to foods such as deli meats, soft cheeses, raw milk, fish, and raw vegetables [41,42]. Massive food recalls in 2025 include enoki mushrooms, raclette cheese, and herb fish filets in Germany as well as cheddar cheeses, celery sticks, and tuna salad in the United States [43,44,45,46,47,48].
Both B. cereus and L. monocytogenes biofilms present uniquely difficult situations to mitigate in food processing due to their natural protective properties. Namely, B. cereus can form spores to resist treatment while L. monocytogenes cannot. Cold-plasma treatments such as PTW have been shown to have strong antimicrobial effects, yet the extent to which this treatment acts differently on sporulating vs. non-sporulating bacteria has yet to be analyzed. This work assesses the potential utilization of PTW in food processing to mitigate foodborne illnesses caused by biofilms of sporulating and non-sporulating bacteria through the characterization of its physicochemical properties and its antimicrobial effects on B. cereus and L. monocytogenes biofilms, using proliferation, viability, and metabolic assays. Further, these findings may inform that PTW can be used as a decontamination agent in food industry applications to increase food safety.

2. Materials and Methods

2.1. Producing PTW Using Microwave Plasma Source

Plasma-treated water was produced using the MidiPLexc microwave plasma source (in-house invention by Leibniz Institute for Plasma Science and Technology; Greifswald, Germany). The MidiPLexc is unlike other plasma sources in that it is able to work with compressed air instead of noble gases, such as argon or helium, to create the plasma gas used to indirectly treat water [23]. A 1 L glass bottle was filled with 100 mL cold boiled tap water (BTW, 5 °C) and securely fit onto the MidiPLexc using a built-in adapter (Figure 1). The BTW was sourced from municipal tap water (Stadtwerke Greifswald GmbH, Greifswald, Germany; desalinated in house; hardness = 21.7 °dH, pH = 7.32, conductivity = 820 µS/cm) that was boiled in an electric kettle and cooled at room temperature before storage in a 5 °C refrigerator. The plasma source was operated with a compressed air gas flow of 1.5 standard L/min (slm) and a forward power of 50 W and reverse power of 2.0 W maximum. The water was consistently mixed using a stir bar at 80 RPM for pre-treatment times of 10, 60, and 90 min. PTW was stored in plastic containers at −4 °C until one day prior to the post-treatment date.

2.2. Growth of Bacillus cereus and Listeria monocytogenes Biofilms

B. cereus (ATCC 14579) and L. monocytogenes (ATCC 15313) were the bacterial strains used to grow individual biofilms. On day 1, 20 mL of prepared CASO (tryptic soy) broth (Carl Roth GmbH, Karlsruhe, Germany) was inoculated with one colony of B. cereus and 20 mL of prepared Brain Heart Infusion (BHI) broth (Carl Roth GmbH, Karlsruhe, Germany) was inoculated with one colony of L. monocytogenes in separate Erlenmeyer flasks (VWR International GmbH, Darmstadt, Germany). Both cultures were statically incubated at 30 °C for ~18 h. On day 2, the overnight cultures’ optical densities were measured at 600 nm (OD600) using the respective broths as blanks. The OD600 for B. cereus was adjusted to 0.1 and L. monocytogenes adjusted to 0.2. Center wells of 96-well plates were seeded with 300 µL of the adjusted bacteria cultures, with the outside wells filled with 300 µL of autoclaved water to prevent drying and temperature fluctuation during incubation. Biofilms were allowed to grow at 30 °C, B. cereus for 48 h and L. monocytogenes for 52 h. The adjusted cultures were also used to perform serial dilutions in 1:10 steps using a solution of 0.85% NaCl + 0.1% Tryptone as the dilute. Dilutions of 10−4, 10−5, and 10−6 of B. cereus and L. monocytogenes were plated (10 µL each) on CASO agar and BHI agar (Carl Roth GmbH, Karlsruhe, Germany) plates, respectively, for incubation at 30 °C for 24 h. On day 3, the raw colony counts for each dilution were obtained to calculate the initial colony-forming units (CFU) per milliliter (CFU/mL) from the overnight bacterial cultures. All CFU/mL were calculated for each individual plate using the formula:
C F U m L = 10 x V · c y + c y + 1 n y + 0.1 n y + 1
w i t h   x = l o w e s t   c o u n t a b l e   d i l u t i o n   l e v e l
a n d   y = x 1
where 10 x is the lowest dilution factor counted, V is the volume of each plated dilution cell suspension in mL, c y is the sum of colonies on all ( n y ) plates of the lowest countable dilution level, and c y + 1 is the total number of colonies on all ( n y + 1 ) plates of the next-lowest dilution level evaluated. Calculations can be explained in better detail in [49]. A plate was defined as countable with a minimum of one colony and maximum where the colonies were no longer clearly distinguishable.

2.3. PTW Treatment on B. cereus and L. monocytogenes Biofilms

PTW was thawed at 4 °C for 24 h prior to bacterial treatment and proper PTW production was confirmed by measuring the pH and conductivity on the day of post-treatment. After the biofilm growth periods (day 4), the 96-well plates were removed from the 30 °C incubator for post-treatment. A total of 200 µL of supernatant was removed from the wells and each biofilm was washed twice with 100 µL of 0.85% NaCl. If any parts of the biofilm were dislodged during this process, they were not included as samples. Treatments including 200 µL of 0.85% NaCl, BTW, 10 min PTW, 60 min PTW, and 90 min PTW were added to individual biofilms. The treatments were allowed to sit for post-treatment times of 5, 10, and 30 min; then, 200 µL of the supernatant was removed from the wells. To each well, 200 µL of 0.85% NaCl was added and each biofilm was dislodged by resuspension and scraping with a pipette tip. Serial dilutions were performed to calculate CFU/mL (counted on day 5) as mentioned above (where n y = 1) for each post-treatment condition. Three biological replicates containing three technical replicates, which finally resulted in n = 9, from each condition were used to calculate mean CFU/mL from individual plate CFU calculations. The reductions in proliferation were expressed as reduction factors (RF) resulting in the subtraction of the logarithmic value of the mean CFU from treated biofilms from the logarithmic value of mean CFU for saline control biofilms ( l o g c o n t r o l C F U l o g P T W C F U ).

2.4. Fluorescence Live/Dead Assay of PTW-Treated Biofilms

Treated biofilms that had been resuspended in a total volume of 300 µL were spun down at 5000 rpm and 20 °C for 5 min. To remove traces of remaining PTW from the sample, 250 µL of the supernatant was taken off leaving the bacteria pellet. The pellet was resuspended with 250 µL 0.85% NaCl. Wells of a 96-well suspension cell plate (Sarstedt, Nürmbrecht, Germany) were seeded with 100 µL of each bacteria sample. Two dyes are used in the Molecular Probes’ LIVE/DEAD® BacLight TM Bacterial Viability Kit (Molecular Probes Europe BV, Poortgebouw, The Netherlands), including SYTO 9 green-fluorescent nucleic acid stain and the red-fluorescent nucleic acid stain, propidium iodide, diluted in (Aqua bidest.; Carl Roth GmbH + Co. KG, Karlsruhe, Germany) water, and prepared according to the manufacturer’s procedure. To the wells containing samples, 100 µL of the fluorescent dye mix was added and incubated at room temperature while shaking at 80 rpm for 15 min. Fluorescence intensity (F) was measured using the SpectroMax i3x Multi-Mode plate reader (Molecular Devices, LLC., San Jose, CA, USA) with an excitation wavelength of 485 nm followed by an emission wavelength of 530 nm (green) and, subsequently, an emission wavelength of 630 nm (red). SYTO 9 green-fluorescent stain labels all bacterial membranes, intact and damaged, whereas propidium iodide only penetrates damaged cell membranes, which decreases the appearance of green stain in the sample. The ratio of live/dead cells in the samples is determined by dividing the green emission intensity by the red emission intensity.
R a t i o G / R = F 530 F 630

2.5. XTT Assay

A 96-well suspension cell plate was seeded with 100 µL of the spun-down and resuspended L. monocytogenes and B. cereus samples also used in the Live/Dead assay. The TACS® XTT Cell Proliferation Assay (USA R&D Systems, Inc., Minneapolis, MN, USA) consists of two parts, the XTT reagent, which contains an XTT reagent(2,3-Bis(2-methoxy-4-nitro-5-sulfophenyl)-2H-tetrazolium-5-carboxanilide) dissolved in a sterile solution, and the XTT activator that is a sterile solution containing phenazine methosulfate (PMS), which functions as the intermediate electron carrier. The reagent solution containing the two parts was prepared according to the manufacturer’s protocol and 50 µL of the solution was immediately added to the wells containing samples. The sample plate was incubated at 30 °C and shaking at 80 rpm for 20 h. Absorbance of samples was read at 470 nm and blank wells were read at 670 nm using the SpectroMax i3x Multi-Mode plate reader. Sample absorbance values were corrected with the average blank values ( A 470   S a m p l e A 670   B l a n k ) .

2.6. Quantification of RONS in PTW

Traceable anions, specifically nitrite ( N O 2 ) and nitrate ( N O 3 ), present in the PTW were quantified through ion chromatography (IC) with the Dionex ICS-6000 (Thermo Scientific, Dreieich, Germany). The separation of ions was performed via the anion-exchange separation column AS18 (Thermo Scientific) in combination with a guard column AG 18 (Thermo Scientific) in front of the separation column. The columns were operated at 30 °C. Previously prepared PTW was thawed at 4 °C before being diluted in pure water in a ratio of 1:10. Samples were maintained within the Autosampler unit of the ICS 6000 (Thermo Scientific) at 4 °C during measurement. The used eluent was 23 mmol∙L−1 of potassium hydroxide (KOH), generated by HPLC-grade water (Th. Geyer, Renningen, Germany) and a KOH 500 cartridge (Thermo Scientific) in the eluent generation unit of the ICS 6000 (Thermo Scientific). The eluent flow rate was 0.25 mL/min and the injection volume was 5 µL. The samples were injected into a 10 µL injection loop. Anion measurement was carried out via suppressed conductivity detection. The used suppressor ADRS 600 (Thermo Scientific) was operated at 15 mA. Three samples of each PTW type (10, 60, and 90 min) and three technical replicates of each sample were obtained. The concentrations of nitrite and nitrate were calculated by the usage of the linear regression function based on measured standards in the range of 1.95 mg/L up to 1000 mg/L. The used standards (Thermo Scientific) had a stock concentration of 1000 mg/L each.

2.7. Determining Hydrogen Peroxide Concentration Using Voltammetry

Hydrogen peroxide content in the PTW was measured using a screen-printed Prussian Blue carbon electrode (Deutsche METROHM GmbH & Co. KG, Filderstadt, Germany). The Prussian Blue on the electrode works as a catalyst for H 2 O 2 electroreduction that is highly sensitive and selective to H 2 O 2 [50]. A flow system continuously pumped buffer (2.0 M phosphate-buffered saline PBS with pH = 7.33) at a speed of 2.2 mL/min over the electrode. Samples containing H 2 O 2 were loaded into a 1.5 mL sample loop and then were integrated into the flow of buffer through the system. Reduction potential was measured using an AutolabPGSTAT101 potentiometer (Deutsche METROHM GmbH & Co. KG) to transmit sample signals to the Autolab Nova software (Nova v. 2.1.7; METROHM Autolab, Utrecht, The Netherlands) to be evaluated as amperes (A) [51]. Standard concentrations of H 2 O 2 including 0.01, 0.03, 0.05, 0.07, 0.09, and 0.11% were measured in between each group measurement of PTW samples to create a standard curve equation used to calculate percent concentration of samples and ensure accuracy of individual measurements.

2.8. Statistics

The following hypotheses were put forward to test the possible influence of PTW on the proliferation of the tested microorganisms L. monocytogenes and B. cereus:
Hypotheses I.
The PTW application does not have an impact on the proliferation capabilities of L. monocytogenes.
Hypotheses II.
The PTW application does not have an impact on the proliferation capabilities of B. cereus.
Hypotheses III.
The spore-forming property of B. cereus has no impact on the log reduction induced by the PTW application compared to the log reduction of the non-spore-forming L. monocytogenes.
These hypotheses were tested using two-tailed (due to the structure of the formulated hypotheses) non-parametric (due to the rather small sample size and non-normal distribution) tests. The chosen test for all hypotheses was the Mann–Whitney U test using OriginPro 2023. For Hypotheses I and II, the Mann–Whitney U test was applied pairwise. The pairings consisted of the control with the individual PTW applications for 10, 60, and 90 min PTW and the tap water application as a process control. The occurring multiple testing problem was addressed by applying the Bonferroni correction (3) [52] as an alpha adjustment method to prevent an alpha accumulation error.
α a d a p t e d = α # t e s t s
The samples for the tests on Hypotheses I and II were randomly permutated (as random sampling) to address the problem of biased subsampling caused by unequal sample sizes (as the Mann–Whitney U test tests on groups of the same sample size). The sample size for each test was set to the minimum sample size of each pairing. Hypothesis III was tested on the RF of both microorganisms using the Mann–Whitney U test.
The following hypothesis was put forward to test the possible physicochemical differences between BTW, 10, 60, and 90 min PTW:
Hypotheses IV.
The physicochemical differences in PTW are not dependent on the treatment time.
This hypothesis was tested using unpaired Wilcoxon sign-ranked tests using RStudio (v. 4.5.1) to compare the means of pH, conductivity, ORP, and nitrite, nitrate, and hydrogen peroxide concentration. The pairing was determined using the prior treatment level, including: BTW (representing 0 min treatment) and 10 min PTW, 10 min PTW and 60 min PTW, and 60 min PTW and 90 min PTW. The significance level was set at α = 0.05 for determination of differences between PTW pre-treatment times.

3. Results

3.1. Chemical Differences of PTW Between Pre-Treatment Times

All chemical analyses for each pre-treatment time of PTW (10, 60, and 90 min) showed physicochemical differences from the BTW that it was made from. Compared to the original BTW, all PTW exhibited a decrease in pH (>5.5) and increase in conductivity (>1035 μS/cm), oxidation reduction potential (ORP) (>417 mV), nitrite (>53 mg/mL), nitrate (>468 mg/mL), and hydrogen peroxide (>196 mg/mL) concentration (Table 1). There were also significant differences in the same directions for all chemical analyses between the 10 min PTW and the 60/90 min PTW; however, the 60 min PTW and 90 min PTW did not show any significance from each other except for in nitrate concentration ( p = 0.019 ) and hydrogen peroxide ( p = 7.8 · 10 3 ), with 90 min PTW being higher.

3.2. Optimal Pre-Treatment and Post-Treatment Time to Reduce Proliferation Activity of Biofilm Cells
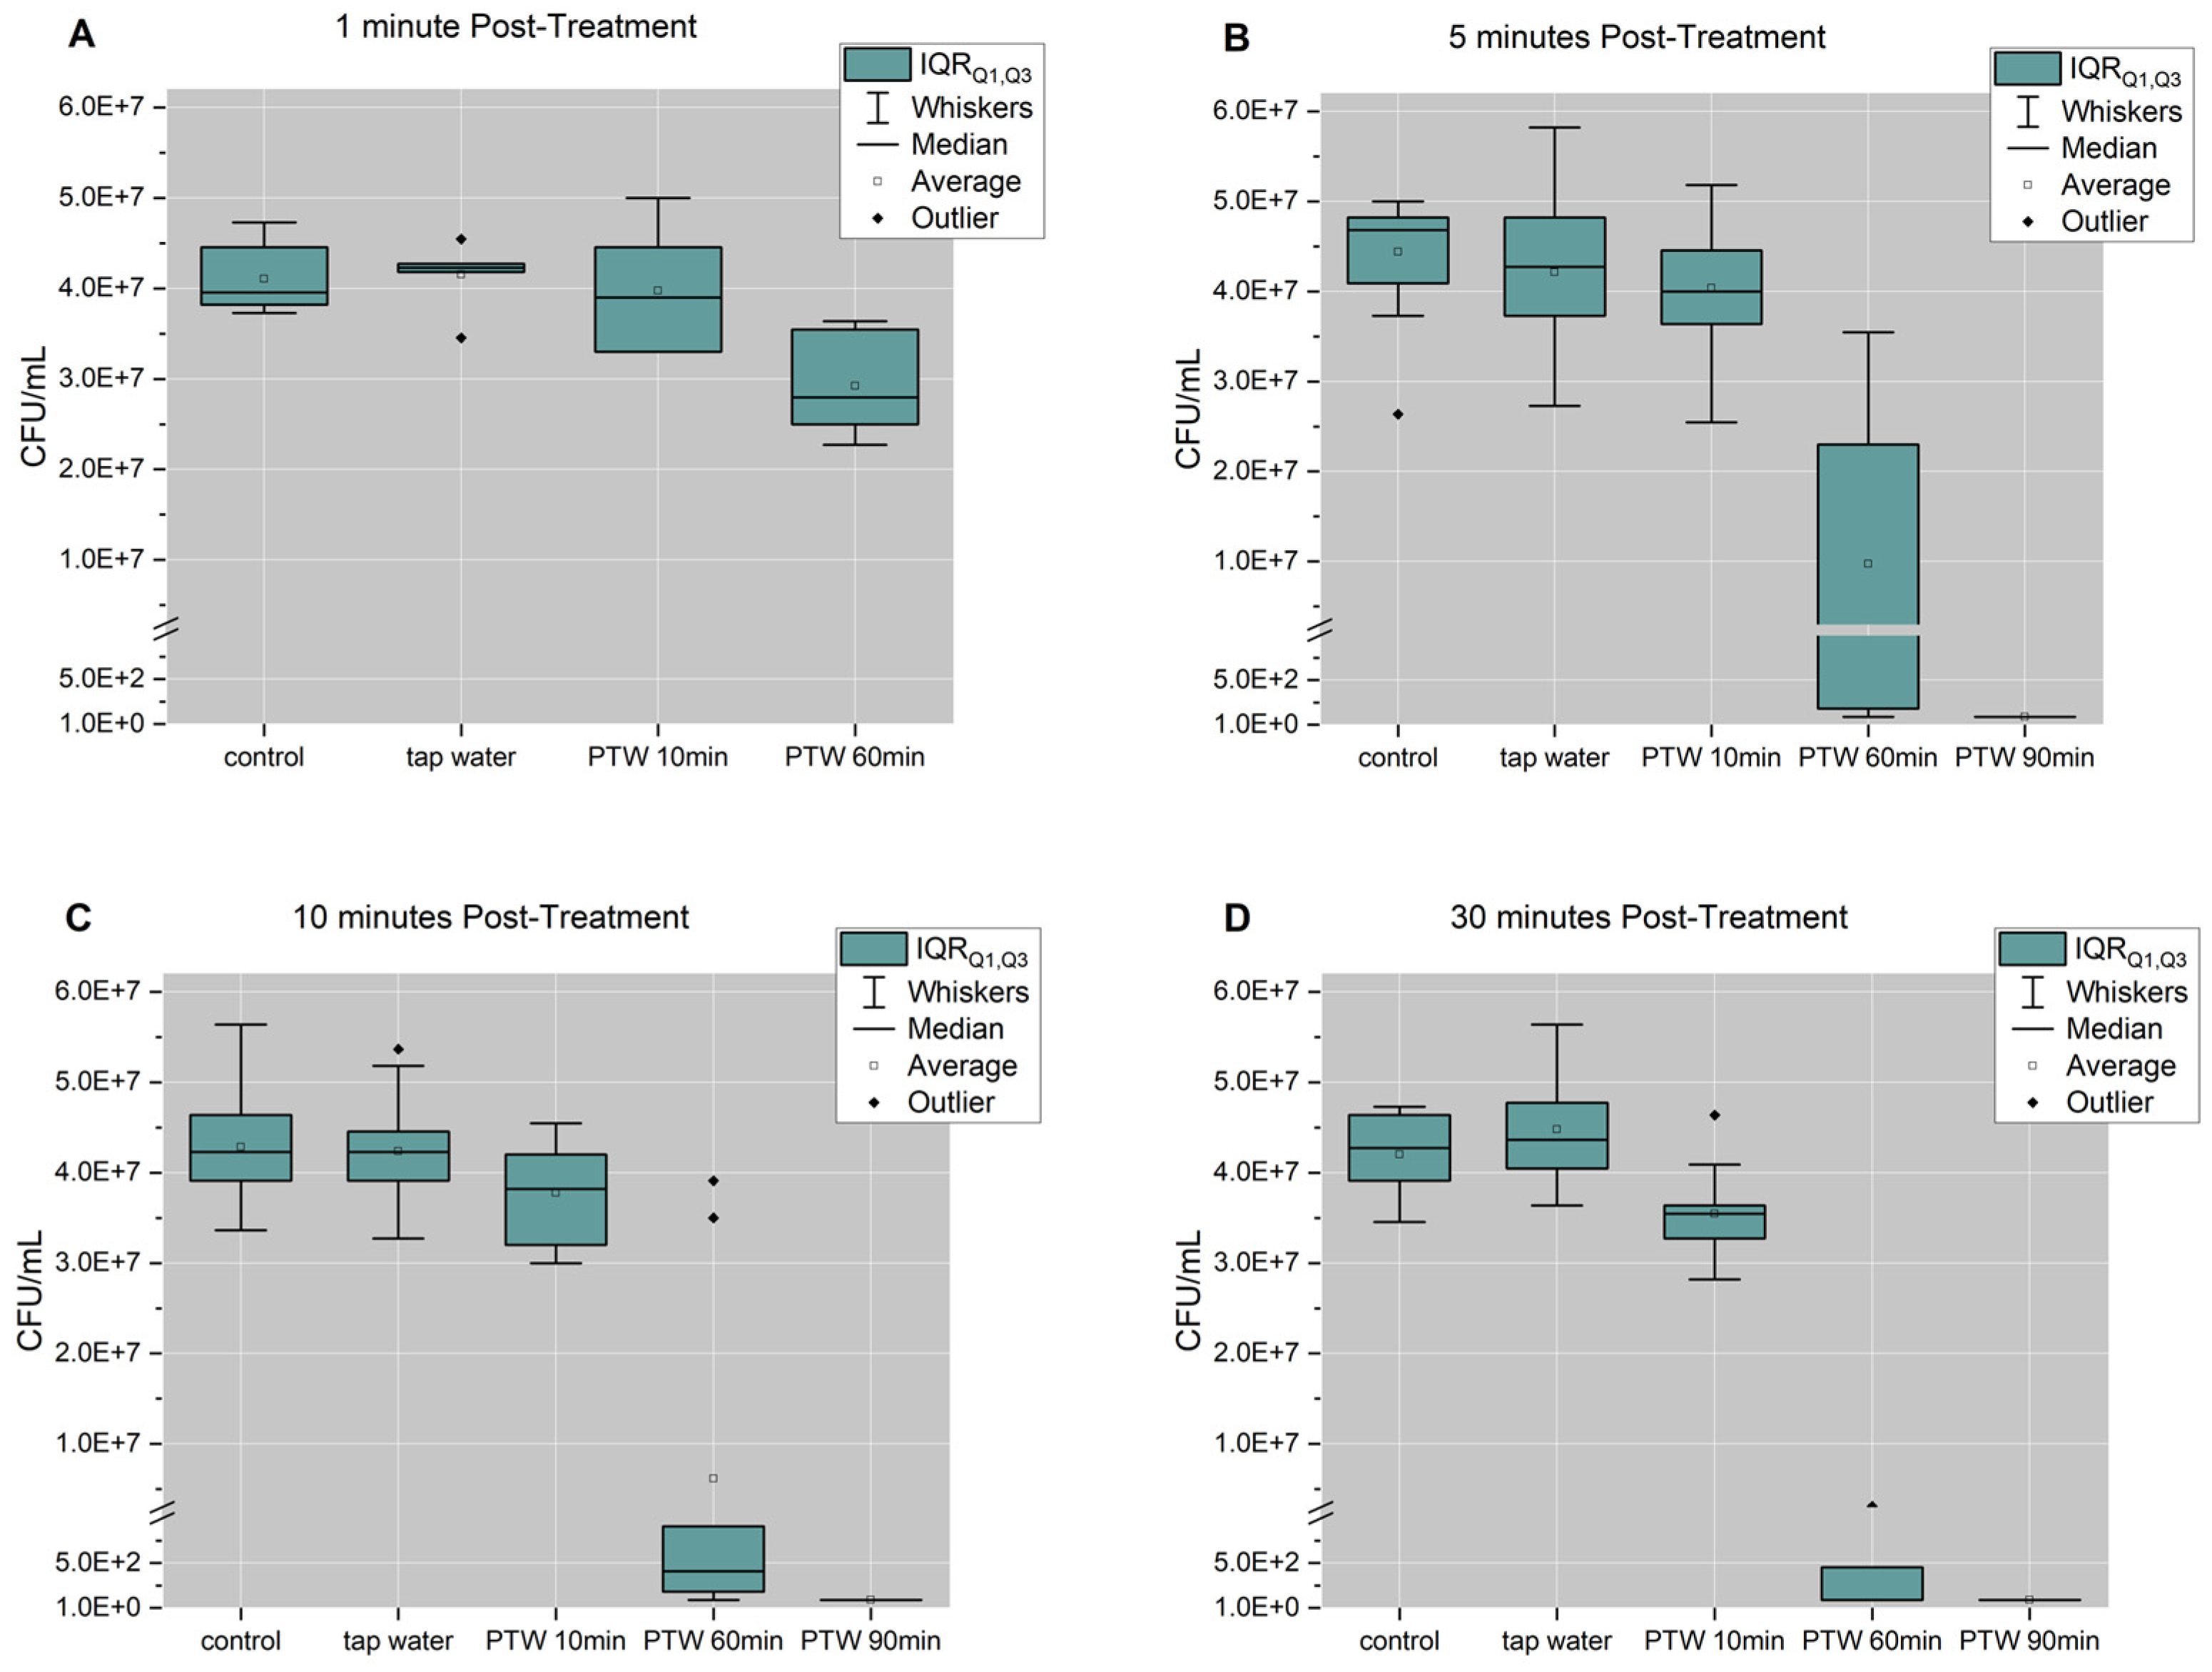
When B. cereus and L. monocytogenes biofilms were exposed to 10 and 60 min pre-treated PTW for 1 min of post-treatment time, both species still exhibited substantial proliferation activity in comparison to the saline (control) and tap water controls and longer post-treatment times. Therefore, experimentation proceeded with post-treatment times of 5, 10, and 30 min. B. cereus did not exhibit significance between tap water and saline treatments (Table 2); thus, the average cell proliferation for the controls was approximately 4.33∙107, 4.26∙107, and 4.34∙107 for 5, 10, and 30 min post-treatment, respectively (Figure 2). B. cereus biofilm cells treated with 10 min PTW showed no significant reduction in proliferation activity after 5 min ( p = 0.02829 ) and 10 min ( p = 0.02541 ) of post-treatment, and only slight reduction in proliferation after 30 min ( p = 0.00695 ) of post-treatment. Alternatively, B. cereus biofilms treated with 60 and 90 min PTW showed significant reduction after 5, 10, and 30 min of post-treatment time, with the greatest reduction for 60 min PTW after 30 min ( p = 4.11353 · 10 5 ) and for 90 min PTW after 10 min and 30 min ( p = 4.11353 · 10 5 ).
Figure 2. Box plots of the B. cereus proliferation assay for the untreated control, the tap water, and PTW applications for different waiting times after treatment: 1 min post-treatment (A), 5 min post-treatment (B), 10 min post-treatment (C), 30 min post-treatment (D).
Applmicrobiol 05 00080 g002
Table 2. Results of the statistical testing for the proliferation assay pairings of B. cereus; significant differences highlighted in bold.
ScenarioPairingResulting
p-Value
αadaptedTested Sample Size
1 min post-treatmentControl—tap water0.668830.0167n = 6
1 min post-treatmentControl—PTW 10 min0.629870.0167n = 6
1 min post-treatmentControl—PTW 60 min0.002160.0167n = 6
5 min post-treatmentControl—tap water0.325800.0125n = 18
5 min post-treatmentControl—PTW 10 min0.028290.0125n = 15
5 min post-treatmentControl—PTW 60 min1.28935∙10−80.0125n = 15
5 min post-treatmentControl—PTW 90 min5.82751∙10−40.0125n = 7
10 min post-treatmentControl—tap water0.832740.0125n = 18
10 min post-treatmentControl—PTW 10 min0.025410.0125n = 15
10 min post-treatmentControl—PTW 60 min9.61483∙10−60.0125n = 12
10 min post-treatmentControl—PTW 90 min4.11353∙10−50.0125n = 9
30 min post-treatmentControl—tap water0.436110.0125n = 12
30 min post-treatmentControl—PTW 10 min0.006950.0125n = 9
30 min post-treatmentControl—PTW 60 min4.11353∙10−50.0125n = 9
30 min post-treatmentControl—PTW 90 min4.11353∙10−50.0125n = 9
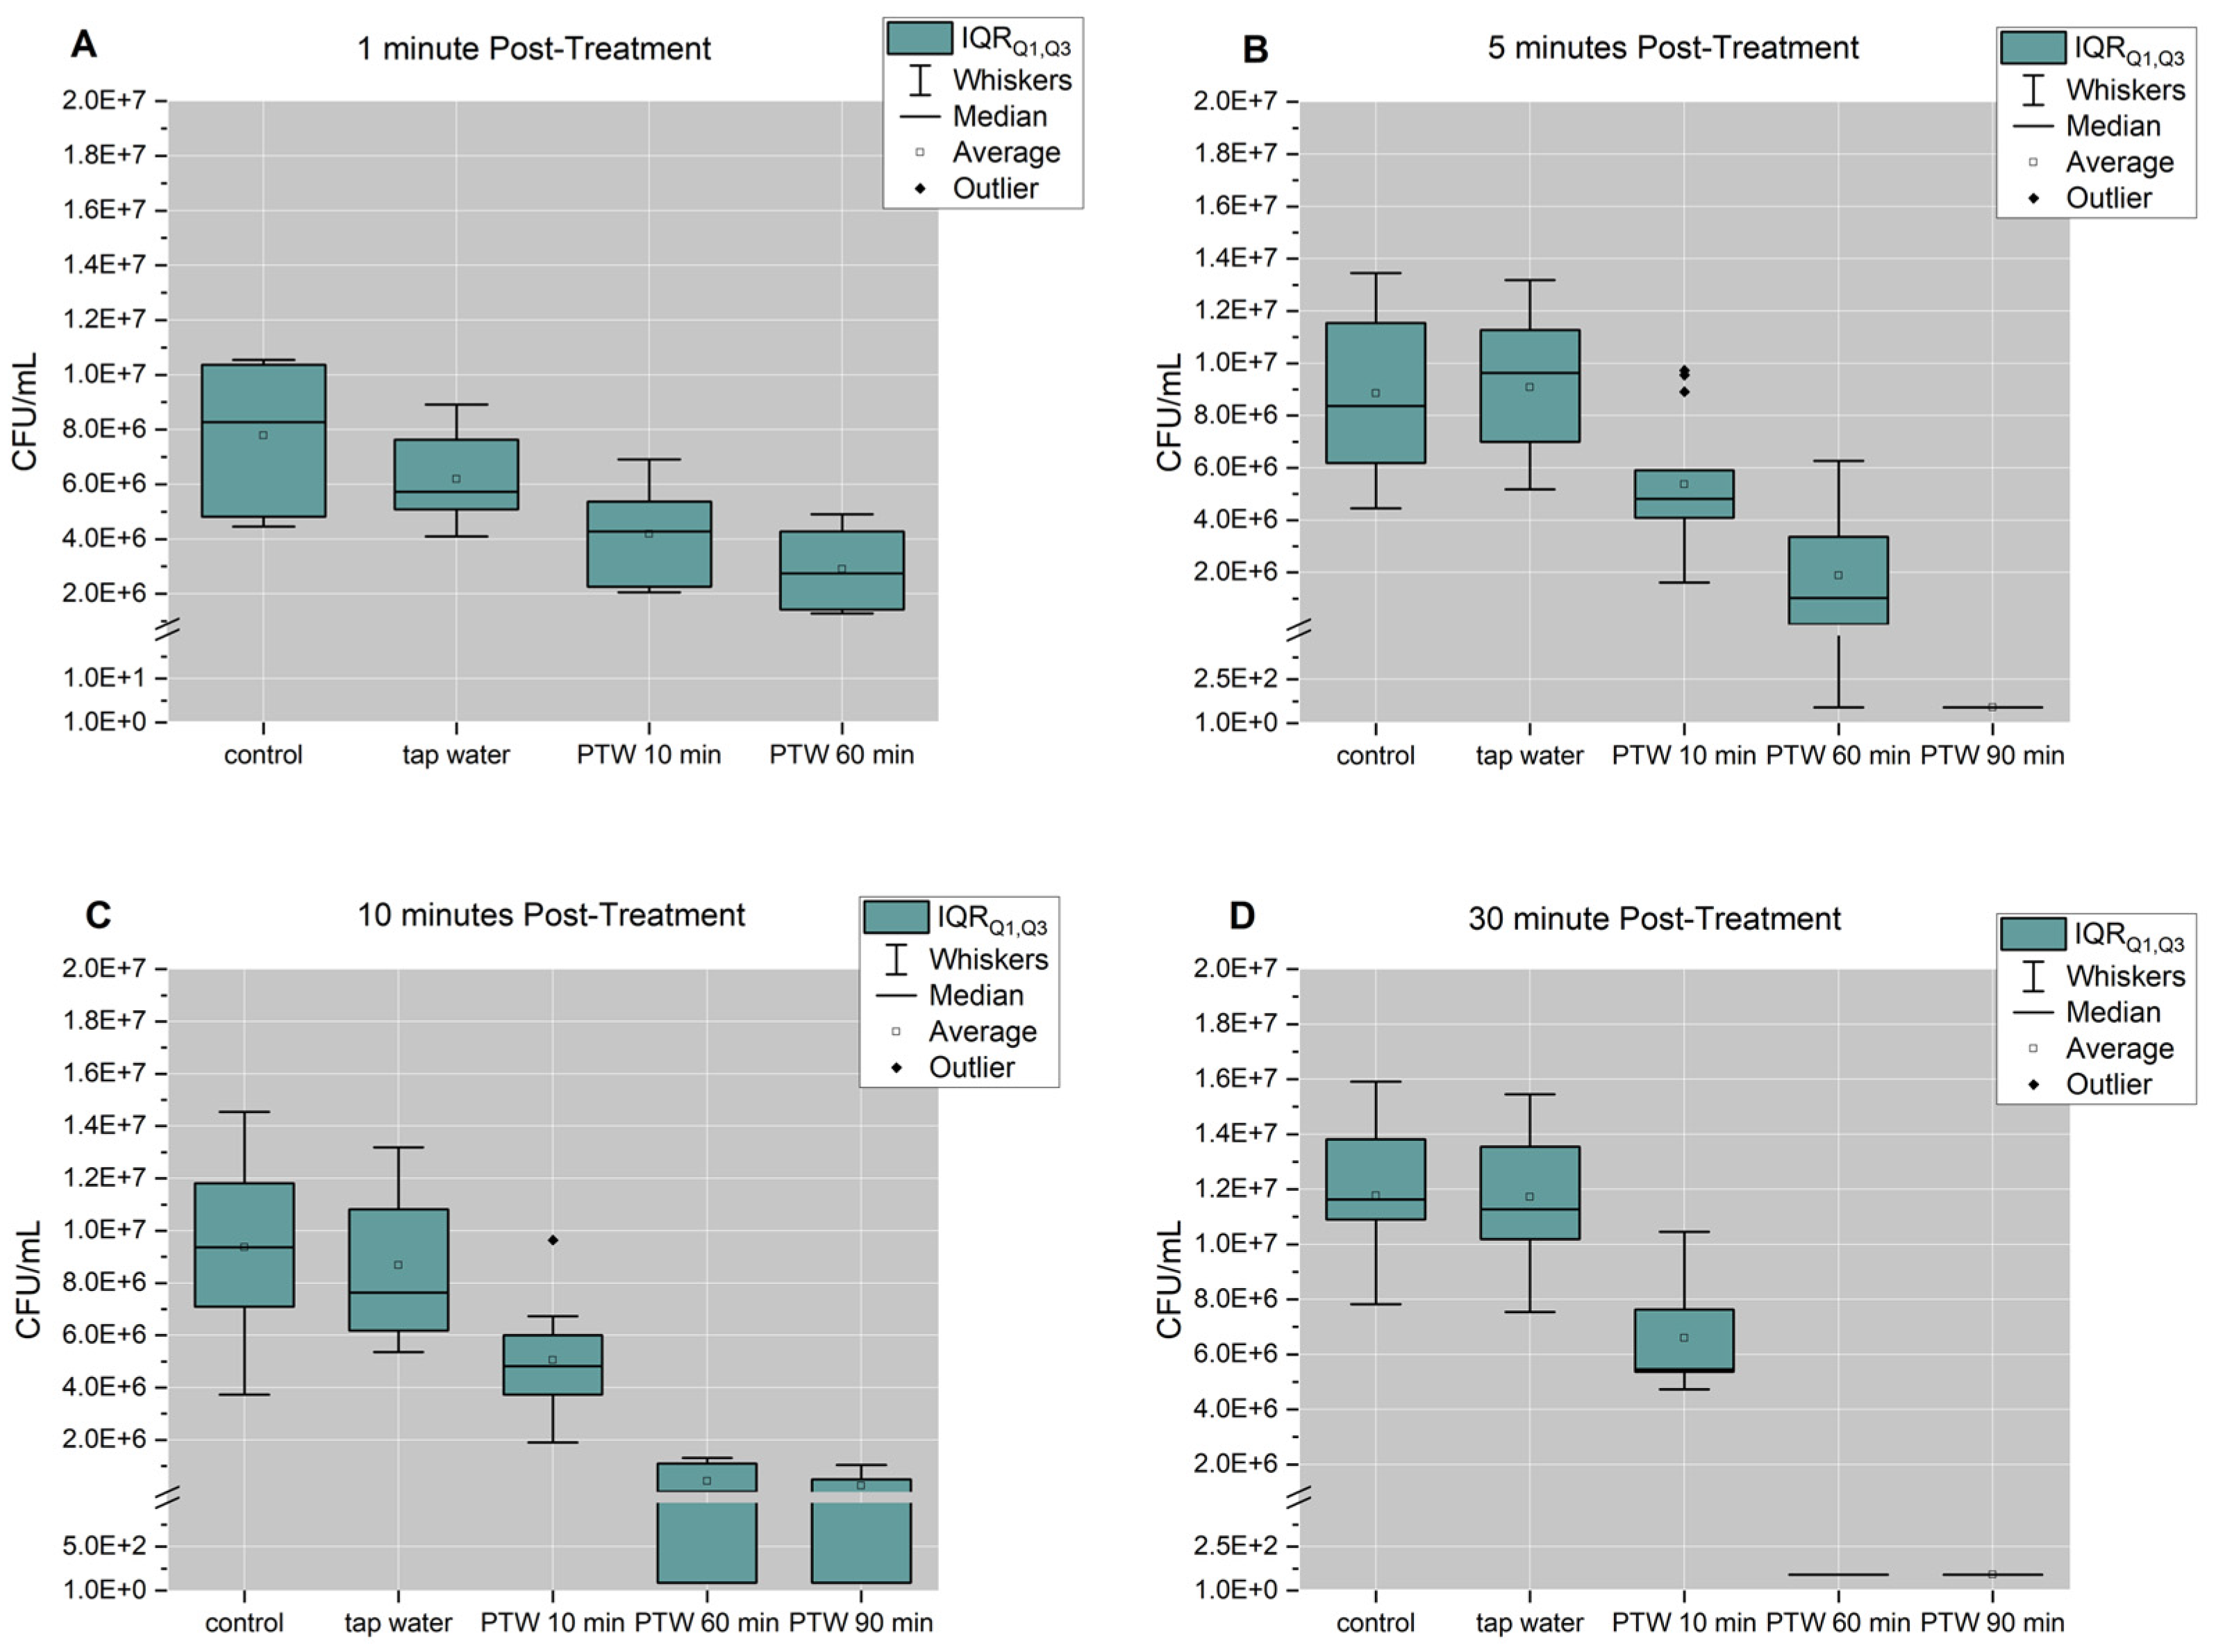
The saline and tap water controls for L. monocytogenes did not exhibit significant differences in proliferation, and the average cell proliferation for the controls was approximately 8.82∙106, 9.02∙106, and 1.17∙107 for 5, 10, and 30 min post-treatment, respectively (Figure 3). L. monocytogenes biofilms had significant reduction after 5 min post-treatment with 10 min, 60 min, and 90 min PTW (Table 3). L. monocytogenes biofilms had the greatest reduction in proliferation primarily with 60 min PTW after 10 min post-treatment ( p = 1.28935 · 10 8 ), and 90 min PTW had the same significant reduction after 5, 10, and 30 min post-treatment ( p = 7.39602 · 10 7 ). There were significant differences in the effect of 10 min PTW on proliferation between B. cereus and L. monocytogenes at all post-treatment times (Table 4). Significance between these species was also found with the effect of 90 min PTW on proliferation after 10 min ( p = 0.00040 ) and 30 min ( p = 0.00037 ) post-treatment. This reduction in proliferation can be explained by different mechanisms. One mechanism could be reduced metabolism (see Section 3.4) due to bacteria dormancy from VBNC state (non-sporulating microorganisms) or the formation of spores (sporulating microorganisms) that have not yet been triggered to return to a vegetative state (germination). Another reason is that cell membrane destruction (see Section 3.3) may lead to cell death.
Table 4 shows the results of the performed statistical tests on the differences between the achieved log reductions of biofilms formed by sporulating and non-sporulating microorganisms for the different tested agents. These results show that the application of 10 and 60 min treated PTW in the 1 min post-treatment scenario have a significant difference (refer to Table 4) on the reduction in biofilms of B. cereus and L. monocytogenes. The 10 min treated PTW also has significant difference for the 5, 10, and 30 min post-treatment. The only other agent that obtained significant impact is 90 min treated PTW for 10 and 30 min post-treatment. It can therefore be concluded that the 10 min treated PTW is the agent most affected by the sporulating property. The 90 min PTW treatment also shows differences, especially for the two longer post-treatment times (10 and 30 min). Further independent trials are needed to determine the specific effects of these two agents.

3.3. 60 min and 90 min PTW Lead to a Reduction in Vitality of Biofilm Cells

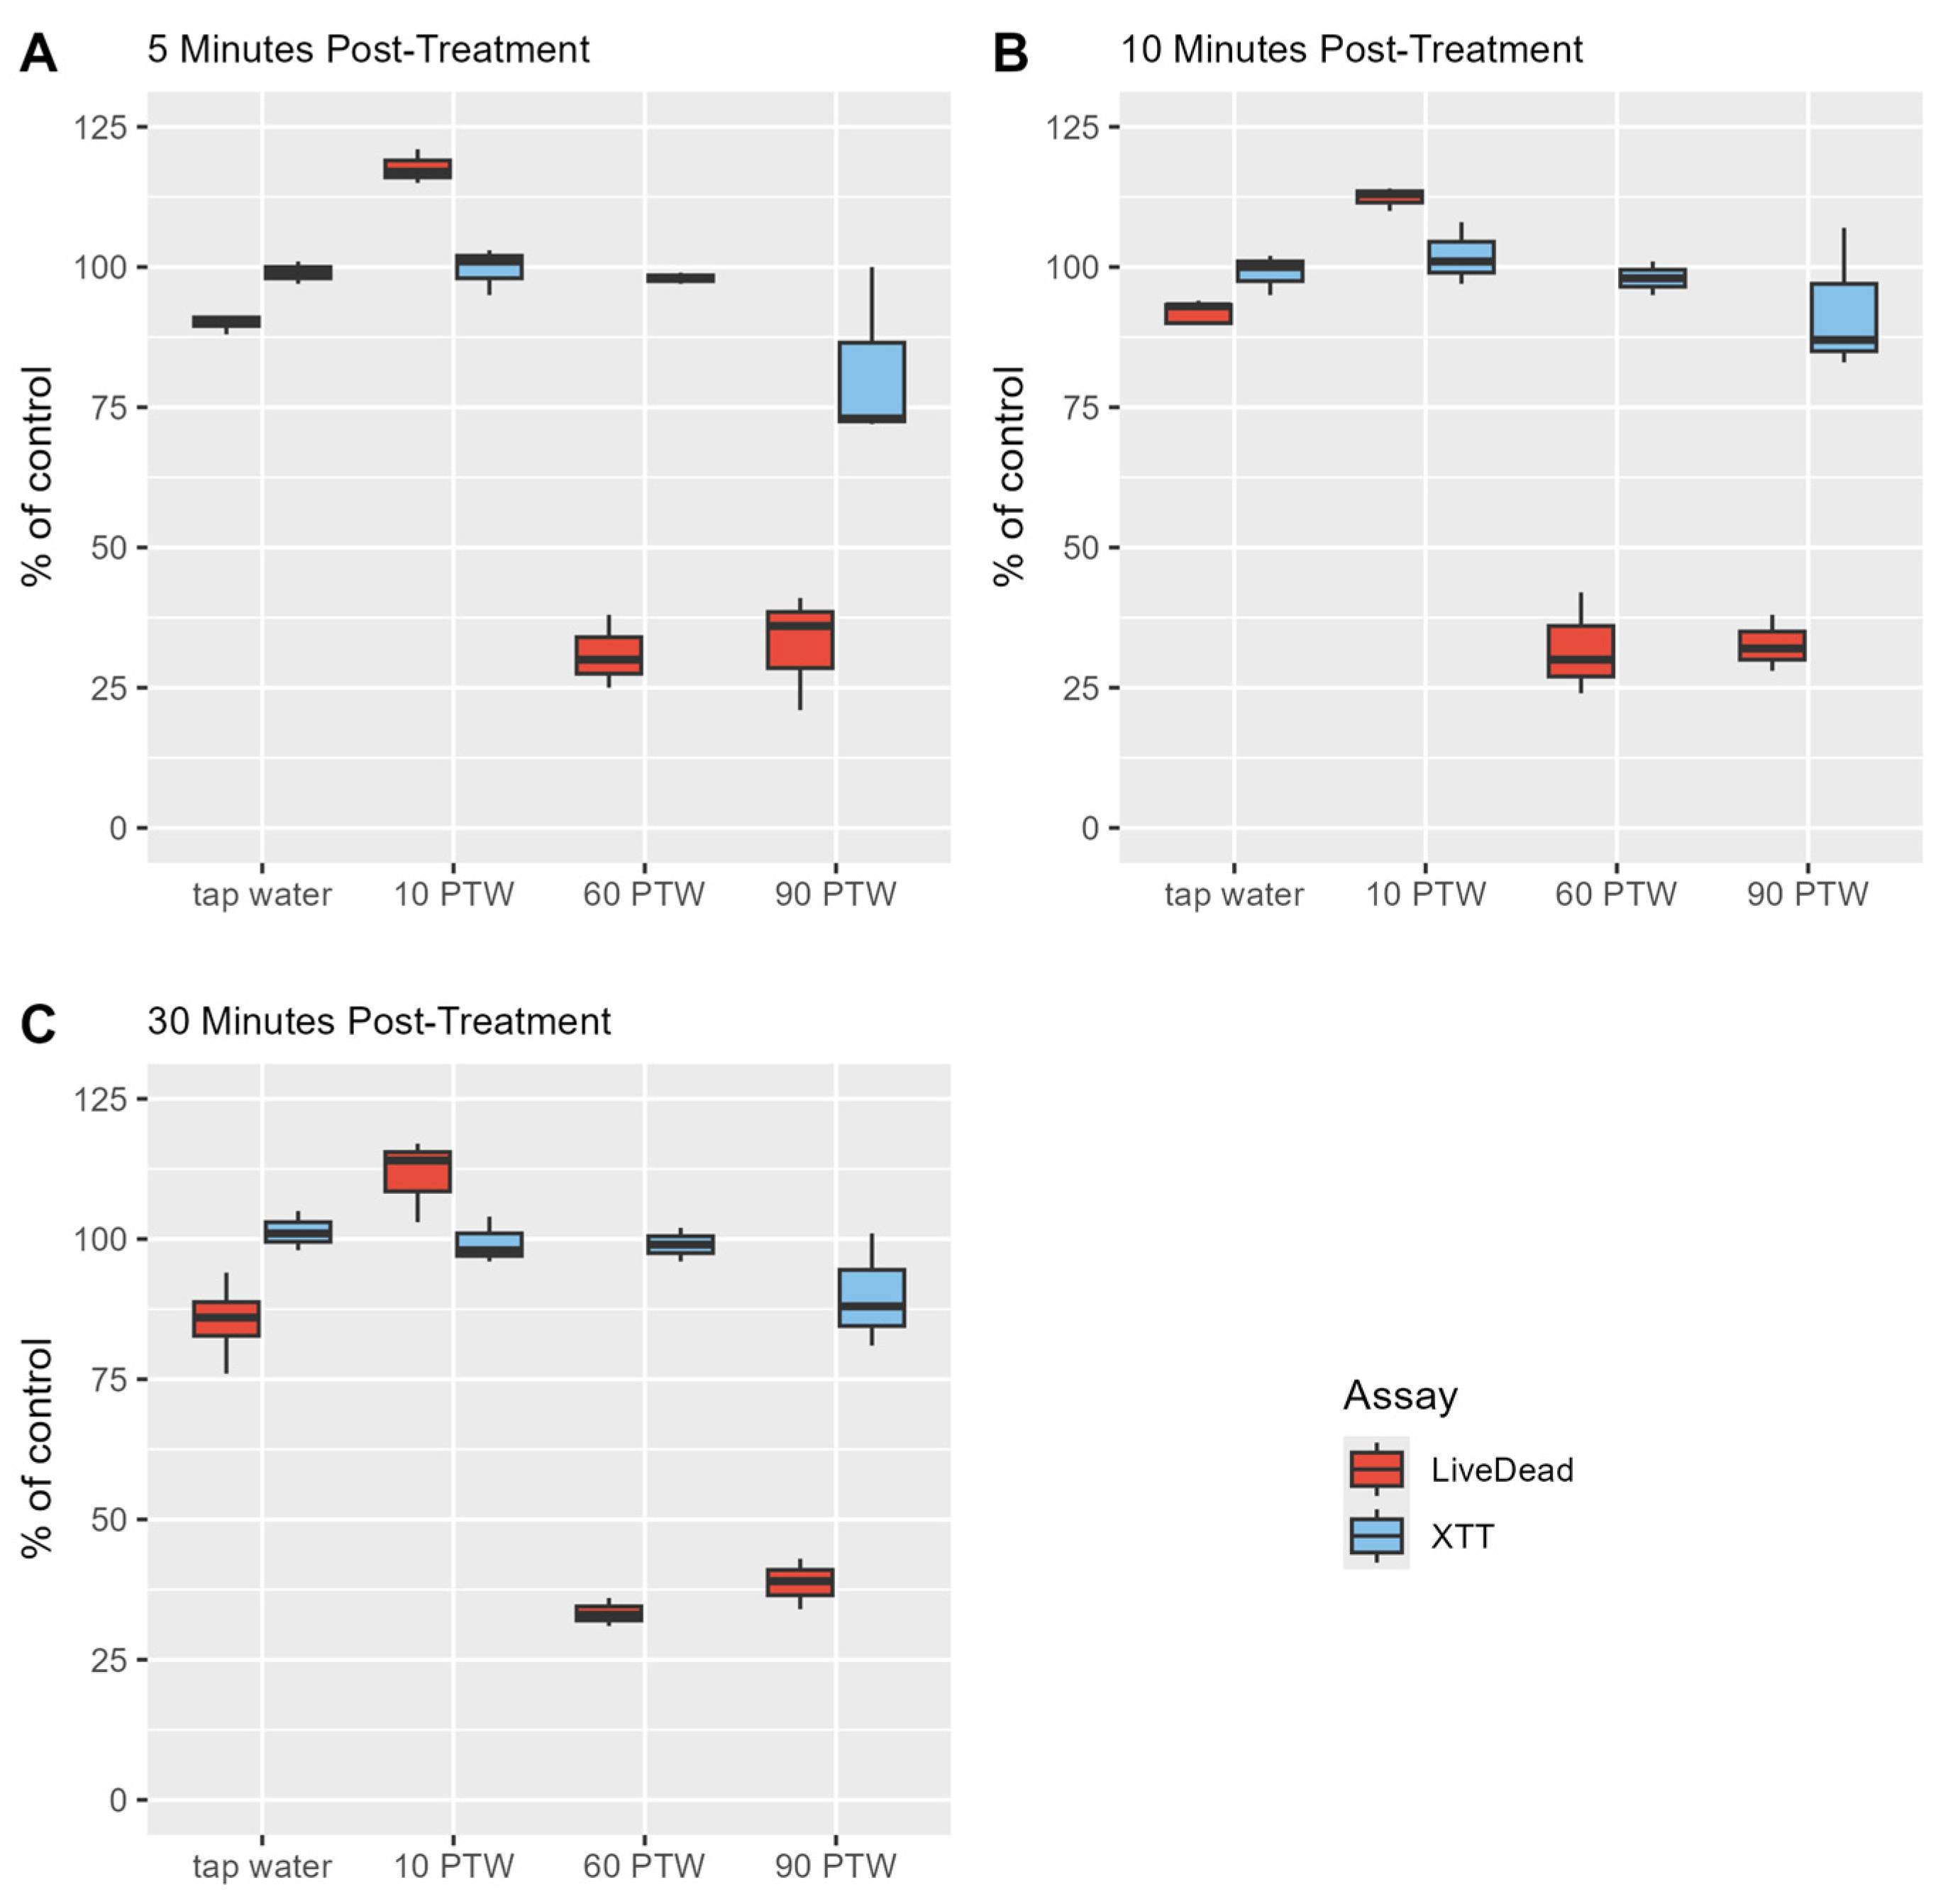
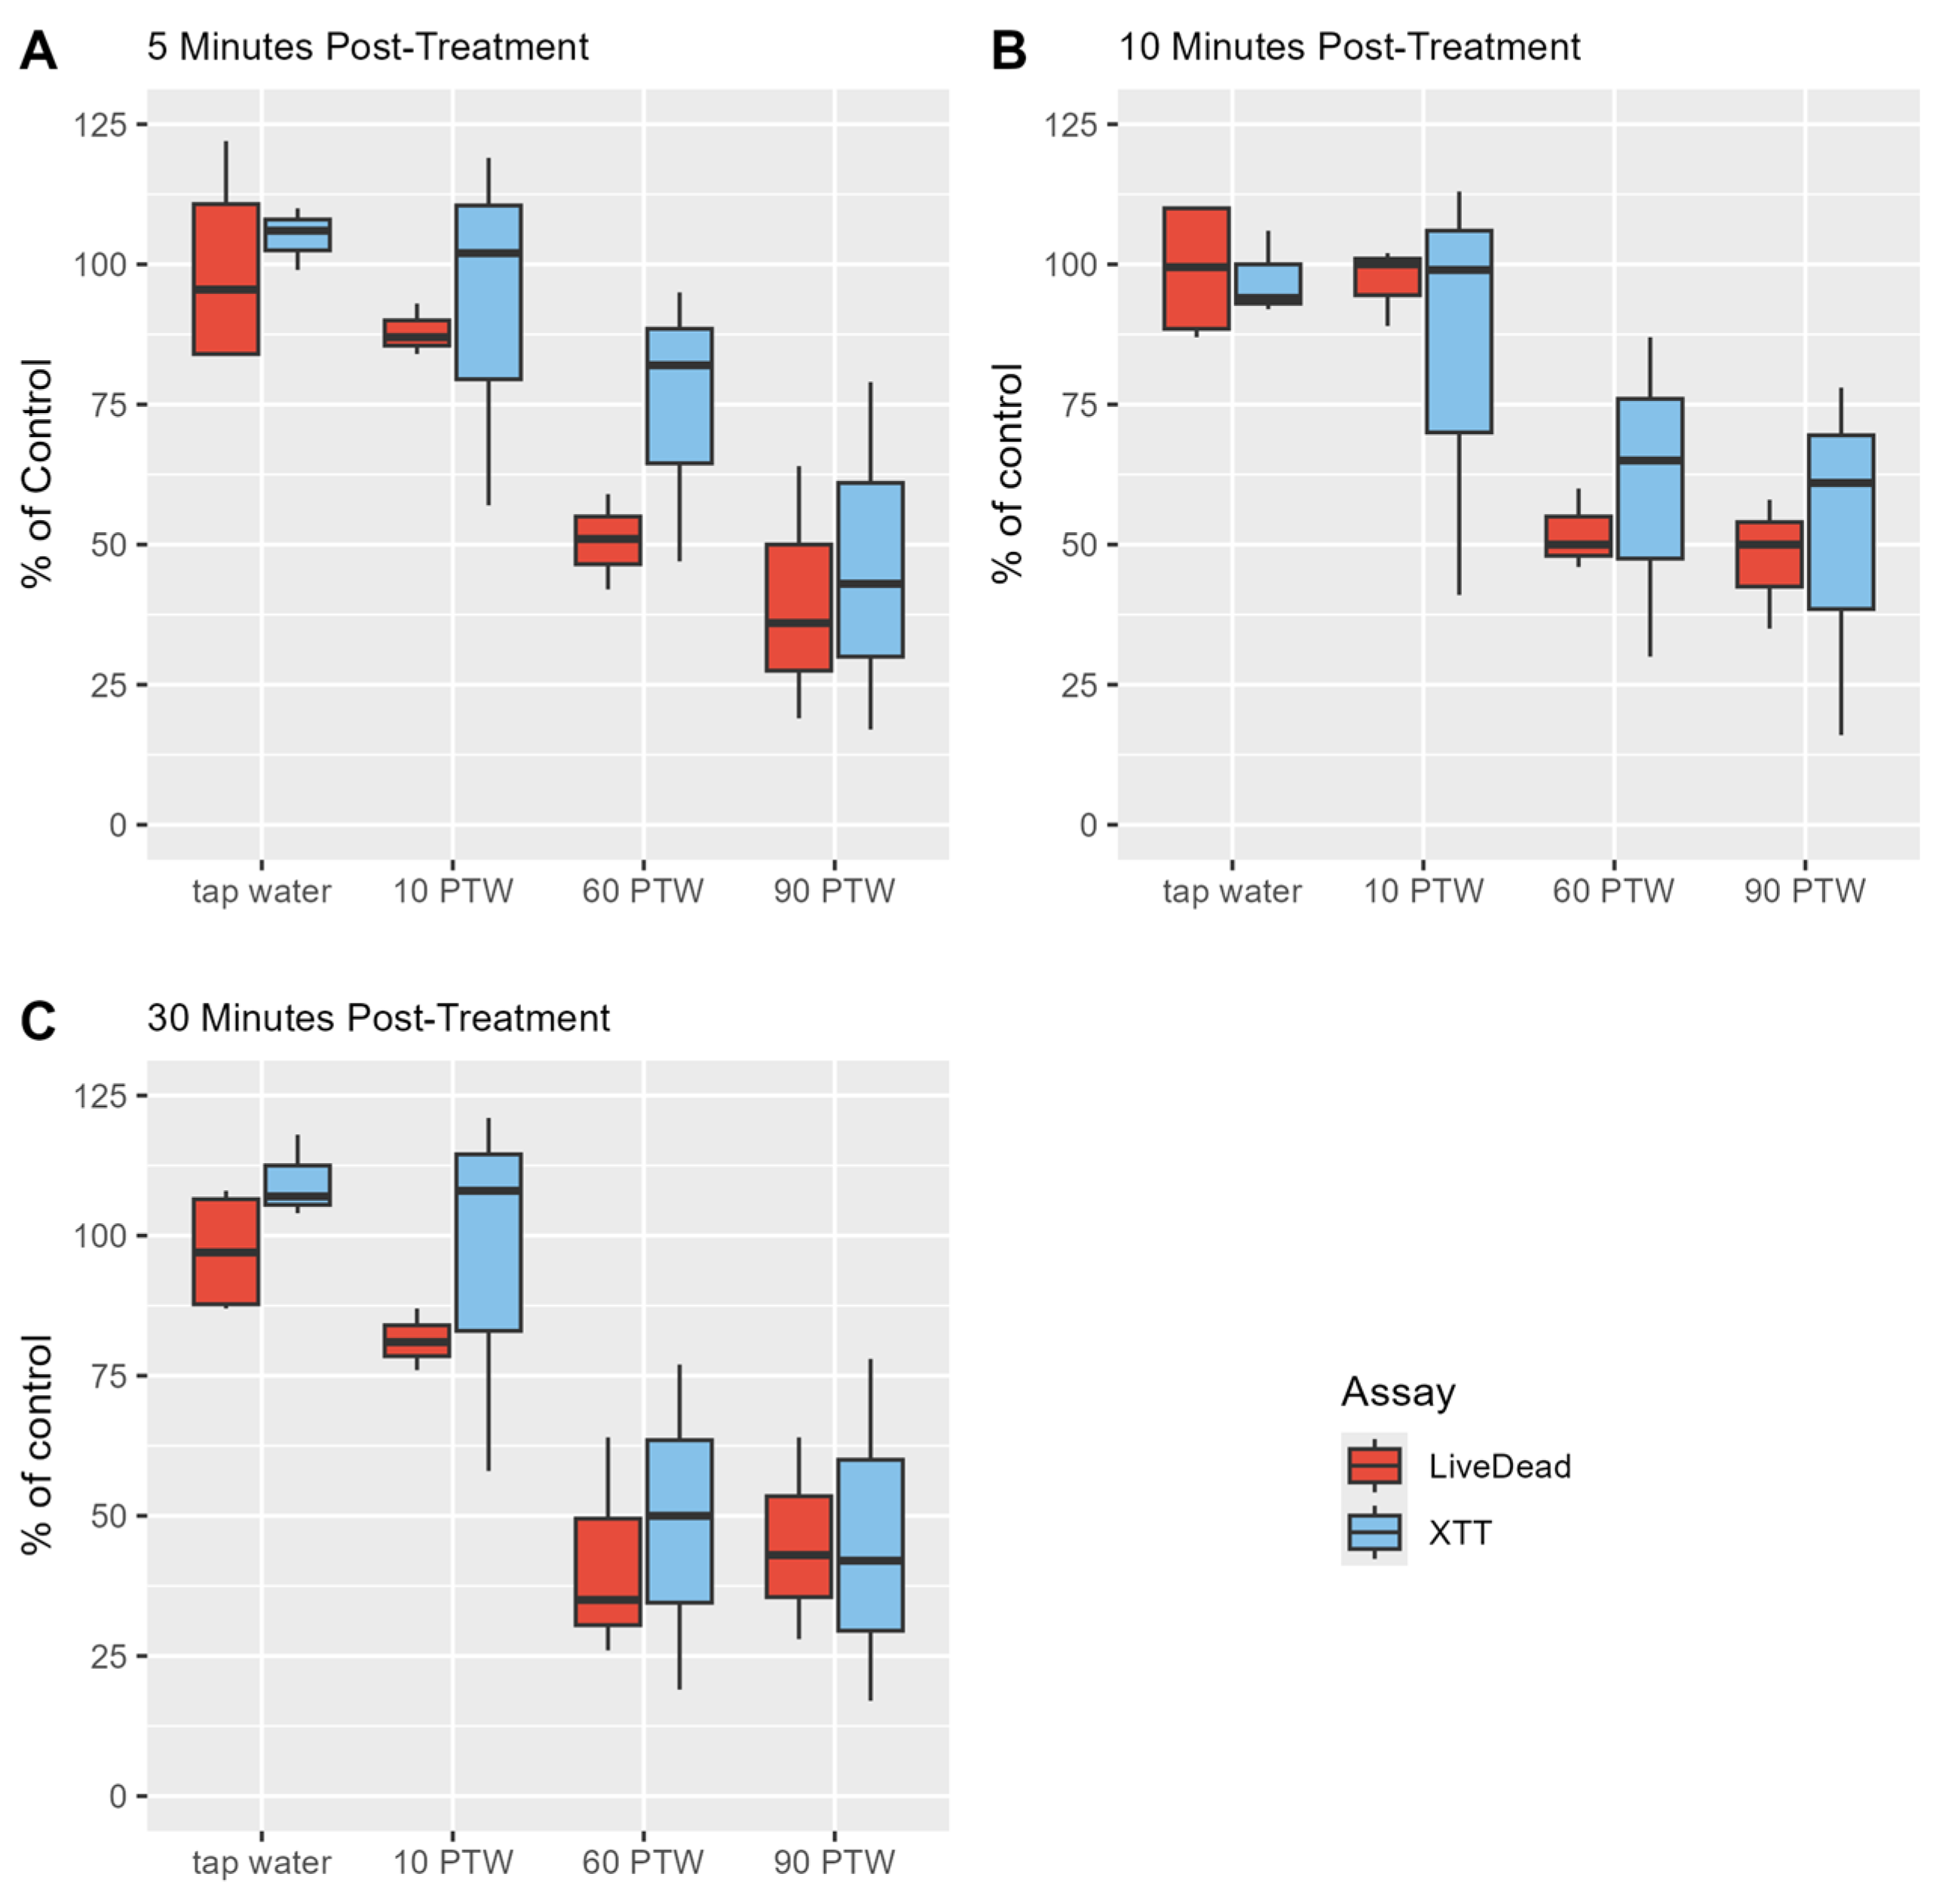
The LIVE/DEAD assay revealed that both B. cereus and L. monocytogenes biofilm cells had substantial membrane damage when treated with 60 min and 90 min PTW and, therefore, the cells had decreased vitality. Data showed that tap water and 10 min PTW did not reduce the cells’ vitality and, in some cases, the G/R ratios were slightly higher in these conditions than the saline control within expected variation margins. B. cereus biofilms treated with 60 min PTW at all post-treatment times exhibited 32% ± 1% vital cells; 90 min PTW had similar effects at all times, having 33–39% vital cells compared to the saline control cells (Figure 4). L. monocytogenes showed slightly higher vitality, with 60 min PTW treatment having 43/44% vitality after 5/10 min and 36% after 30 min; similarly, after 90 min PTW treatment, it exhibited 48% vitality after 5 min and 39/41% after 10 min/30 min (Figure 5).

3.4. PTW Treatment Had Mild Effects on the Metabolic Activity of B. cereus Biofilm Cells and Moderate Effects on L. monocytogenes

Results from the XTT assay performed on B. cereus biofilm cells showed that there was not a notable reduction in metabolic activity when treated with 10, 60, and 90 min PTW for 5, 10, and 30 min (Figure 4). L. monocytogenes biofilm cells, however, did show some reduction in metabolic activity when treated with 60 and 90 min PTW. Specifically, 60 min PTW reduced metabolism in L. monocytogenes to 41% after 30 min post-treatment, while 90 min PTW had a similar reduction of 41% ± 3% in metabolism after 5, 10, and 30 min (Figure 5). Tap water and 10 min PTW treatment did not have any substantial changes on metabolic activity likewise to these conditions’ effects on vitality of the biofilm cells.

4. Discussion

Physicochemical properties in PTW essential for antimicrobial applications form after longer periods (60 and 90 min) of plasma treatment. Plasma treatment causes changes first in the compressed air that the plasma directly interacts with, forming plasma-processed air (PPA), and then the PPA interacts with the water, causing changes in its chemistry. The chemical changes from compressed air to PPA are reported by Schnabel et al. (2015) [19]. Results showed that only 2.6% of the compressed air is processed by the plasma, with PPA being mainly composed of RNS like N O 2 and N O , whereas the ROS O 3 could not be detected [19]. As these reactive species in the PPA contact the water, they undergo chemical reactions that produce RONS within the water, thereby forming PTW [53].
The primary antimicrobial components analyzed within MidiPLexc-produced PTW are the RNS nitrite ( N O 2 ) and nitrate N O 3 [23]. Other physical properties such as pH, conductivity, and ORP indicate conditions that these species may exist in highly reactive states within the PTW. The pH of PTW decreases significantly during early stages of pre-treatment time before reaching a steady state of low pH. At low pH values (pH < 3.5), ROS and RNS become unstable, undergoing reactions between one another [54]. Namely, the concentration of N O 2 present in the PTW degrades and protonates into nitric oxide, nitrogen dioxide, and H 2 O 2 in low pH conditions, which are highly toxic to cells [55,56]. Higher ORP values in longer-treated PTW point to higher frequency of oxidizing interactions taking place between N O 2 and H 2 O 2 , leading to increased concentration of N O 3 within the PTW, confirmed with measurements of increased nitrate concentrations in 60 and 90 min PTW. Due to the high instability of nitrite, nitrate, and hydrogen peroxide dependent on temperature and pH, replicates of PTW used for IC, voltammetry, and microbiology showed some expected variance due to external factors during necessary handling within these experiments.
Pre-treatment times of PTW give insight into the threshold of chemical changes needed to effectively achieve antimicrobial effects. The 10 min PTW has pre-antimicrobial properties that are not strong enough to substantially reduce viable L. monocytogenes and B. cereus biofilm cells, regardless of the post-treatment time. Alternatively, 60 and 90 min PTW both were highly effective at mitigating proliferating bacterial cells after only 5 min of post-treatment application. Proliferation was most consistently eliminated using 90 min pre-treated PTW at all post-treatment times. These results suggest that chemical composition from pre-treatment length is more critical in effecting proliferation than the length of post-treatment application; therefore, the chemical interactions leading to reduction in proliferation likely begin to work rapidly after initial contact.
Live/dead assays revealed that membrane damage in L. monocytogenes biofilm cells is dependent on post-treatment time and the most damage is prevalent after 30 min of 60 and 90 min PTW application. B. cereus biofilm cells indicated that membrane damage was highly independent of post-treatment time being overall consistent across all post-treatments with 60 and 90 min PTW. Differences observed between the two gram-positive bacteria uncover that L. monocytogenes cell membranes appear to be less damaged during PTW application than B. cereus in relation to their control conditions. Speculation of this result points to size differences in the bacteria, chemical interactions between samples and dye, and spore formation in B. cereus to explain the observed discrepancies. B. cereus is larger (3–5 μm in length and 1 μm in width) [57] than L. monocytogenes (0.5–2 μm in length and 0.5 μm in width) [58]; therefore, more PI dye would be able to infiltrate the cell and bind to DNA in B. cereus due to the higher surface area of membrane damage. The lower pH in PTW in comparison to the saline solution made the dye mix appear notably lighter/yellow after the 15 min incubation period; the larger size of B. cereus formed better bacteria pellets, allowing for more supernatant to be removed from the samples reducing this pH interaction.
Metabolic effects of PTW on biofilm cells seem to have an opposite trend between species with L. monocytogenes having a higher reduction in metabolism than B. cereus. Similarly to other experiments, post-treatment time had less importance than pre-treatment time on the metabolic reduction in B. cereus but both post- and pre-treatment times had an influence in L. monocytogenes. Throughout all post-treatment times for B. cereus, there was no reduction in metabolic activity after treatment with 10 min PTW and an 18–29% decrease after treatment with 60 and 90 min PTW. Alternatively, L. monocytogenes exhibited metabolic reductions after treatment with 10 min PTW (4–16%), 60 min PTW (41–59%), and 90 min PTW (58–62%). Spore formation in B. cereus is theorized to be the driving cause to explain why the metabolic activity is maintained more than L. monocytogenes.
Endospore formation, exemplified in Bacillus and Clostridia species, is a survival mechanism to respond to stressful environmental conditions [59]. These endospores form by the mother cell replicating its DNA and dividing asymmetrically to create a forespore that contains and protects the genetic material [60]. The endospores germinate back into vegetative cells with active metabolism when the environmental conditions favor bacteria growth such as diffusion of water through cell walls or ideal growing temperatures [28]. During the XTT assay, treated biofilm cells are incubated at 30 °C for 24 h, which may allow enough time under optimal temperature conditions for B. cereus endospores to return to a metabolically active state. While B. cereus originally displays more membrane damage immediately after treatment in comparison to L. monocytogenes, endospore formation possibly allows B. cereus to remain metabolically viable after time by protecting its genetic material, while L. monocytogenes cells greatly lose their viability with treatment. Based on the results of B. cereus returning to a metabolically viable state, it appears that a singular treatment with PTW only offers disinfection effects, characterized by the elimination of vegetative pathogens with the exception of bacterial endospores, rather than complete sterilization [61]. Further characterization of B. cereus cells recovered after PTW treatment, such as endospore staining with Malachite Green and microscopy, could reveal if this is the mechanism that explains the return of metabolic activity measured with the XTT assay.
L. monocytogenes possibly converts to a viable but nonculturable (VBNC) state after PTW treatment. VBNC bacteria have a state of reduced metabolic activity and are unable to be cultured in nutrient media that would normally support growth [62]. VBNC cells have been reported to have the potential to be resuscitated into a culturable state again; even a simple reversal of stress-inducing conditions can resuscitate the dormant bacteria [63,64]. Based on similar analyses performed by Weihe et al. (2023), it is reasonable to assume that these cells are entering a VBNC state [65]. Future experiments focusing on characterizing alterations in the cellular morphology—such as using atomic force microscopy, TEM, or Raman spectra—can further reveal the mechanism of PTW treatment on bacteria. Both spore-forming and non-spore-forming VBNC bacteria have efficient strategies to handle stress caused by PTW; however, reaction time leading to resilience of both strategies needs more research to understand the mechanisms of action and included pathways. Revealing the mechanism behind this phenomenon is critical to mitigating foodborne illness caused by these pathogens with the ability to persist due to biofilm formation and the strategies to become active even after stress from PTW.
Resuscitation of PTW-treated bacterial cells has been recently studied in the gram-negative Salmonella Typhimurium after repeated lethal PTW treatments [66]. This study showed that sequential PTW treatments lead to the emergence of bacterial resistant variants with mutations affecting proteins related to oxidative stress response, cell envelopes, or transcription factors as well as leading to cross-tolerance to other disinfectant treatments [66]. Repetitive PTW treatment on gram-positive bacteria biofilms has yet to be researched to uncover the potential for these bacteria to survive multiple treatments or exhibit survival mutation tactics. Further treatment and experimentation on surviving B. cereus and L. monocytogenes biofilm cells after PTW exposure could give more insight into the difference spore formation has on long-term survival and adaptation of these bacteria in food processing environments using this new method of disinfection.
This study focuses on understanding how bacteria with different survival tactics respond to antimicrobial treatment with PTW, introducing novelty to the prior research that focused primarily on the effects of this treatment on varying types of cell walls. This knowledge will better inform the required conditions to effectively implement this technology in food safety where different bacterial species present various dangers. Both bacteria analyzed here have efficient strategies to handle the PTW stress. Reaction time (resilience) of both strategies, spore formation and/or VBNC, need more research to understand the mechanisms of action and included pathways. Especially, if human pathogens associated to foodborne illness with the ability of persistent biofilm formation are included.

5. Conclusions

Previous studies of PTW treatment on biofilms primarily explored the difference in effect between gram-negative vs. gram-positive bacteria using short pre- and post- treatment times to decrease vitality of these cells. This novel study analyzes the differences in PTW effectiveness on sporulating vs. non-sporulating gram-positive bacteria in an effort to uncover what treatment conditions can effectively sanitize against biofilms causing foodborne illness. Plasma-treated water that underwent longer pre-treatment times of 60 and 90 min proved to be effective in reducing proliferation and cell viability in both gram-positive species, particularly after 30 min of post-treatment. This suggests that, when proper conditions for treatment are met, disinfection using PTW is feasible against bacteria employing different survival tactics for application in food safety. The possible spore formation in response to PTW stress of the sporulating B. cereus species indicates that the tested treatment conditions were insufficient to be considered as a sanitizer, as the cells return to a metabolically active state over time. Based on our findings, food processing strategies need to be adapted to target the pathogens that commonly cause foodborne illness in specific food products or processing environments. This is because bacteria that have similar traits, such as the ability to form biofilms, may also have different survival tactics that cause them to react differently to decontamination treatments.
Additionally, these results inform that more independent testing methods, other than the typical proliferation assays, are needed to assess the presence of pathogens remaining after disinfection treatment. Some of these tests may include checking for DNA integrity, active metabolism, or endospore formation to ensure that food products are actually sufficiently decontaminated before being released to the public. Further experimentation to optimize PTW pre-treatment and biofilm post-treatment times, sequential PTW treatment, human digestive cytotoxicity evaluations, and food quality analysis after longer treatment is yet to be fully explored to create an effective disinfectant method to be used in food processing.

Author Contributions

Conceptualization, U.S.; methodology, R.W., M.M., T.W., U.S. and S.N.; investigation, S.N., R.W., M.M. and T.W.; writing—original draft preparation, S.N.; writing—review and editing, R.W., M.M., T.W., U.S. and S.N.; visualization, S.N. and R.W.; supervision, U.S.; project administration, U.S.; funding acquisition, U.S. All authors have read and agreed to the published version of the manuscript.

Funding

This research was funded by the Federal Republic of Germany, Federal Ministry of Education and Research under the program “PlaVir”, and funding reference: 03COV05A. Further funding for this work has been provided by the Federal Republic of Germany and the country’s State Mecklenburg-Western Pomerania, Ministry of Science, Culture, Federal and European Affairs under the grant agreement No. VIII-0639-INP00-2023/004-002.

Data Availability Statement

Data will be made available on request.

Conflicts of Interest

The authors declare no conflicts of interest.

References

  1. Food Supply. Our World in Data. Available online: https://ourworldindata.org/food-supply (accessed on 30 October 2024).
  2. Fellows, P.J. Food Processing Technology: Principles and Practice; Woodhead Publishing: Cambridge, UK, 2022. [Google Scholar]
  3. How Food Gets Contaminated: The Food Production Chain. U.S. Centers for Disease Control and Prevention (CDC). 2024. Available online: https://www.cdc.gov/foodborne-outbreaks/foodproductionchain/index.html (accessed on 1 August 2025).
  4. Bryan, F.L. Risks of practices, procedures and processes that lead to outbreaks of foodborne diseases. J. Food Prot. 1988, 51, 663–673. [Google Scholar] [CrossRef] [PubMed]
  5. EFSA Panel on Biological Hazards (BIOHAZ); Koutsoumanis, K.; Allende, A.; Bolton, D.; Bover-Cid, S.; Chemaly, M.; De Cesare, A.; Herman, L.; Hilbert, F.; Lindqvist, R. Persistence of microbiological hazards in food and feed production and processing environments. Efsa J. 2024, 22, e8521. [Google Scholar]
  6. Busta, F. Thermal inactivation characteristics of bacterial spores at ultrahigh temperatures. Appl. Microbiol. 1967, 15, 640–645. [Google Scholar] [CrossRef] [PubMed]
  7. Li, X.; Farid, M. A review on recent development in non-conventional food sterilization technologies. J. Food Eng. 2016, 182, 33–45. [Google Scholar] [CrossRef]
  8. Goluch, Z.; Barbara, K.; Haraf, G.; Wołoszyn, J.; Okruszek, A.; Wereńska, M. Impact of various types of heat processing on the energy and nutritional values of goose breast meat. Poult. Sci. 2021, 100, 101473. [Google Scholar] [CrossRef]
  9. Zhao, X.; Guo, Y.; Zhang, Y.; Pang, X.; Wang, Y.; Lv, J.; Zhang, S. Effects of different heat treatments on Maillard reaction products and volatile substances of camel milk. Front. Nutr. 2023, 10, 1072261. [Google Scholar] [CrossRef]
  10. Shin, S.; Bhowmik, S.R. Thermal kinetics of color changes in pea puree. J. Food Eng. 1995, 24, 77–86. [Google Scholar] [CrossRef]
  11. Imaizumi, T.; Tanaka, F.; Uchino, T. Effects of mild heating treatment on texture degradation and peroxidase inactivation of carrot under pasteurization conditions. J. Food Eng. 2019, 257, 19–25. [Google Scholar] [CrossRef]
  12. Alkhafaji, S.R.; Farid, M.M. PEF Assisted Thermal Sterilization (PEF-ATS) Process-Inactivation of Geobacillus sterothermophilus Spores. J. Food Sci. Eng. 2012, 2, 403. [Google Scholar]
  13. Chandrapala, J.; Oliver, C.; Kentish, S.; Ashokkumar, M. Ultrasonics in food processing. Ultrason. Sonochem. 2012, 19, 975–983. [Google Scholar] [CrossRef]
  14. Gayán, E.; Álvarez, I.; Condón, S. Inactivation of bacterial spores by UV-C light. Innov. Food Sci. Emerg. Technol. 2013, 19, 140–145. [Google Scholar] [CrossRef]
  15. Wilson, D.R.; Dabrowski, L.; Stringer, S.; Moezelaar, R.; Brocklehurst, T.F. High pressure in combination with elevated temperature as a method for the sterilisation of food. Trends Food Sci. Technol. 2008, 19, 289–299. [Google Scholar] [CrossRef]
  16. Laroussi, M.; Leipold, F. Evaluation of the roles of reactive species, heat, and UV radiation in the inactivation of bacterial cells by air plasmas at atmospheric pressure. Int. J. Mass Spectrom. 2004, 233, 81–86. [Google Scholar] [CrossRef]
  17. Patil, S.; Moiseev, T.; Misra, N.; Cullen, P.; Mosnier, J.; Keener, K.; Bourke, P. Influence of high voltage atmospheric cold plasma process parameters and role of relative humidity on inactivation of Bacillus atrophaeus spores inside a sealed package. J. Hosp. Infect. 2014, 88, 162–169. [Google Scholar] [CrossRef]
  18. Moreau, M.; Orange, N.; Feuilloley, M.G.J. Non-thermal plasma technologies: New tools for bio-decontamination. Biotechnol. Adv. 2008, 26, 610–617. [Google Scholar] [CrossRef]
  19. Schnabel, U.; Handorf, O.; Yarova, K.; Zessin, B.; Zechlin, S.; Sydow, D.; Zellmer, E.; Stachowiak, J.; Andrasch, M.; Below, H. Plasma-treated air and water—Assessment of synergistic antimicrobial effects for sanitation of food processing surfaces and environment. Foods 2019, 8, 55. [Google Scholar] [CrossRef]
  20. Xu, Y.; Tian, Y.; Ma, R.; Liu, Q.; Zhang, J. Effect of plasma activated water on the postharvest quality of button mushrooms, Agaricus bisporus. Food Chem. 2016, 197, 436–444. [Google Scholar] [CrossRef]
  21. Schnabel, U.; Andrasch, M.; Stachowiak, J.; Weit, C.; Weihe, T.; Schmidt, C.; Muranyi, P.; Schlüter, O.; Ehlbeck, J. Sanitation of fresh-cut endive lettuce by plasma processed tap water (PPtW)–Up-scaling to industrial level. Innov. Food Sci. Emerg. Technol. 2019, 53, 45–55. [Google Scholar] [CrossRef]
  22. Yawut, N.; Mekwilai, T.; Vichiansan, N.; Braspaiboon, S.; Leksakul, K.; Boonyawan, D. Cold plasma technology: Transforming food processing for safety and sustainability. J. Agric. Food Res. 2024, 18, 101383. [Google Scholar] [CrossRef]
  23. Handorf, O.; Below, H.; Schnabel, U.; Riedel, K.; Ehlbeck, J. Investigation of the chemical composition of plasma-treated water by MidiPLexc and its antimicrobial effect on L. monocytogenes and Pseudomonas fluorescens monospecies suspension cultures. J. Phys. D Appl. Phys. 2020, 53, 305204. [Google Scholar] [CrossRef]
  24. Flemming, H.-C.; Wingender, J.; Szewzyk, U.; Steinberg, P.; Rice, S.A.; Kjelleberg, S. Biofilms: An emergent form of bacterial life. Nat. Rev. Microbiol. 2016, 14, 563–575. [Google Scholar] [CrossRef] [PubMed]
  25. Galie, S.; García-Gutiérrez, C.; Miguélez, E.M.; Villar, C.J.; Lombó, F. Biofilms in the food industry: Health aspects and control methods. Front. Microbiol. 2018, 9, 898. [Google Scholar] [CrossRef]
  26. Zhao, A.; Sun, J.; Liu, Y. Understanding bacterial biofilms: From definition to treatment strategies. Front. Cell. Infect. Microbiol. 2023, 13, 1137947. [Google Scholar] [CrossRef] [PubMed]
  27. Bottone, E.J. Bacillus cereus, a volatile human pathogen. Clin. Microbiol. Rev. 2010, 23, 382–398. [Google Scholar] [CrossRef]
  28. Basta, M.; Annamaraju, P. Bacterial Spores; StatPearls Publishing: St. Petersburg, FL, USA, 2020. [Google Scholar]
  29. Novak, J.S.; Call, J.; Tomasula, P.; Luchansky, J.B. An Assessment of Pasteurization Treatment of Water, Media, and Milk with Respect to Bacillus Spores†. J. Food Prot. 2005, 68, 751–757. [Google Scholar] [CrossRef]
  30. Kamat, A.S.; Nerkar, D.P.; Nair, P.M. Bacillus cereus in some Indian foods, incidence and antibiotic, heat and radiation resistance. J. Food Saf. 1989, 10, 31–41. [Google Scholar] [CrossRef]
  31. Spanu, C.; Scarano, C.; Spanu, V.; Pala, C.; Casti, D.; Lamon, S.; Cossu, F.; Ibba, M.; Nieddu, G.; De Santis, E.P.L. Occurrence and behavior of Bacillus cereus in naturally contaminated ricotta salata cheese during refrigerated storage. Food Microbiol. 2016, 58, 135–138. [Google Scholar] [CrossRef]
  32. Cossart, P. Illuminating the landscape of host–pathogen interactions with the bacterium Listeria monocytogenes. Proc. Natl. Acad. Sci. USA 2011, 108, 19484–19491. [Google Scholar] [CrossRef]
  33. Bonsaglia, E.; Silva, N.; Júnior, A.F.; Júnior, J.A.; Tsunemi, M.; Rall, V. Production of biofilm by Listeria monocytogenes in different materials and temperatures. Food Control 2014, 35, 386–391. [Google Scholar] [CrossRef]
  34. European Food Safety Authority; European Centre for Disease Prevention and Control. The European Union One Health 2023 Zoonoses report. EFSA J. 2024, 22, e9106. [Google Scholar] [PubMed]
  35. Scallan, E.; Hoekstra, R.M.; Angulo, F.J.; Tauxe, R.V.; Widdowson, M.A.; Roy, S.L.; Jones, J.L.; Griffin, P.M. Foodborne illness acquired in the United States–major pathogens. Emerg. Infect. Dis. 2011, 17, 7–15. [Google Scholar] [CrossRef]
  36. McDowell, R.H.; Sands, E.M.; Friedman, H. Bacillus cereus. In StatPearls [Internet]; StatPearls Publishing: St. Petersburg, FL, USA, 2023. [Google Scholar]
  37. Ingwer Gemahlen, Marke GÜLCAN, 150 Gramm. Lebensmittelwarnung, 2025. Available online: https://www.lebensmittelwarnung.de/___lebensmittelwarnung.de/Meldungen/2025/05_Mai/20250506_03_NW_Ingwer/2025-05-06_03_NW_Ingwer_Meldung.html (accessed on 30 July 2025).
  38. Rückruf: Bacillus cereus—HEALTHY POWERFOOD ruft Sprossenprodukte Zurück. Produkt Warnung, 2025. Available online: https://www.produktwarnung.eu/2025/02/28/rueckruf-bacillus-cereus-healthy-powerfood-ruft-sprossenprodukte-zurueck/33675 (accessed on 30 July 2025).
  39. Whitworth, J. Oatly Recalls Drink Because of Bacillus cereus; 2 Sick with 27 Other Complaints Filed. Food Safety News. 2022. Available online: https://www.foodsafetynews.com/2022/04/oatly-recalls-drink-because-of-bacillus-cereus-2-sick-with-27-other-complaints-filed/ (accessed on 30 July 2025).
  40. Smithfield Packaged Meats Corp. Dba Margherita Meats Inc. Recalls Pepperoni Products Due to Possible Bacillus Cereus Contamination. Food Safety and Inspection Service U.S. Department of Agriculture. 2021. Available online: https://www.fsis.usda.gov/recalls-alerts/smithfield-packaged-meats-corp.-dba-margherita-meats-inc.-recalls-pepperoni-products (accessed on 30 July 2025).
  41. How Listeria Spreads. U.S. Centers for Disease Control and Prevention (CDC). 2024. Available online: https://www.cdc.gov/listeria/causes/index.html (accessed on 30 July 2025).
  42. Listeria. European Food Safety Authority (EFSA). 2025. Available online: https://www.efsa.europa.eu/en/topics/topic/listeria (accessed on 30 July 2025).
  43. “Enoki Mushroom”, 100 Gramm, Marke “Super Fruta”. Lebensmittelwarnung. 2025. Available online: https://www.lebensmittelwarnung.de/___lebensmittelwarnung.de/Meldungen/2025/07_Juli/250728_29_BY_Enoki_Pilze/250728_29_BY_Enoki_Pilze.html (accessed on 30 July 2025).
  44. Gourmet Schweizer Raclette Käse, 400 Gramm. Lebensmittelwarnung. 2025. Available online: https://www.lebensmittelwarnung.de/___lebensmittelwarnung.de/Meldungen/2025/05_Mai/250508_07_NW_Raclette/250508_07_NW_Raclette_Meldung.html (accessed on 30 July 2025).
  45. Kräuterfilets nach Matjesart in Öl, 500 Gramm und 1000 Gramm. Lebensmittelwarnung. 2025. Available online: https://www.lebensmittelwarnung.de/___lebensmittelwarnung.de/Meldungen/2025/07_Juli/250725_26_HB_Kraeutermatjes/250725_HB_Kraeutermatjes_Meldung.html (accessed on 30 July 2025).
  46. Abbey Specialty Foods Recalls Wicklow Gold Cheddar Nettle & Chive 5.2 oz and Wicklow Gold Cheddar Tomato & Herb 5.2 oz Because of Possible Health Risk. U.S. Food & Drug Administration. 2025. Available online: https://www.fda.gov/safety/recalls-market-withdrawals-safety-alerts/abbey-specialty-foods-recalls-wicklow-gold-cheddar-nettle-chive-52-oz-and-wicklow-gold-cheddar (accessed on 30 July 2025).
  47. Duda Farm Fresh Foods, Inc. Issues Advisory for 1587 Cases of 4 in/1.6 oz Bundle Marketside Celery Sticks Because of Possible Health Risk. U.S. Food & Drug Administration. 2025. Available online: https://www.fda.gov/safety/recalls-market-withdrawals-safety-alerts/duda-farm-fresh-foods-inc-issues-advisory-1587-cases-4-in16-oz-bundle-marketside-celery-sticks (accessed on 30 July 2025).
  48. Albertsons Companies Stores in Arkansas, Louisiana, Oklahoma and Texas Voluntarily Recalls Select Items Containing Tuna Salad from Reser’s Fine Foods Due to an Ingredient Recall Linked to Possible Listeria Monocytogenes Contamination. U.S. Food & Drug Administration. 2025. Available online: https://www.fda.gov/safety/recalls-market-withdrawals-safety-alerts/albertsons-companies-stores-arkansas-louisiana-oklahoma-and-texas-voluntarily-recalls-select-items (accessed on 30 July 2025).
  49. Bast, E. Mikrobiologische Methoden: Eine Einführung in Grundlegende Arbeitstechniken; Springer: Berlin/Heidelberg, Germany, 2014. [Google Scholar]
  50. O’Halloran, M.P.; Pravda, M.; Guilbault, G.G. Prussian Blue bulk modified screen-printed electrodes for H2O2 detection and for biosensors. Talanta 2001, 55, 605–611. [Google Scholar] [CrossRef] [PubMed]
  51. Schnabel, U.; Handorf, O.; Stachowiak, J.; Boehm, D.; Weit, C.; Weihe, T.; Schäfer, J.; Below, H.; Bourke, P.; Ehlbeck, J. Plasma-functionalized water: From bench to prototype for fresh-cut lettuce. Food Eng. Rev. 2021, 13, 115–135. [Google Scholar] [CrossRef]
  52. Armstrong, R.A. When to use the Bonferroni correction. Ophthalmic Physiol. Opt. 2014, 34, 502–508. [Google Scholar] [CrossRef]
  53. Thirumdas, R.; Kothakota, A.; Annapure, U.; Siliveru, K.; Blundell, R.; Gatt, R.; Valdramidis, V.P. Plasma activated water (PAW): Chemistry, physico-chemical properties, applications in food and agriculture. Trends Food Sci. Technol. 2018, 77, 21–31. [Google Scholar] [CrossRef]
  54. Wong, K.S.; Chew, N.S.; Low, M.; Tan, M.K. Plasma-activated water: Physicochemical properties, generation techniques, and applications. Processes 2023, 11, 2213. [Google Scholar] [CrossRef]
  55. Girard, P.-M.; Arbabian, A.; Fleury, M.; Bauville, G.; Puech, V.; Dutreix, M.; Sousa, J.S. Synergistic effect of H2O2 and NO2 in cell death induced by cold atmospheric He plasma. Sci. Rep. 2016, 6, 29098. [Google Scholar] [CrossRef]
  56. Lu, P.; Boehm, D.; Cullen, P.; Bourke, P. Controlled cytotoxicity of plasma treated water formulated by open-air hybrid mode discharge. Appl. Phys. Lett. 2017, 110, 264102. [Google Scholar] [CrossRef]
  57. Senesi, S.; Ghelardi, E. Production, secretion and biological activity of Bacillus cereus enterotoxins. Toxins 2010, 2, 1690–1703. [Google Scholar] [CrossRef] [PubMed]
  58. Magalhães, R.; Mena, C.; Ferreira, V.; Silva, J.; Almeida, G.; Gibbs, P.; Teixeira, P. Bacteria: Listeria monocytogenes. In History, Science and Methods; Elsevier: Amsterdam, The Netherlands, 2014; pp. 450–461. [Google Scholar]
  59. Hariram, U.; Labbé, R. Spore prevalence and toxigenicity of Bacillus cereus and Bacillus thuringiensis isolates from US retail spices. J. Food Prot. 2015, 78, 590–596. [Google Scholar] [CrossRef]
  60. McKenney, P.T.; Driks, A.; Eichenberger, P. The Bacillus subtilis endospore: Assembly and functions of the multilayered coat. Nat. Rev. Microbiol. 2013, 11, 33–44. [Google Scholar] [CrossRef] [PubMed]
  61. Rutala, W.A.; Weber, D.J. Infection control: The role of disinfection and sterilization. J. Hosp. Infect. 1999, 43, S43–S55. [Google Scholar] [CrossRef] [PubMed]
  62. Liu, J.; Yang, L.; Kjellerup, B.V.; Xu, Z. Viable but nonculturable (VBNC) state, an underestimated and controversial microbial survival strategy. Trends Microbiol. 2023, 31, 1013–1023. [Google Scholar] [CrossRef]
  63. Ayrapetyan, M.; Oliver, J.D. The viable but non-culturable state and its relevance in food safety. Curr. Opin. Food Sci. 2016, 8, 127–133. [Google Scholar] [CrossRef]
  64. Li, L.; Mendis, N.; Trigui, H.; Oliver, J.D.; Faucher, S.P. The importance of the viable but non-culturable state in human bacterial pathogens. Front. Microbiol. 2014, 5, 258. [Google Scholar] [CrossRef]
  65. Weihe, T.; Yao, Y.; Opitz, N.; Wagner, R.; Krall, J.; Schnabel, U.; Below, H.; Ehlbeck, J. Plasma-Treated Water: A Comparison with Analog Mixtures of Traceable Ingredients. Microorganisms 2023, 11, 932. [Google Scholar] [CrossRef]
  66. Pagán, E.; Pavli, F.; Happiette, S.; Berdejo, D.; Gatt, R.; Pagán, R.; Valdramidis, V.; García-Gonzalo, D. Isolation and characterization of resistant variants of Salmonella Typhimurium after sequential exposure to plasma activated water (PAW). Innov. Food Sci. Emerg. Technol. 2024, 93, 103633. [Google Scholar] [CrossRef]
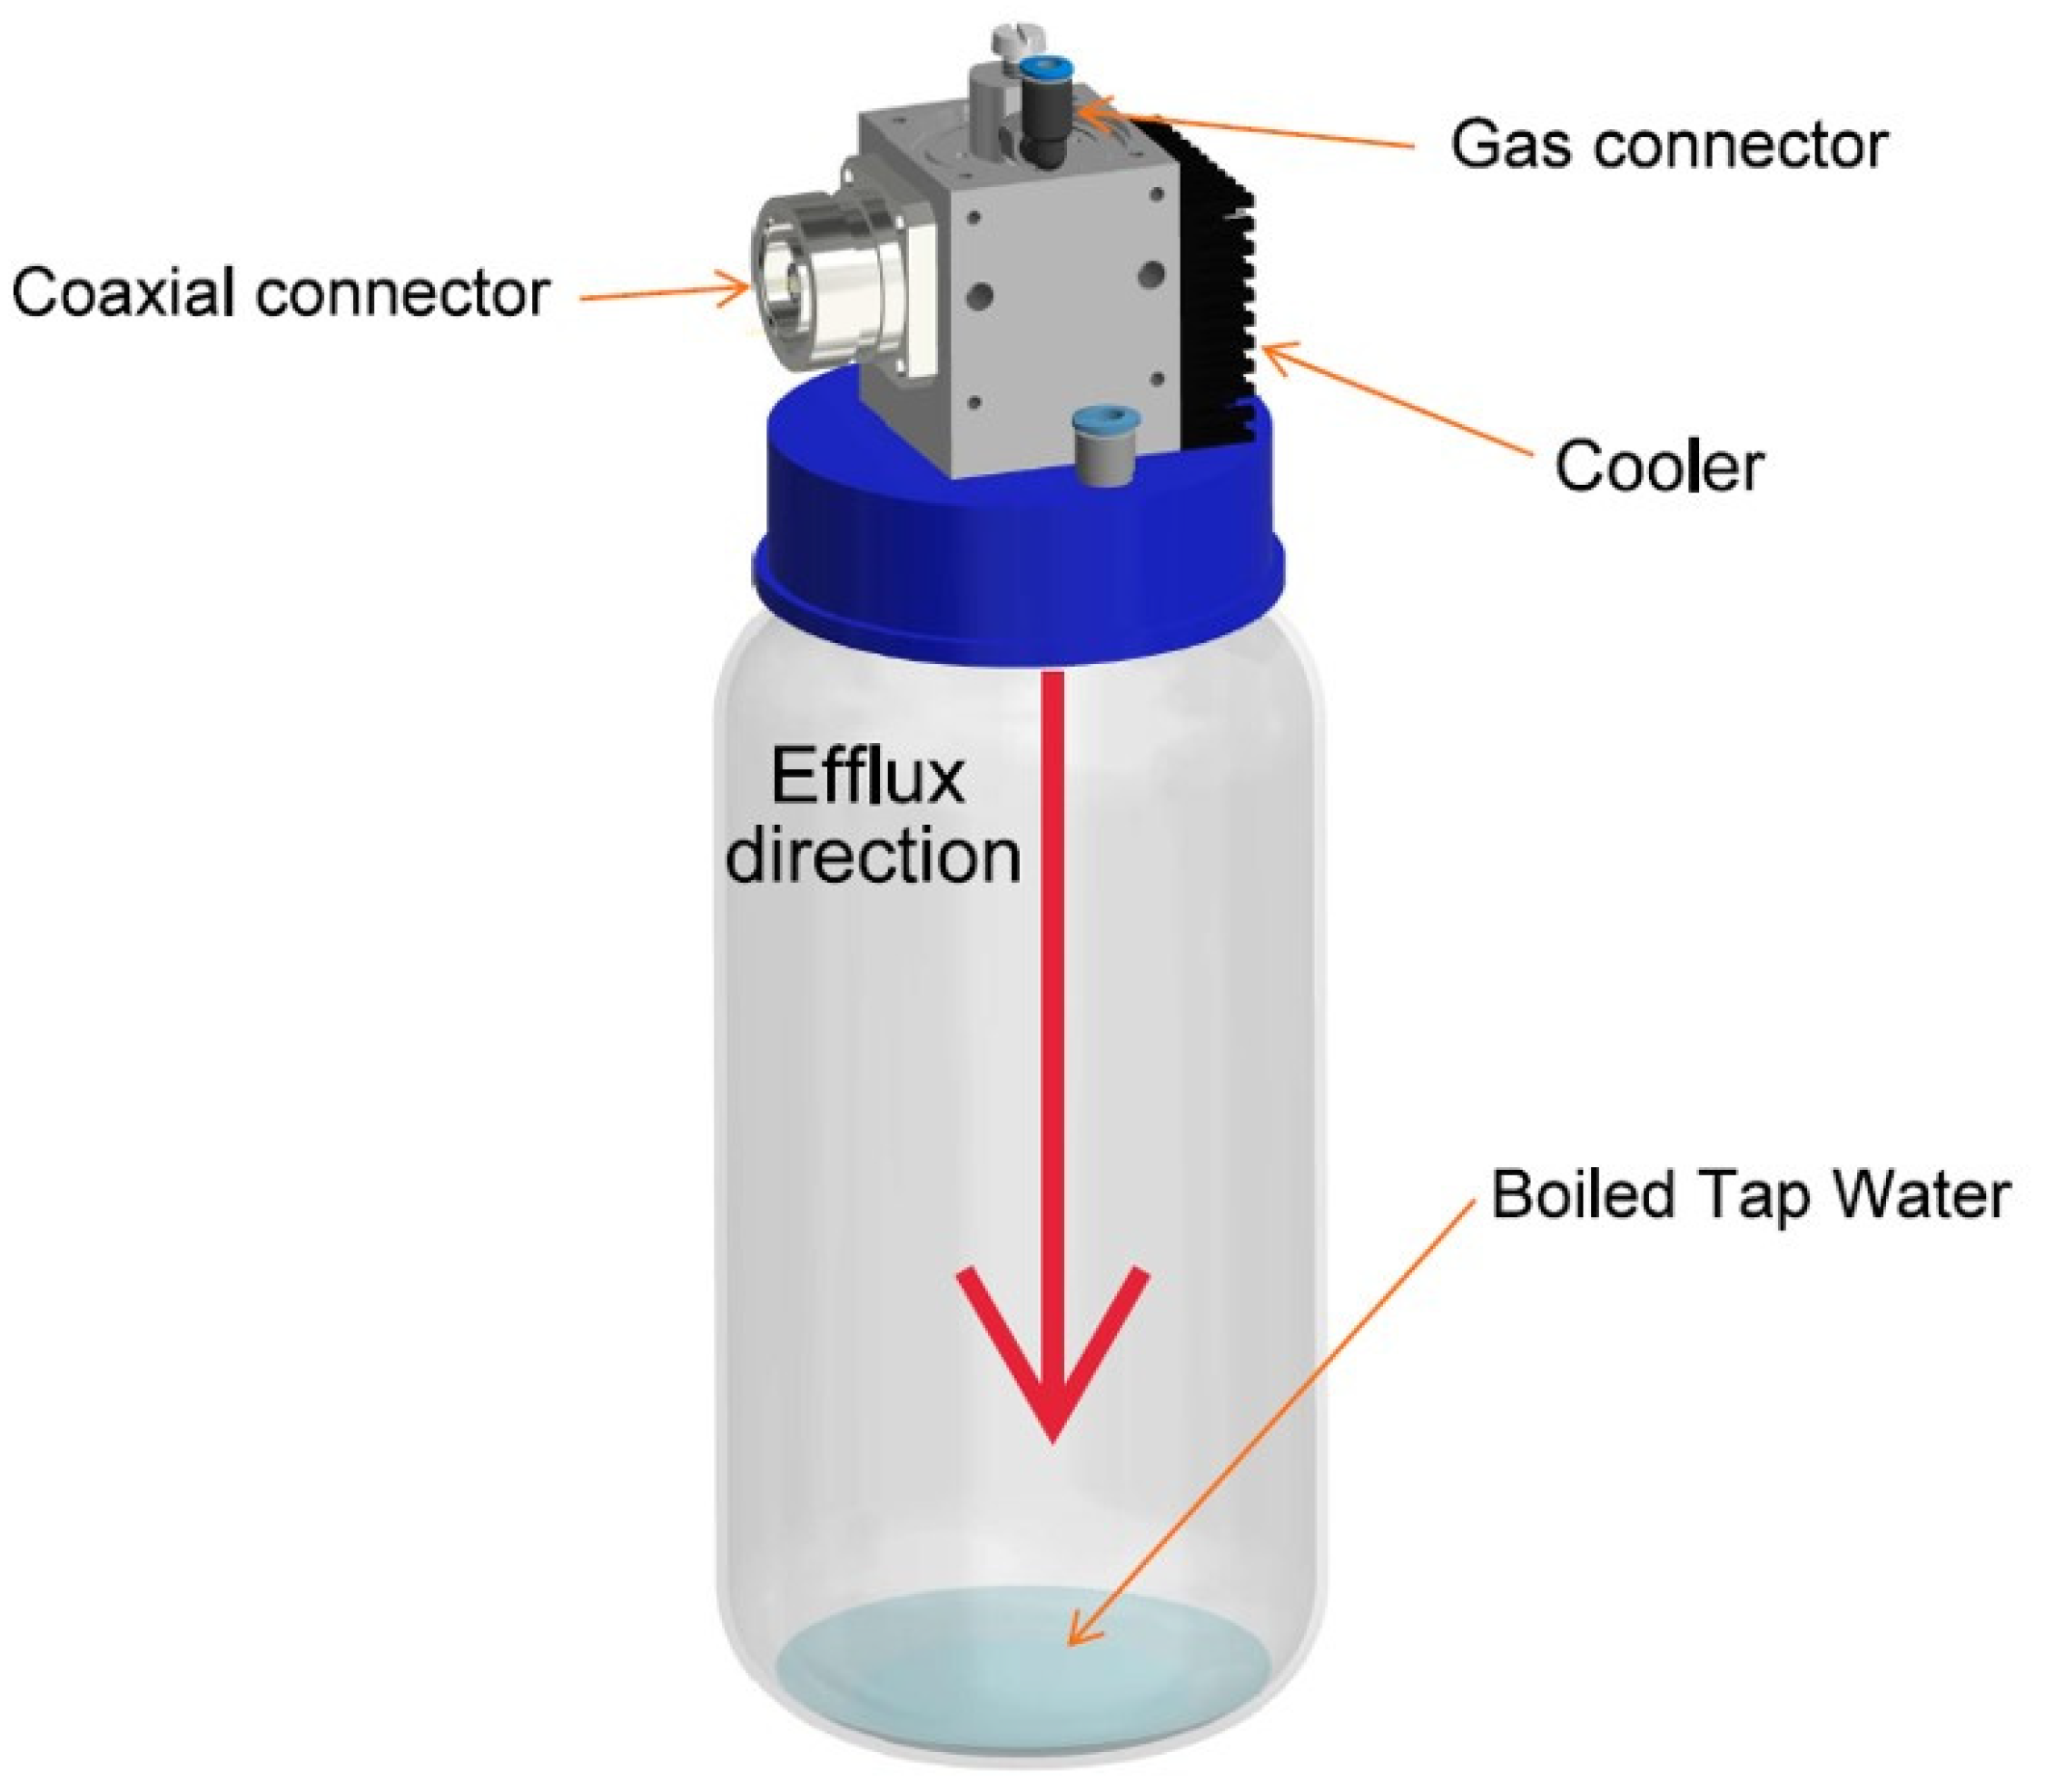
Figure 1. Plasma Source MidiPLexc set up for PTW generation. Plasma efflux is captured within the bottle and indirectly interacts with the water.
Applmicrobiol 05 00080 g001
Figure 3. Box plots of the L. monocytogenes proliferation assay for the untreated control, the tap water, and PTW applications for different waiting times after treatment: 1 min post-treatment (A), 5 min post-treatment (B), 10 min post-treatment (C), 30 min post-treatment (D).
Applmicrobiol 05 00080 g003
Figure 4. Results of LiveDead and XTT assays on B. cereus. Each boxplot presents LiveDead (red, left) and XTT (blue, right) results for each treatment type and are separated by post-treatment time: (A) 5 min, (B) 10 min, (C) 30 min. The data is presented as the percentage of control where 100% is the control value.
Applmicrobiol 05 00080 g004
Figure 5. Results of LiveDead and XTT assays on L. monocytogenes. Each boxplot presents LiveDead (red, left) and XTT (blue, right) results for each treatment type and are separated by post-treatment time: (A) 5 min, (B) 10 min, (C) 30 min. The data is presented as the percentage of control where 100% is the control value.
Applmicrobiol 05 00080 g005
Table 1. Physicochemical properties of PTW and the respective p-values with prior pre-treatment level. * ND = non-detectable.
Mean
p-Value (Wilcoxon Test, α = 0.05)
Pre-Treatment
Tap Water10 min PTW60 min PTW90 min PTW
pH 8.352.78
6.3 E−4
1.88
4.1 E−4
1.84
0.093
Conductivity
(µS/cm)
794.61829.7
8.2 E−5
10,317.2
4.1 E−5
11,335.8
0.077
ORP
(mV)
153570
4.0 E−5
638
4.1 E−5
650
4.1 E−5
Nitrite
(mg/L)
ND *53.0
7.7 E−4
89.6
4.9 E−3
112.4
1.0
Nitrate
(mg/L)
ND468.8
3.1 E−4
2040.6
4.1 E−5
2428.0
0.019
Hydrogen peroxide (mg/mL) ND196.3
3.1 E−4
540.3
4.1 E−5
749.9
7.8 E−3
Table 3. Results of the statistical testing for the proliferation assay pairings of L. monocytogenes; significant differences highlighted in bold.
ScenarioPairingResulting
p-Value
αadaptedTested Sample Size
1 min post-treatmentControl—tap water0.393940.0167n = 6
1 min post-treatmentControl—PTW 10 min0.041130.0167n = 6
1 min post-treatmentControl—PTW 60 min0.008660.0167n = 6
5 min post-treatmentControl—tap water0.876360.0125n = 21
5 min post-treatmentControl—PTW 10 min0.002040.0125n = 15
5 min post-treatmentControl—PTW 60 min7.60714∙10−70.0125n = 15
5 min post-treatmentControl—PTW 90 min7.39602∙10−70.0125n = 12
10 min post-treatmentControl—tap water0.481240.0125n = 21
10 min post-treatmentControl—PTW 10 min0.002390.0125n = 15
10 min post-treatmentControl—PTW 60 min1.28935∙10−80.0125n = 15
10 min post-treatmentControl—PTW 90 min7.39602∙10−70.0125n = 12
30 min post-treatmentControl—tap water0.705340.0125n = 15
30 min post-treatmentControl—PTW 10 min7.81571∙10−40.0125n = 9
30 min post-treatmentControl—PTW 60 min4.11353∙10−50.0125n = 9
30 min post-treatmentControl—PTW 90 min7.39602∙10−70.0125n = 12
Table 4. Results of the statistical testing on the differences in log reduction of L. monocytogenes and B. cereus for each tested agent (PTW with different treatment times and tap water). Significant differences are highlighted in bold.
ScenarioTested AgentResulting p-ValueαadaptedTested Sample Size
1 min post-treatmentTap water0.033440.0167n = 6
1 min post-treatmentPTW 10 min0.004920.0167n = 6
1 min post-treatmentPTW 60 min0.005000.0167n = 6
5 min post-treatmentTap water0.330690.0125n = 21
5 min post-treatmentPTW 10 min0.000520.0125n = 15
5 min post-treatmentPTW 60 min0.544370.0125n = 12
5 min post-treatmentPTW 90 min0.051700.0125n = 9
10 min post-treatmentTap water0.483750.0125n = 21
10 min post-treatmentPTW 10 min0.001830.0125n = 15
10 min post-treatmentPTW 60 min0.016550.0125n = 12
10 min post-treatmentPTW 90 min0.000400.0125n = 9
30 min post-treatmentTap water0.210160.0125n = 15
30 min post-treatmentPTW 10 min0.000920.0125n = 9
30 min post-treatmentPTW 60 min0.101990.0125n = 9
30 min post-treatmentPTW 90 min0.000370.0125n = 12
Disclaimer/Publisher’s Note: The statements, opinions and data contained in all publications are solely those of the individual author(s) and contributor(s) and not of MDPI and/or the editor(s). MDPI and/or the editor(s) disclaim responsibility for any injury to people or property resulting from any ideas, methods, instructions or products referred to in the content.